Article

Energy Recovery Potential from Effluents in the Process Industry: System Dynamics Modeling and Techno-Economic Assessments

by
Tofunmi D. Adepoju
1,
Abiodun S. Momodu
2,*,
Ibikunle O. Ogundari
1 and
Joshua Akarakiri
1
1
African Institute for Science Policy and Innovations, Obafemi Awolowo University, Ile-Ife 220005, Nigeria
2
Centre for Energy Research and Development, Obafemi Awolowo University, Ile-Ife 220005, Nigeria
*
Author to whom correspondence should be addressed.
Fuels 2022, 3(4), 627-641; https://doi.org/10.3390/fuels3040038
Submission received: 6 June 2022 / Revised: 14 July 2022 / Accepted: 25 October 2022 / Published: 4 November 2022
(This article belongs to the Special Issue Biofuel Value Chains: Innovations and Sustainability)

Abstract

:
This study quantifies the effluents generated during processing in three industry types, estimates the energy potential from the quantified effluents in the form of biogas generation, and determines the economic viability of the biogas recovered. Data were procured from the relevant scientific publications to quantify the effluents generated from the production processes in the industry types examined, using industrial process calculations. The effluent data generated are used in the 2-module biogas energy recovery model to estimate the bioenergy recovery potential within it. Economic and financial analysis is based on a cash-flow comparison of all costs and benefits resulting from its activities. The effluents generated an average daily biogas of 2559 Nm3/gVS, having a daily potential combined heat and power of 0.52 GWh and 0.11 GWh, respectively. The life cycle analysis and cost-benefit analysis show the quantity of emissions avoided when using the effluents to generate heat and power for processes, along with the profitability of the approach. Conclusively, the study shows that the use of biomass effluents to generate biogas for Combined Heat and Power (CHP) is a viable one, based on the technologies of a reciprocating engine, gas turbine, microturbine, and fuel cell. However, it is recommended that the theoretical estimation be validated using a field-scale project.

1. Introduction

The single biggest challenge facing humanity, based on the 26th Conference of Parties (COP26) held in 2015, which was the meeting that culminated in the Paris Agreement, and the recent COP31, the Glasgow Climate Conference held in 2021 that built upon the gains of COP26, is how to limit the extent of global warming. The goal of these efforts was principally to limit global warming to well below 2 degrees Celsius, preferably to 1.5 degrees Celsius, compared to pre-industrial levels. According to [1], industrial effluents, to which the food and beverage industry (FBi) contribute a large part, account for around 50% of the overall waste that is generated globally. Activities in the F&Bi connect to three of the Sustainable Development Goals (SDG), namely, 7, 12, and 13, on clean and affordable energy, responsible consumption and production, and climate action. The process industry, which includes the FBi, is usually accompanied by the generation of a large volume of effluents. Effluents are linked to methane generation, an influential greenhouse gas. Through improper handling, effluents could contribute to increased atmospheric temperature. Harnessing these effluents through conversion to biogas could be a means of producing clean and affordable energy, may encourage responsible consumption and production, and could serve as a climate action in the industry, showing the relevance of this paper. The study combines system dynamics (SD) modeling principles, life cycle assessment (LCA), and techno-economic analysis to examine the feasibility of converting effluents into an energy source for combined heat and power use. Thus, the specific study objectives are the quantification of the effluents generated during the process in these three industry types, an estimation of the energy potential from the quantified effluents in the form of biogas generation, and the economic viability of the biogas that has been recovered.
Biogas is a good substitute for fossil fuels and can be used for heat and electricity production in engines, microturbines [2], steam turbines [3], gas turbines [2], and fuel cells [4]. Biogas used in this way is capable of creating further emission reductions that could result in carbon-negative systems. Biogas from organic waste is also capable of providing environmental protection, investment, and job creation in developing economies [2]. Figure 1 shows a diagram of material flow in the biogas production process and its uses [5]. This diagram explains the anaerobic digestion of wastes such as livestock, crops, wastewater, and food, which generate biogas and digestate. Biogas can be used as a source of heat and electricity, while digestate could be used as a fertilizer, soil amendments, and livestock bedding. Biogas could also serve as biomethane for fuel and gas grids [5].

1.1. Process Industry: Economic Importance and Effluent Generation in Food and Beverage Production

Our working definition of a process industry is an industry that is involved in the processing of bulk resources, such as in the food and beverage industries, into other products. Examples include turning cassava into cassava flakes for consumption, grains and barley into beer, and refining sugarcane into sugar. Globally, one of the secondary industries that are critical to every economy is the food and beverage industry [6]. The food and beverage industry involves all manufacturing exercises concerning the processing of raw food materials, packaging, and distribution, ranging from fresh, prepared foods to packaged foods and both alcoholic and nonalcoholic beverages [7]. The industry has two major segments, namely, production and distribution [8]. The production segment concerns the processing of such items as meat, cheese, and the creation of soft drinks, alcoholic beverages, packaged food, and other modified foodstuffs, including food directly obtained from farming and other forms of agriculture. The distribution segment deals with transporting finished food products to the consumer [7]. According to [9], the industries in the food manufacturing subsector transform livestock and agricultural products into products for consumption, and this includes animal food manufacturing, grain and oilseed milling, sugar and confectionery products, fruit and vegetable preserving, specialty food manufacturing, dairy product manufacturing, animal slaughtering and processing, seafood product preparation and packaging, bakeries and tortilla manufacturing, and other food manufacturing. The beverage industry includes soft drinks and ice manufacturing, along with alcoholic beverages. The food and beverage industry contributes significantly to the economy [10]; for instance, in the United Kingdom, the food and beverage industry contributed more than GBP 28 billion to the economy, and exports more than GBP 20 billion of food and drinks to the rest of the world as of 2017 [9]. Similarly, in the United States, the food and beverage industry accounts for at least 5% of the total gross domestic product and contributes to at least 10% of the employment rate and more than 10% of consumers’ disposable incomes [9].
Being an extremely productive sector, the food and beverage industry generally also produces large amounts of effluents in its processes [11]. For the most part, in this industry, effluents or wastewater come from procedures requiring water, with the expectation that solid and gaseous waste residues are carried along with this water [12]. The effluent produced varies quantitatively and qualitatively according to the intrinsic characteristics of the process, the industrial facilities, and the operational practices of each production plant. These effluents pose a threat to the environment; hence, there is a need to minimize the environmental impacts [13]. Such environmental impacts come from the processing of fruit and vegetables, meat, poultry, seafood, beverages and fermentation, and dairy. These impacts include the production of wastewater and solid wastes, blood by-products, and waste streams, which are extremely high in biochemical oxygen demand (BOD), generating a very high disease-prone environment spread by the pathogenic organisms carried and transmitted by livestock, poultry, and seafood. Other impacts include process wastewaters, carcasses, and skeleton waste; rejected or unsatisfactory animals; fats, oils, and greases (FOG); animal feces; blood; eviscerated organs, and wastewater that is high in suspended solids, organic sugars, and starches. This wastewater may also contain residual pesticides and solid wastes from the process, such as organic materials from mechanical preparation processes, i.e., rinds, seeds, and skins from raw materials. The beverage and fermentation subsector impacts the environment through solid waste and wastewater, with solid wastes resulting from spent grains and materials used in the fermentation process, and its wastewater resulting from fermentation processes generating a higher BOD and overall wastewater volume compared to other food-processing sectors [11]. The concept of food industry effluents and their treatment is viewed based on a quantitative and qualitative characterization of the effluent, which is the main key to the treatment of effluents and the development of a logical and functional sequence of processes and operations that offers the main tool for mitigating the environmental impact [12]. In another study, several eco-efficiency indicators are proposed in order to quantify industrial effluents in the food and beverage industries as a key step to the treatment of effluents and suggested an elementary index used in the sugar industry, which is specific water consumption per ton of sugarcane [14].
The brewery, sugar, and cassava waste streams are chosen for this study because they are classed as high-strength organic wastes, due to their high biological oxygen demand/chemical oxygen demand content, thus rendering them a suitable feedstock for anaerobic digestion [11].
The technologies that could be implemented for the use of effluents include an anaerobic filter (AF), also called a packed bed, an anaerobic baffled reactor (ABR), the anaerobic contact process (ACP), the up-flow anaerobic filter process (UAF), an anaerobic fluidized-bed (AFB) reactor, an up-flow anaerobic sludge blanket (UASB), or an expanded granular sludge bed (EGSB) reactor [15]. A study on the management of effluents in the food and beverage industry in the southwestern region of Nigeria indicates that 50% of its effluents are discharged into water bodies and septic tanks without treatment [16]. In particular, the brewery industry first disposes of its wastewater by pumping it into a settling tank, after which the supernatant is treated separately; prior to the construction of the settling tank, a disposal unit was in use but had to be abandoned owing to odor problems [17]. The concept of clean technology and water recycling was considered for effluent management, and the beneficial use of sludge from the beverage industry in Pakistan was suggested as a low-cost wastewater treatment [18]. For the treatment concept, Chmiel et al. [19] examined integrated microfiltration and oil skimming for the treatment of spent process water for product recovery and water use. Importantly, food and beverage industry effluents are biodegradable wastewaters that contribute as much as 6% of all anthropogenic methane emissions [19], suggesting the use of high-rate anaerobic digesters to treat such wastewaters efficiently, as well as enabling the capture of methane for use as a relatively clean energy source. In Nigeria, the authors Kayode, Luethi, and Rene [17] report that there is a gap in the treatment of effluents from the food and beverage industry for energy recovery purposes, compared to some developing and developed countries.

1.2. Techno-Economic Assessment of Energy Recovery Potential from Effluents

Any energy recovery project is first and foremost an engineering project; therefore, it is suitable for evaluation using techno-economic assessment tools [20], such as the engineering economics approach. The engineering economics approach was applied to a techno-economic assessment in evaluating the design and engineering alternatives for energy recovery potential from the effluents generated from the process industry of the food and beverage industry. The techno-economic assessment examined the appropriateness of the project, estimated its value, and justified it from an engineering standpoint. The approach allowed for evaluating costs and expenses by assigning financial value to environmental as well as social benefits or costs. The parameters in engineering economics used for project evaluation include the payback period, net present value and internal rate of return, cost-benefit analysis, life cycle assessment, local economic impact, cost-effectiveness analysis [21], and comparative costs [22]. Among the mentioned economic analysis tools, cost-benefit analysis is the most widely used technique due to its use in facilitating the aggregation of social, environmental, and economic benefits and costs [23]. The continual use of this analysis as a decision-making tool for environmental projects has led to the development of approaches for effective evaluation of the economic performance of wastewater treatment plants, which include quantification of the avoided environmental damages in monetary terms [23]. This methodology is particularly applicable to energy recovery systems as they contribute to environmental and social benefits [24].
Numerous techno-economic assessment studies on bioenergy from different sources of effluents were examined for this study. For instance, Svanström et al. [25] conducted a techno-economic assessment of the feasibility of commercial waste biorefineries for the cassava starch industries. The study considered different commercial viability scenarios and concluded that the integration of succinic acid production (6.9 Mg/h) in a biorefinery co-producing bioethanol and CHP represents a potentially viable cassava waste biorefinery with economic and environmental benefits. In their study, Padi and Chimphango [26] evaluated long-term saving capability by conducting a techno-economic assessment of CHP installation for a case study of a wastewater treatment plant. The wastewater plant generates over 2 million cubic meters of biogas per year and utilizes over 36,000 GJ of natural gas per year. Riley et al. [27] suggested that farm animal and meat processing industry effluent was a potential sustainable energy source because the effluents generated by this industry are critical sources for biogas production via anaerobic digestion. The study revealed that farm animal waste and meat processing industry effluent represent advantageous sustainable and low-cost energy sources that can be efficiently utilized for the production of bioenergy and electricity and to lower greenhouse gas emissions into the environment. Mofijur et al. [28] concluded that the conventional treatment of winery waste is expensive, suggesting the valorization of winery waste using the concept of biorefinery; that is, the conversion of waste to produce biofuels, heat, and energy.

2. Concept, Materials, and Methodology

The concept of this study is predicated on the principle that effluents from the processes in the FBi are capable of generating biogas for energy recovery [29] if handled properly. This is offered with the intent to contribute to the reduction of the carbon footprint from production processes for environmental sustainability and to constitute non-solid waste that is safe for environmental discharge. Thus, the utilization of waste becomes a valuable commodity and platform chemical “mine”, representing an important step in the development and deployment of alternative sources of energy production [29]. In addition, the premise of developing the model (stock and flow diagram), a life cycle assessment (LCA), and a techno-economic assessment is to generate a framework for designing combined heat and power plants for use by the food and beverage industries.
The processes are described using two causal loop diagrams for biogas production and energy recovery potential for CHP use. Figure 2 presents the causal loop diagram (CLD) for the biogas production process, showing our understanding of the anaerobic digestion process that effluents undergo for biogas production. The figure contains 28 information links showing interconnections in a typical anaerobic digestion system. The first 8 links to the effluents are the factors that affect it in regard to biogas production under anaerobic conditions. The effluent links to the hydrolysis stage, where the effluent is broken into four different components (water, simple sugars, amino acids, and fatty acids) as shown by the information links in the diagram. This leads to the second stage (acidogenesis) where acidogenic bacteria act on the product of the hydrolysis stage and convert them to carbon dioxide, ammonia, and H2S, as shown via the information links in the diagram. These links connect to the acetogenesis stage, wherein carbon dioxide, ammonia, and H2S are acted upon by the acetogenic bacteria to produce acetic acid, which leads to the methanogenesis stage. In the methanogenesis stage, methanogens metabolize the acetic acids into methane, CO2, H2S, and other trace gases, which are the last three information links [30].
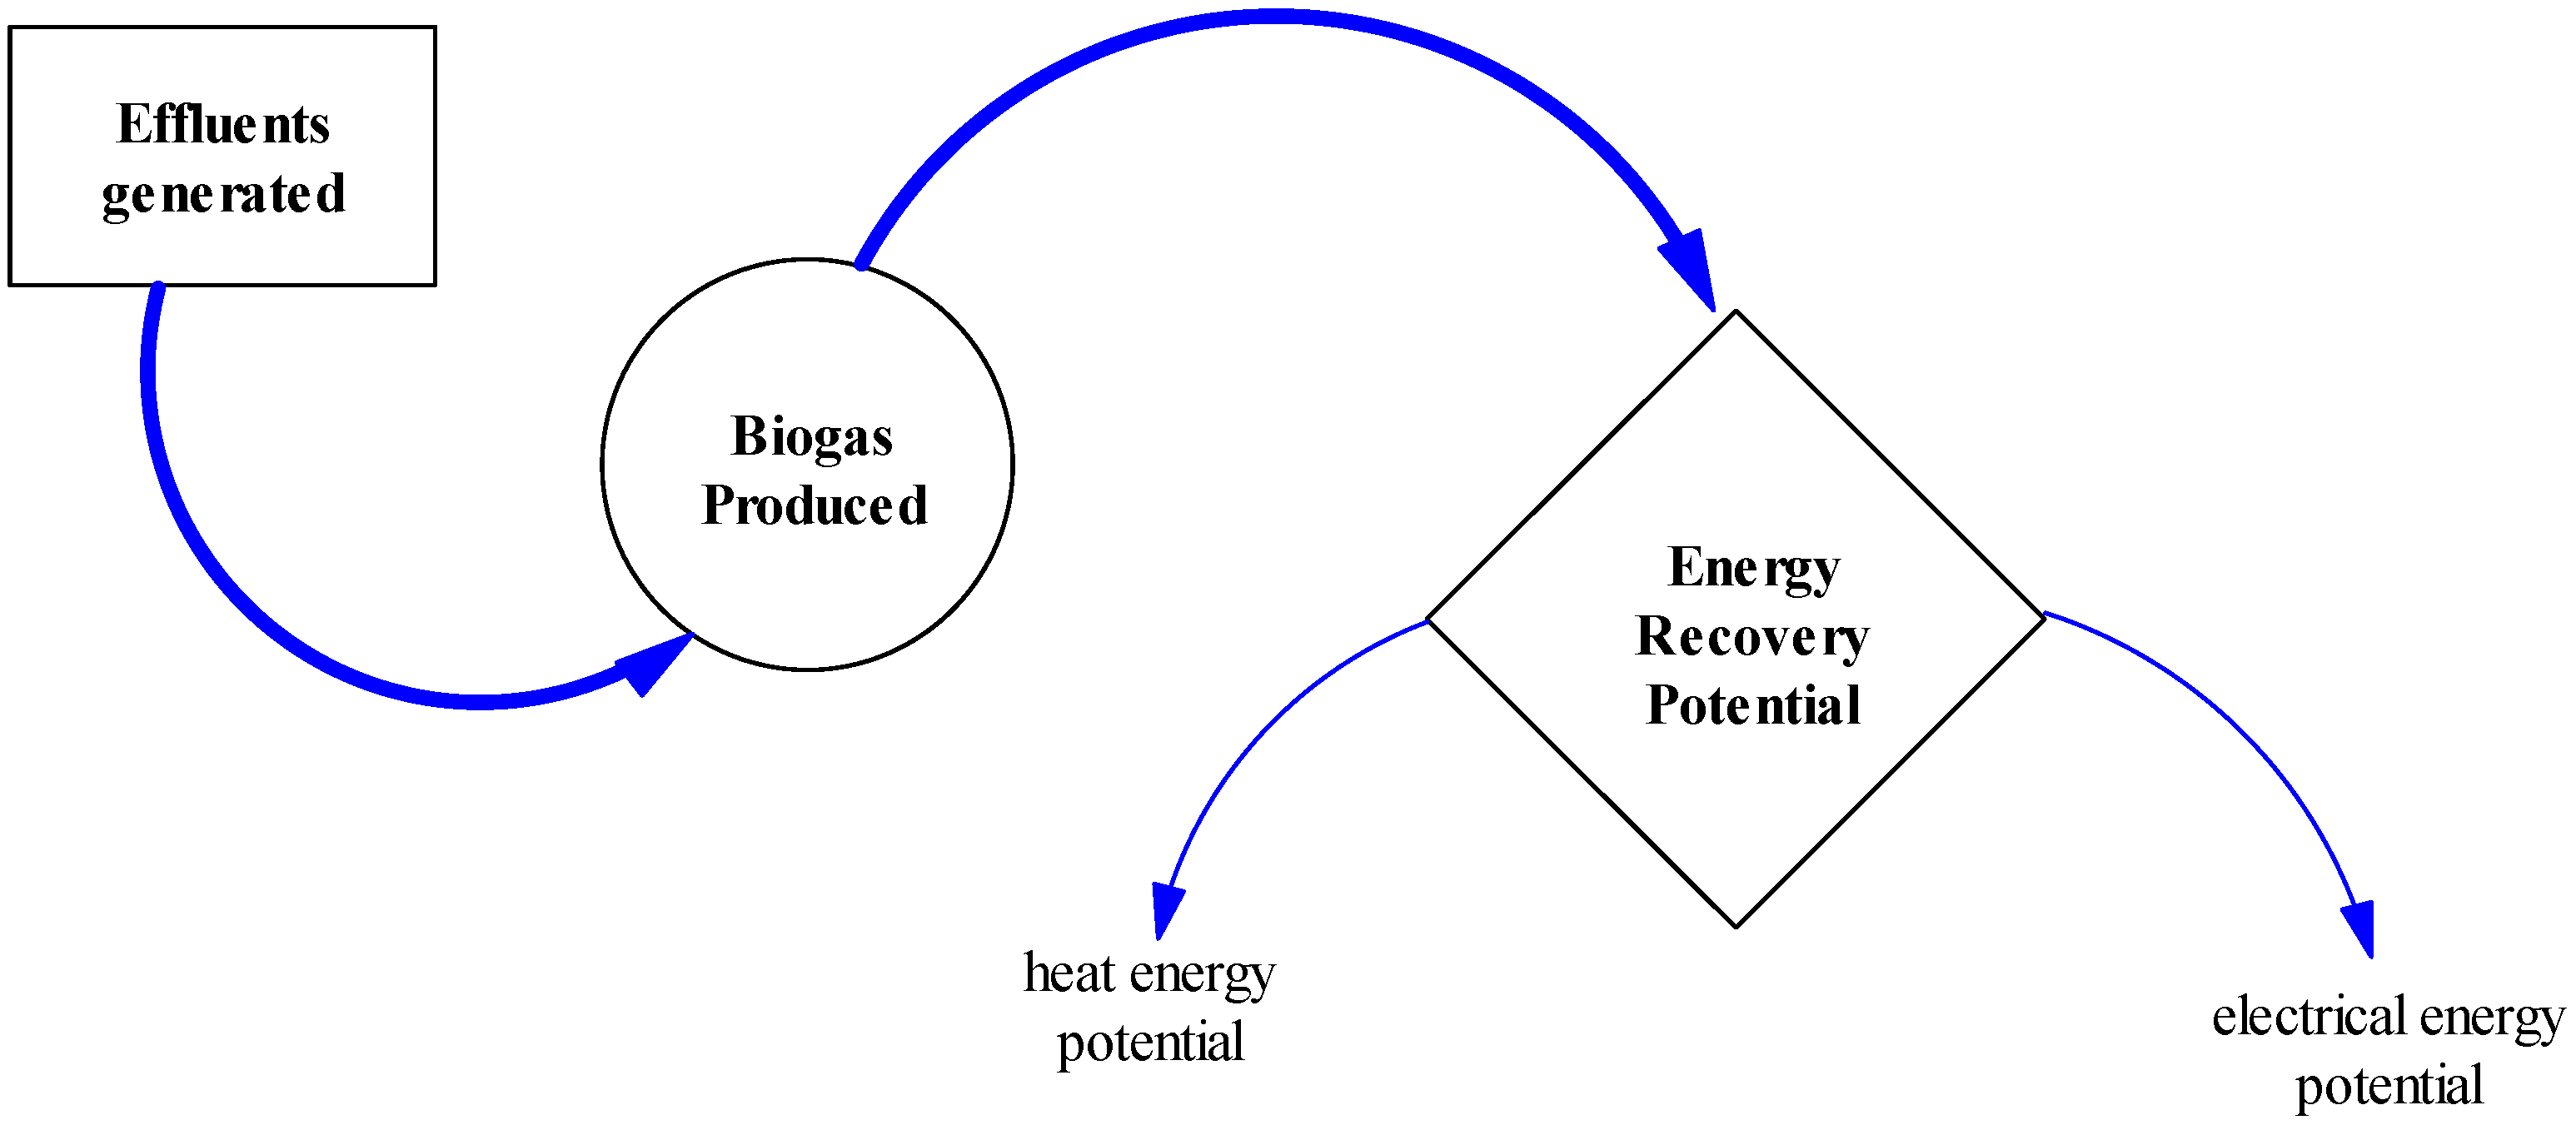
Figure 3 is the adapted CLD [30] for energy recovery potential from the biogas produced from the effluents generated in the processes of the three F&Bi types.
The specific materials of interest are cassava, used in making cassava flakes or garri, millet/sorghum adjuvants used in breweries that serve as malted grain in place of barley for beer production, and sugar cane that is refined into sugar (see [11]).
The stock and flow diagram (SFD) in system dynamics explains the structure and behavior of the adapted model, depicted in Figure 4. This stock and flow (or level and rate) diagram (SFD) represents the structure of the 2-module biogas energy recovery model for CHP purposes. The model is adapted from [31] and is then coupled to the energy recovery potential of the biogas production module (details of the model documentation are given in the Supplementary Materials). SFD is the most common first step in building a simulation model, showing more detailed information for the system than the causal loop diagram [32]. SFD defines the variables that are important in the structure of the model [32]. The SFD also describes the way that the material flows in the system, while the model behavior is given using equations that govern the direction in which the material can flow when the model is simulated [33].
Data on these materials were procured from the relevant scientific publications, as well as such reports as those from the Food and Agricultural Organization (FAO) on the cassava industrial revolution [34,35], grain (millet and sorghum) usage in the production of beer in Nigeria [36], and the National Sugar Master Plan of the Nigeria Sugar Development Council [37]. These data formed the bedrock of quantifying the effluents generated from the production processes of cassava flakes, beer-making, and sugar refining using industrial process calculations based on the mass balance equation, as shown in Equation (1). The effluents were estimated based on the figures estimated from the quantity of effluents generated in the small-scale production of cassava flakes and the sugar and beer industries in the southwestern part of Nigeria. Next, the effluent data thus generated was fed into the 2-module model-biogas energy recovery model (see Figure 4) to estimate the bioenergy recovery potential within it. The behavior of SD models is driven by equations. Therefore, Equation (2) shows the formula for simulating the kinetics of the biogas produced from effluents generated by the production processes in the food and beverage industry.
M N   i n ± M N   g e n e r a t i o n = M N   o u t ± M N   c o n s u m p t i o n ± M N   a c c u m u l a t i o n
M indicates mass and MN denotes the Nth component of the system.
G t = A { 1 exp [   ( m 1 ) ( t t 0 ) ( 1 m ) ]
In Equation (2) [37]:
Gt is the accumulative biogas yield at digestion time t;
A is the biogas yield potential of substrates;
m is an intermediate constant;
t0 is the time when the biogas rate reaches a maximum.
Equation (2), the basic equation in the model, was complemented with Equations (3)–(5), respectively, to estimate the electric power, electric energy generation potential, and heat energy generation potential from the biogas produced:
P = L H V × η × Q × C C H 4   31,536 .
In Equation (3) [38]:
P is the electric power;
LHV is the lower heating value of methane (MJ/m3);
H is the efficiency of the energy conversion technology (%);
Q is the biogas yield (m3/day);
CCH4 is the concentration of methane in biogas (%);
The factor for unit adjustment is 31,536.
E = P × Δ t × f c   10 6
In Equation (4) [38]:
E is the electric energy generation potential (GWh/day);
Δt are the annual hours of operation (hours/day);
fc is the capacity factor of the plant.
E t h = L C V × η × Q × f c 10 6
In Equation (5) [38]:
Eth is the thermal energy generation potential (GWh/day);
Q is the biogas yield (m3/day);
LCV is the lower calorific value of biogas (MJ/m3);
H is the thermal efficiency of energy conversion technology (%);
fc is the capacity factor.
The capacity is calculated based on the average power generation potential of the total bioenergy recovered. The final step involves a techno-economic analysis of the processes, namely, avoided emissions given by Equations (6) and (7):
E a v , e l = E × E f  
In Equation (6) [38]:
Eav,el represents the emissions avoided using recovered bioenergy for electricity generation per year (tCO2eq/yr);
E is the annual electricity generation from bioenergy (GWh/yr);
Ef is the CO2 emission factor of the grid electricity matrix in Nigeria (tCO2/GWh).
E a v , t h = E t h × E F f f
In Equation (7) [38]:
Eav,th represents the emissions avoided from the use of bioenergy for thermal energy (tCO2/yr);
Eth is the annual thermal energy generation potential (GWh/yr);
EFff is the emission factor of the specific fossil fuel per unit of energy (tCO2/GWh).
Estimating the cost of energy from the energy recovery potential project, using biogas from the effluents in the process industry, involves the total present value of cash outflow, divided by the total energy generated in a fixed period. This is represented in Equation (8) [39]:
L e v e l i z e d   c o s t   o f   e l e c t r i c i t y   ( L C O E ) = T o t a l   c o s t   o v e r   a   p e r i o d T o t a l   e n e r g y   o v e r   t h e   s a m e   p e r i o d .
The economic and financial analysis of the project is based on the comparison of the cash flow of all costs and benefits resulting from the project’s activities [40]. There are five common methods of comparing alternative investments: (1) discounted cash flow/net present value, (2) rate of return, (3) profitability index/cost-benefit analysis, (4) return on investment, and (5) payback period. Each of these is dependent on a selected interest rate or a discount rate to adjust cash flows at different points in time. The explanation of these four methods is given below, as deployed for project selection [41].
  • In the discounted cash flow or net present value (NPV) method, the method determines the net present value of all cash flows by discounting them by the required rate of return (also known as the hurdle rate, cutoff rate, and similar terms), as follows:
    N P V = t = 0 n R t ( 1 + i ) t
    In Equation (9a) [42]:
    NPV is the net present value;
    Rt is the net cash inflow–outflows during a single period, t;
    i is the discount rate or return that could be earned in alternative investments;
    t is the number of time periods.
  • The internal rate of return (IRR) is a metric used in financial analysis to estimate the profitability of potential investments. IRR is a discount rate that makes the net present value (NPV) of all cash flows equal to zero in a discounted cash flow analysis. It should be noted that IRR calculations rely on the same formula as NPV, where the annual return makes the NPV equal to zero. Generally speaking, the higher an IRR, the more desirable an investment is to undertake. Being uniform for varying project types, IRR can be used to rank multiple prospective investments or projects on a relatively even basis. In general, when comparing investment options with other similar characteristics, the investment with the highest IRR would probably be considered the best.
    0 = N P V = t = 0 T C t ( 1 + I R R ) t
    In Equation (9b) [42]:
    C is cash flow at time t;
    IRR is the discount rate/internal rate of return, expressed as a decimal;
    T is the time period.
    To include the impact of inflation (or deflation) m where pt is the predicted rate of inflation during period n, we have Equation (9c) [42]:
    N P V = n = 0 N C t ( 1 + r + p t ) n
  • Profitability index, also known as the benefit-cost ratio, this index is the net present value of all future expected cash flows divided by the initial cash investment. (Some firms do not discount the cash flows in making this calculation.) If this ratio is greater than 1.0, the project may be accepted for Equation (10) [41]:
    N e t   P r e s e n t   V a l u e + I n i t i a l   c a s h   i n v e s t m e n t I n i t i a l   c a s h   i n v e s t m e n t
  • Return on investment (ROI) is a performance measure used to evaluate the efficiency or profitability of an investment or compare the efficiency of a number of different investments. ROI tries to directly measure the amount of return on a particular investment, relative to the investment’s cost. To calculate ROI, the benefit (or return) of an investment is divided by the cost of the investment. The result is expressed as a percentage or a ratio in Equation (11) [42]:
    R e t u r n   o n   i n v e s t m e n t = N e t   P r e s e n t   V a l u e C u m m u l a t i v e   C a s h   o u t f l o w .
  • The payback period for a project is the initial fixed investment in the project divided by the estimated annual net cash inflows from the project. The ratio of these quantities is the number of years required for the project to repay its initial fixed investment. This method assumes that the cash inflows will persist for at least long enough to pay back the investment, and it ignores any cash inflows beyond the payback period. The method also serves as an (inadequate) proxy for risk. The faster the investment is recovered, the less the risk to which the firm is exposed, as in Equation (12):
    I n i t i a l   f i x e d   i n v e s t m e n t E s t i m a t e d   a n n u a l   n e t   c a s h   i n f l o w s + S a l v a g e   v a l u e .

3. Findings and Analysis

The result of the industrial process calculations, as shown in Table 1, indicate that the effluents generated are highest from the processing of cassava into cassava flakes, in terms of nominal value. This is quite understandable considering the volume of cassava processed in this region annually. The second-highest effluents that have been generated come from beer production and the processing of malted grains using millet/sorghum characteristics, with sugar being a very distant third. However, considering the input-output ratio, beer production from unmalted grain and barley generated the highest effluents at 74%, compared to cassava flakes at 24% and the sugar processing effluents at about 4%. This is because more than 90% of the input for beer production is water, while an efficient brewery will typically use between 4 and 6 L of water to produce 1 L of beer [43].
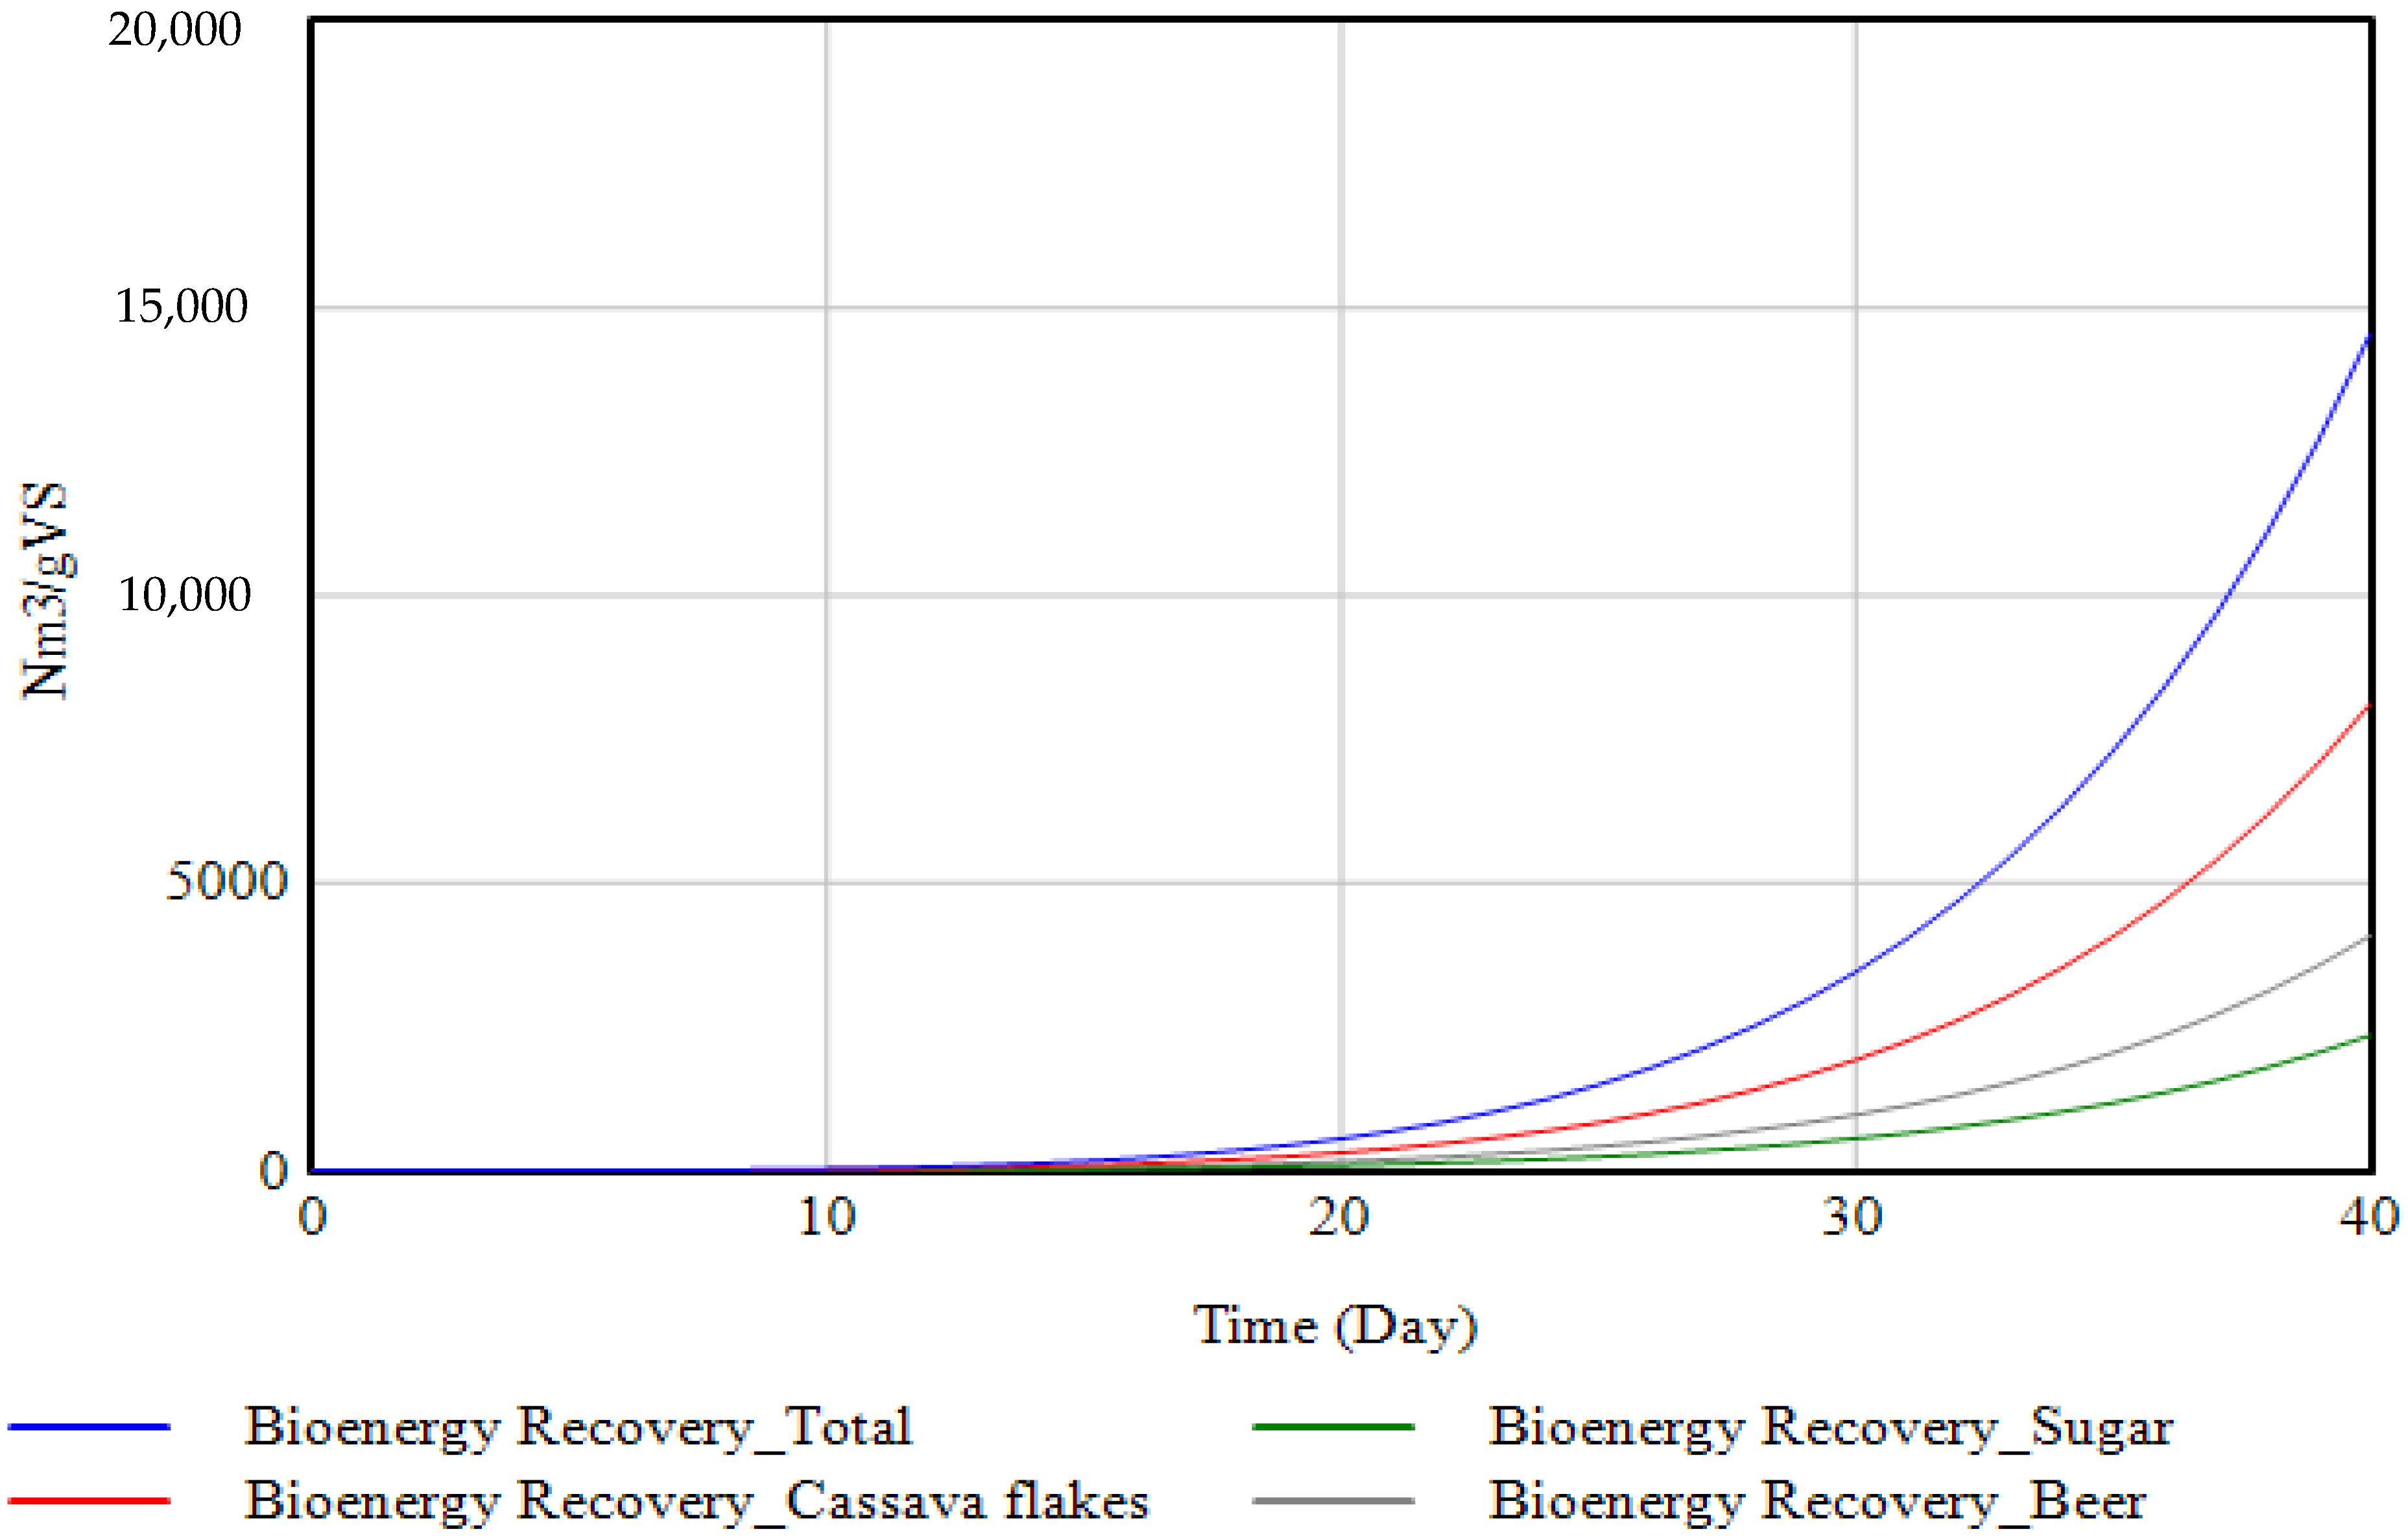
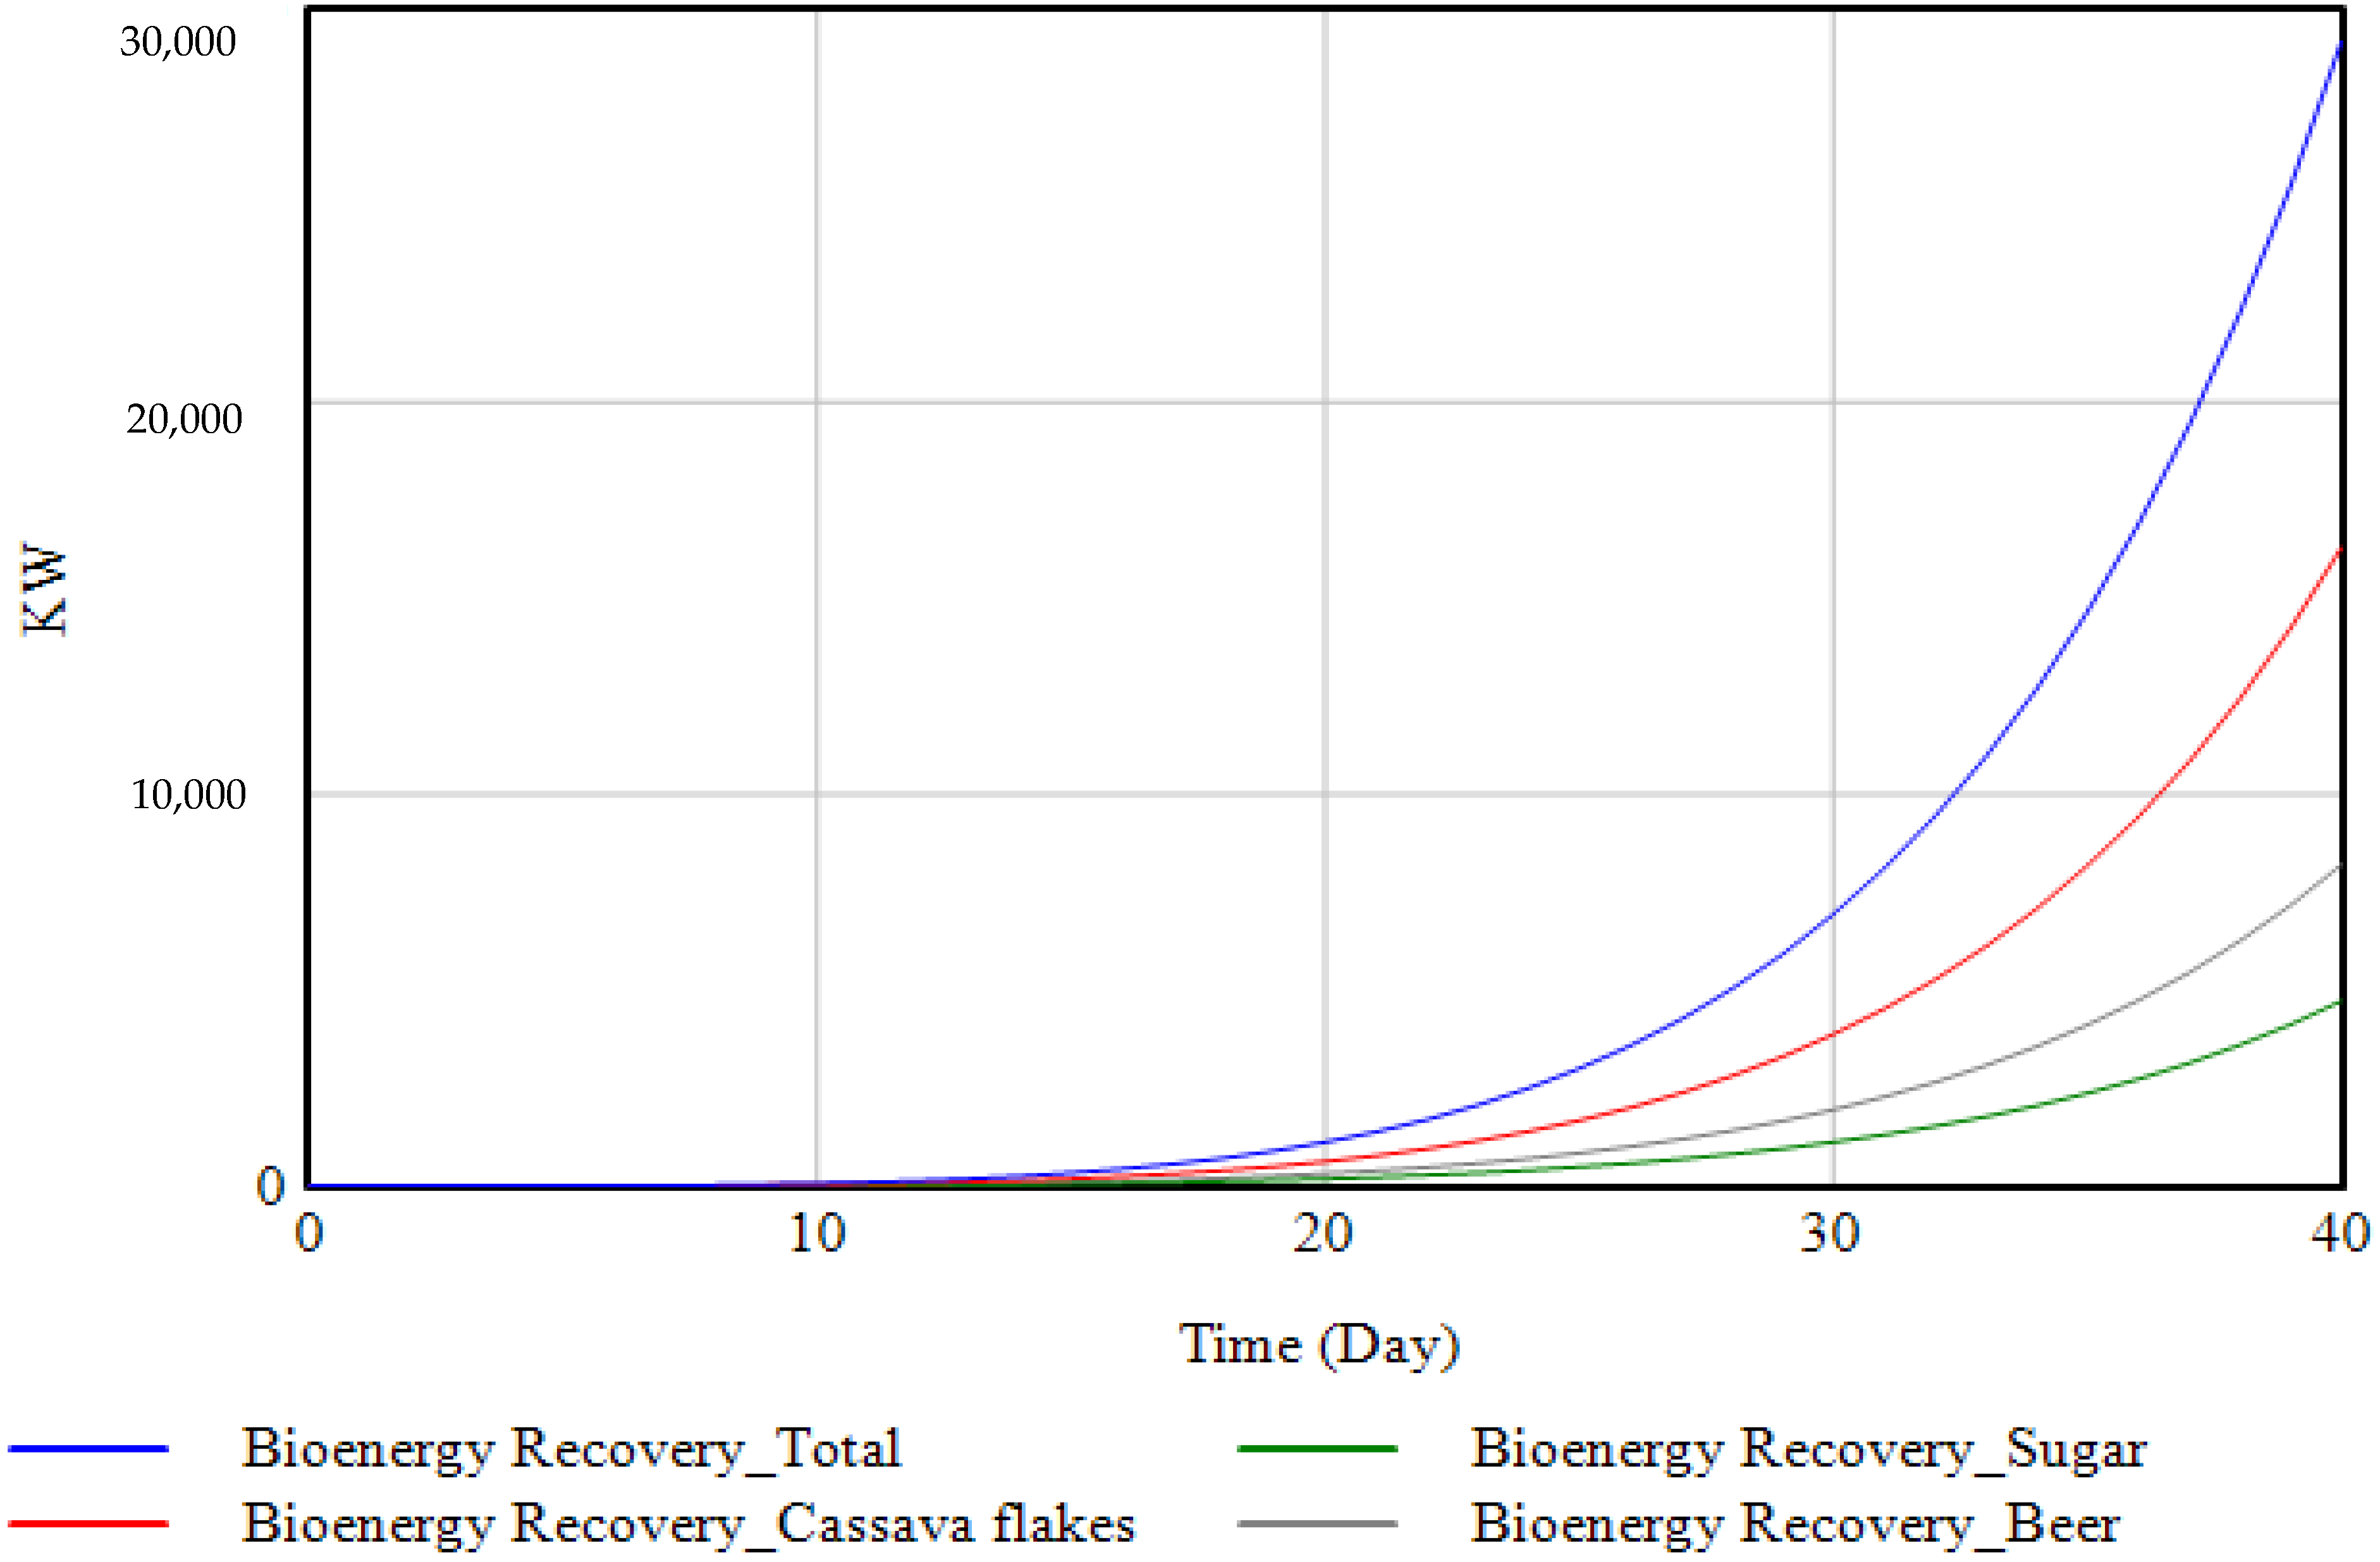
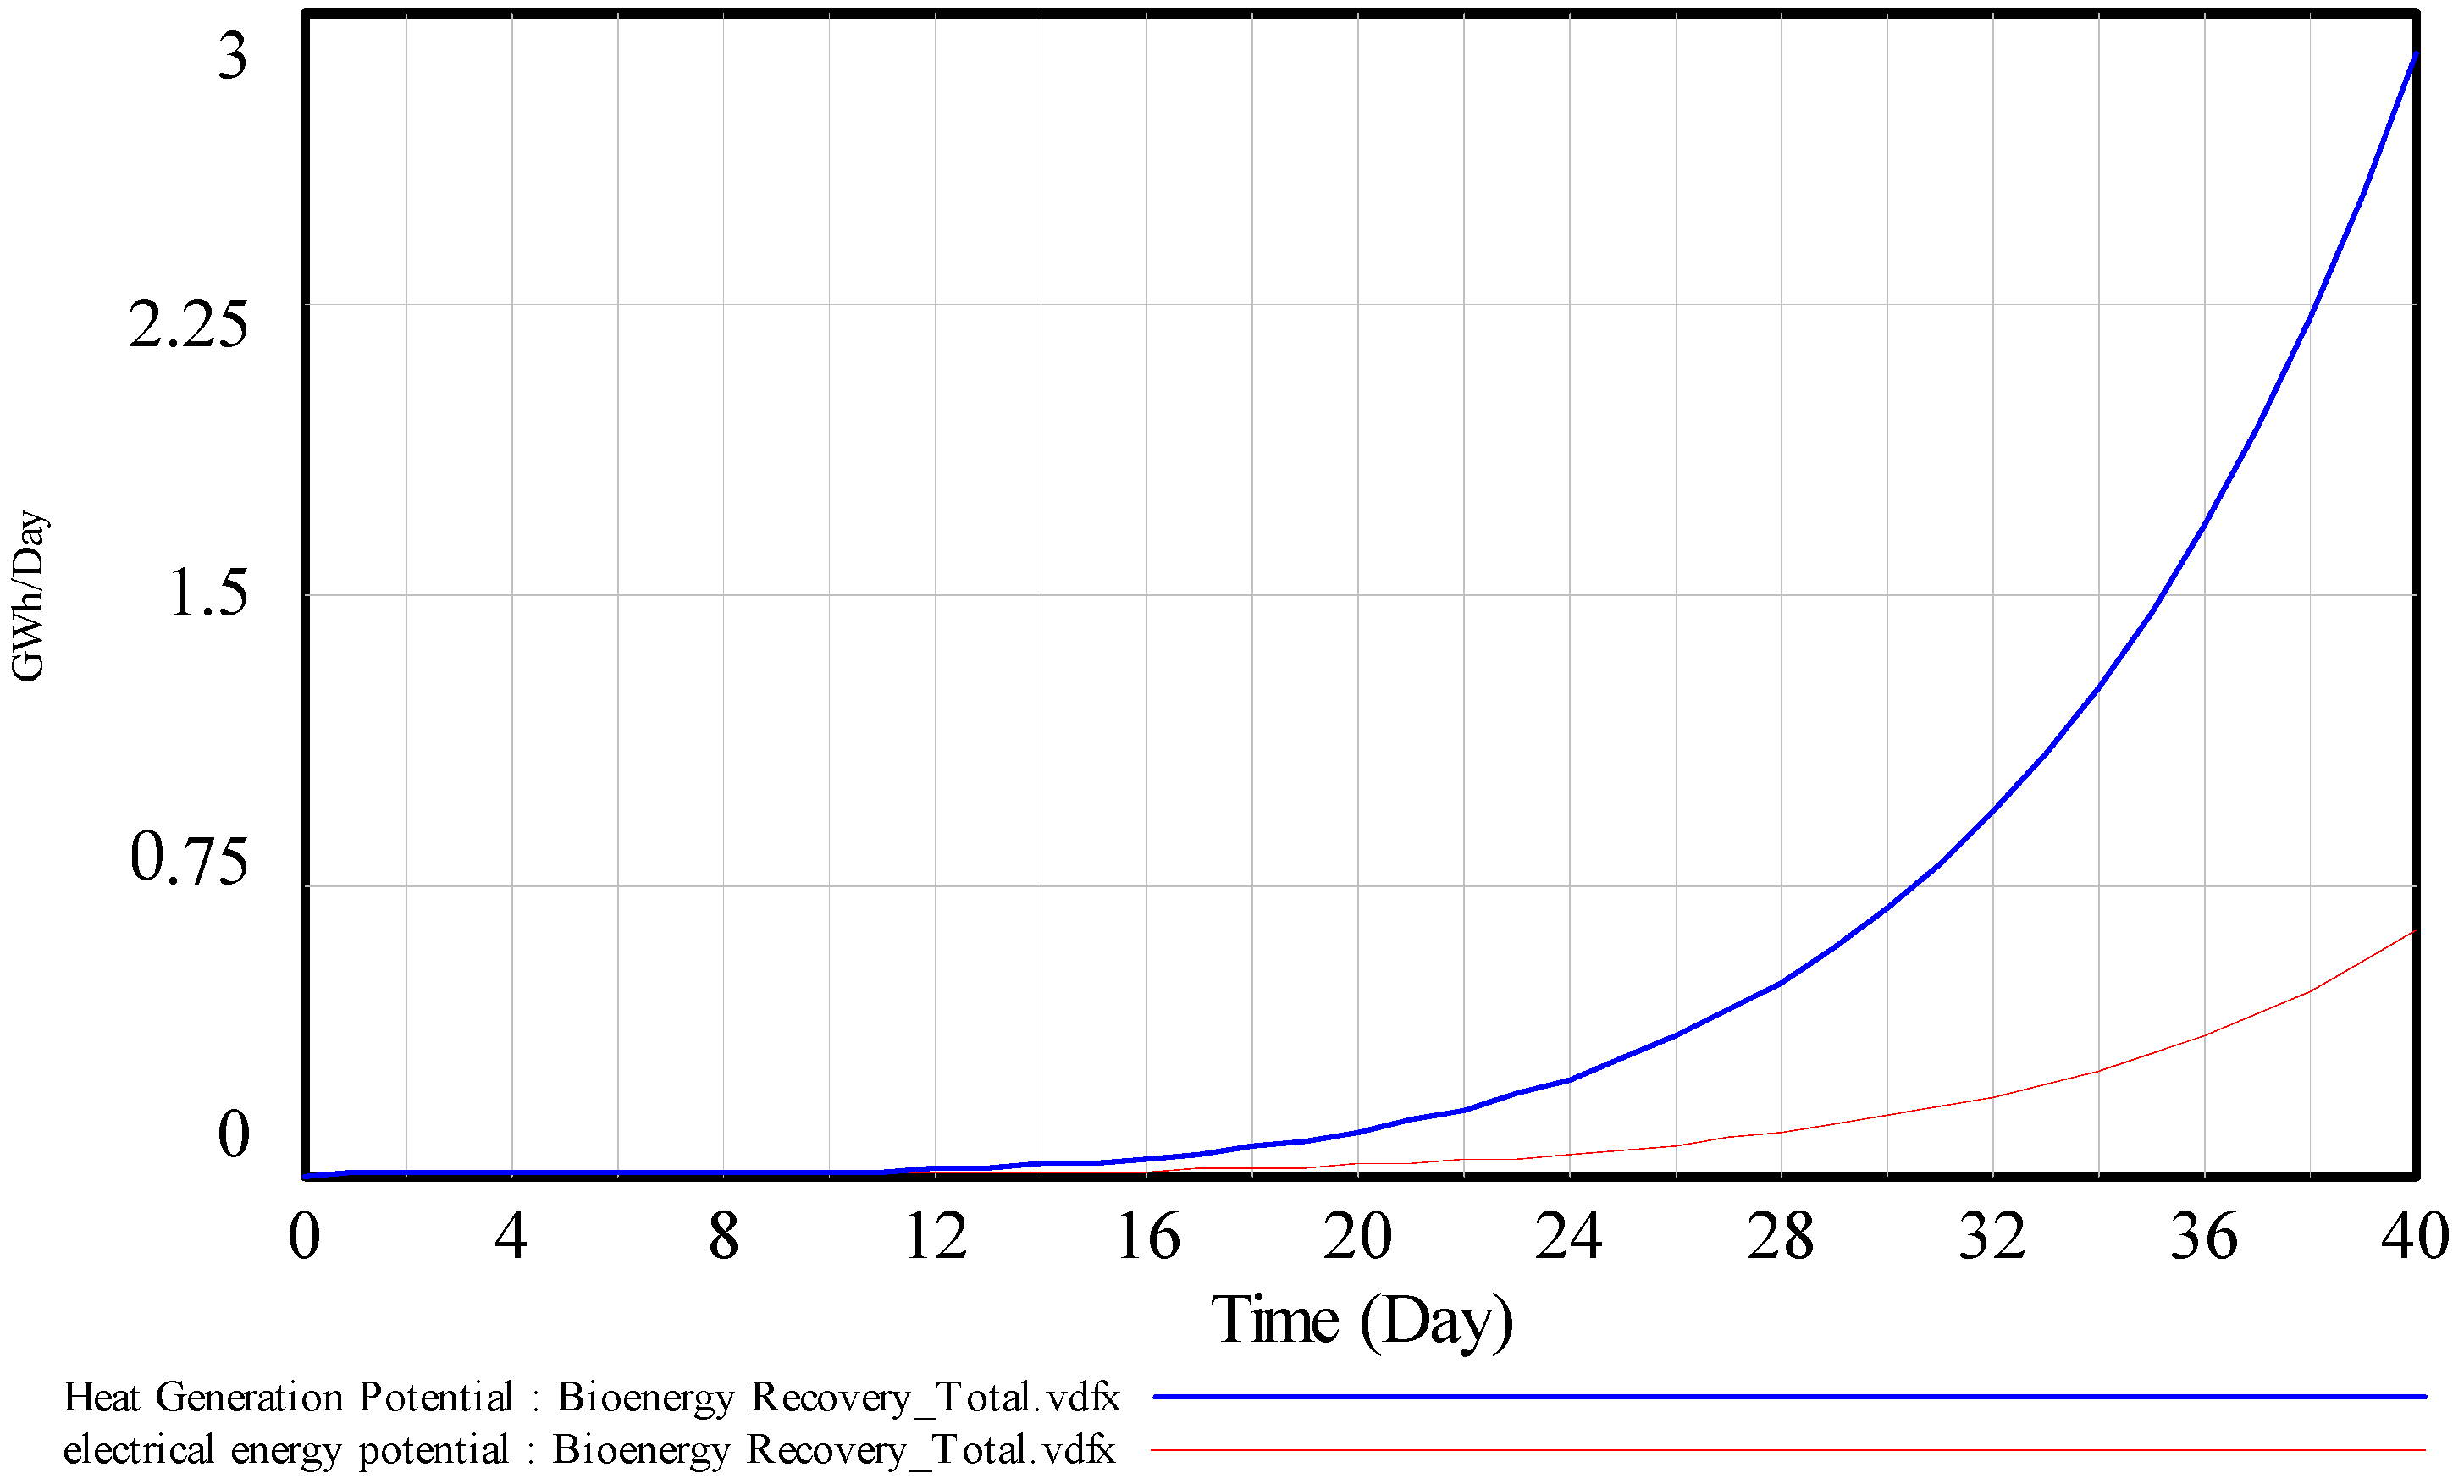
Model simulation results from the system dynamics biogas energy recovery model for CHP (Figure 4) show that the average daily biogas generated from the effluents would be 2558 Nm3/gVS (Figure 5 and Figure 6). The potential combined heat and power this could produce is 0.52 GWh/day and 0.11 GWh/day, respectively as shown in Figure 7. Theoretically, these results show that the effluents from the processing of cassava, sorghum/millet, and sugar refinement of these industries could produce enough methane to adequately support their CHP needs. In terms of viability, the techno-economic analysis using LCA and cost-benefit analysis (profit and rate of returns), respectively, show the quantity of avoided emissions from using the effluents to generate heat and power for processes and also the profitability of the approach.
Table 2 shows the total avoided emissions from the average daily electricity generated from the effluents. The table shows the average daily heat and electricity generation potential of each source of effluent and the equivalent avoided emissions yearly. The highest heat and electricity generation potential comes from the processing of cassava, with the least potential from that of sugar. The first step in the LCA is to estimate the energy recovery potential to handle the average daily methane generated from the effluents. The next is to estimate the power capacity of the generator for the potential energy recovered. This is then followed by the calculation of the avoided emissions or fossil fuel displaced when generating electricity and heat from the effluents.
Usually, in the early life of any engineering project, including the energy recovery project considered, the net cash flow is negative because the major outflow was the initial investment in the project (see [44,45]). For instance, in the three types of turbines and fuel cells (FC) considered as alternatives, for RE, the net cash flow was negative for the first two years and was then three years for gas turbine (GT) and 5 years for micro-turbine (MT). However, the three alternatives became ultimately successful projects since the cash flows became positive in the third, fourth, and sixth years, respectively, making the project acceptable, with the sum of the net present values of all estimated cash flows over the life of the project being positive for each of the types considered. However, the cash flow for a fuel cell technology was different, being negative throughout the ten-year cycle. It can be observed that with a fuel cell capacity of about 40% of the generation capacity of the other technologies (i.e., 2.0 MW), the cash flow situation changed significantly, whereas it was negative until the sixth year and became positive in the seventh year.
Table 3 shows the project specifications based on the turbine selected, while Table 4 shows the economic and financial analysis of the project. The electrical and thermal efficiencies of energy conversion are assumed to be 33% and 45%, respectively [46,47,48,49]. The electricity and heat are assumed to be generated simultaneously in a CHP engine [50,51]. Table 3 shows that the power capacity for each of the technology types examined is the same for three of the turbine types and different for fuel cells, while the energy cost varies. The first step in estimating these indicators was to calculate the levelized cost of electricity (LCE). Four different generation technologies, namely, the reciprocating engine (RE), microturbine (MT), gas turbine (GT), and fuel cell were considered as project types. Shown in Table 4 are five methods by which the alternative investments are compared, namely, net present value (NPV), internal rate of return (IRR), profitability index/benefit-cost analysis, return on investment (ROI), and payback period (PP). The power-generating capacity for each of the three turbines is 5.2 MW, as determined by the gas flow generated from the effluents and that of the fuel cell, which was set at 2.3 MW, i.e., approximately 40% of the gas flow capacity. The levelized cost of energy (LCE) in USD/kWh for the turbines is 0.06, 0.07, 0.08, and 0.09 for RE, GT, MT, and FC, respectively, with the highest being fuel cells, followed by microturbines, and is lowest for the reciprocating engines. All prices are, however, higher than those currently being charged for residential tariffs by electricity distribution companies in southwestern Nigeria. This implies that the project is financially viable. The net present value (NPV) of the profit for the turbines is USD 7.9 million, USD 6.79 million, USD 3.59 million, and USD 2.42 million for RE, GT, MT, and FC, respectively. This implies that any of the technology that is considered is capable of generating a net return of profit from the investment. In terms of return on investment, RE fared best at 46%, with GT second-best at 41%, MT at 16%, and FC at 10%. The IRR also followed the same trend, at 45%, 36%, 34%, and 32%, respectively. The payback period is 6.09, 6.63, 8.09, and 7.69 years for RE, GT, MT, and FC, respectively.

Limitations of the Study

The scope of the study is theoretical; therefore, it has inherent limitations, making it important to go through an empirical or evidence-based process to validate its findings. However, a number of other studies by Di Fraia et al., Wong and Law-Flood, and Martin and Dahl, as well as Novakovic [44,45,46,47] demonstrate that translating theory to field practice could be achieved. For our study, the empirical approach will involve a detailed analysis of how process industry wastes, particularly those from cassava processing, could be collected from various sources in southwest Nigeria. Cassava processing was the most decentralized processing industry that was examined for this study. Data paucity is also an issue, this being a theoretical approach that was not also subjected to site selection processes for the gathering of effluents from the various process industries examined.

4. Conclusions and Recommendations

In considering the input-output ratio, beer production from unmalted grain and barley shows the highest effluent generation at 74%, compared to cassava flakes at 24% and sugar processing effluents at about 4%. The LCE of four different generation technologies, namely, the reciprocating engine (RE), microturbine (MT), gas turbine (GT), and fuel cells were considered as project types. Five methods by which the alternative investments can be compared were examined. Four generating technologies were also considered, based on the gas flow generated from the effluents. The LCE in USD/kWh for the turbines is 0.06, 0.07, 0.08, and 0.09 for RE, GT, MT, and FC, respectively. These prices are higher than those currently charged for residential tariffs by electricity distribution companies in southwestern Nigeria. This implies that the project is financially viable. In conclusion, therefore, this study indicates the use of effluents for generating biogas for use in CHP to be a viable one, based on the technologies of a reciprocating engine, gas turbine, micro turbine, and fuel cell. The fuel cell was made viable in the 10-year cycle used for financial assessments by reducing the capacity of the power generator to about 40% of what it is capable of supporting. Using a combination of the economic/financial indicators used, the reciprocating engine appears to be the most viable of all the technologies considered. However, it is recommended that the theoretical estimation be validated using a field-scale project.

Supplementary Materials

The following supporting information can be downloaded at: https://www.mdpi.com/article/10.3390/fuels3040038/s1. Table S1: Life cycle Assessment of generated effluents; Table S2: Cost and Revenue generated as well as Levelised cost of Electricity for Reciprocating Internal Combustion engine—(CHP system); Table S3: Cost and Revenue generated as well as Levelised cost of Electricity for Micro turbine—(CHP system); Table S4: Cost and Revenue generated as well as Levelised cost of Electricity for Gas turbine—(CHP system); Table S5: Cost and Revenue generated as well as Levelised cost of Electricity for Fuel cell- CHP system; Table S6: Cash flow for Gas turbine; Table S7: Cash flow for Microturbine; Table S8: Cash flow for Reciprocating Internal Combustion turbine; Table S9: Cash flow For Fuel Cell.

Author Contributions

Conceptualization, T.D.A. and A.S.M.; methodology, A.S.M.; software, T.D.A.; validation, I.O.O., J.A. and A.S.M.; formal analysis, T.D.A. and A.S.M.; investigation, T.D.A.; resources, T.D.A., A.S.M.; data curation, T.D.A., A.S.M. and I.O.O.; writing—original draft preparation, T.D.A.; writing—review and editing, A.S.M., I.O.O. and J.A.; visualization, A.S.M.; supervision, A.S.M., I.O.O. and J.A.; project administration, A.S.M. All authors have read and agreed to the published version of the manuscript.

Funding

This research received no external funding.

Institutional Review Board Statement

Not applicable.

Informed Consent Statement

Not applicable.

Acknowledgments

The authors graciously acknowledge Nkechiwetalu Nwankwo for her contribution in kind in the preparation of the system dynamics model used for the study.

Conflicts of Interest

The authors declare no conflict of interest.

References

  1. UNESCO. World Water Assessment programme: The United Nations World Water Development Report 5. In Water in Changing World Part; London Earthscan: London, UK, 2019. [Google Scholar]
  2. Rasul, M.G.; Ault, C.; Sajjad, M. Bio-gas mixed fuel micro gas turbine co-generation for meeting power demand in Australian remote areas. Energy Procedia 2015, 75, 1065–1071. [Google Scholar] [CrossRef]
  3. Jabari, F.; Arasteh, H.; Sheikhi-Fini, A.; Ghaebi, H.; Bannae-Sharifian, M.B.; Mohammadi-Ivatloo, B.; Mohammadpourfard, M. A biogas-steam combined cycle for sustainable development of industrial-scale water-power hybrid microgrids: Design and optimal scheduling. Biofuels Bioprod. Biorefining 2022, 16, 172–192. [Google Scholar] [CrossRef]
  4. Farooque, M.; Leo, A.; Rauseo, A.; Wang, J.Y. Efficient and ultra-clean use of biogas in the fuel cell-the DFC experience. Energy Sustain. Soc. 2015, 5, 261. [Google Scholar] [CrossRef] [Green Version]
  5. Mang, H.P.; Li, Z.; de Porres Lebofa, M.M.; Huba, E.M.; Schwarz, D.; Schnell, R.; Luong, N.G.; Kellner, C.; Selke, J. Biogas Production, Developing Countries. In Renewable Energy Systems; Springer: New York, NY, USA, 2013; pp. 218–246. [Google Scholar]
  6. Tanigawa, S. Fact Sheet | Biogas: Converting Waste to Energy; White Papers; EESI: Washington, DC, USA, 2017. [Google Scholar]
  7. Moomaw, W.; Barthel, M. The Critical Role of Global Food Consumption Patterns in Achieving Sustainable Food Systems and Food for All; A UNEP Discussion Paper; UNEP: Nairobi, Kenya, 2012. [Google Scholar]
  8. globalEDGE. Food and Beverage. 2021. Available online: https://globaledge.msu.edu/industries/food-and-beverage/memo/ (accessed on 13 September 2021).
  9. Belyaeva, Z.; Rudawska, E.D.; Lopatkova, Y. Sustainable business model in food and beverage industry—A case of Western and Central and Eastern European countries. Br. Food J. 2020, 122, 1573–1592. [Google Scholar] [CrossRef]
  10. CED. Economic Contribution of the Food and Beverages Industry; Wilson: Arlington, Virginia, 2017.
  11. Valta, K.; Kosanovic, T.; Malamis, D.; Moustakas, K.; Loizidou, M. Overview of water usage and wastewater management in the food and beverage industry. Desalination Water Treat. 2015, 53, 3335–3347. [Google Scholar] [CrossRef]
  12. Khedkar, R.; Singh, K. Food industry waste: A panacea or pollution hazard. In Paradigms in Pollution Prevention; Springer: Cham, Switzerland, 2018; pp. 35–47. [Google Scholar]
  13. Tommaso, G. Effluents From the Food Industry; Science, Technology and Nutrition; Woodhead Publishing: Sawston, UK, 2011; pp. 606–622. [Google Scholar]
  14. Hanjra, M.A.; Blackwell, J.; Carr, G.; Zhang, F.; Jackson, T.M. Wastewater irrigation and environmental health: Implications for water governance and public policy. Int. J. Hyg. Environ. Health 2012, 215, 255–269. [Google Scholar] [CrossRef]
  15. Maxime, D.; Marcotte, M.; Arcand, Y. Development of eco-efficiency indicators for the Canadian food and beverage industry. J. Clean. Prod. 2006, 14, 636. [Google Scholar] [CrossRef]
  16. Alayu, E.; Yirgu, Z. Advanced technologies for the treatment of wastewaters from agro-processing industries and cogeneration of by-products: A case of slaughterhouse, dairy and beverage industries. Int. J. Environ. Sci. Technol. 2018, 15, 1581–1596. [Google Scholar] [CrossRef]
  17. Kayode, O.F.; Luethi, C.; Rene, E.R. Management recommendations for improving decentralized wastewater treatment by the food and beverage industries in Nigeria. Environments 2018, 5, 41. [Google Scholar] [CrossRef]
  18. Hussain, R.; Sattar, S.; Khan, M.H.; Nafees, M. Low Cost Wastewater Treatment at Beverage Industry, Hattar Industrial Estate, Pakistan-A Case Study. Int. J. Environ. Prot. 2013, 3, 23. [Google Scholar]
  19. Chmiel, H.; Kaschek, M.; Blöcher, C.; Noronha, M.; Mavrov, V. Concepts for the treatment of spent process water in the food and beverage industries. Desalination 2003, 152, 307–314. [Google Scholar] [CrossRef]
  20. Tauseef, S.M.; Abbasi, T.; Abbasi, S.A. Energy recovery from wastewaters with high-rate anaerobic digesters. Renew. Sustain. Energy Rev. 2013, 19, 704–741. [Google Scholar] [CrossRef]
  21. Zimmermann, A.W.; Wunderlich, J.; Müller, L.; Buchner, G.A.; Marxen, A.; Michailos, S.; Armstrong, K.; Naims, H.; McCord, S.; Styring, P.; et al. Techno-economic assessment guidelines for CO2 utilization. Front. Energy Res. 2020, 8, 5. [Google Scholar] [CrossRef] [Green Version]
  22. Mohammed, M.; Egyir, I.S.; Donkor, A.K.; Amoah, P.; Nyarko, S.; Boateng, K.K.; Ziwu, C. Feasibility study for biogas integration into waste treatment plants in Ghana. Egypt. J. Pet. 2017, 26, 695–703. [Google Scholar] [CrossRef] [Green Version]
  23. Tomei, M.C.; Bertanza, G.; Canato, M.; Heimersson, S.; Laera, G.; Svanström, M. Techno-economic and environmental assessment of upgrading alternatives for sludge stabilization in municipal wastewater treatment plants. J. Clean. Prod. 2016, 112, 3106–3115. [Google Scholar] [CrossRef]
  24. Garrido-Baserba, M.; Reif, R.; Molinos-Senante, M.; Larrea, L.; Castillo, A.; Verdaguer, M.; Poch, M. Application of a multi-criteria decision model to select of design choices for WWTPs. Clean Technol. Environ. Policy 2016, 18, 1097–1109. [Google Scholar] [CrossRef]
  25. Svanström, M.; Bertanza, G.; Bolzonella, D.; Canato, M.; Collivignarelli, C.; Heimersson, S.; Laera, G.; Mininni, G.; Peters, G.; Tomei, M.C. Method for technical, economic and environmental assessment of advanced sludge processing routes. Water Sci. Technol. 2014, 69, 2407–2416. [Google Scholar] [CrossRef]
  26. Padi, R.K.; Chimphango, A. Feasibility of commercial waste biorefineries for cassava starch industries: Techno-economic assessment. Bioresour. Technol. 2020, 297, 122461. [Google Scholar] [CrossRef]
  27. Riley, D.M.; Tian, J.; Güngör-Demirci, G.; Phelan, P.; Villalobos, J.R.; Milcarek, R.J. Techno-economic assessment of CHP systems in wastewater treatment plants. Environments 2020, 7, 74. [Google Scholar] [CrossRef]
  28. Mofijur, M.; Fattah, I.R.; Kumar, P.S.; Siddiki, S.Y.A.; Rahman, S.A.; Ahmed, S.F.; Ong, H.C.; Lam, S.S.; Badruddin, I.A.; Khan, T.Y.; et al. Bioenergy recovery potential through the treatment of the meat processing industry waste in Australia. J. Environ. Chem. Eng. 2021, 9, 105657. [Google Scholar] [CrossRef]
  29. Zacharof, M.P. Grape winery waste as feedstock for bioconversions: Applying the biorefinery concept. Waste Biomass Valorization 2017, 8, 1011–1025. [Google Scholar] [CrossRef]
  30. Sawatdeenarunat, C.; Wangnai, C.; Songkasiri, W.; Panichnumsin, P.; Saritpongteeraka, K.; Boonsawang, P.; Khanal, S.K.; Chaiprapat, S. Biogas production from industrial effluents. In Biofuels: Alternative Feedstocks and Conversion Processes for the Production of Liquid and Gaseous Biofuels; Academic Press: Cambridge, MA, USA, 2019; pp. 779–816. [Google Scholar]
  31. Momodu, A.S.; Adepoju, T.D. System dynamics kinetic model for predicting biogas production in anaerobic condition: Preliminary assessment. Sci. Prog. 2021, 104, 00368504211042479. [Google Scholar] [CrossRef] [PubMed]
  32. Bala, B.K. System dynamics modelling and simulation of biogas production systems. Renew. Energy 1991, 1, 723–728. [Google Scholar] [CrossRef]
  33. Viker, D.; Richardson, G.; Luna, L. Mathematical Representation of System Dynamics Models. Online, Available from PPT–Mathematical Representation of System Dynamics Models PowerPoint Presentation-ID:425333. 2012. Available online: slideserve.com (accessed on 20 April 2022).
  34. FAO. Cassava Development in Nigeria; Department of Agriculture, Federal Ministry of Agriculture and Natural, Resources: Abuja, Nigeria, 2010.
  35. FAO. The State of Food Security and Nutrition in the World 2020; Transforming Food Systems for Affordable Healthy Diets; Food and Agriculture Organization of the United Nations: Rome, Italy, 2020. [Google Scholar]
  36. Adewumi, I.; Oyebode, O.; Igbokwe, K.; Aluko, O. Water footprints in four selected Breweries in Nigeria. In Towards Life Cycle Sustainability Management; Springer: Dordrecht, The Netherland, 2011; pp. 171–181. [Google Scholar]
  37. Pham Van, D.; Hoang, M.G.; Pham Phu, S.T.; Fujiwara, T. A new kinetic model for biogas production from co-digestion by batch mode. Glob. J. Environ. Sci. Manag. 2018, 4, 251–262. [Google Scholar]
  38. Gupta, A.S. Feasibility Study for Production of Biogas from Wastewater and Sewage Sludge: Development of a Sustainability Assessment Framework and its Application. Stockholm; KTH Royal Institute of Technology: Stockholm, Sweden, 2020. [Google Scholar]
  39. Suresh, M.V.J.J.; Reddy, K.S.; Kolar, A.K. 4-E (Energy, Exergy, Environment, and Economic) analysis of solar thermal aided coal-fired power plants. Energy Sustain. Dev. 2010, 14, 267–279. [Google Scholar] [CrossRef]
  40. NSDC. National Sugar Master Plan; National Sugar Development Council: Abuja, Nigeria, 2021. [Google Scholar]
  41. Mahmoodzadeh, S.; Shahrabi, J.; Pariazar, M.; Zaeri, M. Project selection by using fuzzy AHP and TOPSIS technique. World Acad. Sci. Eng. Technol. 2007, 30, 333–338. [Google Scholar]
  42. MAO, Kangyi. Engineering Economy: Overview and Application in Process Engineering Industry. 10.490 ICE. Microsoft PowerPoint—Engineering Economics Lecture.ppt. 2006. Available online: semanticscholar.org (accessed on 20 April 2022).
  43. Meredith, J.; Mantel, S. Project Management: A Managerial Approach with Cd; John Wiley & Sons: Hoboken, NJ, USA, 2009. [Google Scholar]
  44. Di Fraia, S.; Figaj, R.D.; Massarotti, N.; Vanoli, L. An integrated system for sewage sludge drying through solar energy and a combined heat and power unit fuelled by biogas. Energy Convers. Manag. 2018, 171, 587–603. [Google Scholar] [CrossRef]
  45. Wong, S.C.; Law-Flood, A. Tapping the Energy Potential of Municipal Wastewater Treatment: Anaerobic Digestion and Combined Heat and Power in Massachusetts; Massachusetts Department of Environmental Protection: Boston, MA, USA, 2011.
  46. Martin, A.; Dahl, O. District heating driven membrane distillation for advanced flue gas condensate treatment in combined heat and power plants. J. Clean. Prod. 2021, 292, 125979. [Google Scholar]
  47. Novakovic, V. Biomass Combined Heat and Power (CHP) for Electricity and District Heating. Master’s Thesis, Institutt for Energi-og Prosessteknikk, Trondheim, Norway, 2014. [Google Scholar]
  48. Akbulut, A. Techno-economic analysis of electricity and heat generation from farm-scale biogas plant: Çiçekdağı case study. Energy 2012, 44, 381–390. [Google Scholar] [CrossRef]
  49. Bidart, C.; Fröhling, M.; Schultmann, F. Electricity and substitute natural gas generation from the conversion of wastewater treatment plant sludge. Appl. Energy 2014, 113, 404–413. [Google Scholar] [CrossRef]
  50. Ochoa, A.A.; Dutra, J.C.C.; Henríquez, J.R.; dos Santos, C.A.C. Techno-economic and Exergoeconomic Analysis of a micro cogeneration system for a residential use. Acta Sci. Technol. 2016, 38, 327–338. [Google Scholar] [CrossRef]
  51. de Lemos Chernicharo, C.A. Anaerobic Reactors; IWA publishing: London, UK, 2007. [Google Scholar]
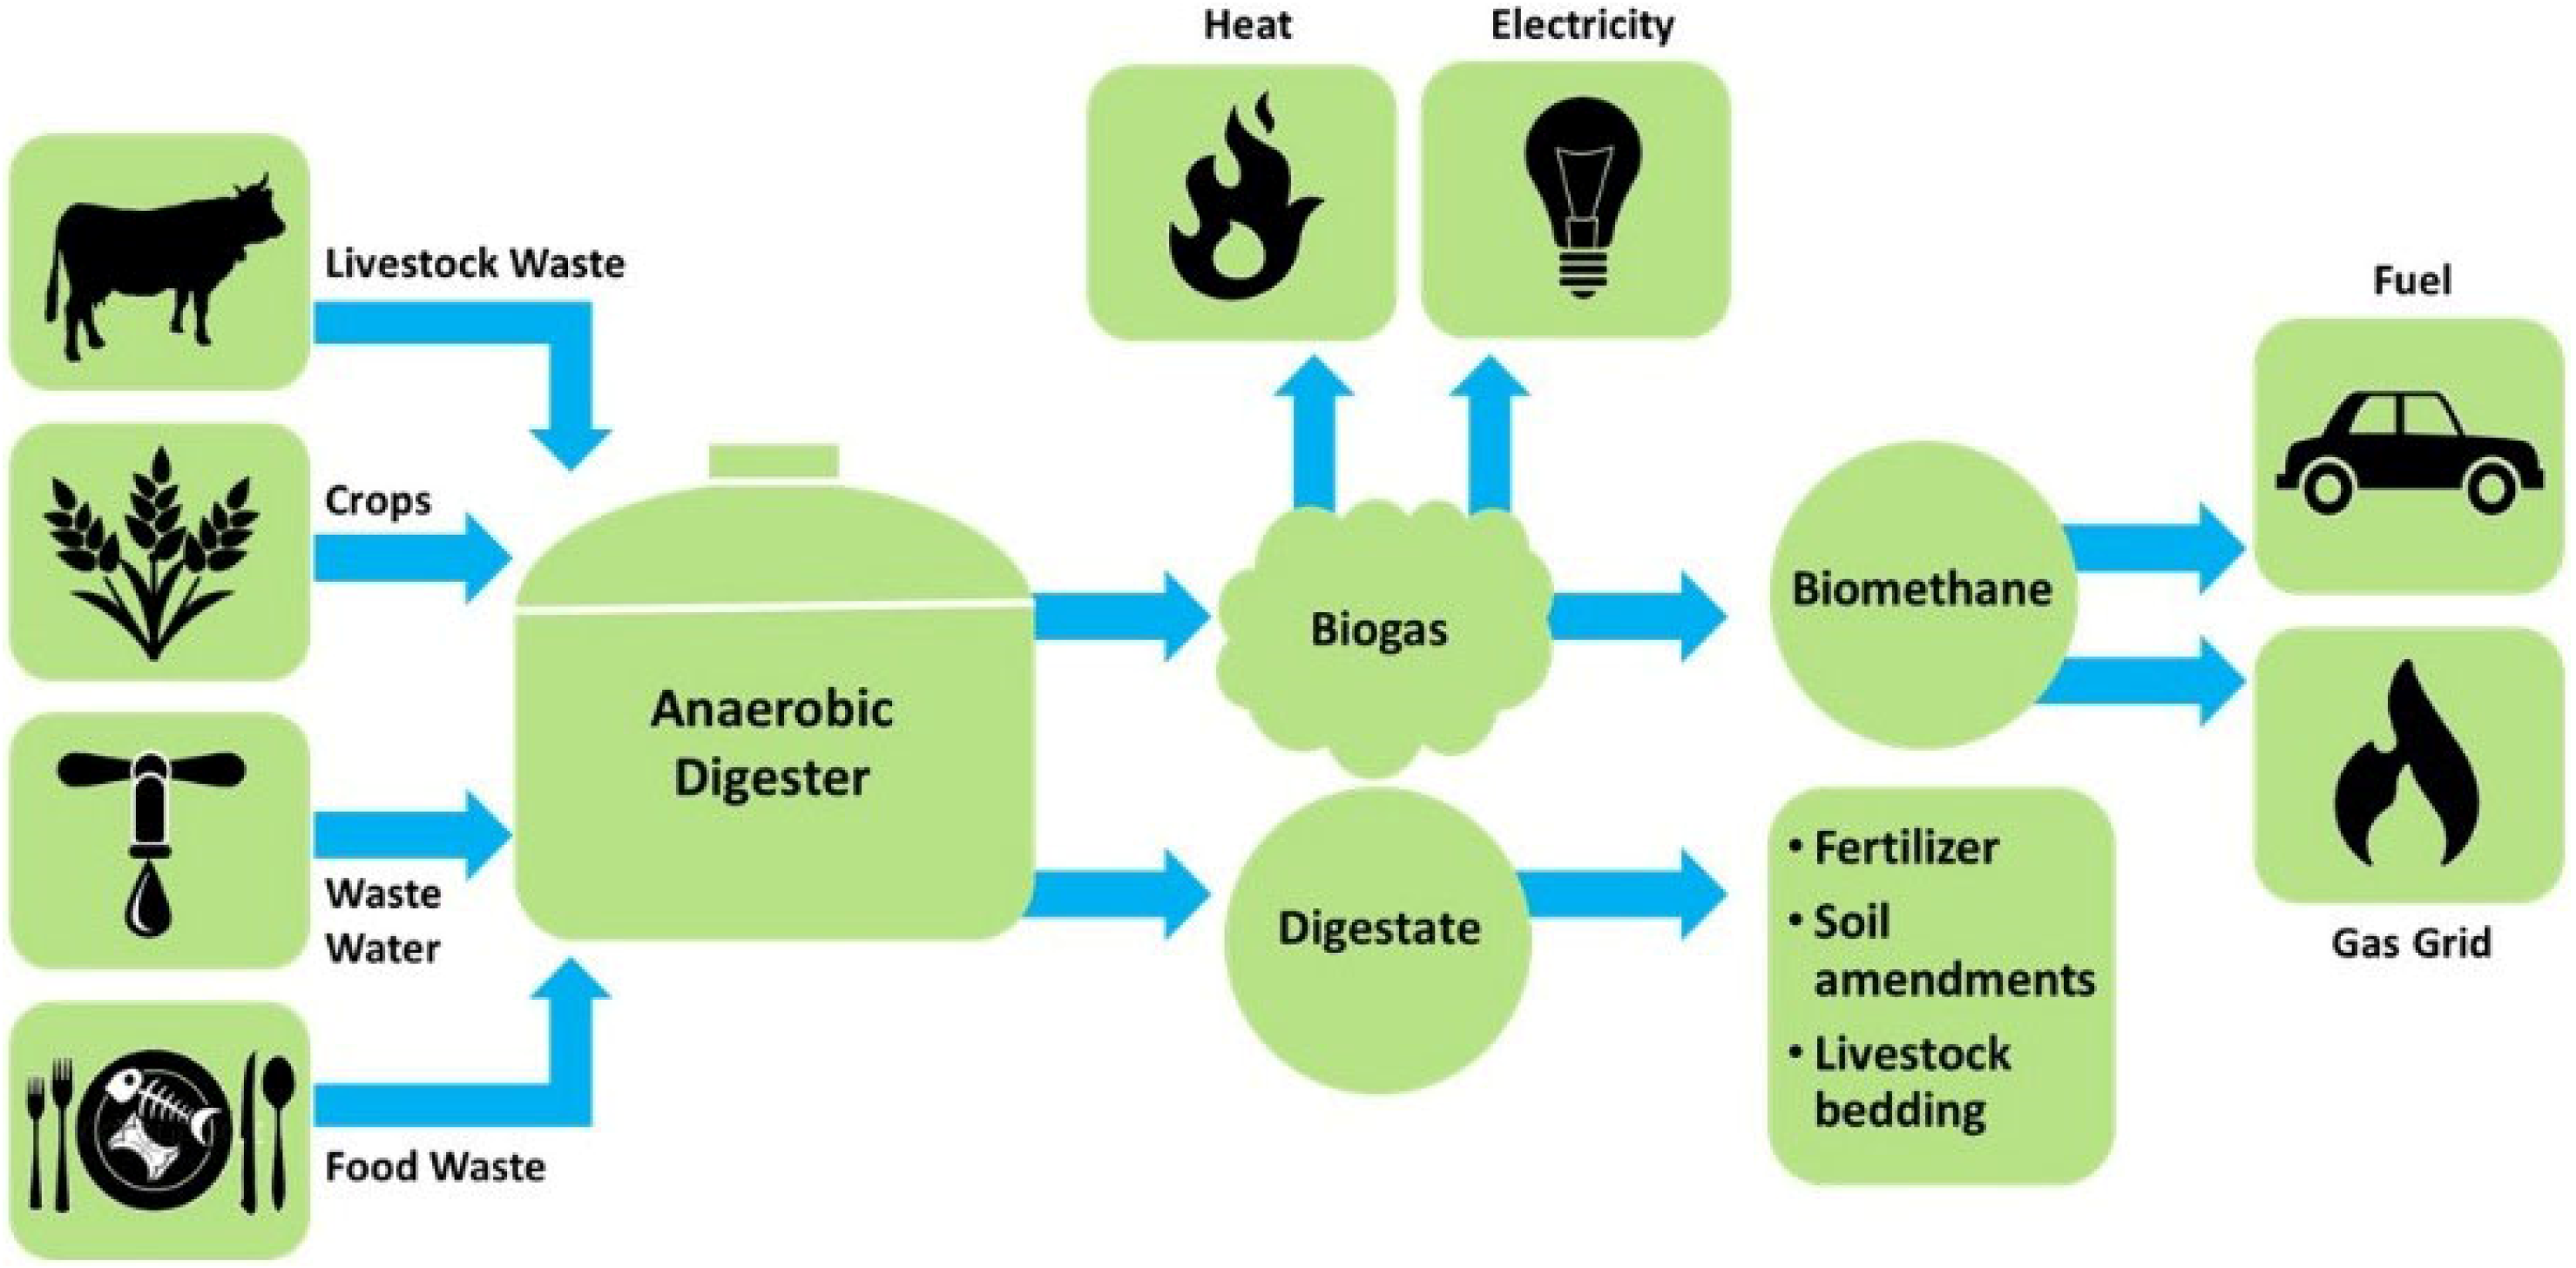
Figure 1. The material flow of the anaerobic digestion process and its uses [5].
Fuels 03 00038 g001
Figure 2. Adapted causal diagram of the anaerobic digestion of effluents used for biogas production [30].
Fuels 03 00038 g002
Figure 3. Causal diagram for effluents, biogas production, and energy recovery for CHP use.
Fuels 03 00038 g003
Figure 4. System dynamics biogas energy recovery model for CHP.
Fuels 03 00038 g004
Figure 5. Total estimated biogas produced daily from cassava flakes, sugar, and beer processes.
Fuels 03 00038 g005
Figure 6. Power generation potential from the effluents produced.
Fuels 03 00038 g006
Figure 7. Heat and electrical energy potential from the biogas recovered from the effluents.
Fuels 03 00038 g007
Table 1. Estimates of effluents from the process in the production of cassava flakes, beer, and sugar in southwestern Nigeria.
Effluents Production fromAmount (m3/day)
Cassava flakes9554
Beer from un-malted grain and barley4805.77
Sugar refining2767.67
Table 2. Life cycle assessment of the avoided emissions from generated effluents.
Source of EffluentsAverage Daily Heat Generation Potential (kWh/day)Average Daily Electricity Generation Potential (kWh/day) Total Avoided Emissions Yearly (tCO2eq)
Malted Grains127,924.8027,648.8917,264.55
Cassava254,311.0054,965.2034,321.36
Sugar 73,657.7815,919.949940.76
All effluents455,893.5898,534.0361,526.67
Table 3. Project specifications of energy recovery potential from process industry effluents.
Turbine TypeReciprocating Engine (RE)Gas Turbine (GT)Micro Turbine (MT)Fuel Cell
Project Indicators
Power Generating Capacity needed (MW)5.25.25.22.0
Levelised Cost of Energy (LCE) ($/kWh)0.060.070.080.09
Table 4. Economic and financial analysis of the energy recovery potential project specifications.
Project Type
Economic and Financial Indicators
Reciprocating Engine (RE)Gas Turbine (GT)Micro Turbine (MT)Fuel Cell
NPV of profit margin (millions of dollars)7.96.793.592.42
ROI (%)46411610
IRR (%)45363432
Payback period (years)6.096.638.097.69
Profitability index (cost-benefit ratio)1.501.391.171.12
Publisher’s Note: MDPI stays neutral with regard to jurisdictional claims in published maps and institutional affiliations.