Abstract
The elimination of tar impurities from biomass gasification by catalytic steam reforming can provide clean syngas for downstream biofuel synthesis (Fischer–Tropsch). The effects of key operating parameters in CH4/tar steam reforming were investigated. Ni-Co/Mg(Al)O catalyst performance was tested at model conditions (10/35/25/25/5 wt% CH4/H2/CO/CO2/N2), changing the temperature (650–800 °C), steam-to-carbon ratio (2–5), tar loading (10–30 g/Nm3), and tar composition (toluene, 1-methylenaphthalene, and phenol). Complete tar elimination was achieved under all conditions, at the expense of catalyst deactivation by coke formation. Post-operation coke characterization was obtained with TPO-MS, Raman spectroscopy, and STEM analysis, providing vital insight into coke morphology and location. Critical low-temperature and high-tar loading limits were identified, where rapid deactivation was accompanied by increasing amounts of hard coke species. A coke classification scheme is proposed, including strongly adsorbed surface carbon species (soft coke A), initial scattered carbon filaments (hard coke B1.1), filament clusters and fused filaments (B2), and strongly deactivating bulk encapsulating coke (B3), formed through progressive filament cluster graphitization. High-molecular-weight tar was found to enhance the formation of strongly deactivating metal-particle-encapsulating coke (B1.2). The results contribute to the understanding of coke formation in the presence of biomass gasification tar impurities.
1. Introduction
The electrification of aviation, shipping, and long-distance road transportation is limited by the need for energy sources with high volumetric and gravimetric energy density [1]. In the future, such transportation niches are also expected to depend on liquid fuels. Renewable carbon-based liquid fuels can be produced from biomass feedstocks in a biomass-to-liquid (BTL) process, coupling biomass gasification and Fischer–Tropsch hydrocarbon synthesis [2]. The gasification process involves thermal biomass decomposition through a complex set of reactions forming mainly H2, CO, CO2, CH4, and H2O. The product gas also contains higher-molecular-weight hydrocarbon impurities (tars) that can cause considerable issues with downstream condensation and coking [3]. The development of BTL technology is limited by technical difficulties regarding the intermediate gas conditioning of the syngas, requiring removal of organic, inorganic, and particulate contaminants [4]. The elimination of tar impurities has been put forth as the most cumbersome challenge in the commercialization of such technologies [2]. Tars can be broadly defined as condensable hydrocarbons and are generally considered to consist largely of aromatic compounds [5]. Typical tars from gasification of lignocellulosic biomass have been reported to contain mostly one-ring (66%) and two-ring (17%) aromatic hydrocarbons like benzene, toluene, and naphthalene, as well as three-ring (4%), four-ring (1%), phenolic (5%), and heterocyclic (7%) species [6]. The most common model compounds for biomass gasification tar are toluene, benzene, naphthalene, and phenol [7].
Tar removal by catalytic steam reforming is generally considered to be an attractive approach, increasing the overall process efficiency compared with physical separation and high-temperature thermal cracking strategies [8]. Supported metal catalysts including Ni, Co, Fe, Pt, Pd, Rh, and Ru have been shown to provide the required reforming activity [9,10,11]. Ni-based catalysts are generally preferred for commercial applications due to the high activity-to-cost ratio. Li et al. [9] reviewed the development of metal catalysts for tar steam reforming, calling for further research on bi-metallic Ni-Co systems, targeting low-cost, high-performance alloy catalysts with increased resistance towards deactivation by coke formation. Hydrotalcite-based Ni-Co/Mg(Al)O catalysts have been extensively studied for H2 production by ethanol steam reforming [12,13,14,15,16,17]. The high performance of similar hydrotalcite-based Ni-Co systems has also been demonstrated in steam reforming with other organic species (methane, glycerol, acetic acid, glycolaldehyde, and hydroxyacetone) [18,19,20], as well as in sorption-enhanced water–gas shift reactions [21] and in situ sorption-enhanced catalytic steam gasification of lignocellulosic biomass [22]. The first reports on model tar steam reforming with such Ni-Co/Mg(Al)O catalysts under relevant operating conditions were recently published by us [23,24]. The results demonstrated substantial Ni/Co ratio effects on catalyst reforming activity, stability, and coke formation. The present work provides the first report on key operating parameter effects during steam reforming of biomass gasification tar with such Ni-Co/Mg(Al)O catalysts, including temperature, steam-to-carbon (S/C) ratio, and model tar loading and composition.
2. Materials and Methods
2.1. Catalyst System
The synthesis and characterization of the Ni-Co/Mg(Al)O catalyst (20–20 wt% Ni-Co ratio, Ni + Co + MgO + Al2O3 basis) has been reported previously [12]. The hydrotalcite-like precursors were prepared by co-precipitation, pumping an anion solution (200 mL/h) of NaOH and Na2CO3 dissolved in DI water (400 mL) dropwise into a stirred (400 rpm) cation solution of Ni(NO3)2·6H2O, Co(NO3)2·6H2O, Mg(NO3)2·6H2O, and Al(NO3)3·9H2O dissolved in DI water (400 mL). The pH was adjusted (to 8–9) by addition of HNO3 (ca 4.3 mL, 68% in H2O). The reaction mixture was heated at 80 °C and aged overnight (16 h). The mixture was cooled to room temperature, and the precipitate washed with DI water (ca 3000 mL) by vacuum filtration. The pH of the filtrate was measured to 6–7 at the end of the filtration. The (Ni + Co + Mg)/Al and NaOH/Al ratios (molar basis) were kept constant at 6/2 and 16/2 to resemble the M(II)6M(III)2(OH)16CO3·4H2O composition of the hydrotalcite structure. The Na2CO3 was added in excess (50 mol%). The hydrotalcite-like precursors were dried overnight at 80 °C and calcined at 600 °C for 6 h in air (60 NmL/min) after 2 h of additional pre-drying at 80 °C. The temperature ramp rate was 5 °C/min. All applied chemicals were acquired from Sigma-Aldrich (St. Louis, MO, USA), VWR Chemicals (Radnor, PA, USA) or Thermo Fisher Scientific (Branchburg, NJ, USA). The catalyst was characterized by powder X-ray diffraction (XRD), inductively coupled plasma mass spectrometry (ICP-MS), temperature-programmed reduction (TPR), N2 physisorption, and H2 chemisorption. The characterization results are reported elsewhere [23].
2.2. Thermodynamic Simulations
The equilibrium compositions were calculated in Aspen Plus V9 applying the Peng–Robinson cubic equation of state. The equilibrium H2/CO and CO/CO2 ratios were calculated considering the theoretical H2/CO/CO2/H2O composition (CH4/tar steam reforming basis) following the observed hydrocarbon conversion for each individual datapoint.
2.3. Steam Reforming Experiments
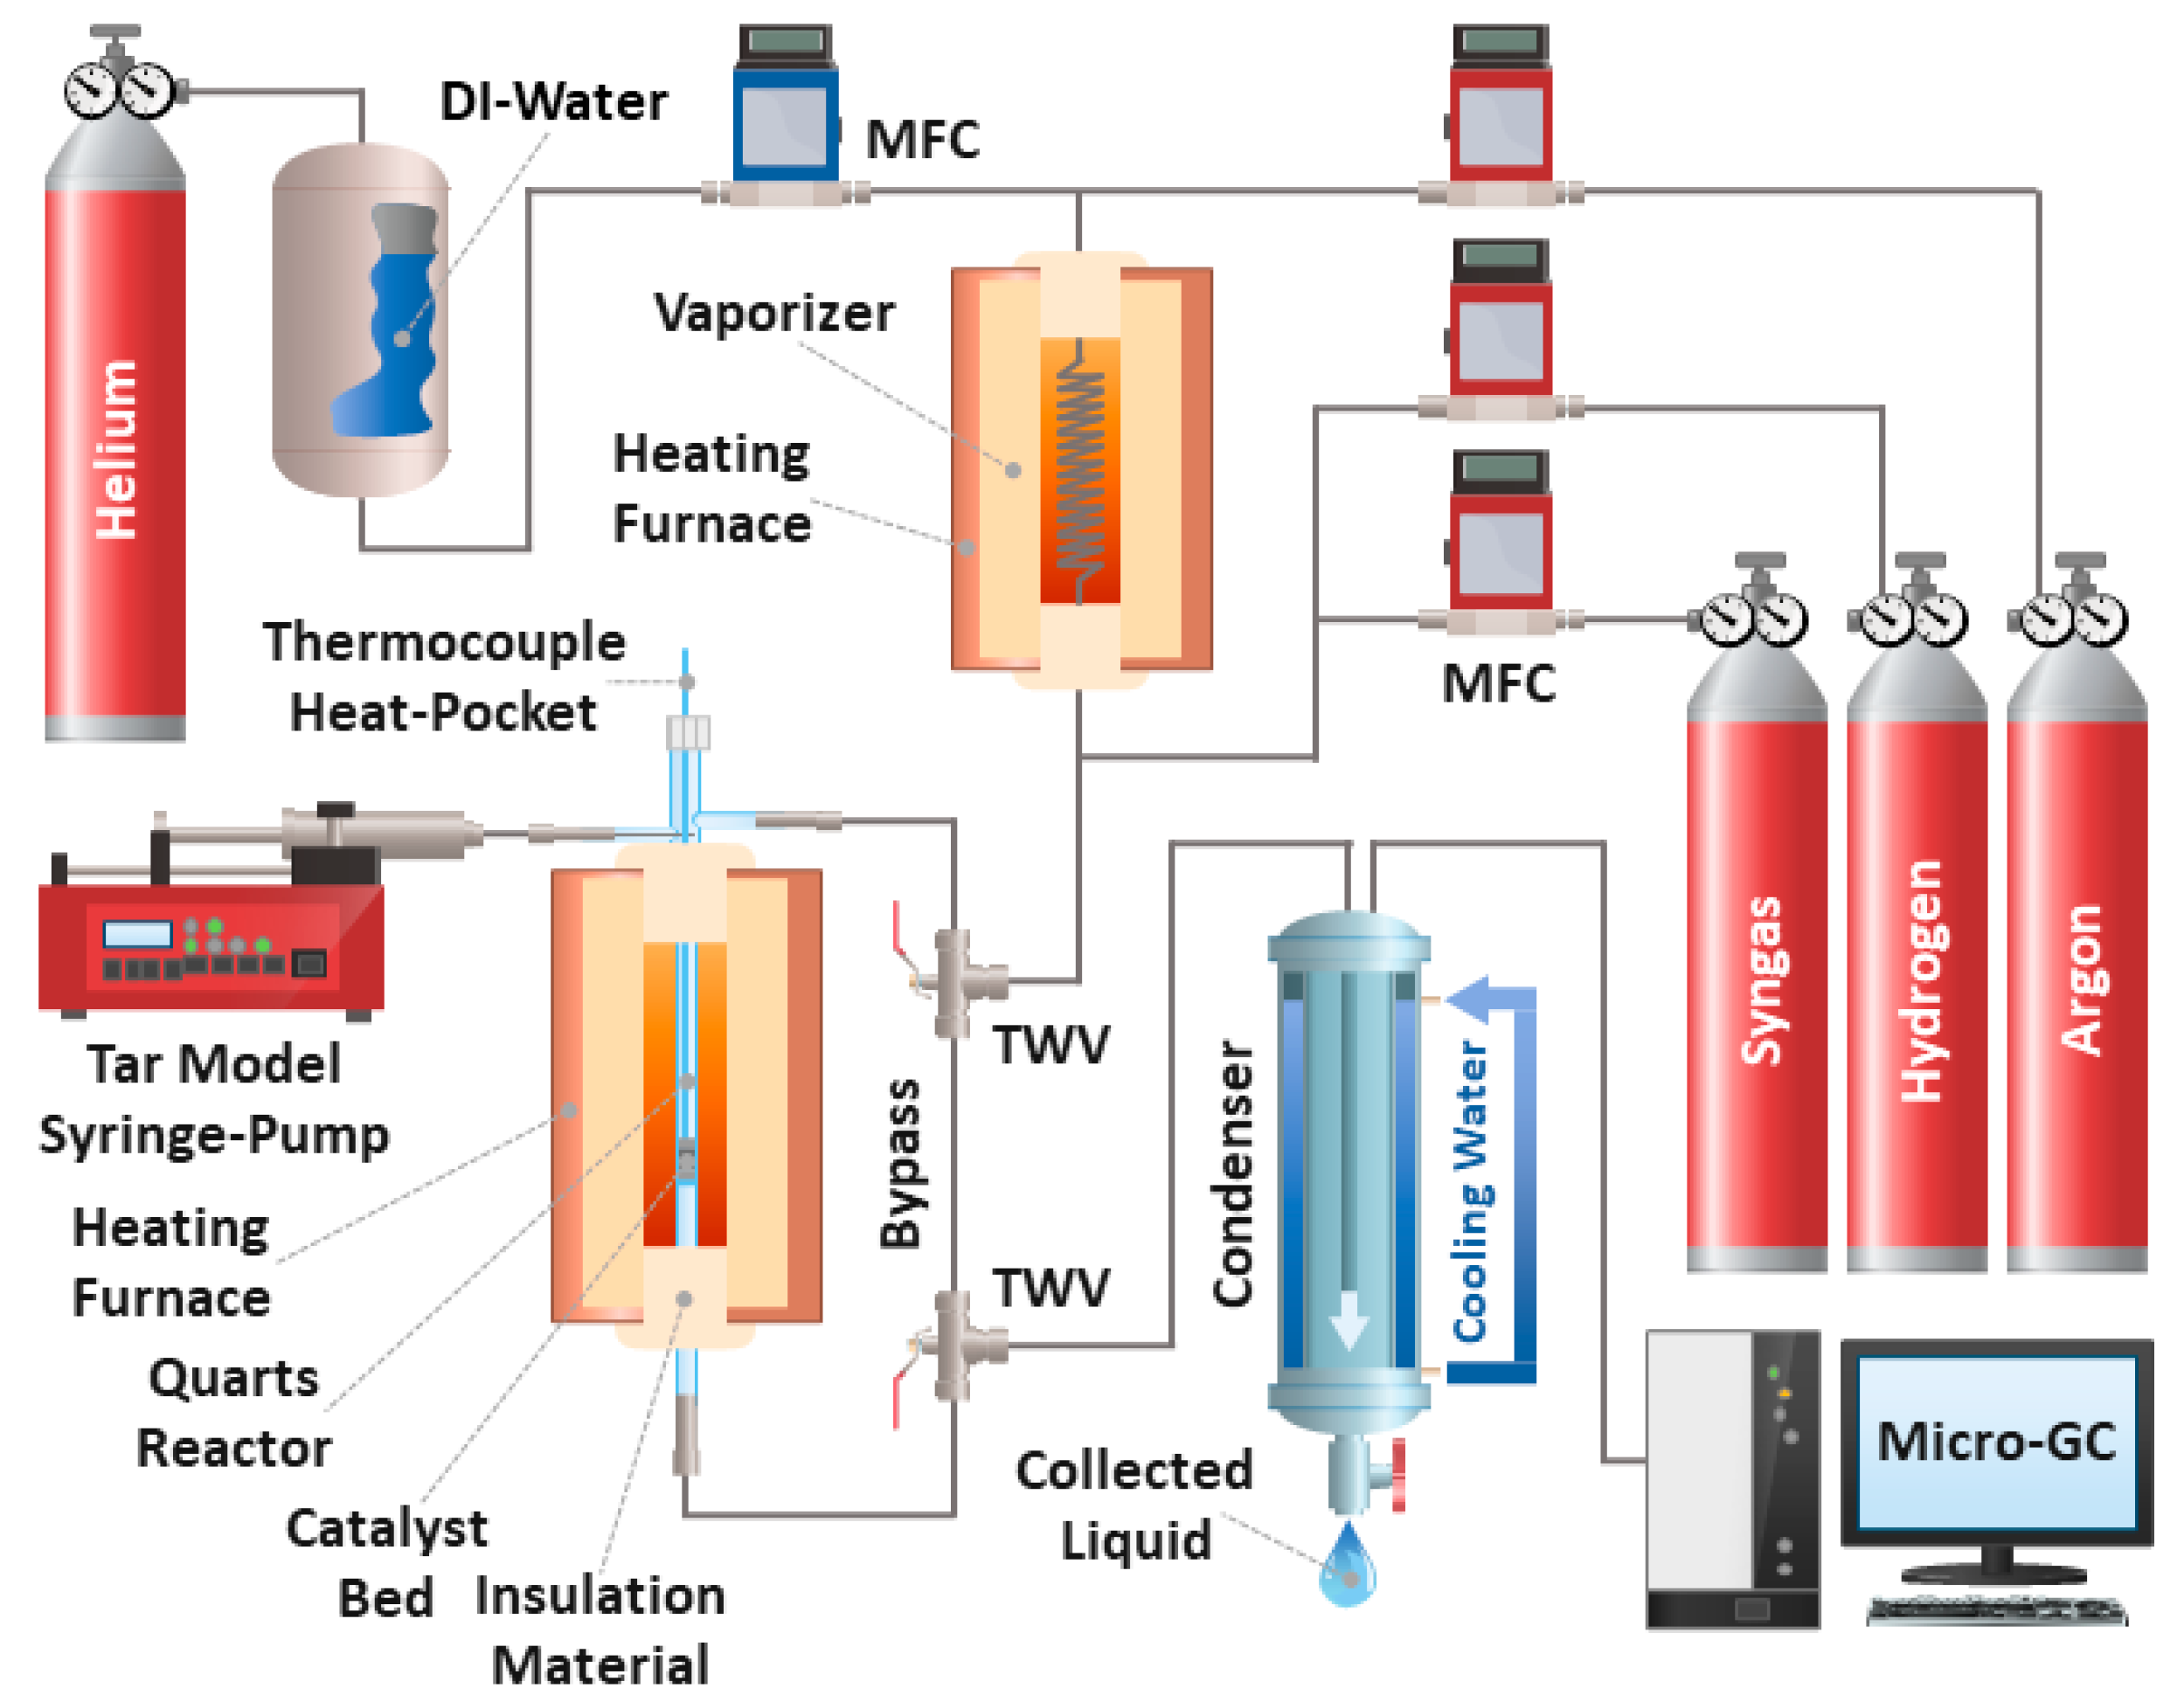
The experimental setup (see Figure 1) was described in our previous publication [23]. The catalyst samples (10.0 mg, 75–150 μm) were diluted with α-Al2O3 (400.0 mg) and placed inside the reactor. The model biomass gasification syngas contained 10/35/25/25 mol% CH4/H2/CO/CO2 with 5 mol% N2 as internal standard. The catalyst was reduced in 50 mol% H2 in Ar (200 NmL/min) for 16 h at 670 °C after pre-heating at 2.0 °C/min. The reactant flow was stabilized in the reactor bypass before being directed to the catalyst bed. The syngas flow (400 NmL/min), corresponding to a total gas hourly space velocity (GHSV) of 85,000 NmL/gcatmin (including H2O and Ar balance), and pressure (atmospheric) were kept constant for all experiments. Empty-reactor tests (only α-Al2O3, temperature = 675–800 °C, S/C = 3.0) were performed under the same conditions.
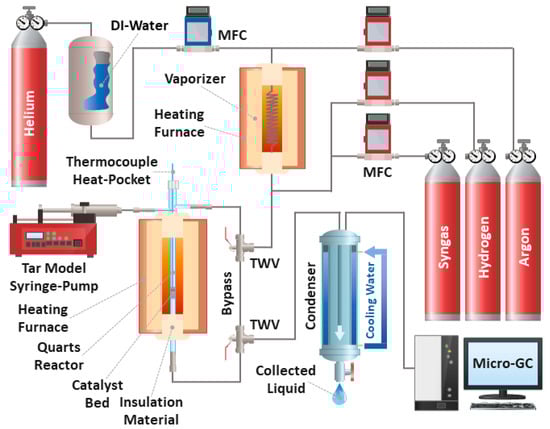
Figure 1.
Experimental setup (syngas = 10/35/25/25 mol% CH4/H2/CO/CO2 with 5 mol% N2 internal standard, Ar balance, syngas flow = 400 NmL/min, GHSV = 85,000 NmL/gcatmin, temperature = 650–800 °C, S/C = 2–5, tar loading = 10–30 g/Nm3, tar composition = 100/0/0, 75/25/0, or 70/25/5 wt% toluene/1-methylenaphthalene/phenol). Reproduced from Lysne et al. [23].
The catalyst stability during hydrocarbon steam reforming (TOS = 8 h, time on stream) was studied with and without the addition of a model tar to the feed. The tar was injected directly into the reactor with a syringe pump (NE-1000, 50 mL stainless steel syringe, KD Scientific (Holliston, MA, USA)). The effects of temperature (650, 700, 750, and 800 °C), S/C ratio (2.0, 3.0, 4.0, and 5.0, molar hydrocarbon basis), tar loading (Tar-1 = 10.0, 20.0, and 30.0 g/Nm3, dry model syngas basis), and model tar composition (Tar-1 = 100/0/0, Tar-2 = 75/25/0, Tar-3 = 70/25/5 wt% toluene/1-methylnaphthalene/phenol) were studied.
Spent catalysts were cooled to room temperature under inert conditions (Ar, 100 NmL/min) and isolated from the bed dilution material by magnetic separation. The condenser samples were extracted with n-pentane (ca 10 mL) and analyzed with an Agilent 7820A GC-FID (VF-Xms column, 60 m × 250 μm × 1 μm). The quantification of remaining model tar compounds was addressed by standard sample analysis. Peak identification was achieved with an Agilent 7820A GC-MS (Agilent Technologies, Inc., Santa Clara, CA, USA) using the same column.
2.4. Coke Characterization
The temperature-programmed oxidation with mass spectrometry (TPO-MS) experiments were performed with a Netzsch STA 449 C instrument (Netzsch Energy, Las Vegus, NV, USA) and included heating the recovered spent catalyst samples (ca 5–10 mg) from 35 to 900 °C (heating rate 5 °C/min) in synthetic air (21 mol% O2 in N2, 55 NmL/min) and Ar (25 NmL/min). The coke combustion was monitored with a Netzsch QMS 403 C MS (Netzsch Energy, Las Vegus, NV, USA) according to the formation of CO2 (m/z = 44).
Raman spectroscopy was performed with a Horiba Jobin Yvon LabRAM HR800 (Villeneuve d’Ascq, France) instrument equipped with a visible light laser (633 nm) excitation source.
Scanning transmission electron microscopy (STEM) and energy-dispersive X-ray spectroscopy (EDS) were performed with an ultra-high-resolution Hitachi SU9000 instrument (Hitachi High-Tech, Tokyo, Japan). Samples were dispersed in ethanol and drop-casted on plasma-cleaned diced silicon wafers. Elemental mapping was performed with an Oxford Ultim Extreme EDS detector (OXFORD Ultim Extreme, Oxfordshire, UK).
3. Results and Discussion
3.1. Preliminary Considerations
Initial empty-reactor tests showed negligible steam methane reforming (SMR) and water–gas shift (WGS) activity within the inaccuracy of the measurements. Ideal plug-flow conditions and elimination of mass-transfer limitations were achieved following the criteria recommended by EUROKIN. It should be noted that preliminary calculations indicated the presence of some intra-particle mass transfer limitation effects at 750–800 °C (Weisz–Prater criterion not satisfied above 124 and 105 μm, respectively). The approach to equilibrium was 56–67% under these conditions. The high-temperature activity data reported in this work may therefore not reflect pure catalyst kinetics. The high GHSV was applied targeting low-conversion differential reactor conditions. However, the CH4 conversion could not be further reduced in the current setup (due to high catalyst activity) without compromising the relevance of the operating conditions. Initial SMR activity screening gave linear Arrhenius plots at 650–700 °C as expected in the kinetic regime.
3.2. Activity and Deactivation
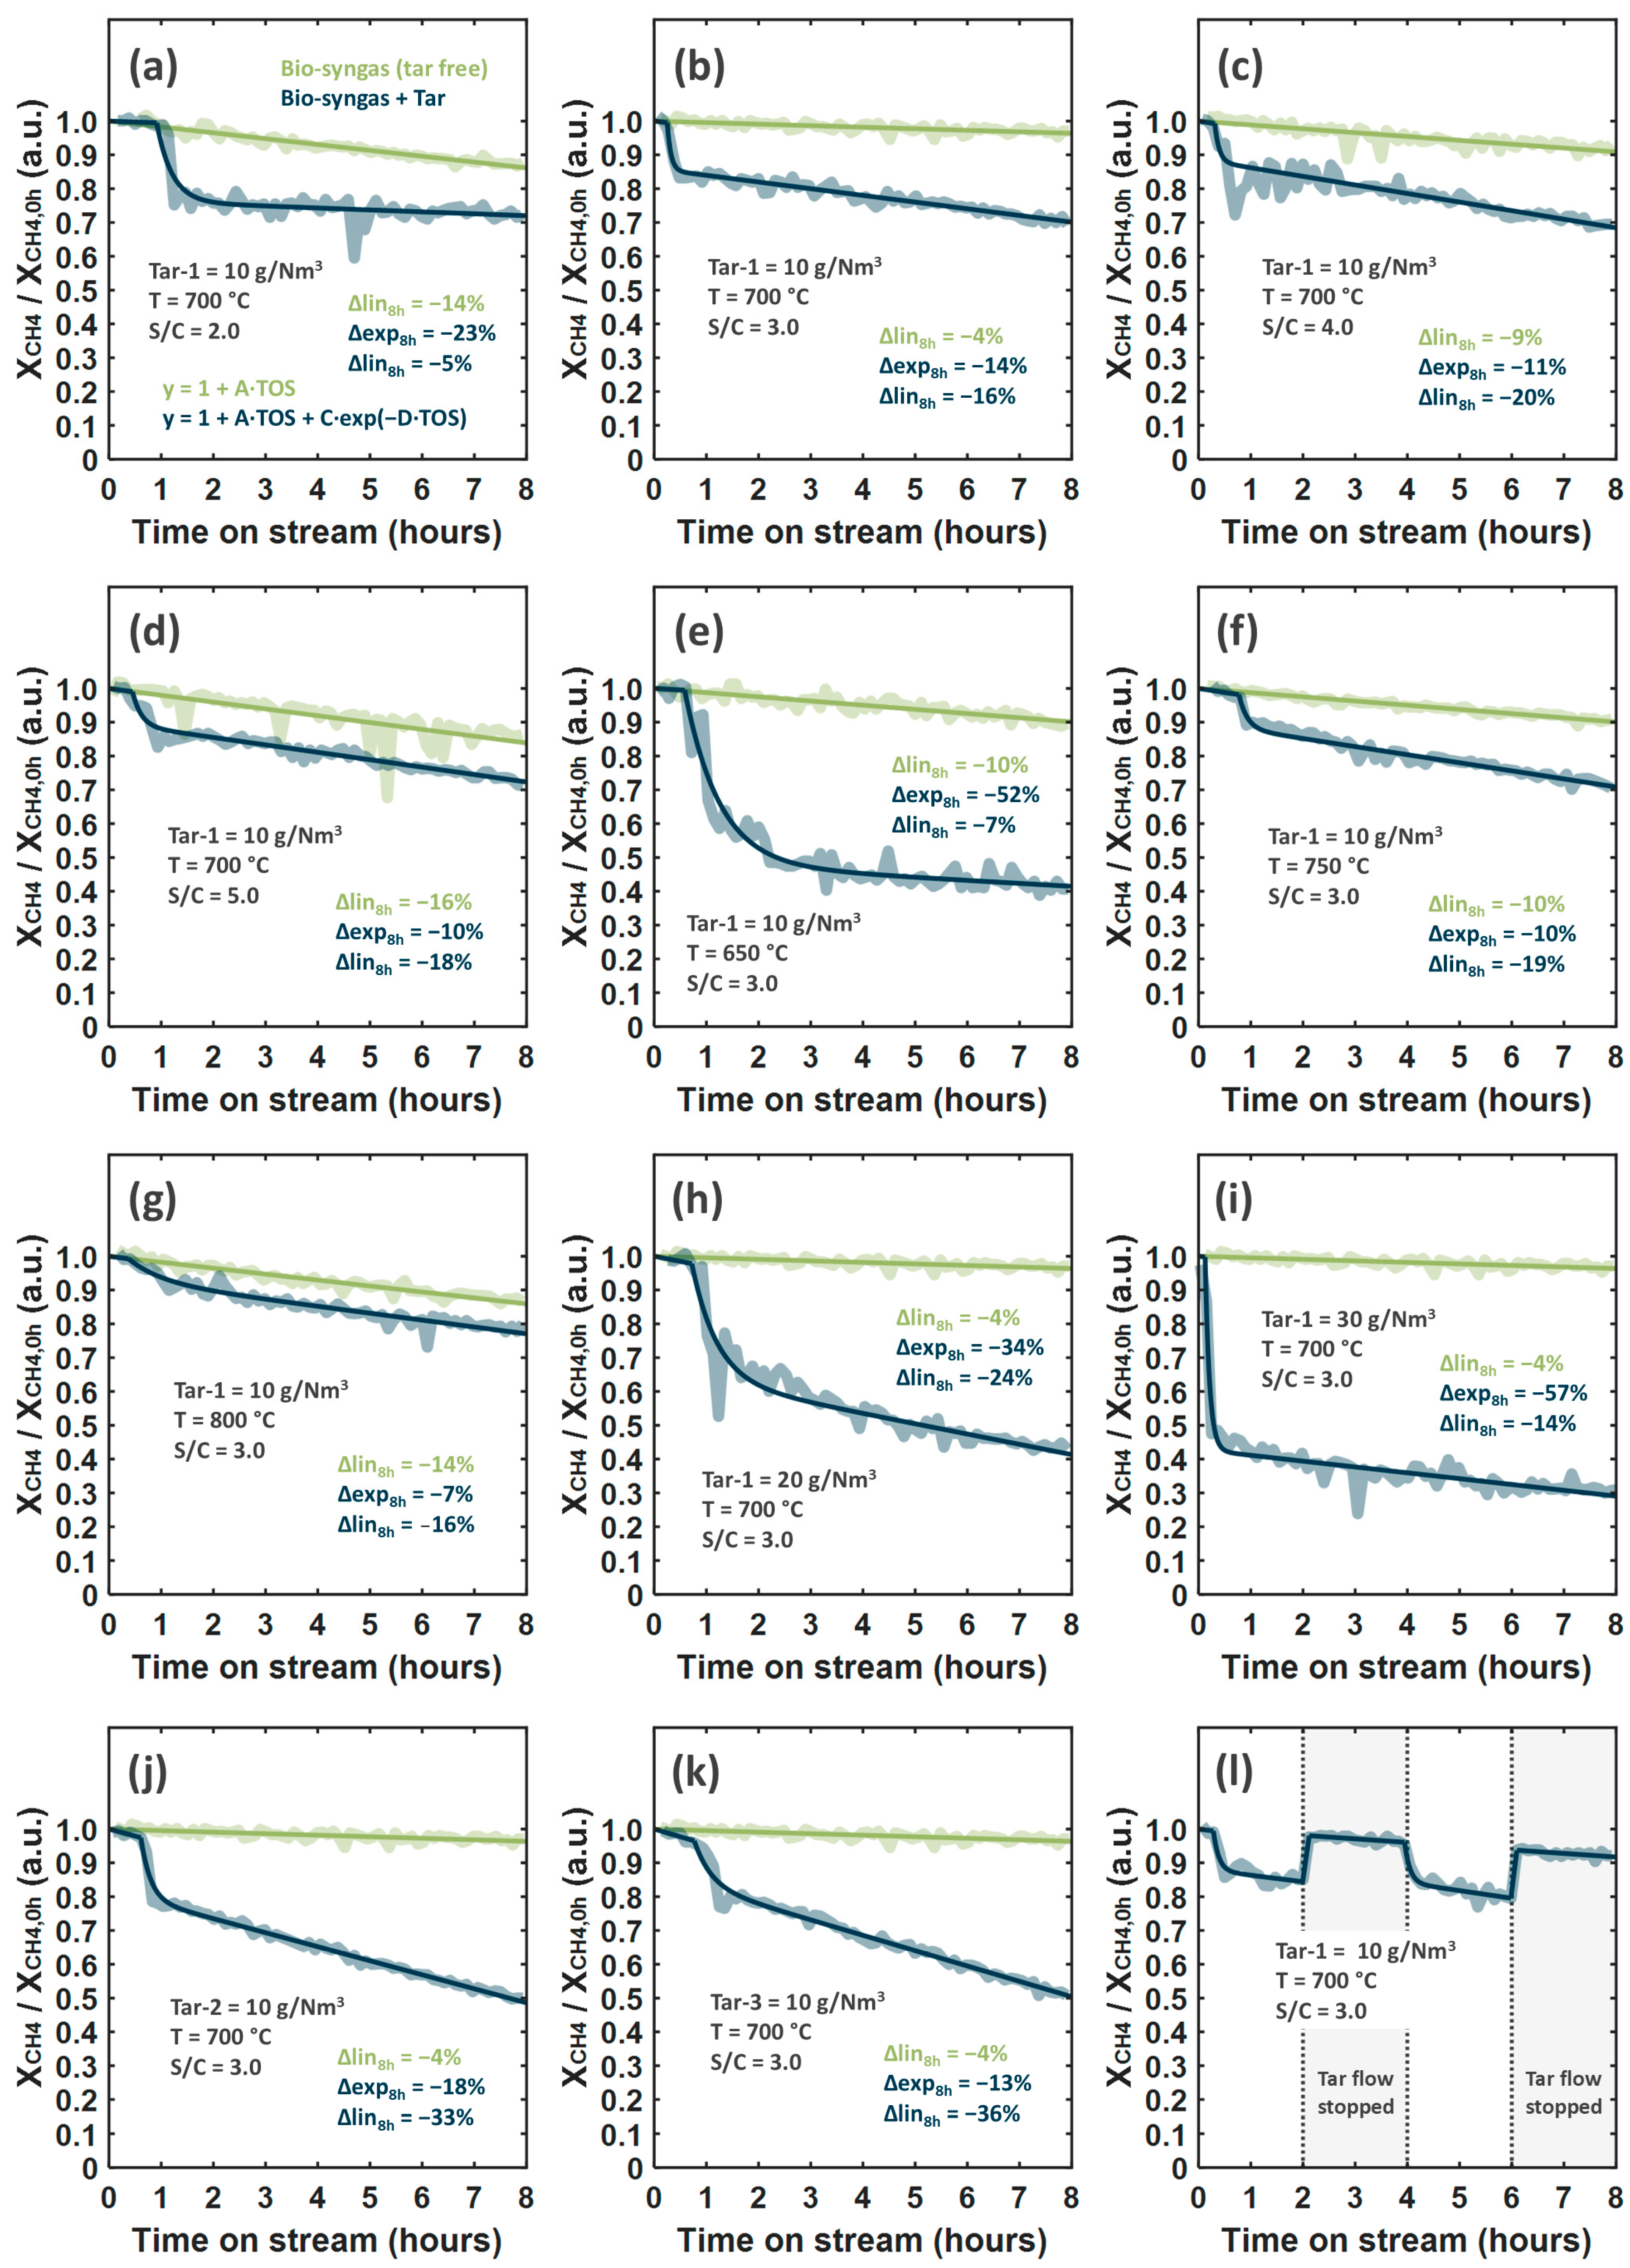
The added tar carbon (around 0.3 mmol/min for Tar-1 = 10 g/Nm3) was generally well accounted for as CH4/CO/CO2 in the effluent flow. The carbon mass balance was 99.6% for all data included (1534 data points, standard deviation = 1.8%), indicating a high-quality feed and product analysis control. The high tar conversion was confirmed by condenser sample analysis, detecting only traces of remaining tar under all conditions (estimated tar conversion well above 99%). The catalyst deactivation was monitored by CH4 conversion. Deactivation curves with and without tar addition are shown in Figure 2, with initial CH4 conversion levels listed in Table 1. Calculated equilibrium CH4 conversions are shown for comparison (assuming complete model tar conversion).
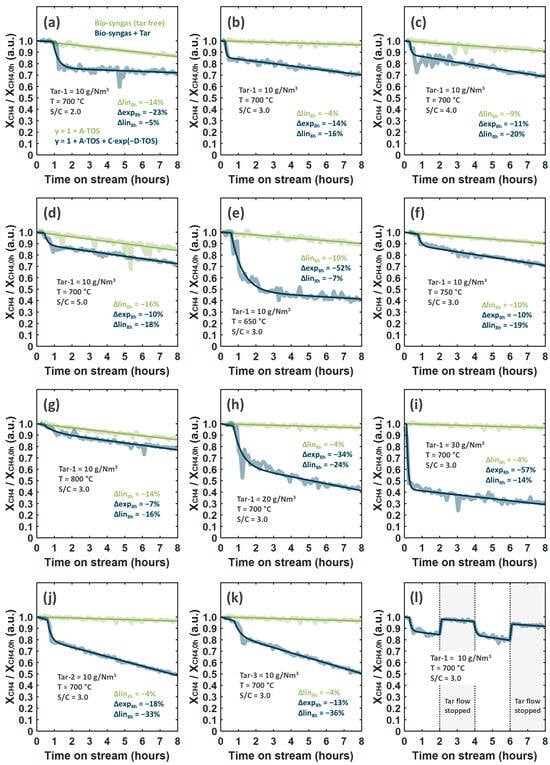
Figure 2.
Deactivation curves in model tar and tar-free syngas environments under different S/C ratios (a–d), temperatures (e–g) and tar loading/composition (h–k) (syngas = 10/35/25/25 mol% CH4/H2/CO/CO2 with 5 mol% N2 internal standard, Ar balance, syngas flow = 400 NmL/min, GHSV = 85,000 NmL/gcatmin, Tar-1 = 100/0/0, Tar-2 = 75/25/0, and Tar-3 = 70/25/5 wt% toluene/1-methylenaphthalene/phenol). Tar addition start/stop experiment (l). Total contributions (TOS = 8 h) from linear (Δlin8h = A∙8∙100%) and exponential (Δexp8h = C∙exp(−D∙8)∙100%) deactivation terms are listed.

Table 1.
Initial steam reforming activity and thermodynamic equilibrium at different operating conditions (syngas = 10/35/25/25 mol% CH4/H2/CO/CO2 with 5 mol% N2 internal standard, Ar balance, syngas flow = 400 NmL/min, GHSV = 85,000 NmL/gcatmin).
Interestingly, limited effects of S/C ratio on the initial reforming activity were found (37–47% CH4 conversion at all conditions). These results included potential effects of the considerably changing H2/CO/CO2 composition (see Section 3.5). This suggested the overall CH4 reaction rate to be independent of H2/CO/CO2/H2O partial pressures. This is in accordance with the previous literature reporting on SMR and DRM reaction rates, respectively, independent of H2O and CO2 partial pressures (Ni/MgO catalyst) [25]. The authors concluded that the CH4 reforming reactions were mechanistically equivalent, with C-H bond activation as the only kinetically relevant reaction step.
The catalyst deactivation through 8 h on stream is shown in Figure 2. The deactivation curves followed simple linear decay functions under tar-free conditions. The deactivation in the tar model environment showed an initial rapid loss of activity before further linear decay. An expected tar addition delay (typically around 30 min) due to the length of the tubing between the syringe pump and the reactor was observed at the beginning of each tar experiment. The initial activity drop was modelled with an exponential decay function (see Figure 2a). The deactivation curves were decomposed, comparing the total contributions (TOS = 8 h) from the linear (Δlin8h = A∙8∙100%) and exponential (Δexp8h = C∙exp(−D∙8)∙100%) terms (listed in Figure 2).
Under tar-free conditions, the lowest deactivation rate was found at 700 °C with S/C = 3. The increasing activity loss was generally expected at higher temperatures and S/C ratios, due to enhanced sintering effects [26]. The increasing deactivation at lower temperatures and S/C ratios was shown to correlate with a small increase in the amount of soft coke species at these conditions (see Section 3.3 and Figure S1 in the Supplementary Materials). The observed deactivation minimum (for tar-free conditions) was proposed to result from the compensation of these factors.
In the presence of model tar, the exponential decay contribution systematically increased with decreasing temperature (7/10/14/52% at 800/750/700/650 °C, S/C = 3, Tar-1 = 10 g/Nm3), decreasing steam concentration (10/11/14/23% at S/C = 5/4/3/2, 700 °C, Tar-1 = 10 g/Nm3), and increasing Tar-1 loading (14/34/57% at Tar-1 = 10/20/30 g/Nm3, 700 °C, S/C = 3). The changing tar composition gave exponential term contributions of 14/18/13% for Tar-1/Tar-2/Tar-3 (10 g/Nm3, 700 °C, S/C = 3). The initial activity drop was shown to be largely reversable (at T = 700 °C, S/C = 3, Tar-1 = 10 g/Nm3) upon stopping the model tar flow (see Figure 2l) and mainly attributed to kinetic active-site inhibition effects from adsorbed model tar and/or tar decomposition products. However, in the previous literature, such rapid initial deactivation has also been associated with the formation of strongly deactivating encapsulating coke species [27]. Under low-temperature (650 °C) and low-steam (S/C = 2) conditions, the high initial activity loss was accompanied by low linear decay contributions (7% and 5% respectively), suggesting that equilibrium amounts of such strongly deactivating coke species were formed within 2–4 h under these conditions. The low linear decay deactivation terms could be explained by the presence of rapidly encapsulated metal particles unavailable for further deactivation by coke formation and/or sintering. Such behavior (high Δexp8h accompanied with low Δlin8h) was similarly observed under high tar-loading conditions (Tar-1 = 30 g/Nm3, 700 °C, S/C = 3), where high surface carbon concentrations are expected.
No simple trend was observed for the linear deactivation term at higher temperatures (16/19/16% at 700/750/800 °C, S/C = 3, Tar-1 = 10 g/Nm3). This was similarly the case at higher steam concentrations (16/20/18% at S/C = 3/4/5, 700 °C, Tar-1 = 10 g/Nm3). These net deactivation rates under different temperature and steam conditions are expected to have resulted from the overall effects on sintering, metal oxidation, and coke formation. Increasing the tar loading from 10 to 20 g/Nm3 (at 700 °C, S/C = 3) resulted in a considerably increasing linear decay contribution (from 16% to 24%). This was similarly the case with more complex model Tar-2 and Tar-3 (33% and 36%, respectively). It should be noted that the effects of carbon filament formation without the blocking of metal particle active sites cannot be evaluated through such activity data alone [28].
3.3. Coke Characterization
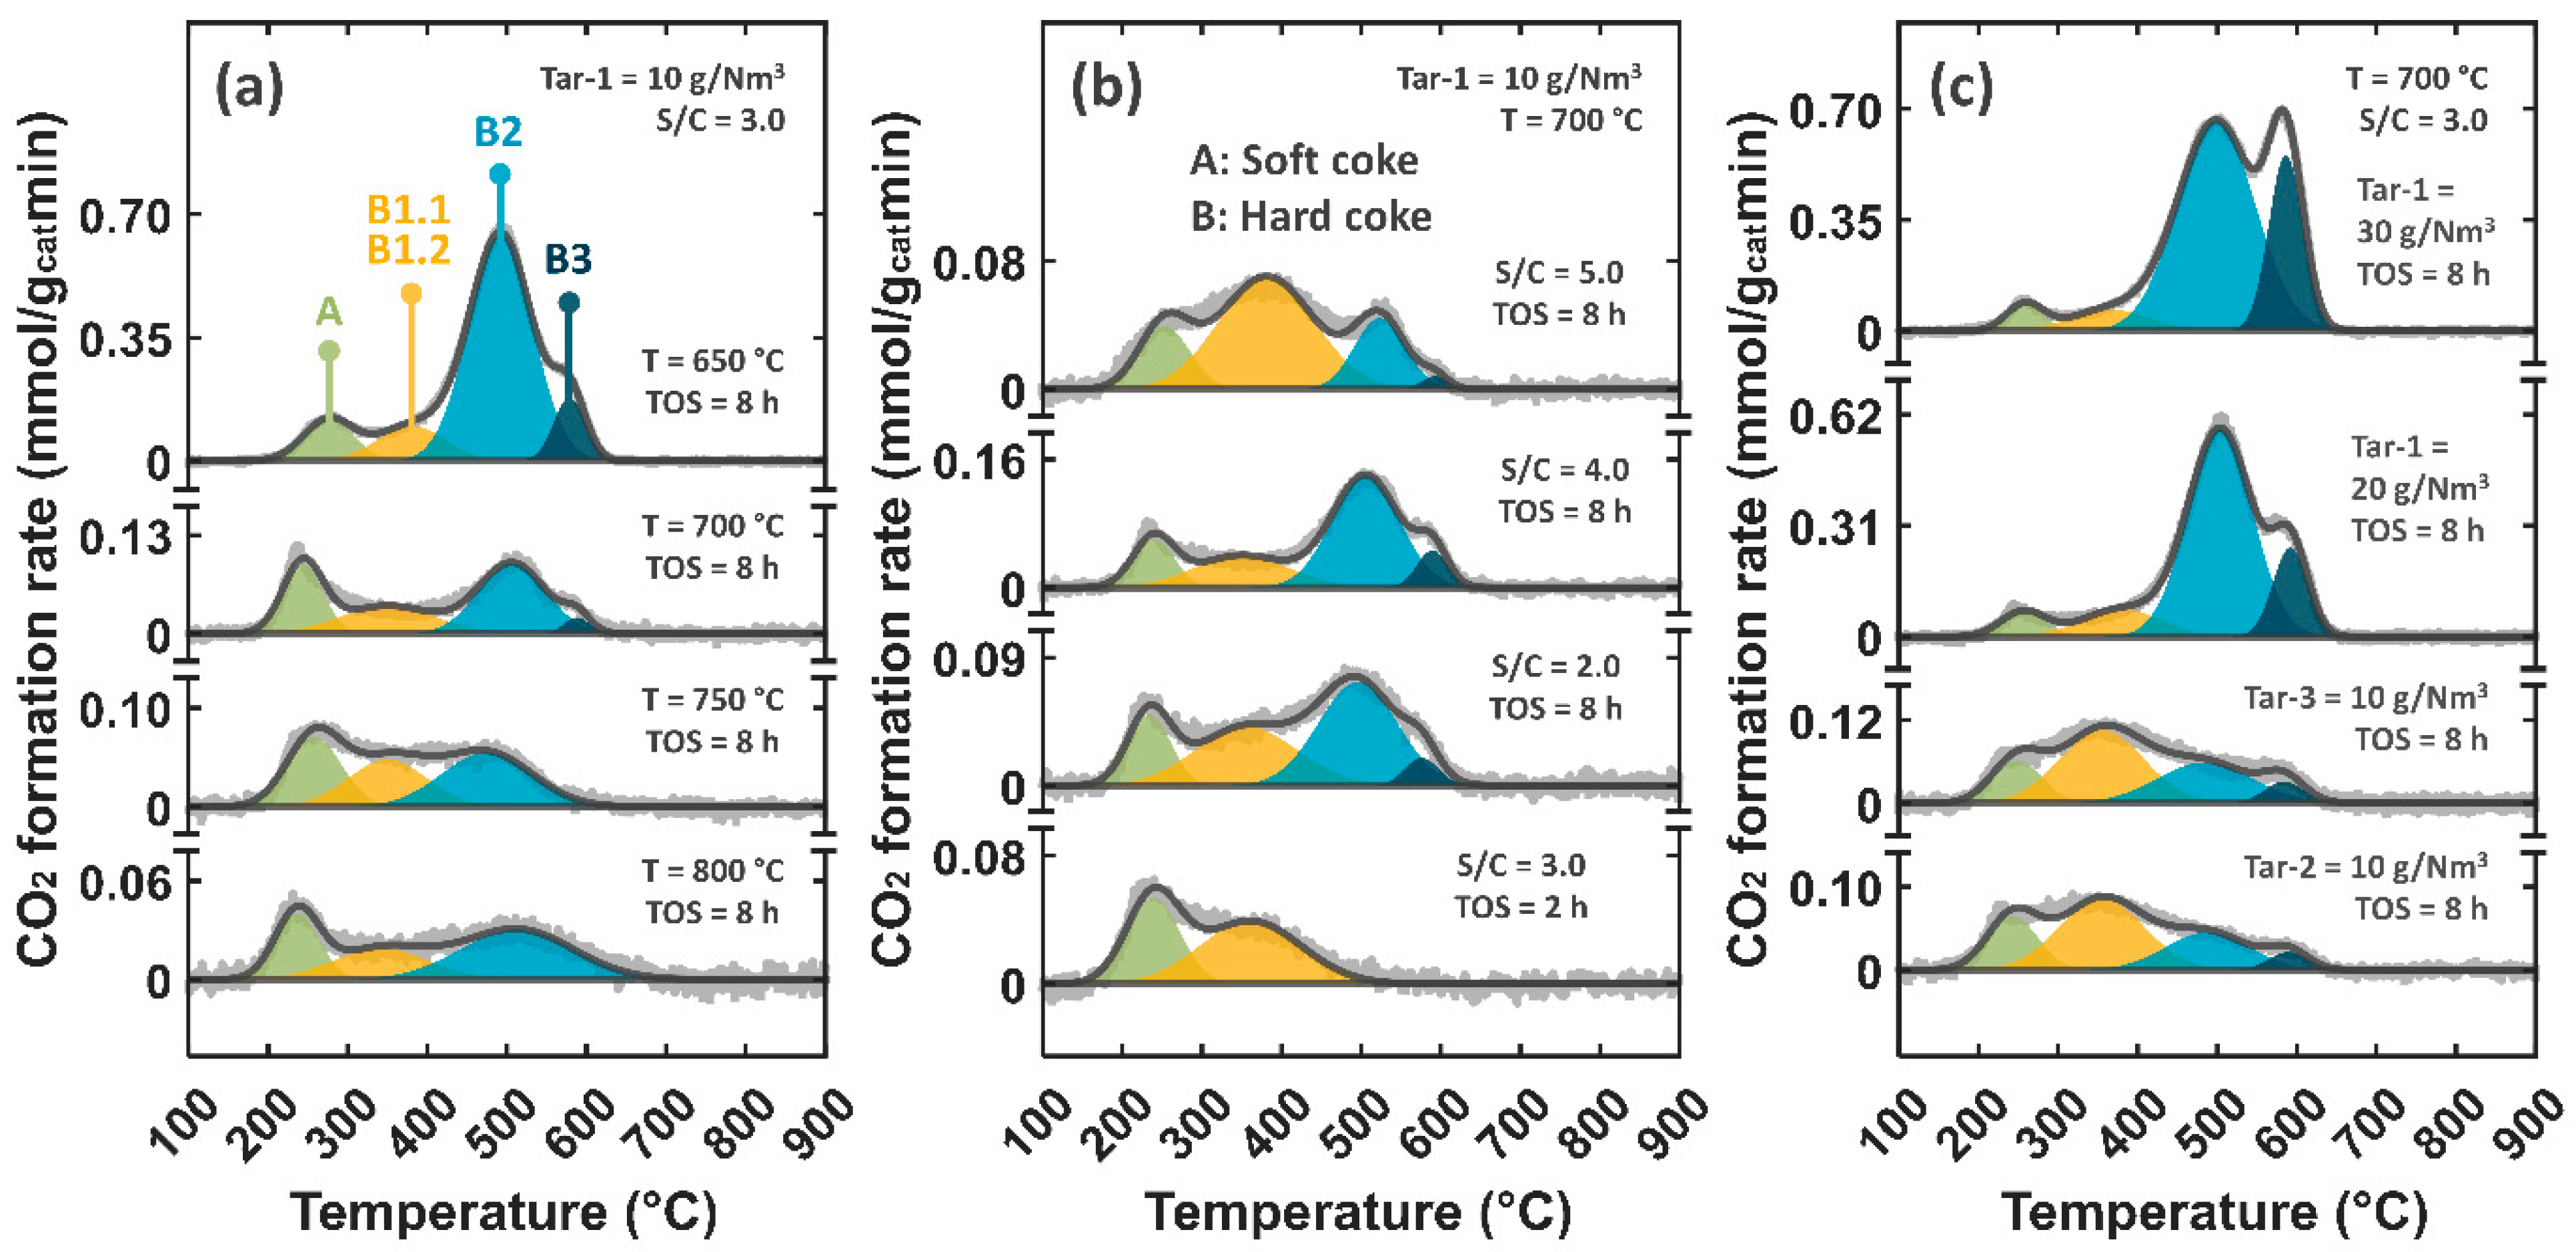
The CO2 formation in post-run TPO-MS coke combustion experiments is shown in Figure 3 (with model tar) and Figure S1 (tar free conditions) in the Supplementary Materials. The coke carbon quantities listed in Table 2 were estimated from the observed CO2 formation by calibration of the MS-detector, considering the thermal decomposition of calcium oxalate monohydrate (third degradation step: CaCO3 → CaO + CO2). The MS calibration curve is shown in Figure S2, with a proportional peak area response (R2 = 0.9997) in a broad CO2 formation range. This approach avoids the issue of metal oxidation potentially masking the coke combustion mass change commonly associated with thermogravimetric coke analysis. The CO2 formation peaks from TPO-MS experiments were broadly classified as low-temperature soft coke (between 180–330 °C) and hard coke species at higher temperatures, in accordance with the previous literature [29]. The peak deconvolution (Gaussian peaks) showed that the CO2 formation profiles were well described by four main coke combustion bands (see Figure 3). The low-temperature type A soft coke band (peak maximum: 225–316 °C) was attributed to less-developed strongly adsorbed carbonaceous decomposition products [29]. Two broad hard coke combustion bands B1 (peak maximum: 342–381 °C) and B2 (peak maximum: 475–523 °C) with a high temperature shoulder peak B3 (peak maximum: 576–593 °C) were additionally observed.
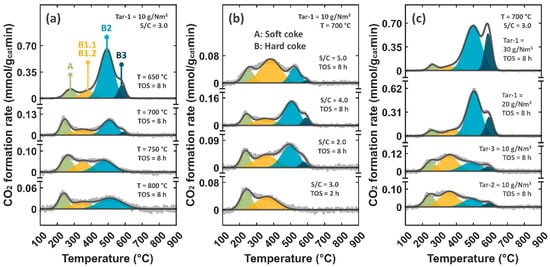
Figure 3.
Post-run CO2 formation in TPO-MS coke combustion experiments following model tar steam reforming at different temperatures (a), S/C ratios (b) and tar loading/composition (c) (syngas = 10/35/25/25 mol% CH4/H2/CO/CO2 with 5 mol% N2 internal standard, Ar balance, syngas flow = 400 NmL/min, GHSV = 85,000 NmL/gcatmin, Tar-1 = 100/0/0, Tar-2 = 75/25/0, and Tar-3 = 70/25/5 wt% toluene/1-methylenaphthalene/phenol). Soft coke combustion band A and hard coke combustion bands B1, B2 and B3 were assigned as indicated (a).
Table 2.
Coke characteristics from TPO-MS analysis and Raman spectroscopy following model tar steam reforming at different operating conditions (syngas = 10/35/25/25 mol% CH4/H2/CO/CO2 with 5 mol% N2 internal standard, Ar balance, syngas flow = 400 NmL/min, GHSV = 85,000 NmL/gcatmin).
After tar-free operation, only small amounts of type A soft coke (0.5–1.4 wt%) were found (see Figure S1 and Table 2). The soft coke amounts after tar-free operation generally increased with decreasing temperature and S/C ratio. The increasing amounts were accompanied by a small high-temperature shift in the soft coke combustion band (see Figure S1). The amount of type A soft coke following tar reforming was also low for all samples (0.5–2.2 wt%), despite the considerably changing total coke content (see Table 2).
Raman spectroscopy of the coked samples after model tar reforming is shown in Figure S3 in the Supplementary Materials. Strong D and G carbon bands were observed around 1325 and 1590 cm−1 for all samples. The low-abundancy soft coke species found after tar-free operation (Figure S1) were not detected in the Raman spectroscopy. The D band generally indicates the presence of disordered and defective carbon, like microcrystalline graphite or unstructured aromatic species [28,30]. The G band is similarly attributed to more ordered graphitic structures. The D/G peak intensity ratios are listed in Table 2.
After tar reforming at 700–750 °C (S/C = 3) and S/C ratio 2–4 (700 °C), the post-run TPO-MS showed similar CO2 formation profiles (see Figure 3) and coke carbon amounts (4.6–6.5 wt%), with no critical low S/C ratio limit within the tested range. Similar D/G band intensity ratios (1.99–2.05) were found in the Raman spectroscopy for the same samples (see Table 2). At higher temperatures (750–800 °C), the B3 hard coke combustion shoulder peak completely disappeared (see Figure 3a). At 800 °C, this was accompanied by a reduced total coke carbon amount (to 2.4 wt%) and there was a broadening of the B2 hard coke combustion band towards higher temperatures. The D/G ratio was additionally reduced (to 1.27), suggesting a higher degree of graphitization of the remaining coke species compared with the lower-temperature samples. The high-steam sample (S/C = 5) similarly showed reduced amounts of B2 (0.9 wt%) and B3 (0.1 wt%) hard coke (Figure 3b). This was, however, at the expense of enhanced formation of B1 coke species (2.7 wt%). The total coke amount and D/G ratio were similar to the S/C ratio 2–4 samples (see Table 2).
A critical low-temperature limit was found around 650 °C, where the amount of all coke species considerably increased (22.5 wt% total coke carbon). The carbon formation clearly favored at lower temperatures indicated catalytic (not pyrolytic) coke formation pathways [6]. The effect was most prominent for the B2 hard coke, increasing to 15.5 wt% (from 2.3 wt% at 700 °C). Similarly, the coke amount increased from 5.2 to 20.8 wt% upon doubling the Tar-1 flow (from 10 to 20 g/Nm3). The coke content further increased to 29.7 wt% with a Tar-1 loading of 30 g/Nm3. All high-coking samples showed similar levels of B1 hard coke (2.0–2.6 wt%), and the main contribution to the high amounts of coke were increasing levels of B2 (14.0–19.4 wt%) and B3 (2.2–7.1 wt%) coke. These samples additionally showed slightly lower D/G ratios (1.78–1.85), decreasing with increasing amounts of B2 + B3 coke, indicating a higher degree of graphitization of the B2/B3 hard coke species (compared with B1 coke). Interestingly, the low-temperature (650 °C) and intermediate Tar-1 loading (20 g/Nm3) samples showed similar B1/B2/B3 coke distributions (2.6/15.5/2.2 and 2.3/14.0/3.3 wt%, respectively) and overall deactivation (58–59%, TOS = 8 h, Figure 2). However, the low-temperature sample deactivated more rapidly within the initial 3 h on stream (Δexp8h = 52%). In the case of intermediate Tar-1 loading (at 700 °C), the catalyst deactivated more gradually (Δlin8h = 24%), and it is reasonable to believe that the coke accumulated throughout the 8 h on stream. The coke formation delay, despite the double Tar-1 loading, again indicated that the coke gasification and/or surface carbon (coke precursor) removal rates were considerably enhanced at 700 °C (compared with 650 °C).
The samples corresponding to the temperature and S/C ratio extremes were analyzed by STEM. Frequently observed structures were interpreted as filamentous carbon species (Figure 4), fresh catalyst (Figure 5a,b), sintered metal particles (Figure 5c,d), carbon filament graphitization (Figure 5e), and encapsulating coke species (Figure 5f). The unedited STEM images are shown in Figures S4–S16 in the Supplementary Materials. The diameters of the carbon filaments were measured (254–299 filaments), showing dynamically changing filament diameter distributions (see Figure 4). At low-temperature (650 °C) and low-steam (S/C ratio = 2) conditions, filament formation was limited to the lower-diameter 10–30 nm range (89–97%, filament count basis). At intermediate temperature/steam conditions (700 °C, S/C ratio = 3), the formation of larger filaments in the 30–50 nm range (32%, 65% in 10–30 nm range) was clearly observed (Figure 4b). The filament diameter is generally considered to reflect the size of the metal particle from which the filament grows [31]. Here, the broader filament diameter distribution under intermediate temperature/steam conditions is suggested to have resulted from the availability of larger metal particles due to enhanced sintering effects. After 2 h on stream at 700 °C (S/C ratio = 3), only scattered, less-developed filament structures were found (Figure 4a). This initial filament growth was limited to the small-diameter range (91% below 10 nm), indicating larger-diameter filament growth initiation as sintering proceeded through the 8 h experiment. It is worth noting that the broader filament diameter selectivity at 700 °C was not accompanied by an increasing coke amount, compared with the high-coking 650 °C sample. At high-temperature (800 °C) and high-steam (S/C ratio = 5) conditions, the observed filaments were again limited to the lower-diameter 10–30 nm range (89–99%). This can be explained by the enhanced coke gasification rates increasing the filament growth initiation threshold, limiting filament formation to the smaller, most active metal particles with higher surface area and density of steps, shorter diffusion length, and higher diffusion flux area (bulk diffusion filament growth model) [27]. The overall findings suggest a dynamic temperature/steam effect on the filament diameter distribution, resulting from metal particle size availability (sintering effects) and filament size selectivity (filament growth initiation threshold).
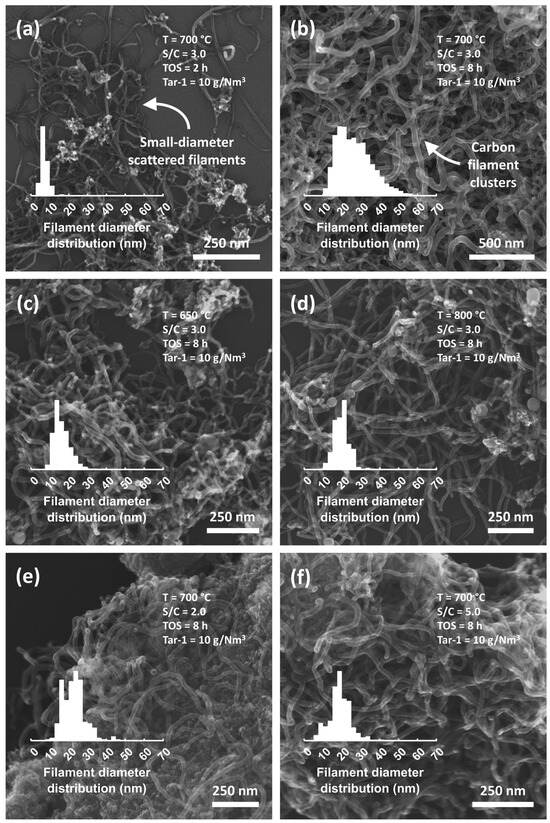
Figure 4.
STEM images of initial small-diameter scattered filaments (a) and carbon filament clusters (b–f) with filament diameter distributions, at different operating conditions (syngas = 10/35/25/25 mol% CH4/H2/CO/CO2 with 5 mol% N2 internal standard, Ar balance, syngas flow = 400 NmL/min, GHSV = 85,000 NmL/gcatmin, Tar-1 = toluene).

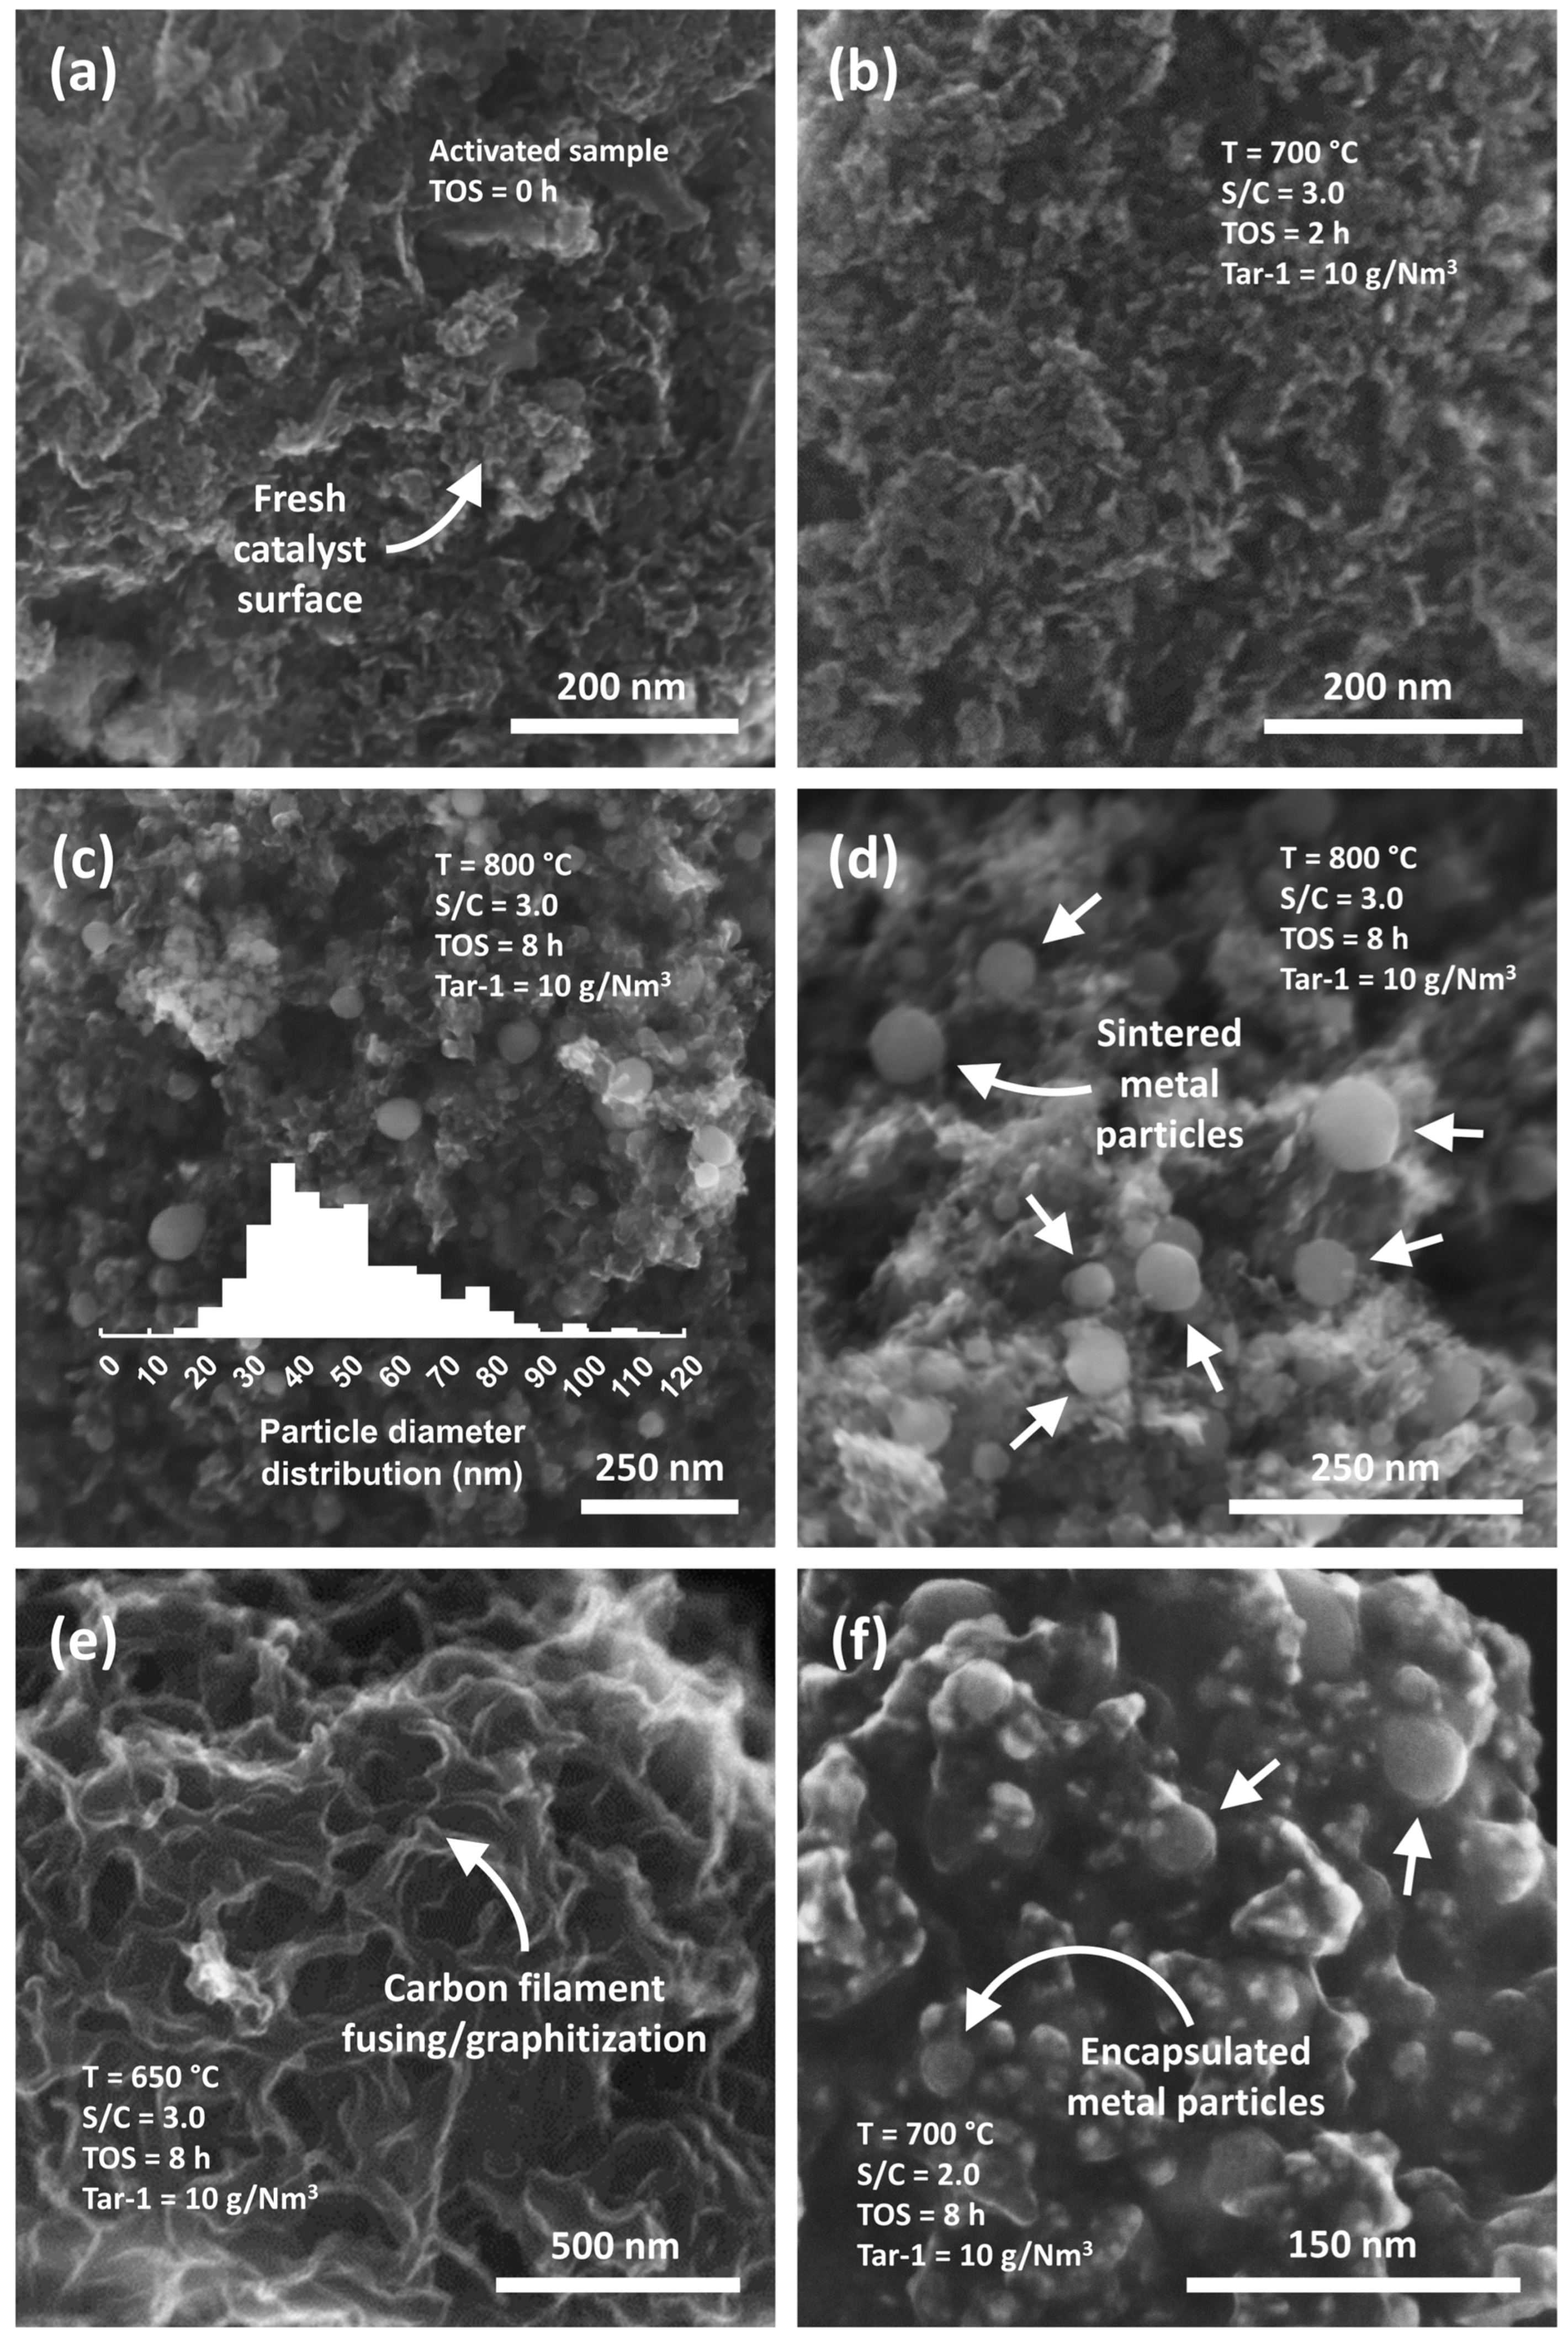
Figure 5.
STEM images of (a,b) fresh catalyst structures (c,d) sintered metal particles (e) partly fused/graphitized carbon filaments, and (f) bulk encapsulating coke, at different operating conditions (syngas = 10/35/25/25 mol% CH4/H2/CO/CO2 with 5 mol% N2 internal standard, Ar balance, syngas flow = 400 NmL/min, GHSV = 85,000 NmL/gcatmin, Tar-1 = toluene).
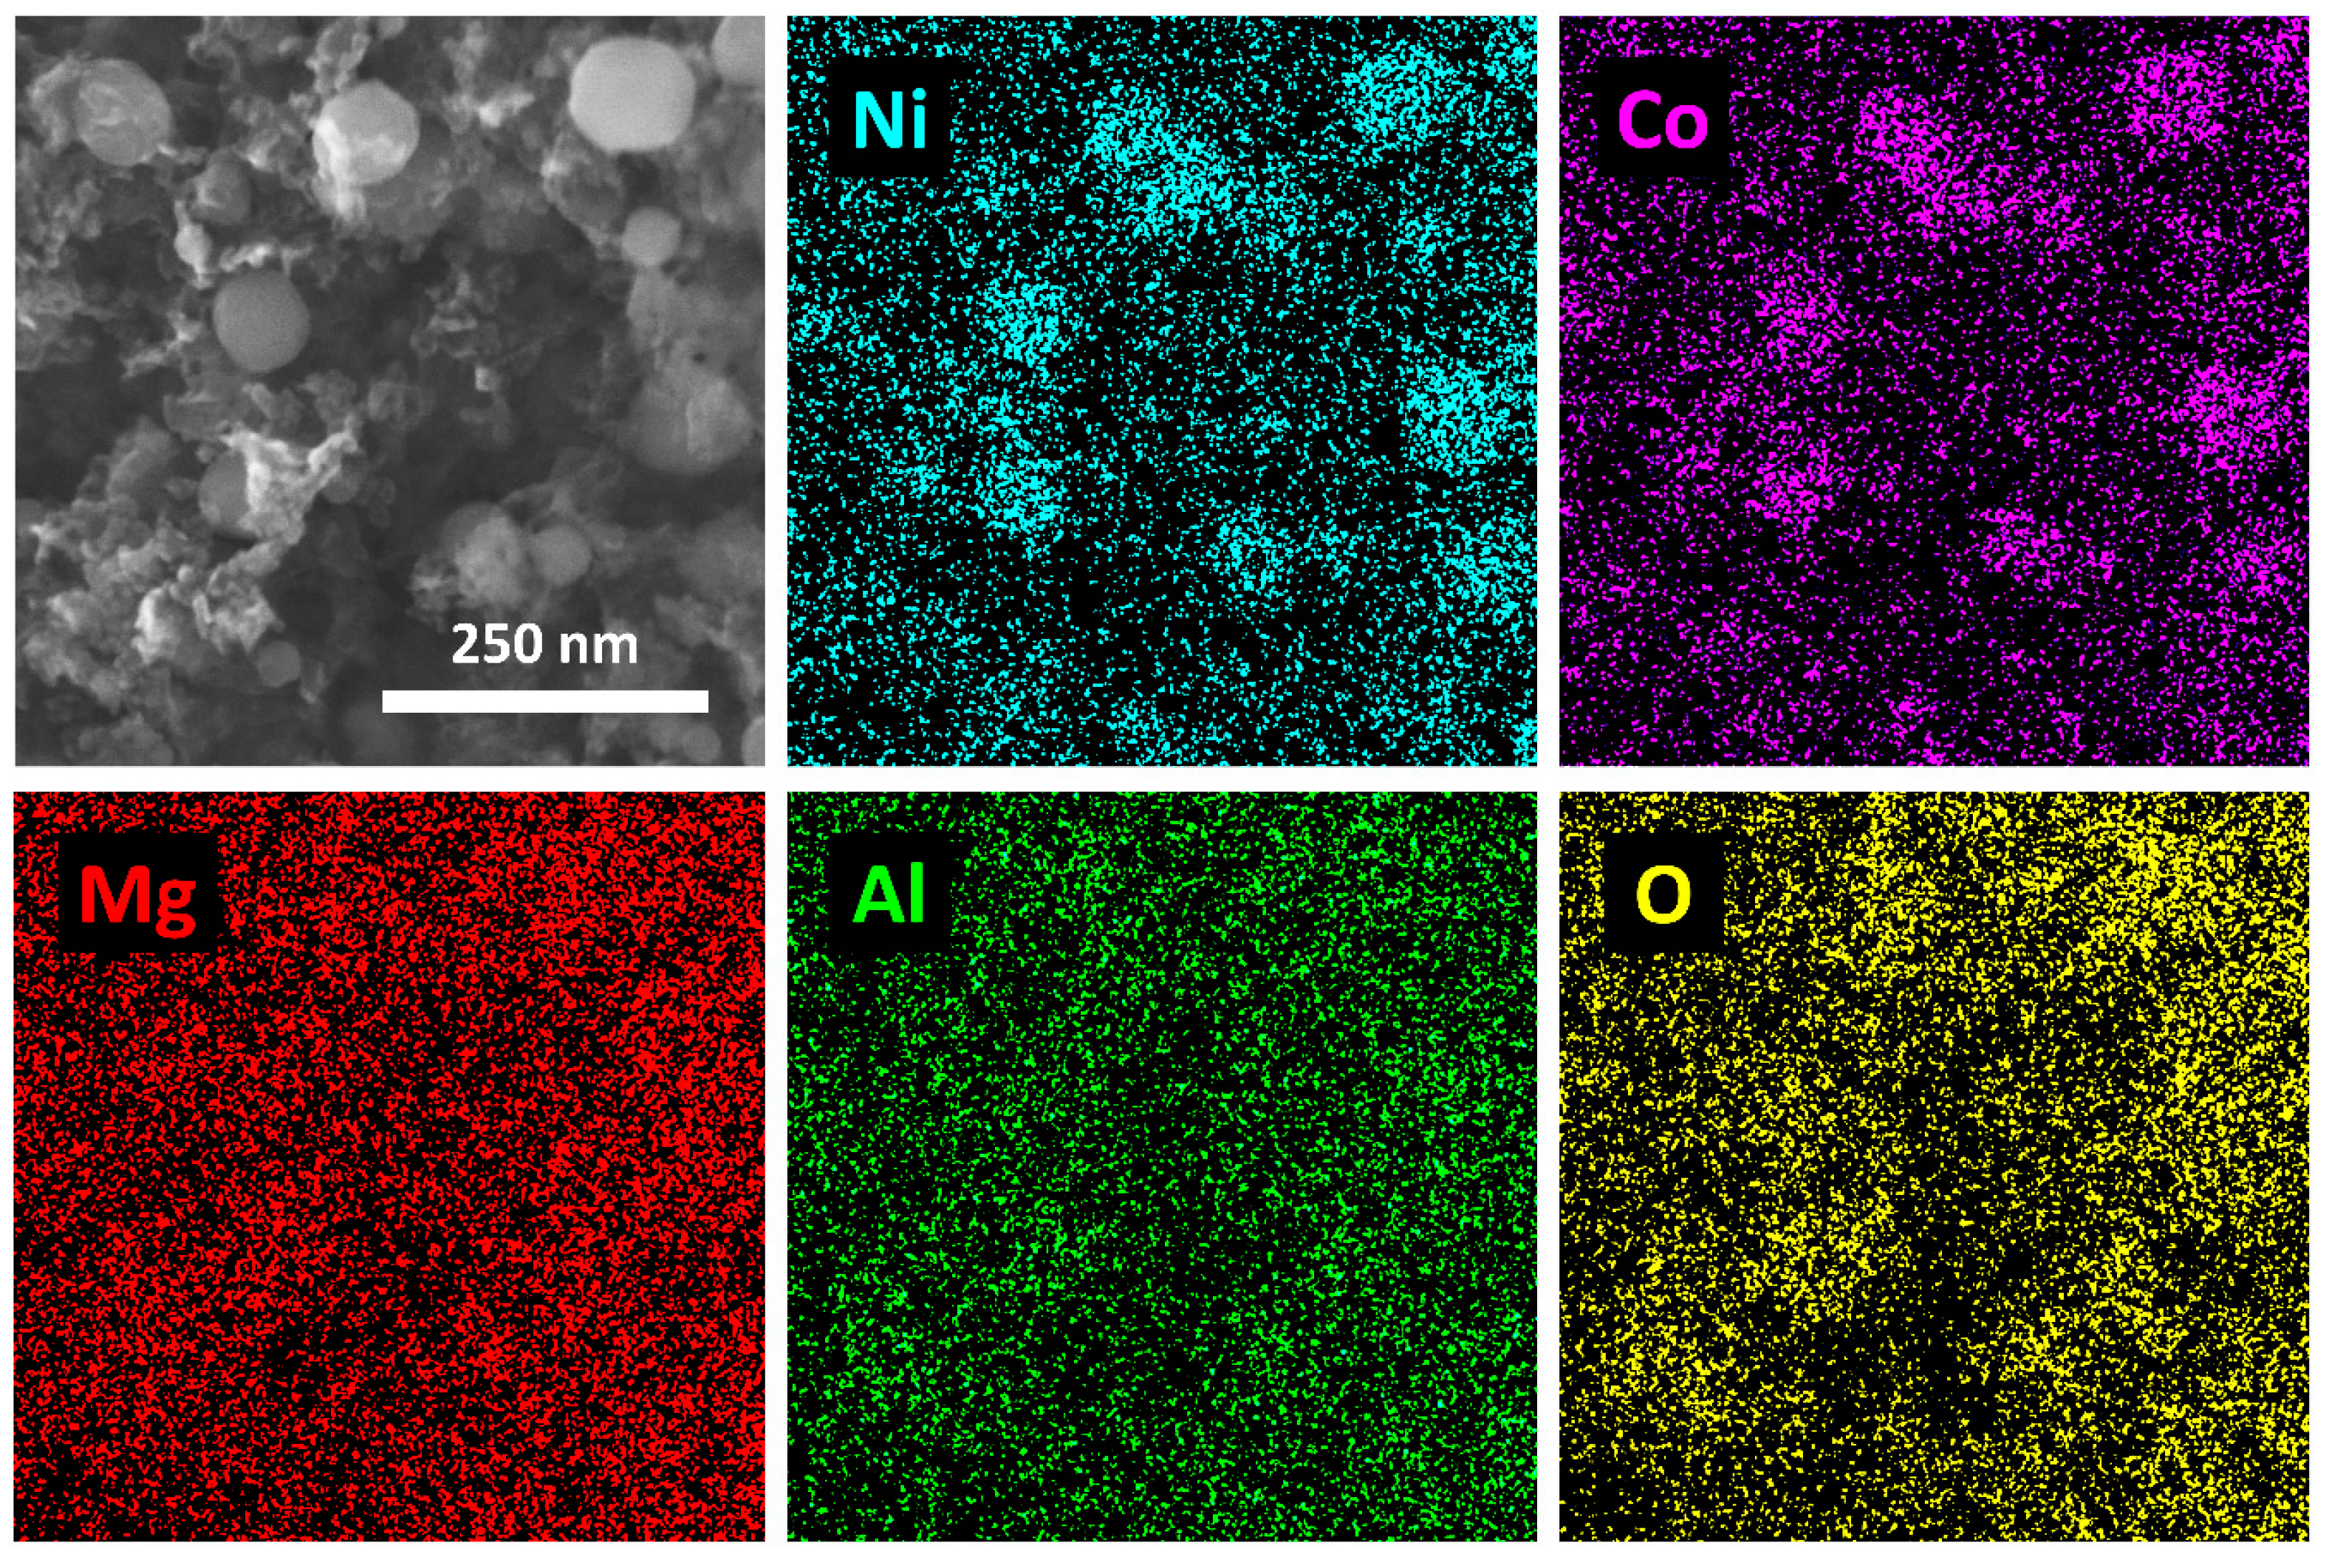
The formation of larger metal particles after 8 h on stream was observed in all samples analyzed by STEM. This was particularly evident in the high-temperature (800 °C) sample (low-coking), where large-diameter, non-encapsulated metal particles (attached to support structures) were frequently observed (Figure 5c,d). EDS elemental mapping showed the co-location of Ni and Co within the observed metal particles, with Mg, Al, and O evenly distributed in the Mg(Al)O support (Figure 6). EDS elemental point scanning showed a Ni/Co ratio of 1.2 (22 particles measured, standard deviation = 0.1), close to the previously reported bulk value found by ICP-MS (1.05) [23]. These findings showed that the Ni/Co alloy particles (and Ni/Co ratio) were maintained, without considerable active metal segregation, even under high-sintering, high-temperature conditions.
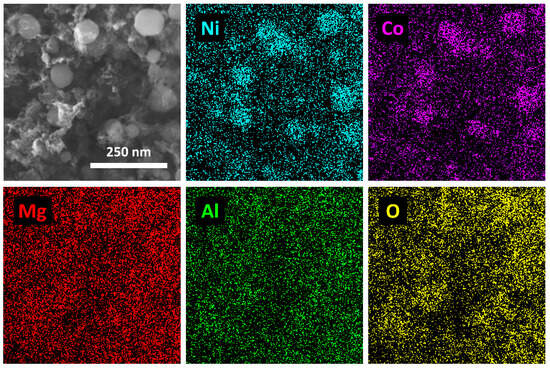
Figure 6.
EDS elemental mapping with Ni/Co co-location in metal particles (syngas = 10/35/25/25 mol% CH4/H2/CO/CO2 with 5 mol% N2 internal standard, Ar balance, syngas flow = 400 NmL/min, GHSV = 85,000 NmL/gcatmin, tar model = 10 g/Nm3 toluene, 800 °C, S/C = 3.0).
After activation and passivation (TOS = 0 h), only crumbled fresh catalyst structures were observed (Figure 5a), and no carbon species were found by Raman spectroscopy or TPO-MS. The absence of observable metal particles was explained by the initial high dispersion (mean particle diameter = 15.4 nm, from H2 chemisorption, assuming complete Ni/Co reduction) [23], with metal particles not easily observed via the STEM setup. After 2 h on stream (tar reforming, 700 °C, S/C = 3), such catalyst structures without large-diameter metal particles were similarly observed (Figure 5b).
Interestingly, only the B1 hard coke combustion band was observed by TPO-MS after 2 h of tar reforming (see Figure 3b), and it is reasonable to believe that the observed scattered small-diameter filaments (Figure 4a) were embedded in the B1 combustion band (labelled B1.1 hard coke). Generally, coke combustion temperature variations are explained by two key mechanisms. Firstly, coke located in close proximity to (or on) metal particles is expected to combust at lower temperatures due to the availability of active sites catalyzing coke combustion reactions [32]. High-temperature combustion bands can be associated with coke deposition on the catalyst support (un-catalyzed combustion). Secondly, lower-temperature coke combustion is generally expected for amorphous carbon species, compared with filamentous and graphitic structures burning at higher temperatures. Moreover, high-temperature combustion is also observed for highly encapsulating coke species completely blocking metal particle active sites [31]. The low-temperature combustion of type B1.1 small-diameter carbon filaments may be rationalized if coke combustion is effectively catalyzed by largely available metal particles.
Additional coke structures frequently observed were partly fused (or graphitized) carbon filament clusters (Figure 5e) and largely encapsulated regions with metal particles completely covered in coke species (Figure 5f). The latter bulk-encapsulating carbon is suggested to form through filament cluster fusing. Such progressive graphitization of filamentous carbon has been described by Montero et al. [28], with strong deactivation effects through extensive bulk encapsulation of metal particles and blocking of catalyst pores. The progressive filament growth and graphitization was accompanied by a shift of the coke combustion peak maximum to higher temperatures (from 500 to 552° C), similar to the B2 (475–523 °C) vs. B3 (576–593 °C) combustion temperatures reported herein. The strong deactivation under high Tar-1 loading conditions (see Figure 2h,i) accompanied by increasing amounts of B3 hard coke and decreasing D/G ratios (Table 2) support the assignment of type B3 coke among the highly encapsulating graphitic coke species. The overall results suggest a coke formation mechanism from initial growth of small-diameter scattered filaments (B1.1) towards larger-diameter filament clusters and fused filaments (B2). Finally, strongly deactivating bulk-encapsulating coke species (B3) form through progressive filament cluster graphitization.
The tar composition tests showed enhanced formation of B1 hard coke for the model Tar-2 and Tar-3 (see Figure 3c). The total coke amounts (6.0–7.2 wt%) were similar to the Tar-1 scenario (5.2 wt%), but with considerably higher deactivation rates (Figure 2j,k), indicating the formation of strongly deactivating encapsulating coke (labelled B1.2 hard coke). Such metal particle encapsulation is generally considered to occur through polymerization of surface carbon species [27]. The higher D/G ratio (2.20–2.23) and the low coke combustion temperature indicate the more amorphous nature of the B1.2 hard coke. Such a shift towards amorphous coke upon naphthalene/toluene steam reforming (from filamentous carbon with pure toluene) has previously been reported for Ni/Mg(Al)O hydrotalcite-derived catalysts [33]. The phenol (5 wt%) in model Tar-3 showed little effect on deactivation and coke distribution, and it is reasonable to conclude that the enhanced B1.2 coke formation can be attributed to the higher-molecular-weight tar (1-methylenaphthalene).
The shift towards B1 coke under high steam (S/C = 5) conditions was not accompanied by a higher rate of deactivation (Figure 2d) and was attributed to enhanced formation of type B1.1 coke species. Still, larger diameters of carbon filaments (10–30 nm) were frequently observed via STEM (see Figure 4f). The total coke carbon amount (4.5 wt%) was similar to the results at lower S/C ratios (4.9–6.5 wt%). The overall results suggested that the high-steam conditions suppressed the filament-aging pathways like cluster graphitization and bulk encapsulation (B2 and B3 coke formation), leaving more scattered filament structures with metal particles largely available for lower-temperature (B1.1) coke combustion.
3.4. Coke Formation Scheme
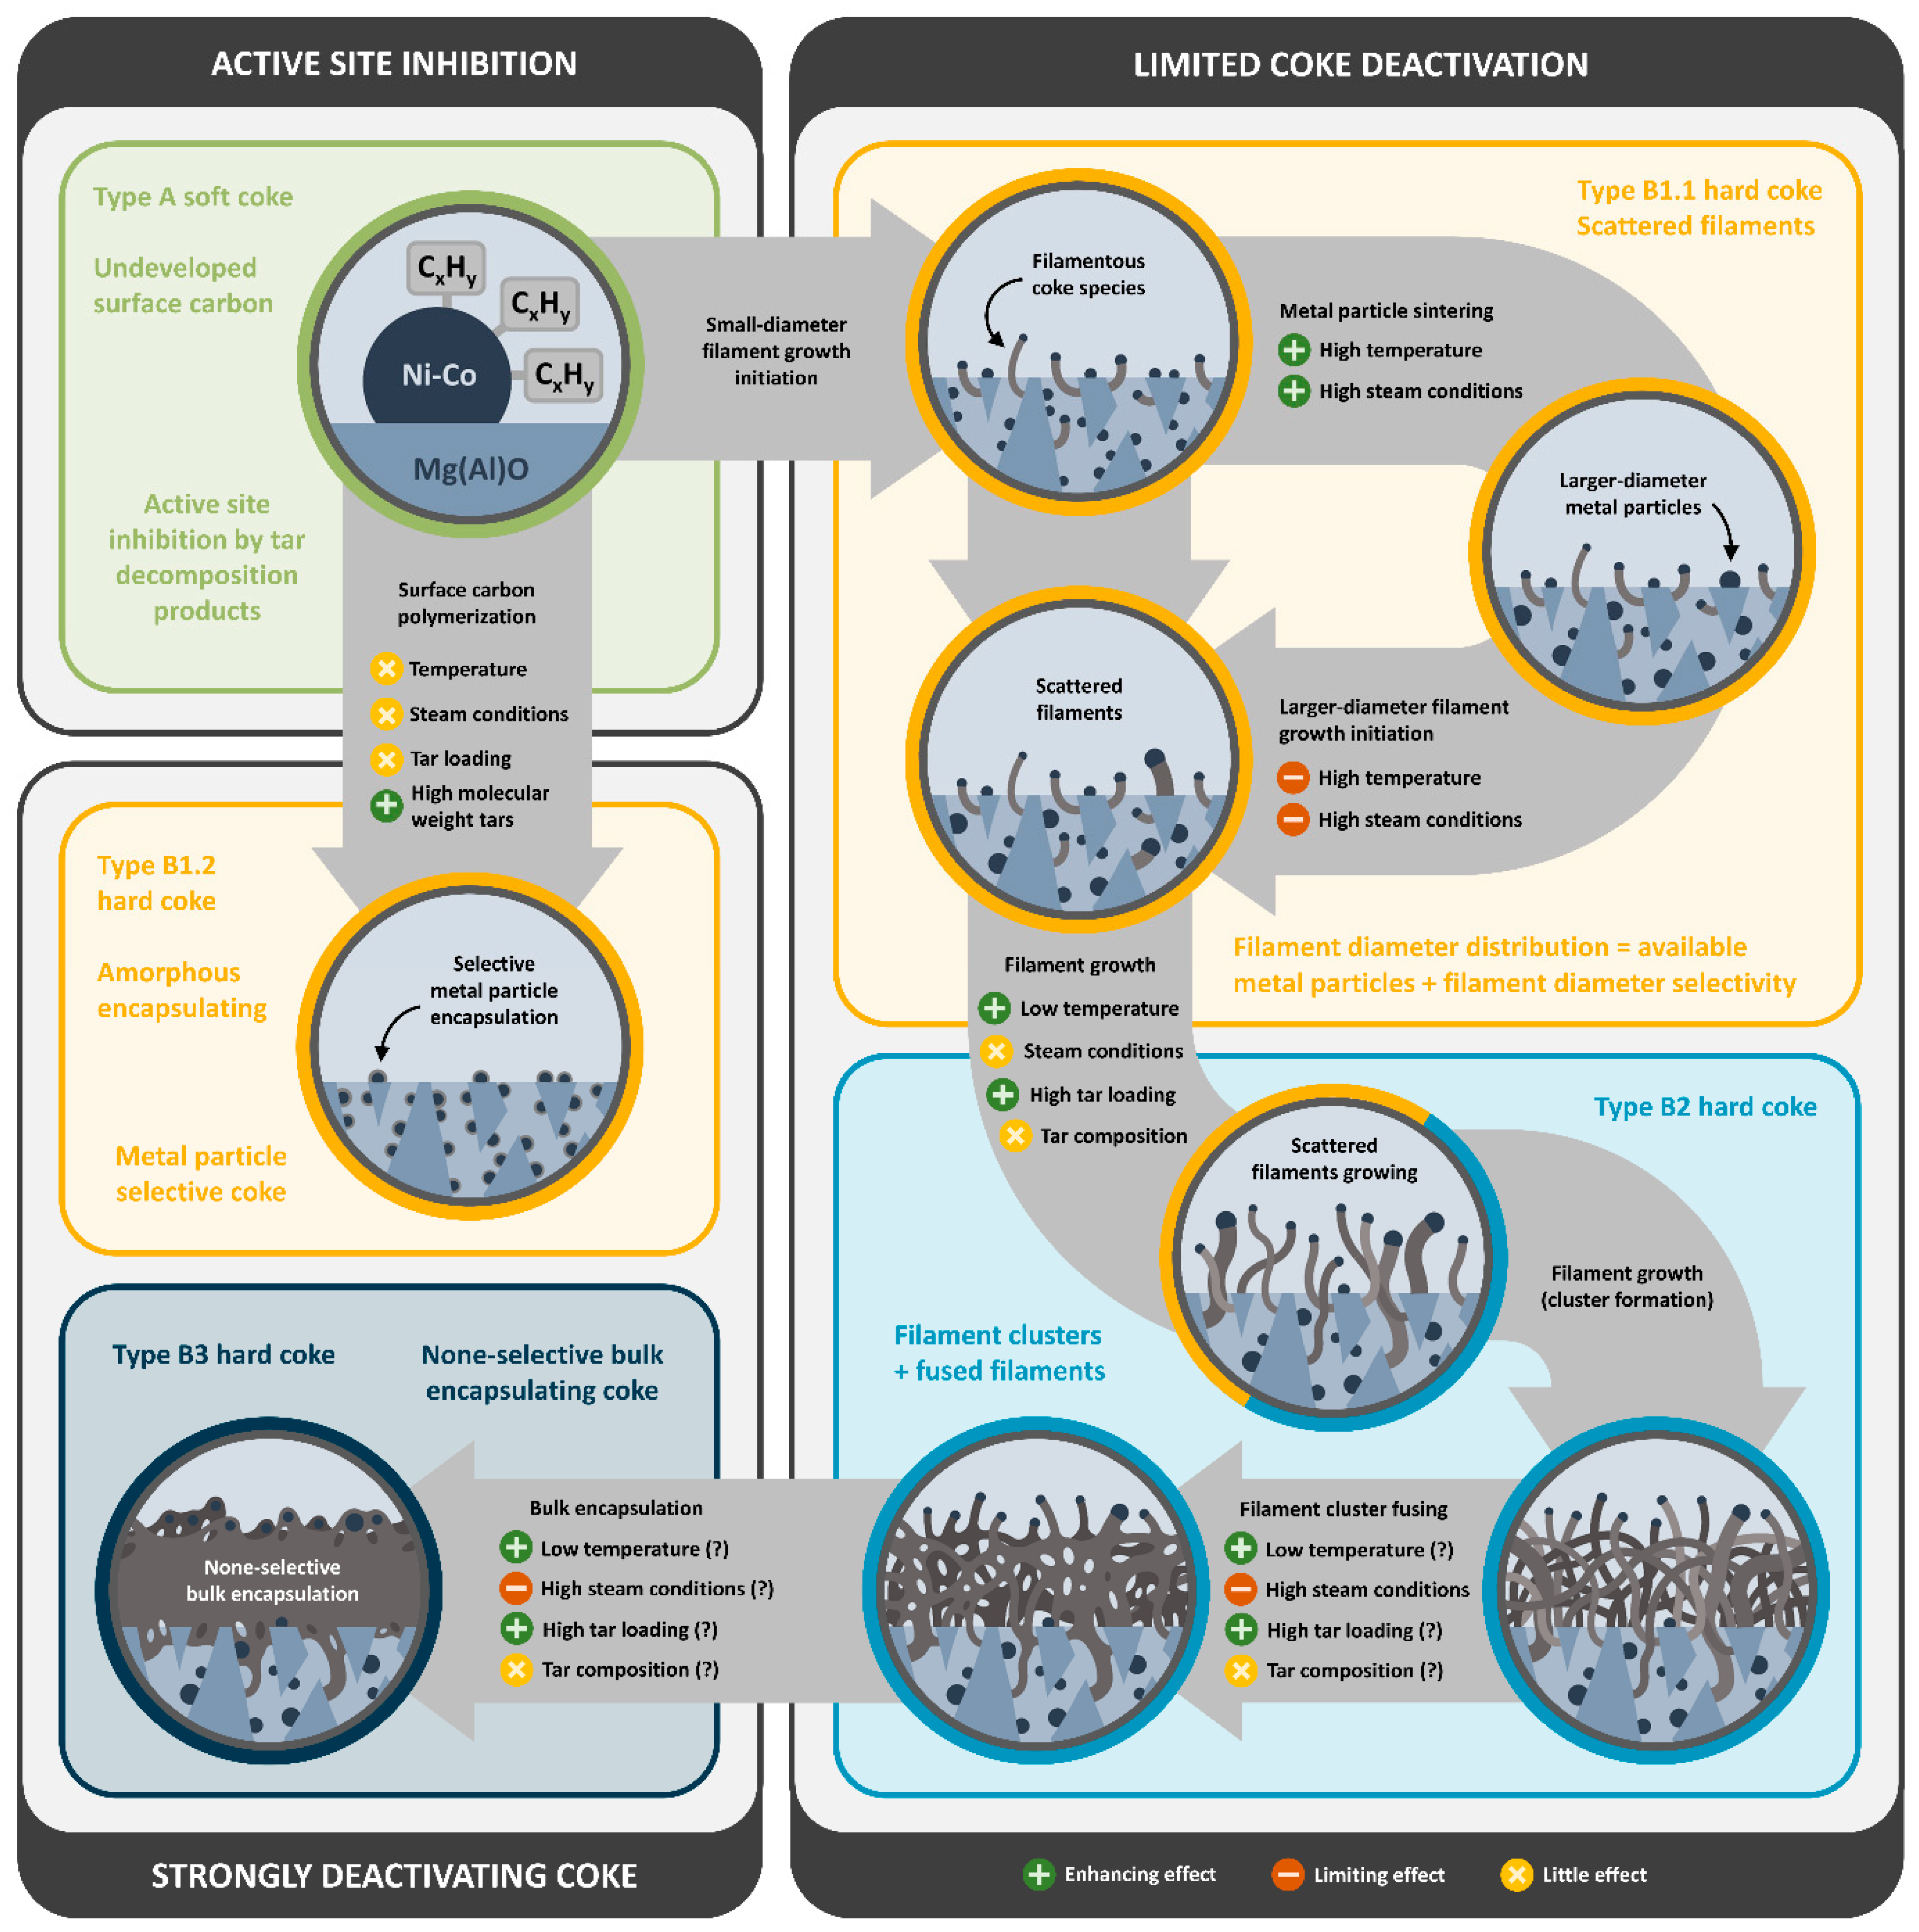
A coke formation scheme is proposed based on the overall coke characterization results (see Figure 7). The observed effects of operating parameters on the formation of the different coke species are additionally indicated in Figure 7 (enhancing, limiting, or little effect). The proposed scheme includes initial rapid deactivation by type A soft coke active site inhibition (undeveloped surface carbon), limited deactivation from type B1.1 (scattered carbon filaments) and B2 (filament clusters and fused filaments) hard coke, and strong deactivation effects following type B1.2 (metal particle encapsulation) and B3 (bulk encapsulation) coke formation.
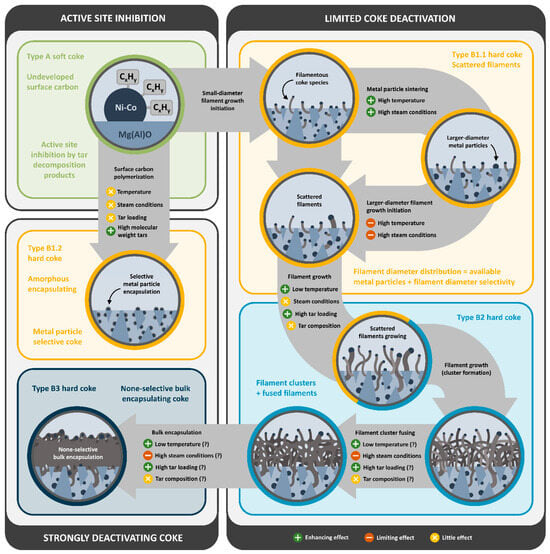
Figure 7.
Coke formation scheme and operating parameter effects from undeveloped surface carbon type A soft coke, via scattered filament type B1.1 hard coke, to type B2 filament clusters and filament cluster fusing/graphitization and strongly deactivating type B3 bulk encapsulation. Strongly deactivating type B1.2 metal particle encapsulation by surface carbon polymerization.
The fact that hard coke formation is observed only in the presence of tar suggests a specific nature of surface carbon species following tar decomposition (compared with CH4 activation and CO disproportionation), promoting coke formation pathways (even filament growth). Based on the present data (indicated by a question mark in the operating parameter effects list in Figure 7), it could not be determined whether the high levels of B2 and B3 coke under low-temperature and high-tar-loading conditions were directly related to the enhanced filament graphitization and bulk encapsulation steps, or simply to the enhanced filament growth. This was similarly the case regarding the effects of steam and model tar composition on the graphitization and bulk encapsulation steps. It should be noted that the high-temperature shift of the B2 combustion band (Figure 3a), as well as the low D/G ratio (1.27) at 800 °C, suggests that the filament fusing/graphitization step was promoted under high-temperature conditions. The accumulation of graphitic B2/B3 species was still limited due to the lower filament formation rate at high temperature.
It should generally be noted that coke formation could not be completely avoided in the presence of model tar, even under high-temperature and high-steam conditions, and the future of Ni-based tar-reforming catalysts may depend on cyclic catalyst regeneration by coke combustion/gasification. The potential benefits of such cyclic regeneration schemes were recently demonstrated by us (proof of concept) [34].
3.5. H2/CO/CO2 Selectivity
The effluent H2/CO/CO2 compositions were fairly constant throughout the stability tests (after the initial activity drop following the addition of tar). The operating condition effects on H2/CO and CO/CO2 ratios are shown in Table 3 (average at TOS = 7–8 h). The compositions were close to thermodynamic equilibrium, indicating high WGS activity, effectively adjusting H2/CO/CO2 ratios (from the initial 1.4/1/1 ratio) during simultaneous reforming operation.
Table 3.
H2/CO/CO2 selectivity and thermodynamic equilibrium at different operating conditions (syngas = 10/35/25/25 mol% CH4/H2/CO/CO2 with 5 mol% N2 internal standard, Ar balance, syngas flow = 400 NmL/min, GHSV = 85,000 NmL/gcatmin).
The H2/CO ratios were (mostly) slightly above and the CO/CO2 ratios below the expected equilibrium values. This suggested a low-temperature shift of the WGS reaction at the outlet of the catalyst bed due to the highly endothermic SMR and DRM reactions. The small diameter of the reactor and high degree of inert bed dilution material were selected to minimize deviations from isothermal operation. However, these apparent temperature gradient effects could not be completely eliminated. H2/CO ratios considerably below equilibrium values were observed only for the strongly deactivated low-temperature (650 °C) and high-tar (Tar-1 = 20/30 g/Nm3) samples, indicating some deactivation of the forward WGS reaction via coke formation and/or active site inhibition by tar decomposition products under these conditions.
Few reports have been found considering ultra-high-temperature water–gas shift (UHT-WGS) under relevant operating conditions. Ashok et al. [35] reviewed the development of Ni-based catalysts for high-temperature water–gas shift (HT-WGS) and UHT-WGS reaction applications, including only one study considering temperatures up to 650 °C. Additionally, two reports on higher temperatures were found in the previous literature. Haryanto et al. [36] studied the UHT-WGS performance of CeO2/Al2O3-supported Rh, Pt, Pd, Ir, Ru, Ag, and Ni catalysts with a fairly high steam-to-gas (S/G) ratio of 5.2 (CO basis) and pure CO/H2O in the feed. A high H2 selectivity (94.7%) was reported for the Pt-CeO2/Al2O3 catalyst at 700 °C (CO conversion = 76.3%, H2 yield = 52.2%). Chein et al. [37] studied a series of Pt, Ni, and Pt-Ni catalysts with Al2O3, TiO2, CeO2/Al2O3, and CeO2/TiO2 supports for H2 upgrade in model syngas (18/30/22/30 mol% H2/CO/CO2/N2) at 750–850 °C with S/G ratios of 1–5 (CO + CO2 basis). H2 yields up to around 35% were found throughout the tested conditions. The WGS discussion has generally focused on H2 production, where thermodynamic limitations require low operating temperatures and high S/G ratios to increase H2 yields. However, the results reported herein demonstrate how a smaller H2/CO/CO2 ratio adjustment (preparing the syngas for downstream Fischer–Tropsch applications) is possible during simultaneous hydrocarbon steam reforming under relevant high-temperature operating conditions.
4. Conclusions
The effects of temperature (650–800 °C), steam (S/C = 2–5), tar loading (10–30 g/Nm3 toluene), and model tar composition (Tar-1 = 100/0/0, Tar-2 = 75/25/0 and Tar-3 = 70/25/5 wt% toluene/1-methylenaphthalene/phenol) during the steam reforming of syngas hydrocarbon impurities with Ni-Co/Mg(Al)O catalysts were investigated in terms of activity, deactivation, and coke formation characteristics. Complete tar elimination was achieved under all conditions tested, at the expense of catalyst deactivation. The deactivation effects on catalyst-reforming activity were monitored as CH4 conversion for 8 h on stream.
Catalyst coke characterization was conducted via TPO-MS, Raman spectroscopy, and STEM/EDS analysis. Under tar-free conditions, only small amounts of less-developed surface carbon species (type A soft coke) were found. In the presence of model tar, hard coke formation could not be completely avoided under any of the conditions tested. A critical low-temperature limit was found around 650 °C, where rapid deactivation was accompanied by increasing amounts of all hard coke species. This was similarly the case for high Tar-1 loading (20–30 g/Nm3) conditions.
Based on the overall results, a coke classification scheme is proposed, including strongly adsorbed surface carbon species (soft coke A), initial scattered carbon filaments (hard coke B1.1), filament clusters and fused filaments (B2), and strongly deactivating bulk encapsulating coke (B3), formed through progressive filament cluster graphitization. Under Tar-2 conditions (high-molecular-weight tar), enhanced formation of strongly deactivating metal particle encapsulating coke (B1.2) was observed. The presence of phenol (Tar-3) showed little effect on catalyst deactivation and coke formation. A dynamic temperature/steam effect on carbon filament diameters was suggested, with the overall filament size distribution resulting from metal particle size availability (sintering effects) and filament size selectivity (filament growth initiation threshold). At high temperatures (750–800 °C), the formation of B3 hard coke was suppressed. Under high-steam conditions (S/C ratio = 5), a coke selectivity shift from B2/B3 hard coke towards B1.1 scattered filaments was observed.
Simultaneous adjustment of H2/CO/CO2 ratios, preparing the syngas for downstream Fischer–Tropsch applications, was demonstrated through efficient WGS equilibration under relevant high-temperature conditions.
These results contribute to the fundamental understanding of catalyst deactivation by coke formation during steam reforming of biomass gasification tars. The identification of critical operating parameter limits is crucial for limiting catalyst coke formation rates.
Supplementary Materials
The following supporting information can be downloaded at: https://www.mdpi.com/article/10.3390/fuels5030025/s1, Figure S1: TPO-MS following tar-free operation; Figure S2: MS calibration curve from TPO-MS; Figure S3: Raman spectra; Figures S4–S16: unedited STEM images.
Author Contributions
Conceptualization, A.L. and E.A.B.; methodology, A.L. and E.A.B.; validation, A.L.; formal analysis, A.L.; investigation, A.L., I.S. and K.Ø.M.; data curation, A.L.; writing—original draft preparation, A.L.; writing—review and editing, A.L., I.S., K.Ø.M. and E.A.B.; visualization, A.L.; supervision, E.A.B.; project administration, E.A.B.; funding acquisition, E.A.B. All authors have read and agreed to the published version of the manuscript.
Funding
This research was funded by the Norwegian Research Council through the Centre for Environment-friendly Energy Research (FME) Bio4Fuels, grant number 257622, and through the Norwegian Micro- and Nano-Fabrication Facility, NorFab, grant number 295864.
Data Availability Statement
The raw data supporting the conclusions of this article will be made available by the authors on request.
Conflicts of Interest
The authors declare no conflicts of interest.
References
- Davis, S.J.; Lewis, N.S.; Shaner, M.; Aggarwal, S.; Arent, D.; Azevedo, I.L.; Benson, S.M.; Bradley, T.; Brouwer, J.; Chiang, Y.-M.; et al. Net-zero emissions energy systems. Science 2018, 360, 1419. [Google Scholar] [CrossRef] [PubMed]
- Huber, G.W.; Iborra, S.; Corma, A. Synthesis of Transportation Fuels from Biomass: Chemistry, Catalysts, and Engineering. Chem. Rev. 2006, 106, 4044–4098. [Google Scholar] [CrossRef] [PubMed]
- Shen, Y.; Yoshikawa, K. Recent progresses in catalytic tar elimination during biomass gasification or pyrolysis—A review. Renew. Sustain. Energy Rev. 2013, 21, 371–392. [Google Scholar] [CrossRef]
- Rauch, R.; Kiennemann, A.; Sauciuc, A. Fischer-Tropsch Synthesis to Biofuels (BtL Process). In The Role of Catalysis for the Sustainable Production of Bio-Fuels and Bio-Chemicals; Triantafyllidis, K.S., Lappas, A.A., Stöcker, M., Eds.; Elsevier B.V.: Oxford, UK, 2013; pp. 397–443. [Google Scholar]
- Li, C.; Suzuki, K. Tar property, analysis, reforming mechanism and model for biomass gasification—An overview. Renew. Sustain. Energy Rev. 2009, 13, 594–604. [Google Scholar] [CrossRef]
- Coll, R.; Salvadó, J.; Farriol, X.; Montané, D. Steam reforming model compounds of biomass gasification tars: Conversion at different operating conditions and tendency towards coke formation. Fuel Process. Technol. 2001, 74, 19–31. [Google Scholar] [CrossRef]
- Ashok, J.; Dewangan, N.; Das, S.; Hongmanorom, P.; Wai, M.H.; Tomishige, K.; Kawi, S. Recent progress in the development of catalysts for steam reforming of biomass tar model reaction. Fuel Process. Technol. 2020, 199, 106252. [Google Scholar] [CrossRef]
- Guan, G.; Kaewpanha, M.; Hao, X.; Abudula, A. Catalytic steam reforming of biomass tar: Prospects and challenges. Renew. Sustain. Energy Rev. 2016, 58, 450–461. [Google Scholar] [CrossRef]
- Li, D.; Tamura, M.; Nakagawa, Y.; Tomishige, K. Metal catalysts for steam reforming of tar derived from the gasification of lignocellulosic biomass. Bioresour. Technol. 2015, 178, 53–64. [Google Scholar] [CrossRef]
- Zhang, Z.; Liu, L.; Shen, B.; Wu, C. Preparation, modification and development of Ni-based catalysts for catalytic reforming of tar produced from biomass gasification. Renew. Sustain. Energy Rev. 2018, 94, 1086–1109. [Google Scholar] [CrossRef]
- Yung, M.M.; Jablonski, W.S.; Magrini-Bair, K.A. Review of Catalytic Conditioning of Biomass-Derived Syngas. Energy Fuels 2009, 23, 1874–1887. [Google Scholar] [CrossRef]
- He, L.; Berntsen, H.; Ochoa-Fernández, E.; Walmsley, J.C.; Blekkan, E.A.; Chen, D. Co-Ni Catalysts Derived from Hydrotalcite-like Materials for Hydrogen Production by Ethanol Steam Reforming. Top. Catal. 2009, 52, 206–217. [Google Scholar] [CrossRef]
- He, L.; Berntsen, H.; Chen, D. Approaching Sustainable H2 Production: Sorption Enhanced Steam Reforming of Ethanol. J. Phys. Chem. A 2010, 114, 3834–3844. [Google Scholar] [CrossRef] [PubMed]
- Muñoz, M.; Moreno, S.; Molina, R. Synthesis of Ce and Pr-promoted Ni and Co catalysts from hydrotalcite type precursors by reconstruction method. Int. J. Hydrogen Energy 2012, 37, 18827–18842. [Google Scholar] [CrossRef]
- Muñoz, M.; Moreno, S.; Molina, R. The effect of the absence of Ni, Co and Ni-Co catalyst pretreatment on catalytic activity for hydrogen production via oxidative steam reforming of ethanol. Int. J. Hydrogen Energy 2014, 39, 10074–10089. [Google Scholar] [CrossRef]
- de Souza, G.; Ávila, V.C.; Marcílio, N.R.; Perez-Lopes, O.W. Synthesis gas production by steam reforming of ethanol over M-Ni-Al hydrotalcite-type catalysts; M = Mg, Zn, Mo, Co. Procedia Eng. 2012, 42, 1805–1815. [Google Scholar] [CrossRef]
- Shejale, A.D.; Yadav, G.D. Cu promoted Ni-Co/hydrotalcite catalyst for improved hydrogen production in comparison with several modified Ni-based catalysts via steam reforming of ethanol. Int. J. Hydrogen Energy 2017, 42, 11321–11332. [Google Scholar] [CrossRef]
- Ghungrud, S.A.; Dewoolkar, K.D.; Vaidya, P.D. Cerium-promoted bi-functional hybrid materials made of Ni, Co and hydrotalcite for sorption-enhanced steam methane reforming (SESMR). Int. J. Hydrogen Energy 2019, 44, 694–706. [Google Scholar] [CrossRef]
- Gil, M.V.; Rout, K.R.; Chen, D. Production of high pressure pure H2 by pressure swing sorption enhanced steam reforming (PS-SESR) of byproducts in biorefinery. Appl. Energy 2018, 222, 595–607. [Google Scholar] [CrossRef]
- He, L.; Parra, J.M.S.; Blekkan, E.A.; Chen, D. Towards efficient hydrogen production from glycerol by sorption enhanced steam reforming. Energy Environ. Sci. 2010, 3, 1046–1056. [Google Scholar] [CrossRef]
- Noor, T.; Gil, M.V.; Chen, D. Production of fuel-cell grade hydrogen by sorption enhanced water gas shift reaction using Pd/Ni-Co catalysts. Appl. Catal. B Environ. 2014, 150–151, 585–595. [Google Scholar] [CrossRef]
- Fermoso, J.; Rudiera, F.; Chen, D. Sorption enhanced catalytic steam gasification process: A direct route from lignocellulosic biomass to high purity hydrogen. Energy Environ. Sci. 2012, 5, 6358–6367. [Google Scholar] [CrossRef]
- Lysne, A.; Madsen, K.A.; Antony, J.; Rout, K.R.; Blekkan, E.A. Effects of Ni-Co Ratio on Deactivation and Coke Formation in Steam Reforming of Hydrocarbon Impurities from Biomass Gasification with Ni-Co/Mg(Al)O Catalysts. Chem. Eng. Trans. 2022, 92, 37–42. [Google Scholar] [CrossRef]
- Lysne, A.; Saxrud, I.; Snidaro, R.L.G.; Blekkan, E.A. Noble metal (Pt, Pd and Rh) promoted Ni-Co/Mg(Al)O catalysts for steam reforming of tar impurities from biomass gasification. J. Catal. 2024, 436, 115567. [Google Scholar] [CrossRef]
- Wei, J.; Iglesia, E. Isotopic and kinetic assessment of the mechanism of reactions of CH4 with CO2 or H2O to form synthesis gas and carbon on nickel catalysts. J. Catal. 2004, 224, 370–383. [Google Scholar] [CrossRef]
- Sehested, J. Four challenges for nickel steam-reforming catalysts. Catal. Today 2006, 111, 103–110. [Google Scholar] [CrossRef]
- Chen, D.; Christensen, K.O.; Ochoa-Fernández, E.; Yu, Z.; Tøtdal, B.; Latorre, N.; Monzón, A.; Holmen, A. Synthesis of carbon nanofibers: Effects of Ni crystal size during methane decomposition. J. Catal. 2005, 229, 82–96. [Google Scholar] [CrossRef]
- Montero, C.; Ochoa, A.; Castaño, P.; Bilbao, J.; Gayubo, A.G. Monitoring Ni0 and coke evolution during the deactivation of a Ni/La2O3-αAl2O3 catalyst in ethanol steam reforming in a fluidized bed. J. Catal. 2015, 331, 181–192. [Google Scholar] [CrossRef]
- Ruelas-Leyva, J.P.; Maldonado-Garcia, L.F.; Talavera-Lopez, A.; Santos-López, I.A.; Picos-Corrales, L.A.; Santolalla-Vargas, C.E.; Gómez Torres, S.A.; Fuentes, G.A. A Comprehensive Study of Coke Deposits on a Pt-Sn/SBA-16 Catalyst during the Dehydrogenation of Propane. Catalysts 2021, 11, 128. [Google Scholar] [CrossRef]
- Liao, X.; Gerdts, R.; Parker, S.F.; Chi, L.; Zhao, Y.; Hill, M.; Guo, J.; Jones, M.O.; Jiang, Z. An in-depth understanding of the bimetallic effects and coked carbon species on an active bimetallic Ni(Co)/Al2O3 dry reforming catalyst. Phys. Chem. Chem. Phys. 2016, 18, 17311–17319. [Google Scholar] [CrossRef]
- Ochoa, A.; Bilbao, J.; Gayubo, A.G.; Castaño, P. Coke formation and deactivation during catalytic reforming of biomass and waste pyrolysis products: A review. Renew. Sustain. Energy Rev. 2020, 119, 109600. [Google Scholar] [CrossRef]
- García-Gómez, N.; Valecillos, J.; Remiro, A.; Valle, B.; Bilbao, J.; Gayubo, A.G. Effect of reaction conditions on the deactivation by coke of a NiAl2O4 spinel derived catalyst in the steam reforming of bio-oil. Appl. Catal. B Environ. 2021, 297, 120445. [Google Scholar] [CrossRef]
- Josuinkas, F.M.; Quitete, C.P.B.; Ribeiro, N.F.P.; Souza, M.M.V.M. Steam reforming of model gasification tar compounds over nickel catalysts prepared from hydrotalcite precursors. Fuel Process. Technol. 2014, 121, 76–82. [Google Scholar] [CrossRef]
- Lysne, A.; Blekkan, E.A. Continuous coke management with Ni and Ni-Co catalysts for bio-syngas tar steam reforming—The Switch-SRCG unit. Appl. Catal. O Open. 2024, 190, 206943. [Google Scholar] [CrossRef]
- Ashok, J.; Wai, M.H.; Kawi, S. Nickel-based Catalysts for High-temperature Water Gas Shift Reaction—Methane Suppression. ChemCatChem 2018, 10, 3927–3942. [Google Scholar] [CrossRef]
- Haryanto, A.; Fernando, S.; Adhikari, S. Ultrahigh temperature water gas shift catalysts to increase hydrogen yield from biomass gasification. Catal. Today 2007, 129, 269–274. [Google Scholar] [CrossRef]
- Chein, R.-Y.; Fang, C.-M.; Chyou, Y.-P.; Chang, S.-H. Effect of Catalyst Support on Water-Gas Shift Reaction at Ultrahigh Temperatures Using Syngas. Chem. Eng. Technol. 2017, 41, 1390–1397. [Google Scholar] [CrossRef]

Disclaimer/Publisher’s Note: The statements, opinions and data contained in all publications are solely those of the individual author(s) and contributor(s) and not of MDPI and/or the editor(s). MDPI and/or the editor(s) disclaim responsibility for any injury to people or property resulting from any ideas, methods, instructions or products referred to in the content. |
© 2024 by the authors. Licensee MDPI, Basel, Switzerland. This article is an open access article distributed under the terms and conditions of the Creative Commons Attribution (CC BY) license (https://creativecommons.org/licenses/by/4.0/).