Article

The Impact of Spoofing Attacks in Connected Autonomous Vehicles under Traffic Congestion Conditions

by
Zisis-Rafail Tzoannos
1,
Dimitrios Kosmanos
1,2,
Apostolos Xenakis
1 and
Costas Chaikalis
1,*
1
Department of Digital Systems, University of Thessaly, 41500 Larisa, Greece
2
Department of Electrical & Computer Engineering, University of Thessaly, 38221 Volos, Greece
*
Author to whom correspondence should be addressed.
Telecom 2024, 5(3), 747-759; https://doi.org/10.3390/telecom5030037
Submission received: 18 May 2024 / Revised: 12 July 2024 / Accepted: 24 July 2024 / Published: 2 August 2024

Abstract

:
In recent years, the Internet of Things (IoT) and the Internet of Vehicles (IoV) represent rapidly developing technologies. The majority of car manufacturing companies invest large amounts of money in the field of connected autonomous vehicles. Applications of connected and autonomous vehicles (CAVs) relate to smart transport services and offer benefits to both society and the environment. However, the development of autonomous vehicles may create vulnerabilities in security systems, through which attacks could harm both vehicles and their drivers. To this end, CAV development in vehicular ad hoc networks (VANETs) requires secure wireless communication. However, this kind of communication is vulnerable to a variety of cyber-attacks, such as spoofing. In essence, this paper presents an in-depth analysis of spoofing attack impacts under realistic road conditions, which may cause some traffic congestion. The novelty of this work has to do with simulation scenarios that take into consideration a set of cross-layer parameters, such as packet delivery ratio (PDR), acceleration, and speed. These parameters can determine the integrity of the exchanged wave short messages (WSMs) and are aggregated in a central trusted authority (CTA) for further analysis. Finally, a statistical metric, coefficient of variation (CoV), which measures the consequences of a cyber-attack in a future crash, is estimated, showing a significant increase (12.1%) in a spoofing attack scenario.

1. Introduction

The evolution of vehicular technology in recent decades is impressive. Various devices used in our daily lives can connect to the internet, and communicate and exchange messages with each other: the so-called IoT. The domain of VANET, which is considered as an expansion of the IoT, evolved over time into the IoV. A typical example of IoT is the concept of the smart home, which includes devices such as lights, thermostats, and home security systems that support one or more ecosystems and can be controlled through devices such as smart mobile phones and smart speakers [1]. IoV network is considered as a network of vehicles whose purpose is to collect data using sensors mounted on or embedded inside vehicles, or on road units, such as global positioning system (GPS) units, light detection and ranging (LIDAR), image sensors, etc. On the one hand, the data collected from vehicles include various parameters such as vehicle speed, position, and direction of movement. On the other hand, data collected by road units include aggregation of traffic information. The collected data are processed to provide a better travel experience, improve driving safety, and better handle accidents.
In a typical application of IoV, the vehicles uses exteroceptive sensors, such as cameras, present on the roads to infer possible traffic congestion. Each vehicle in the vehicular ad-hoc network has an on-board unit (OBU) installed, through which it periodically sends information to the other nodes in the network about its state. Road-side units (RSUs) are infrastructures placed along the road so that they play the role of relay node and facilitate transmissions in the most remote areas of the network. The data from one RSU can be correlated with data from other RSUs to provide a more comprehensive picture of traffic conditions within a monitoring area. Another IoV application, which focuses on drivers’ safety, has to do with the information and entertainment system of the Subaru ® vehicle brand. This system can sense the driver’s fatigue and trigger a sound alert to stop and rest. Currently, IoT technologies and driverless cars seem to dominate smart city systems [2]. However, this kind of automotive sensing for autonomous vehicles requires line-of-sight (LoS) communication, which is extremely rare in traffic conditions within urban areas.
Therefore, as technology is evolving very rapidly in the field of IoV, there is the need for continuous and increased system security. The deployment of CAVs is needed secure inter-vehicle communication in order to ensure reliability and safety. The connected vehicles periodically broadcast traffic information to its neighbors through basic safety messages (BSMs) with information such as speed, location, vehicle i.d., etc. Subsequently, a safety application can manipulate this information to produce different kinds of alerts to drivers, e.g., collision avoidance, lane change warnings, etc. Therefore, it is ensured that critical information arrives with the shortest possible delay to each vehicle through BSMs. This information is usually interchanged with cooperative adaptive cruise control (CACC) technology [3], which is an enhancement of adaptive cruise control (ACC), and is basically based on sensors, and thus allows vehicles to move in stable platoon formation. The technology that is used for the wireless V2V communication is dedicated short-range communication (DSRC), a spectrum of 75 MHz and a frequency bandwidth of 5.9 GHz [4], which is widely used for communication between vehicles and RSUs. Recently, the standard of Cellular-V2X (C-V2X), which utilizes cellular technology, has been introduced to facilitate vehicle communication, especially over longer distances [5].
The CAVs are vulnerable to different types of cyber-attacks [6]. Therefore, the messages exchanged over the network should be verified and authenticated for its correctness. Cryptographic methods are usually used for authentication purposes for BSMs [7]. These techniques effectively prevent outside attacks, but they do not show the same effectiveness for inertial attacks, where nodes with correct credentials send faulty information, either intentionally or unintentionally. Such cyber-attacks are the denial of service (DoS) attacks. Specifically, the location of a member of the platoon is decided using a GPS system. GPS is vulnerable to jamming/spoofing attacks, and commercially available, off-the-shelf GPS receivers lack the capability to detect and counteract such attacks due to the absence of encryption or authentication mechanisms.
Motivated by these challenges, this paper presents an in-depth analysis of the impact of spoofing attacks, under realistic conditions, on the road, which may cause some traffic congestion and a potential unwanted accident. A set of cross-layer parameters (such as PDR, acceleration, and speed) that can determine the integrity of the exchanged WSMs) are gathered in a CTA, which is installed on an RSU to detect a spoofing attack in a future probabilistic intrusion detection system (IDS). The main contributions of this paper are:
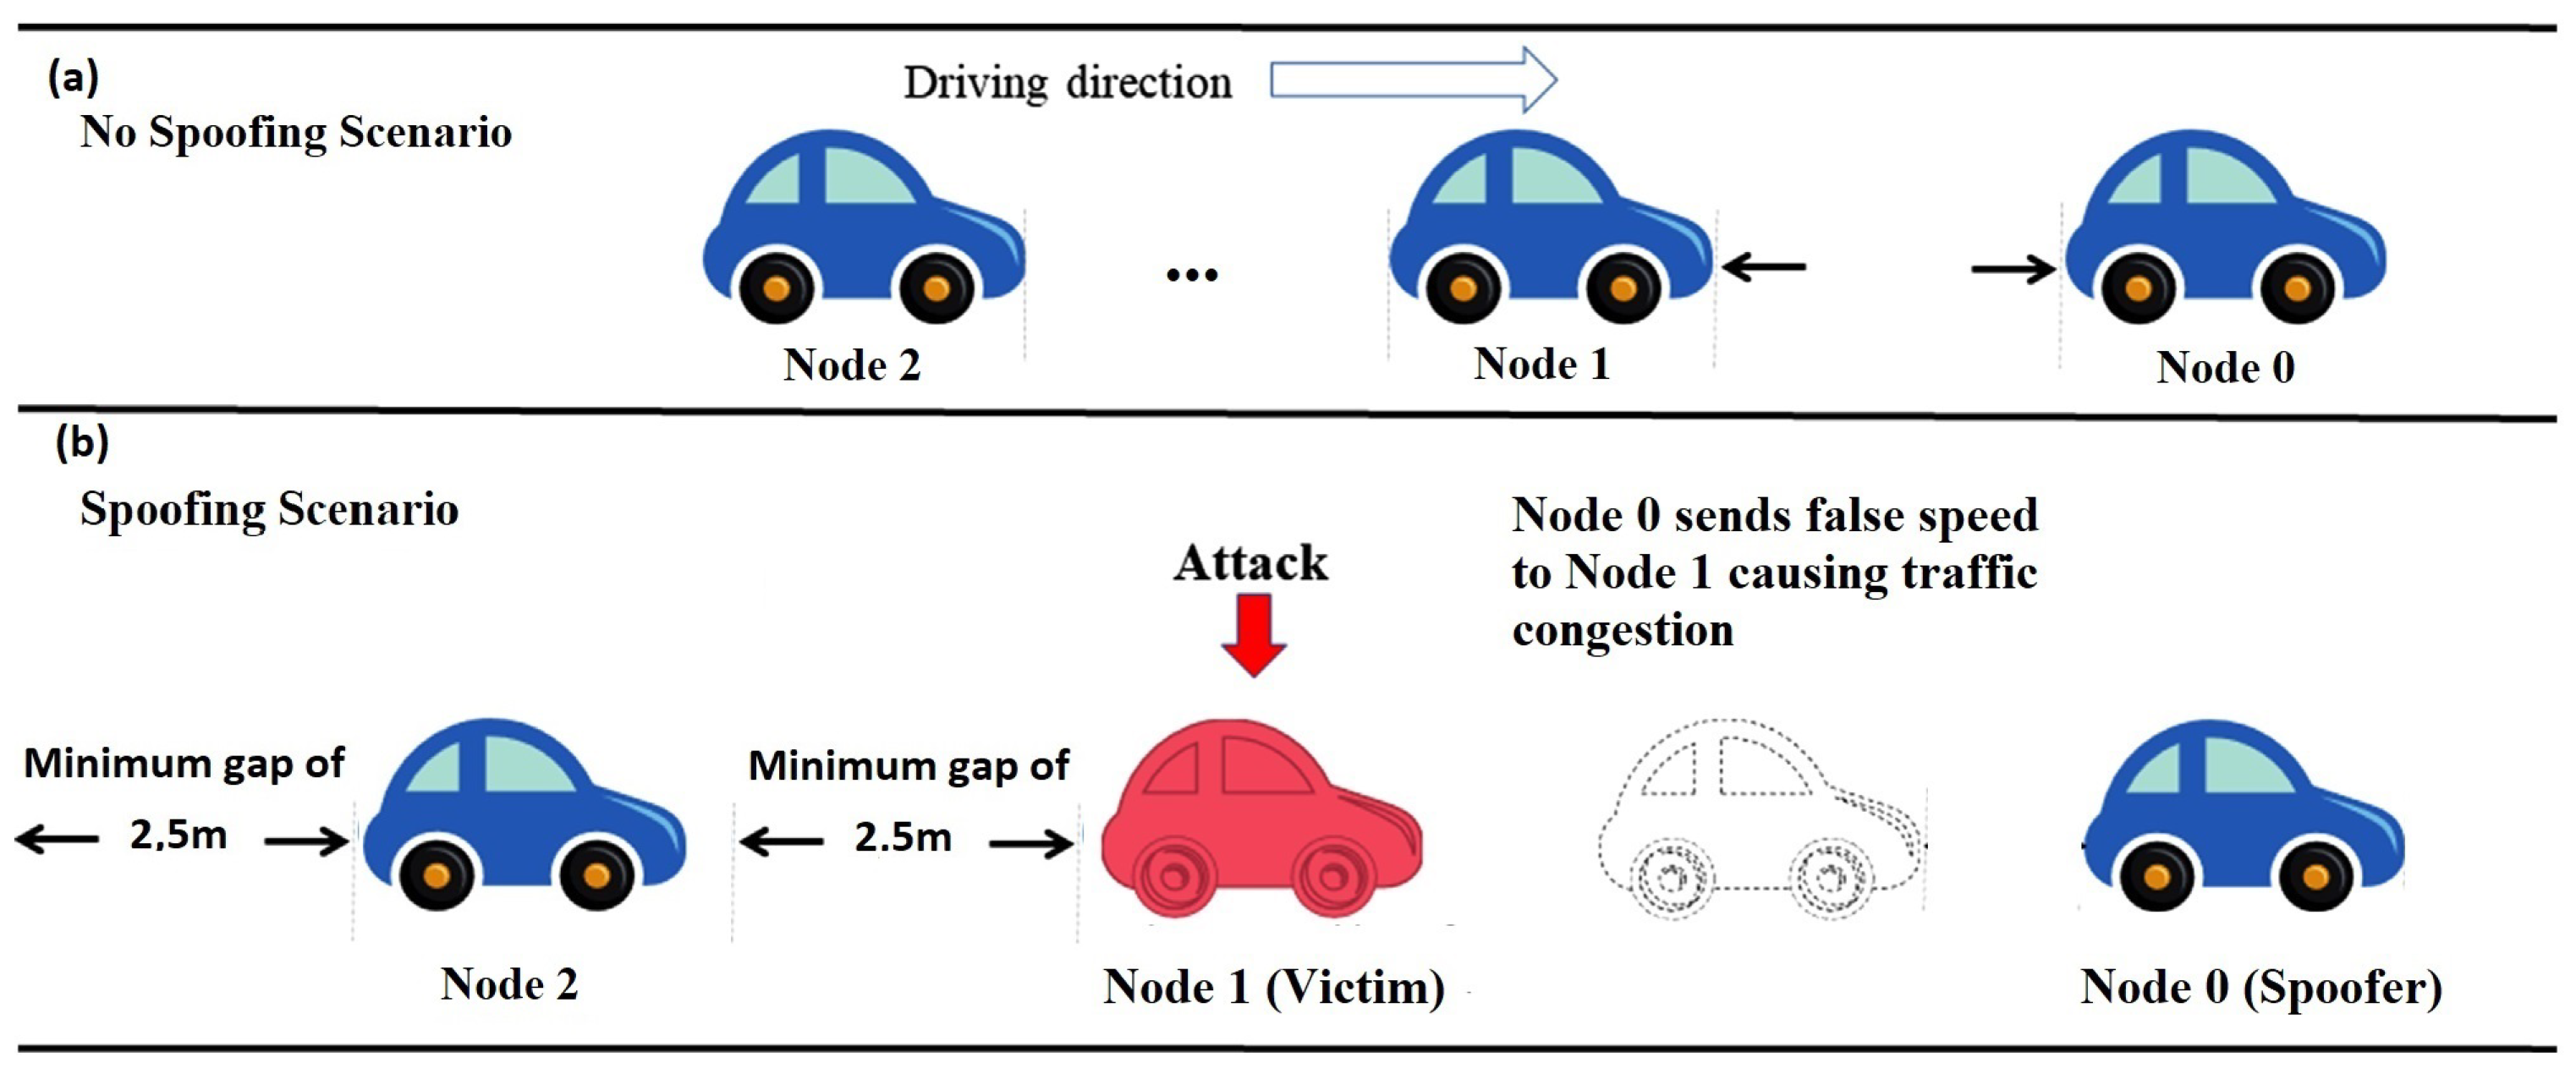
  • We investigate the effects of a basic spoofing attack on a range of CAVs, that is generated in an ad-hoc fashion on the road and has some minimal security guarantees (i.e., minimum safety gap distance of 2.5 m and any member of the platoon is running a highly protected piece of code, whereby if it stops for a reasonable 10 s threshold, it alerts the following vehicles to change routes to reach their destination).
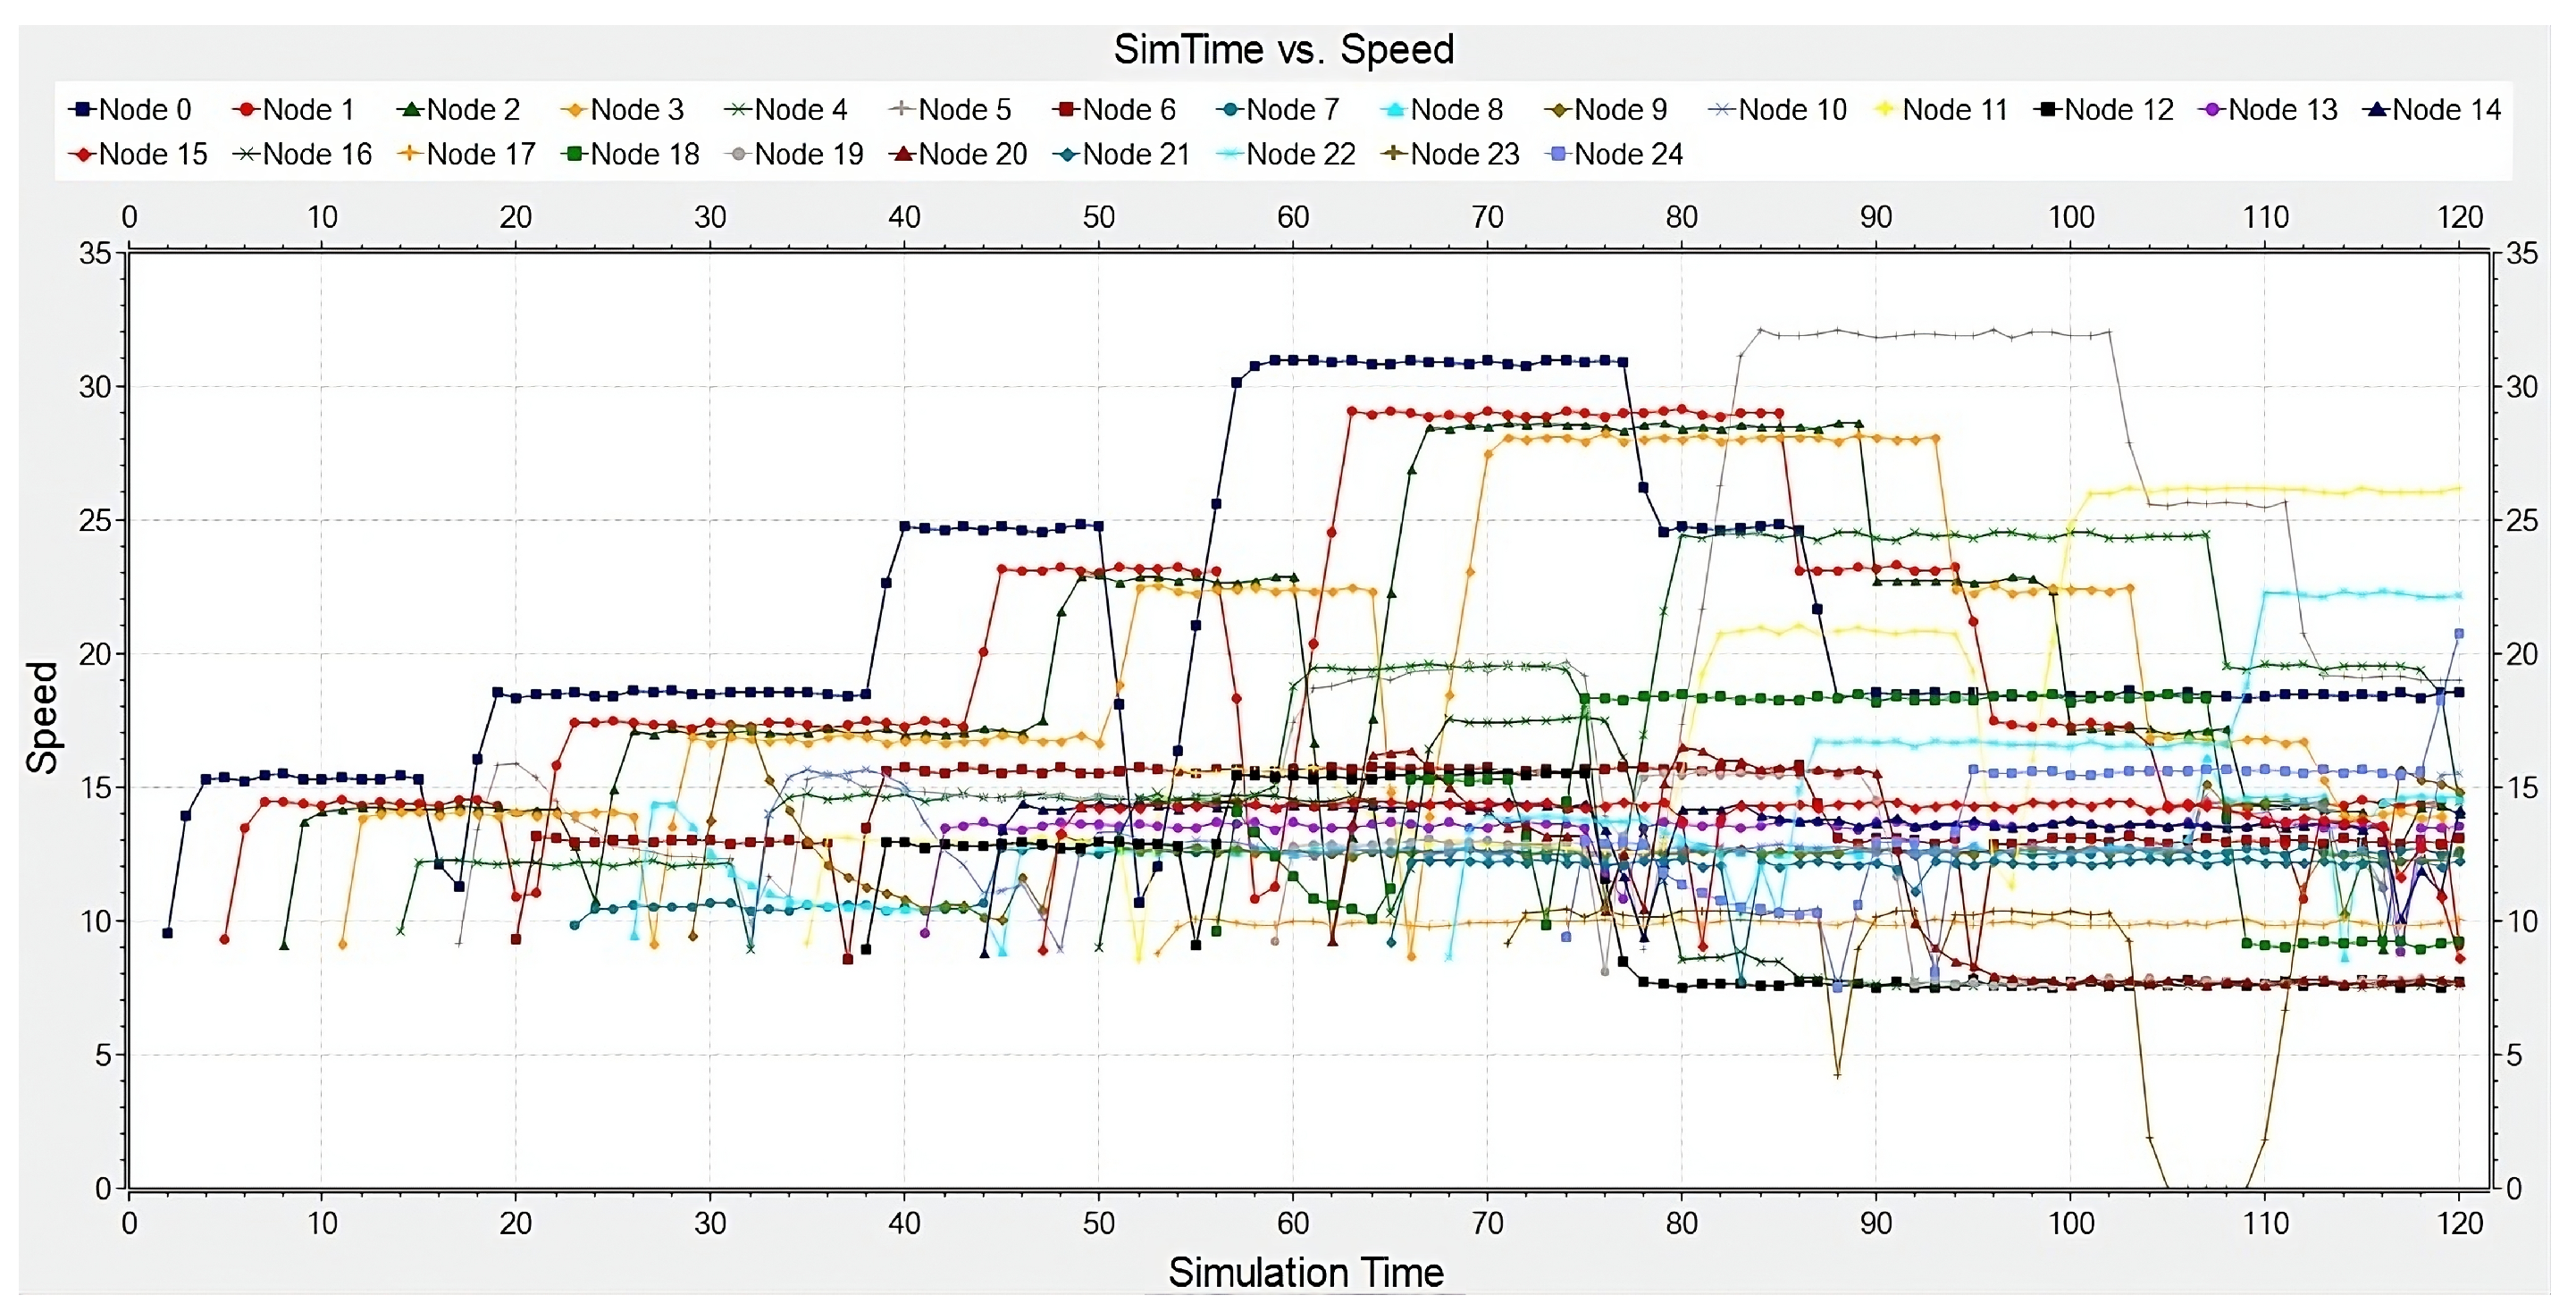
  • We estimate the statistical measure of CoV and we prove that its absolute value increases under spoofing attack conditions. Moreover, without any cyber-attack, CoV remains at high levels, at about 23 for the speed parameter, under realistic traffic conditions for an urban environment, in contrast to theoretical studies, which indicate a value close to zero [8].
  • Finally, we investigate how cross-layer parameters, such as PDR, impact the attack’s detection in a future detection system, and we observed how the attack causes a high volume of traffic in the wireless V2X network. This indicates higher vulnerability, a fact to be easily detected.
The rest of this paper is organized as follows: In Section 2, we present related work, and Section 3 presents the system model analysis and the spoofing attack model. In Section 4, we give the experimental evaluation of the proposed spoofing attack scenarios and provide a comparison using cross-layer parameters, such as speed, acceleration, and PDR. Finally, Section 5 concludes the paper and gives some future work directions.

2. Related Work

Modern vehicles are equipped with cutting-edge technology such as cameras, sensors, and other smart devices to monitor, transmit, and receive information. These store personal data such as messages, financial information, etc. Various malicious actors try to gain remote access to the stored information and steal it. There are various forms of autonomous vehicle attacks, but there are also various means of protection against them.
In [9], the authors propose a model called self-stabilizing cyber-attack for connected vehicles. After providing a theoretical model, the authors validate their approach through simulation results. In [10], the authors present a literature review on CAV technology. CAVs and emotional intelligence are also investigated. Furthermore, in [11], the authors collect data from traffic simulations and investigate the effects on traffic caused by cyber-attacks. The analysis is done considering time-to-collision and deceleration rate to avoid collision, which represent safety factors. The simulation results show the impact of time-delay attacks, which also use location information, in road throughput. It was concluded that heavy traffic greatly affects the implications of cyber-attacks. A literature review paper is presented in [7], where the authors investigate CAV security tasks. The authors conclude that the use of cloud and artificial intelligence (AI) techniques represent an efficient way to prevent CAV cyber-attacks.
In [12], the authors mention that distributed denial of service (DDOS) represents an important category of attacks on VANETs: they provide a survey and a layer-by-layer analysis of this type of attacks. In [8], the authors examine types of cyber-attacks, like message falsification, dedicated denial of service, and spoofing. One of the research findings is the non-stability of the traffic stream and CAV string in all three types of cyber-attacks. Another research finding (for a single CAV) is the creation of high traffic stream disruption at the scenario of a slight cyber-attack.
Reference [13] gives a review of cyber-attack simulation models. Furthermore, the authors suggest a domain-specific attack model for self-driving vehicles. Finally, having in mind the decision-tree method, a classification of cyber-attacks is shown. Additionally, for the case of short-term memory networks, the authors predict the type of attack. A CAV cyber-attack survey work is presented in [14]. Moreover, in this work, the authors present different mitigation strategies from the vehicle manufacturers’ and governments’ point of view.
However, all these literature review papers do not consider a cross-layer approach in their designs. Furthermore, statistical parameters like CoV are not considered. Therefore, having in mind the research gaps mentioned above, in this study, we develop a microscopic traffic simulation platform in order to analyse the traffic impacts of cyber-attacks on CAVs. Many times the theoretical approach is far from reality even under normal conditions. Therefore, initially the goal is to see what the effects are and what OSI layer of simple DoS attacks are affected in order to design an overall traffic simulation model that will incorporate a cross-layer probabilistic detection system.

3. System Model

3.1. Topology

The purpose of this article is to simulate a real traffic model, highlighting the conditions of a relatively small city, such as Erlangen, in Germany. For this reason, we assume that each new vehicle is added at a relatively fast rate, within the simulation environment, which is R = 1 / 3 vehicle/s. Vehicles start their route from the city’s university and head towards the same final destination, as shown in Figure 1. They form a platoon of vehicles, for which we assume that the motion model is the known Gipps model, which is an absolute collision-free car-following model [11]. In the context of the Gipps model [15,16], the safe speed refers to the maximum speed a driver can travel at any given time while ensuring they can safely stop before reaching the vehicle ahead. This speed considers the driver’s reaction time, the deceleration capabilities of both the leading and following vehicles, and the current speed and position of the vehicles. The safe speed in the Gipps model is influenced by parameters such as maximum acceleration, reaction time, desired speed, and minimum gap distance. All the values for these parameters were chosen (see Table 1) based on the fact that the traffic is in an urban environment, where there are frequent stops and the presence of intersections and pedestrians. Specifically, the minimum gap distance is set around 2.0 to 5.0 m for urban environments. Therefore, we select a mean value of about 2.5 m. On the other hand, the safety distance in the Gipps model is the minimum distance that must be maintained between a vehicle and the one ahead to prevent a collision, considering their current speeds and deceleration capabilities. This distance ensures that if the leading vehicle decelerates suddenly, the following vehicle can stop in time to avoid a crash. According to the above, a vehicle needs to move with a safe speed at about 40–50 km/h, so as to constantly maintain a minimum safety distance at about 30–50 m (assuming that the parameter of minimum gap distance is 2.5 m), even if its leading vehicle stops abruptly due to unspecified factors on the road.
All the members of the platoon contain backward- and forward-facing radars in order to detect obstacles in front of them. All platoon-connected vehicles periodically send unicast W S M messages to the following vehicles that contain motion-related information, such as position, speed, acceleration, etc. Also, there is a RSU in the area that relays the WSMs being exchanged. However, if the first platoon vehicles detect any traffic disturbance (i.e., an accident between vehicles or accidents among vehicles and pedestrians), they may change their route, real-time, in order to reach their destination faster. Therefore, to guarantee the safety on the road containing autonomous self-driving cars, sensor-related solutions that calculate vehicles positions and those based on wireless V2V should correlate. To this end, in these technologies, it is very important that the exchanged data need to be protected and their integrity guaranteed.

3.2. Spoofing Attack

To assess the impact of a prominent DoS attack, such as a spoofing attack, under real-world urban traffic conditions, and to formulate suitable mitigation strategies, we instantiate several pertinent scenarios. A representative spoofing attack category for vehicle platooning involves attacks generated by non-platoon members. According to recent literature [17], solutions regarding safe management protocols for adding new vehicle members in a platoon are proposed. Therefore, any external communication with platoon members is somehow filtered, while their internal communication is considered secure. However, as we mentioned in the previous section, in this paper’s scenarios, vehicle platoons are created in an ad-hoc fashion, in real-time conditions, based on their movement characteristics (i.e., if they move on the same road at the same speed, etc.). Additionally, we assume that an internal node within the platoon may either be compromised due to hacking or may act in self-interest by disseminating misleading data to fellow platoon members, who in turn perceive this information as accurate.
In the simulation scenario, all vehicles have a network card installed using the IEEE 802.11p standard [18], which supports the Wireless Access in Vehicular Environments (WAVE). It leverages the use of 5.9 GHz frequency to facilitate V2V communication among all the mobile vehicles within the available communication range, as well as vehicle-to-infrastructure (V2I) communication between vehicles and RSUs. Specifically, the spoofing attack scenario assumes that the vehicle platoon moves around the city of Erlangen, on specified routes, according to Figure 1. Starting from the 10th second of the simulation, the platoon leader (Node 0: spoofer) begins to manipulate the parameters of a WSM, notably its speed, by assigning a random value drawn from a uniform distribution, within the range of (0.1, 0.9). Despite these alterations, this vehicle continues along its designed route without any deviation. Subsequently, Node 1 (the victim), as soon as it receives this message, sets its speed at a value drawn from uniform distribution with values in the set (0.1, 0.9). This creates a traffic jam, with the platoon members following to form a queue of stopped cars at the minimum desired distance of 2.5 m, as can be seen in Figure 2.
This happens because, during the attack, the vehicles are moving on a dual carriageway with one lane of traffic in each direction. Therefore, the vehicles that follow cannot overtake Node 1 (victim). Around the 85th simulation second, the vehicles platoon reaches an intersection. This means that the duration of the spoofing attack is about 75 s. We also assume that any member of the platoon is running a highly protected piece of code, whereby if it remains stopped for a reasonable 10 s threshold, it will alert the following vehicles to change routes to reach their destination. Then, the vehicles to follow (from the victim node down) are detached from the platoon (if they have the choice) in order to “overcome” the obstacle of Node 1 (victim) and continue their route unhindered. The description of this attack is depicted in Figure 3 and Figure 4. As already mentioned, during platoon movement, vehicles exchange WSMs containing various information, such as their speed, acceleration, and position. According to these WSM values, we extract a number of metrics to examine the consequences of the spoofing attack. These refer to the total distance traveled, the PDR percentage of WSMs for each vehicle, as well as the delay time that vehicles stay in the queue due to spoofing attack.

4. Evaluation

To test the performance of the evaluated spoofing attack model as described in Section 3.2, we used OMNeT++ 5.1, INET 3.6, Veins 4.7, and SUMO 0.30.0 [19]. In particular, we simulate and compare two scenarios. We call the first the Normal Scenario, where vehicles move under normal conditions on city routes, without the presence of an attacker. For the the second scenario, called Spoofing Attack Scenario, a spoofing attack occurs with different random but reasonable discrete values ( n = 10 , 15 , 20 , 25 ) for the range of vehicles in an urban area. All simulation parameters applied for the conducted experiments are described in Table 1.

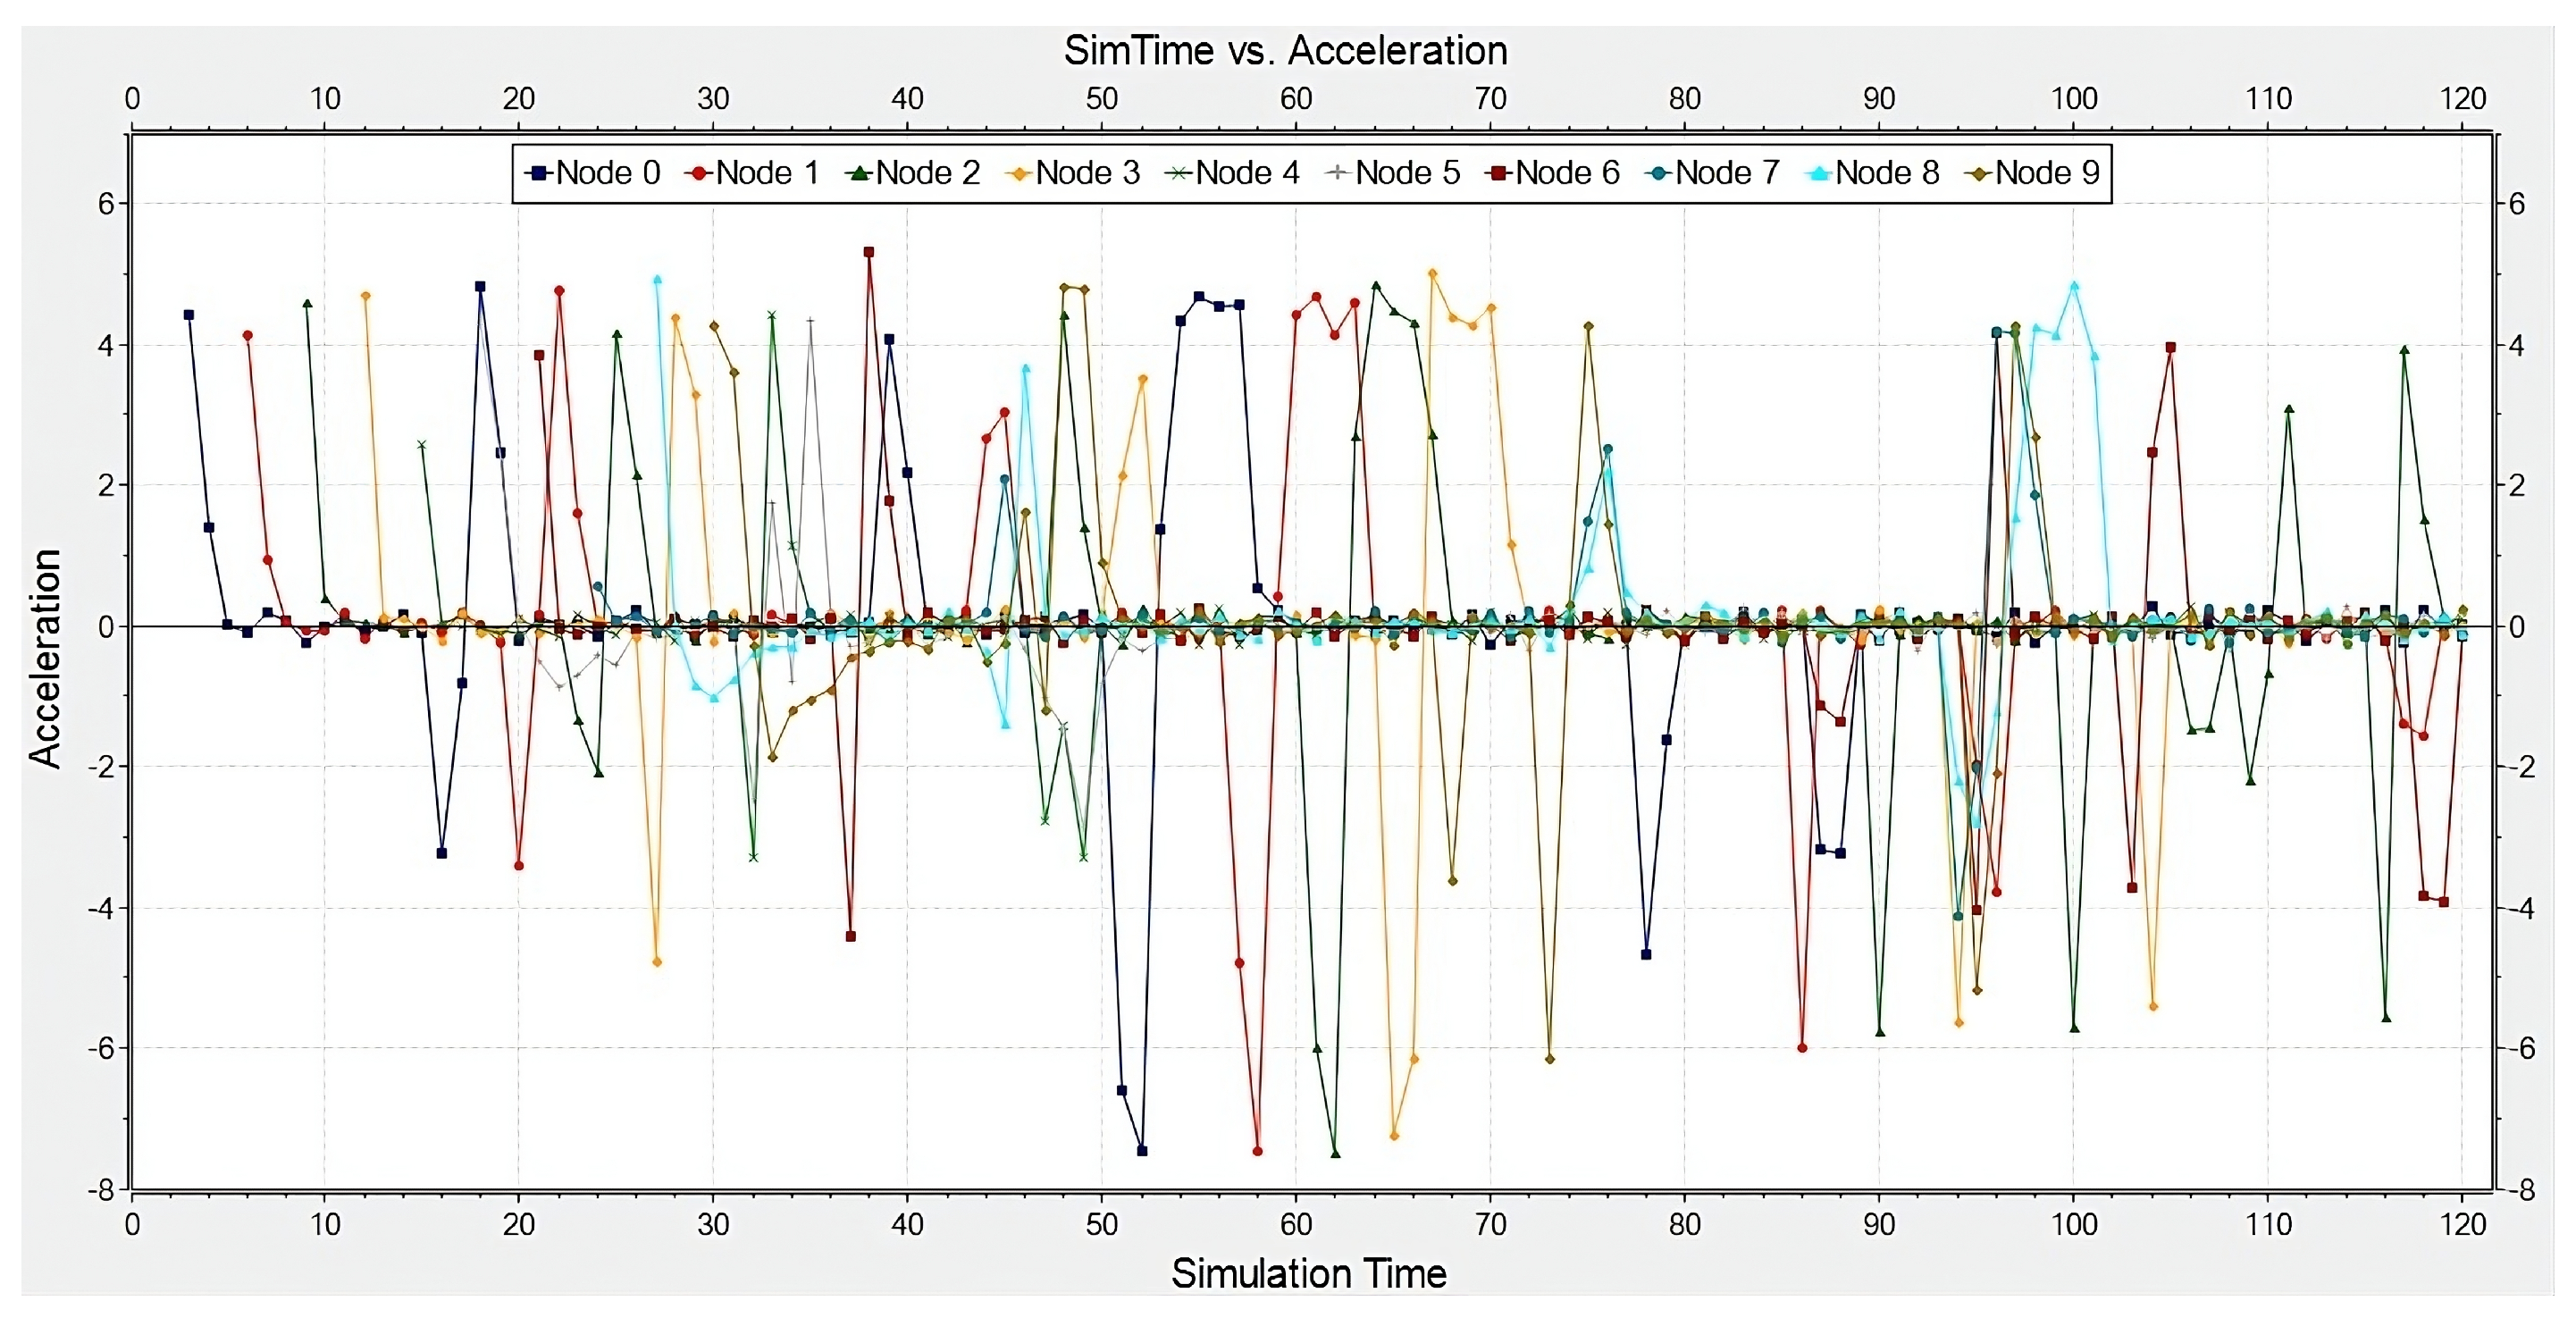
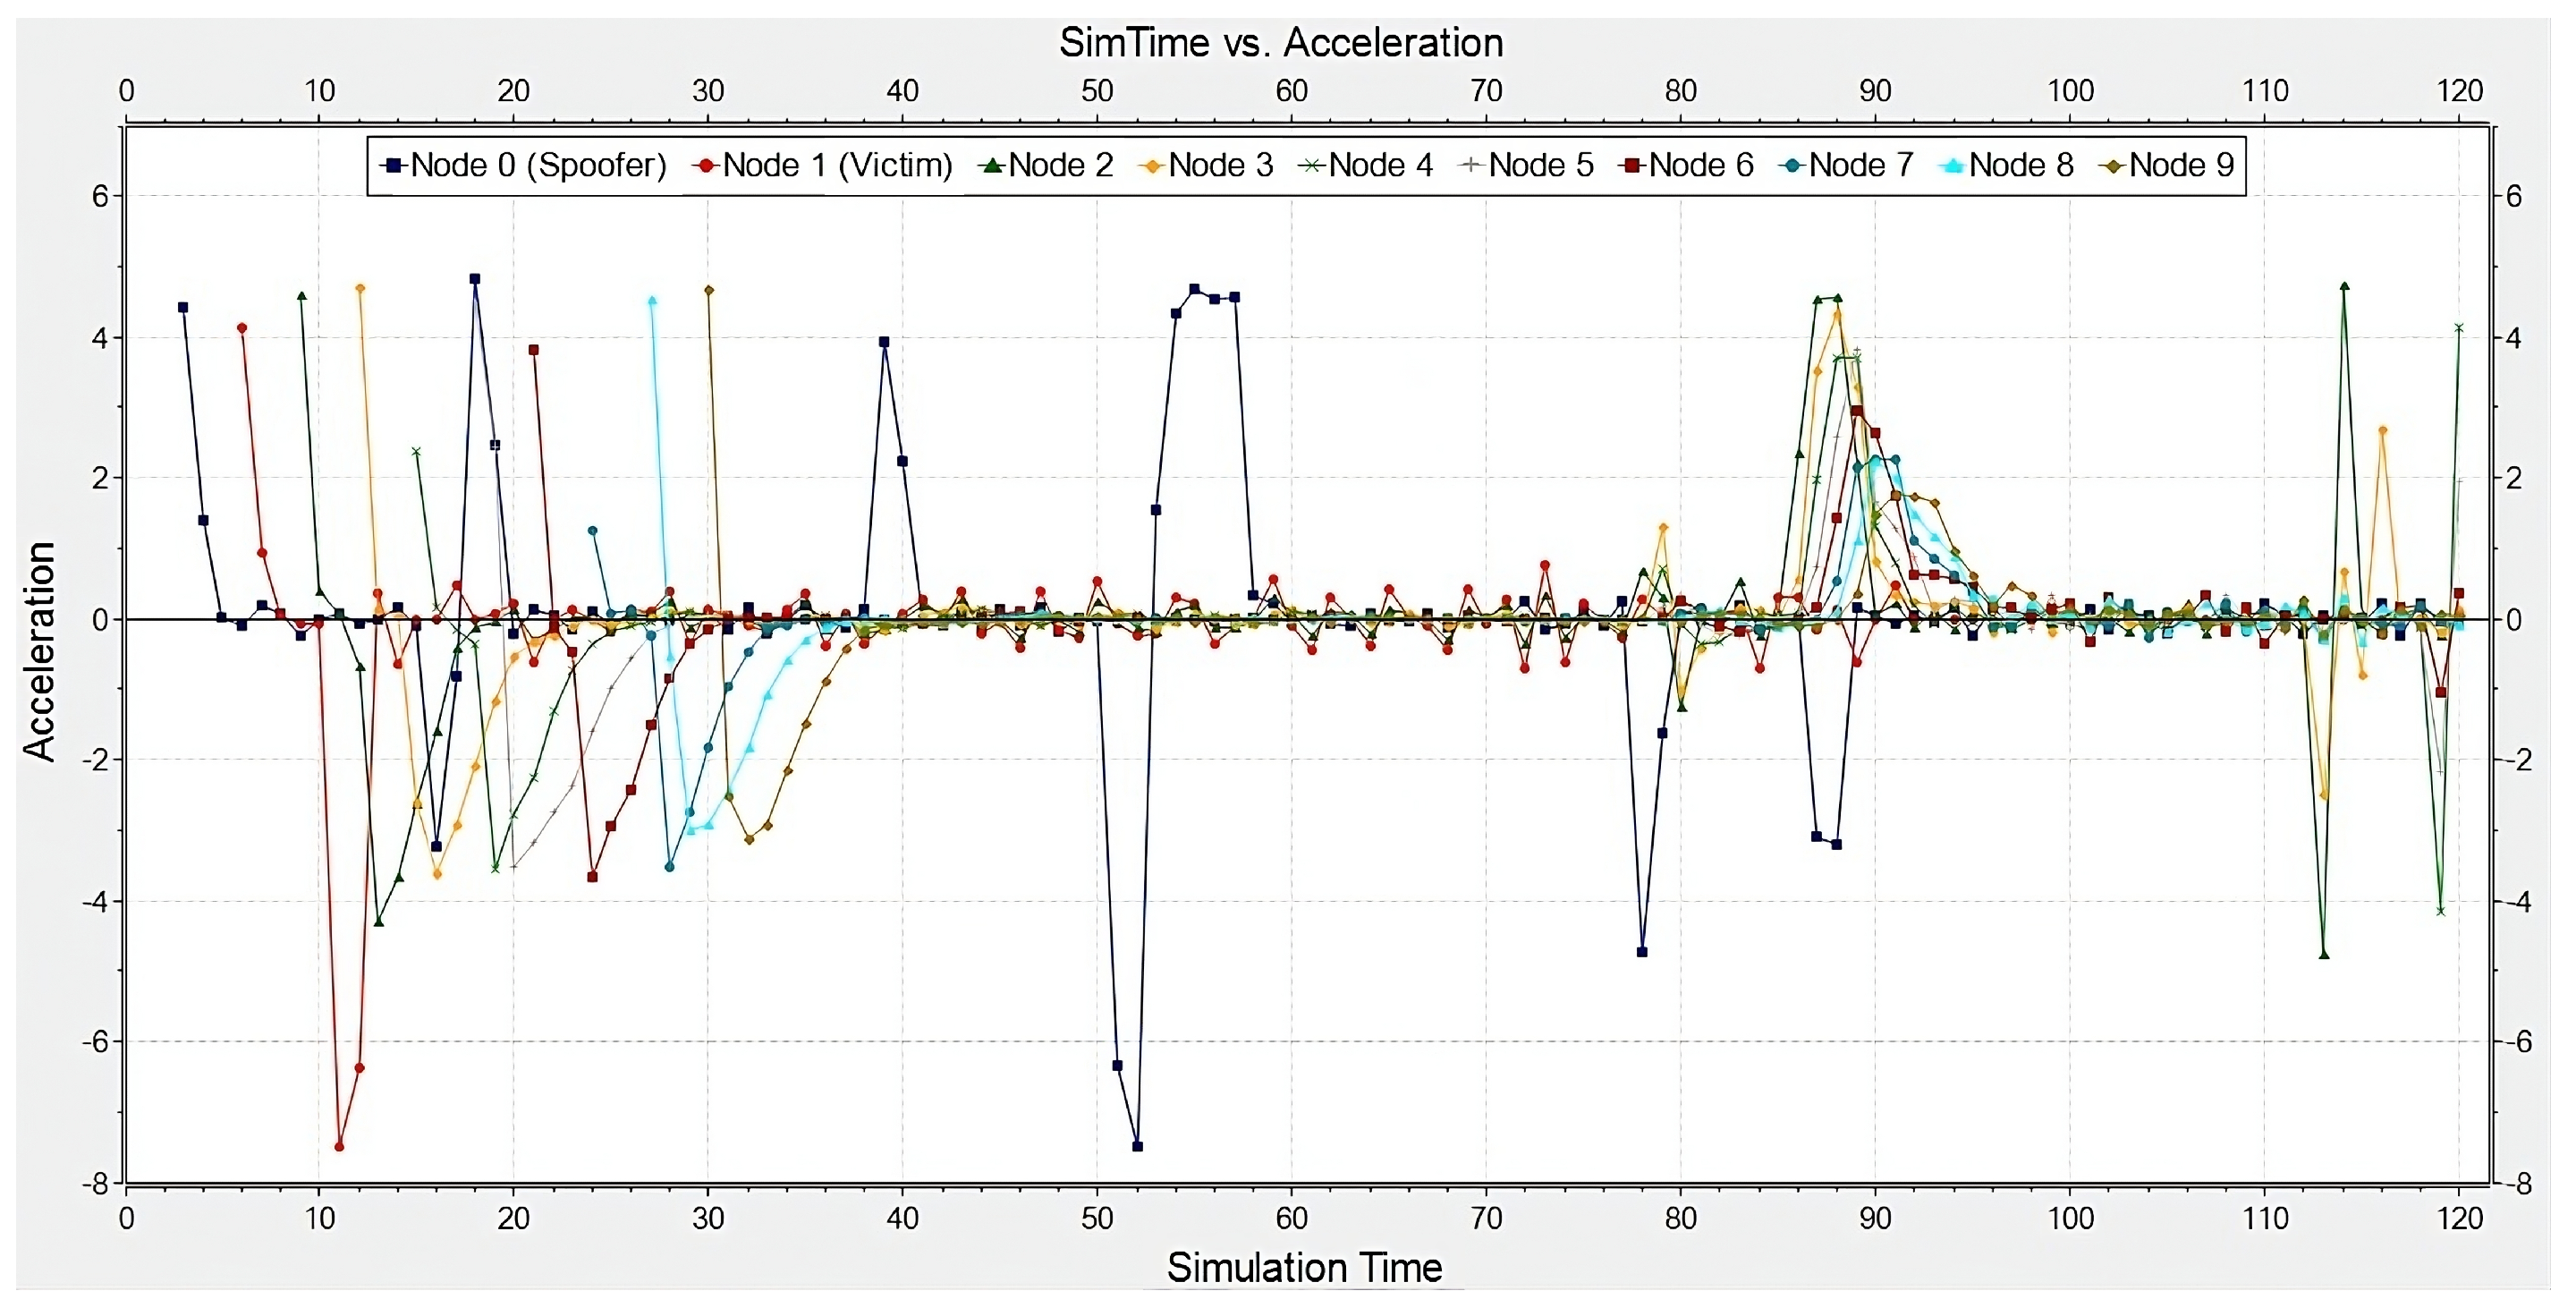
Effects of Spoofing Attack

The effects of the spoofing attack on the platoon’s movement are shown in the following experiments, in which speed and acceleration are compared against the two limit values of vehicle density: 10 and 25 vehicles/km. In Figure 5, Figure 6, Figure 7 and Figure 8, acceleration and velocity are displayed for a platoon of vehicles with size 10.
Moreover, in Figure 9, Figure 10, Figure 11 and Figure 12, acceleration and velocity are displayed for a platoon of vehicles with size 25.
The majority of published papers use driving volatility measures as the dominant safety measure to assess CAV behavior variation [20]. All variations in CAV behaviors, that is, sharp fluctuations in movement factors such as acceleration, deceleration, and speed, are expressed through volatility. The term volatility expresses a trade-off between security risks and lower comfort. Hence, the volatility metric is a prior indicator for a future potential crash. A measure of volatility based on [8] is CoV, which is given by the ratio of the standard deviation of the vector of the acceleration or the speed to the mean of the same vector showing relative dispersion in Equation (1).
C o V = S . D y ^
where standard deviation is represented by S . D and speed and acceleration–deceleration mean is represented by y ^ .
Conducting statistical analysis of the above results, according to 120 s in total observations (i.e., every 1 s of the total 120 s of the simulation time), we observe the CoV values for acceleration within the range values of 10, 15, 20, 25 vehicles/km in Table 2 and the CoV values for the speed within the same range values in Table 3. The main conclusion we draw regarding the volatility based metric is that, under the spoofing attack, the speed’s CoV increases by about 12.1%, as well as the absolute value of the acceleration CoV, but to a lesser extent. This is because, during the spoofing attack, the victim-vehicle and those behind it slow down sharply, resulting in a negative average acceleration value, and variations in the deceleration values were considerably higher as compared to the acceleration values. This also indicates increased risk of rear-end collisions. Finally, below these vehicle range values, the coefficients remain constant, which is due to this range being quite limited.
Figure 13 illustrates the comparison of the mean value of PDR for all the vehicles present in the area in the range of values defined in Table 1. It also shows the average total distance traveled by each vehicle during the simulation on a logarithmic scale, because the difference between normal scenario and spoofing attack scenario was quite large.
We observe that both PDR and total distance distribution approximate an exponential distribution with a very small parameter. Similarly, the same parameter’s distributions (PDR and the total distance) for the case of the spoofing attack we have implemented approach the cumulative distribution function (CDF) of an exponential distribution with a very small parameter. Therefore, the spoofing attack results in all vehicles traveling shorter distances than they would normally travel in the same amount of time, but at the same time significantly disrupts the wireless transmission medium (increasing the number of packets the vehicles transmit).
Figure 14 illustrates the average total traveled distance for all nodes with sporadic random values ( n = 10, 15, 20, 25 vehicles/km) in a range of 10 to 25 vehicles, which is reasonable for an urban area.
In this series of figures, the main conclusions are identical to those of Figure 13 above. What is clear is that the spoofing attack only affects victim node (1), causing it to move at minimal speeds throughout the rest of the simulation, and the effects on the following vehicles are significant but not that large. In addition, at these levels of density increase, we do not see a significant increase in distance traveled.

5. Conclusions

It is well known that there are security gaps in the case of spoofing attacks for VANETs. Our approach presented in this paper introduces a real traffic simulation scenario that reveals these gaps. We develop a robust simulation framework for a real-time vehicular network consisting of a number of vehicles and an RSU. Depending on the traffic conditions, we create a dynamic vehicles platoon. This simulation framework adeptly addresses VANETs’ complexities, notably in vehicle-to-vehicle communications, and investigates the vulnerabilities that connected vehicles may have to DoS attacks by malicious users. Our findings demonstrate substantial increase of driving distance under the effect of a spoofing attack while at the same time, an investigation of other levels of the network stack (e.g., PDR) also show potential weaknesses of such a spoofing attack since the WSMs being exchanged increase quite a bit. This is an element that can help identify an attacker more easily in a future detection system.
Summarizing, as a comparison to the current literature, we observe that there is no corresponding paper with a realistic simulation framework like the one proposed in this paper that takes into account real traffic conditions. The parameters also of volatility measures such as CoV are not completely close to zero, like in [8,12], which follow a theoretical approach, due to unexpected situations. When a DoS attack is implemented, the variability of speed and acceleration shows a small increase, leading to a larger CoV.
Finally, this work represents a preliminary version of a future holistic model that, in addition to implementing DoS attacks, will also contain a real-time attacker detection system using machine learning algorithms. Therefore, there are some limitations that will be improved, such as implementing attacks with a different number of attackers and with a different duration. Moreover, the implemented attacks will be tested under stochastic input models (e.g., the arrival rate of vehicles). Additionally, methods of authenticating the members of a platoon of vehicles with passive estimation methods of estimating parameters at the physical level (e.g., relative speed) [21] will be explored so that vehicles will be able to do cross-checking with the information exchanged by the messages. Our aim is to have future detection methods be based on AI techniques [22].

Author Contributions

Made substantial contributions to conception and design of the study and performed data analysis and interpretation: Z.-R.T. and D.K.; Performed data acquisition, as well as provided administrative, technical, and material support: A.X. and C.C. All authors have read and agreed to the published version of the manuscript.

Funding

This research received no external funding.

Data Availability Statement

The raw data supporting the conclusions of this article will be made available by the authors on request.

Conflicts of Interest

All authors declared that there are no conflicts of interest.

References

  1. Sharma, N.; Chauhan, N.; Chand, N. Security challenges in Internet of Vehicles (IoV) environment. In Proceedings of the 2018 First International Conference on Secure Cyber Computing and Communication (ICSCCC), Jalandhar, India, 15–17 December 2018; pp. 203–207. [Google Scholar] [CrossRef]
  2. Nanda, A.; Puthal, D.; Rodrigues, J.J.P.C.; Kozlov, S.A. Internet of Autonomous Vehicles Communications Security: Overview, Issues, and Directions. IEEE Wirel. Commun. 2019, 26, 60–65. [Google Scholar] [CrossRef]
  3. Kosmanos, D.; Pappas, A.; Maglaras, L.; Moschoyiannis, S.; Aparicio-Navarro, F.J.; Argyriou, A.; Janicke, H. A novel Intrusion Detection System against spoofing attacks in connected Electric Vehicles. Array 2020, 5, 100013. [Google Scholar] [CrossRef]
  4. Kosmanos, D.; Pappas, A.; Aparicio-Navarro, F.J.; Maglaras, L.; Janicke, H.; Boiten, E.; Argyriou, A. Intrusion Detection System for Platooning Connected Autonomous Vehicles. In Proceedings of the 2019 4th South-East Europe Design Automation, Computer Engineering, Computer Networks and Social Media Conference (SEEDA-CECNSM), Piraeus, Greece, 20–22 September 2019; pp. 1–9. [Google Scholar] [CrossRef]
  5. Kim, K.; Kim, J.S.; Jeong, S.; Park, J.H.; Kim, H.K. Cybersecurity for autonomous vehicles: Review of attacks and defense. Comput. Secur. 2021, 103, 102150. [Google Scholar] [CrossRef]
  6. Nahri, M.; Boulmakoul, A.; Karim, L.; Lbath, A. IoV distributed architecture for real-time traffic data analytics. Procedia Comput. Sci. 2018, 130, 480–487. [Google Scholar] [CrossRef]
  7. Wang, Z.; Wei, H.; Wang, J.; Zeng, X.; Chang, Y. Security Issues and Solutions for Connected and Autonomous Vehicles in a Sustainable City: A Survey. Sustainability 2022, 14, 12409. [Google Scholar] [CrossRef]
  8. Khattak, Z.H.; Smith, B.L.; Fontaine, M.D. Impact of cyberattacks on safety and stability of connected and automated vehicle platoons under lane changes. Accid. Anal. Prev. 2021, 150, 105861. [Google Scholar] [CrossRef] [PubMed]
  9. Yadav, S.; Redhu, P. Self-stabilization control on traffic flow of connected and automated vehicles under cyberattacks. Eur. Phys. J. Plus 2023, 138, 203–207. [Google Scholar] [CrossRef]
  10. Giannaros, A.; Karras, A.; Theodorakopoulos, L.; Karras, C.; Kranias, P.; Schizas, N.; Kalogeratos, G.; Tsolis, D. Autonomous Vehicles: Sophisticated Attacks, Safety Issues, Challenges, Open Topics, Blockchain, and Future Directions. J. Cybersecur. Priv. 2023, 3, 493–543. [Google Scholar] [CrossRef]
  11. Sun, Z.; Liu, R.; Hu, H.; Liu, D.; Yan, Z. Cyberattacks on connected automated vehicles: A traffic impact analysis. IET Intell. Transp. Syst. 2023, 17, 295–311. [Google Scholar] [CrossRef]
  12. Vamshi Krishna, K.; Ganesh Reddy, K. Classification of Distributed Denial of Service Attacks in VANET: A Survey. Wirel. Pers. Commun. 2023, 132, 933–964. [Google Scholar] [CrossRef]
  13. Qurashi, J.M.; Jambi, K.M.; Eassa, F.E.; Khemakhem, M.; Alsolami, F.; Basuhail, A.A. Toward Attack Modeling Technique Addressing Resilience in Self-Driving Car. IEEE Access 2023, 11, 2652–2673. [Google Scholar] [CrossRef]
  14. Chowdhury, A.; Karmakar, G.; Kamruzzaman, J.; Jolfaei, A.; Das, R. Attacks on Self-Driving Cars and Their Countermeasures: A Survey. IEEE Access 2020, 8, 207308–207342. [Google Scholar] [CrossRef]
  15. Treiber, M.; Kesting, A. Chapter 16: Calibration and Validation. In Traffic Flow Dynamics: Data, Models and Simulation; Springer: Berlin/Heidelberg, Germany, 2013; pp. 303–337. [Google Scholar] [CrossRef]
  16. Gipps, P.G. A behavioural car-following model for computer simulation. Transp. Res. Part B Methodol. 1981, 15, 105–111. [Google Scholar] [CrossRef]
  17. Kloukiniotis, A.; Papandreou, A.; Lalos, A.; Kapsalas, P.; Nguyen, D.V.; Moustakas, K. Countering Adversarial Attacks on Autonomous Vehicles Using Denoising Techniques: A Review. IEEE Open J. Intell. Transp. Syst. 2022, 3, 61–80. [Google Scholar] [CrossRef]
  18. IEEE. IEEE Draft Standard for Information Technology—Telecommunications and Information Exchange Between Systems Local and Metropolitan Area Networks—Specific Requirements Part 11: Wireless LAN Medium Access Control (MAC) and Physical Layer (PHY) Specifications—Enhancements for Positioning; IEEE: Piscataway, NJ, USA, 2019; pp. 1–187. [Google Scholar]
  19. Sommer, C.; German, R.; Dressler, F. Bidirectionally Coupled Network and Road Traffic Simulation for Improved IVC Analysis. IEEE Trans. Mob. Comput. 2011, 10, 3–15. [Google Scholar] [CrossRef]
  20. Wang, X.; Khattak, A.J.; Liu, J.; Masghati-Amoli, G.; Son, S. What is the level of volatility in instantaneous driving decisions? Transp. Res. Part C Emerg. Technol. 2015, 58, 413–427. [Google Scholar] [CrossRef]
  21. Kosmanos, D.; Argyriou, A.; Maglaras, L. Estimating the Relative Speed of RF Jammers in VANETs. Secur. Commun. Netw. 2019, 2019, 18. [Google Scholar] [CrossRef]
  22. Adhikari, M.; Munusamy, A.; Hazra, A.; Menon, V.G.; Anavangot, V.; Puthal, D. Security in Edge-Centric Intelligent Internet of Vehicles: Issues and Remedies. IEEE Consum. Electron. Mag. 2022, 11, 24–31. [Google Scholar] [CrossRef]
Figure 1. Vehicle route, highlighting its start and end points.
Telecom 05 00037 g001
Figure 2. (a) The platoon of vehicles under normal conditions; (b) the platoon of vehicles under spoofing attack.
Telecom 05 00037 g002
Figure 3. Vehicles create a queue of vehicles with almost zero speed due to spoofing attack while the Node 0 (Spoofer) continues its route normally.
Telecom 05 00037 g003
Figure 4. At the next crossroads, the vehicles from the node “Node 2” (in blue) and below are dynamically separated from the influence of the Victim node “Node 1” (in red) and continue their course on an alternative route. The green shows the notification of nodes in serial mode for “Change Route()”.
Telecom 05 00037 g004
Figure 5. Speed of platoon of vehicles in normal scenario.
Telecom 05 00037 g005
Figure 6. Speed of platoon of vehicles in spoofing attack scenario with a density of 10 vehicles/km.
Telecom 05 00037 g006
Figure 7. Acceleration of platoon of vehicles in normal scenario.
Telecom 05 00037 g007
Figure 8. Acceleration of platoon of vehicles in spoofing attack scenario with a density of 10 vehicles/km.
Telecom 05 00037 g008
Figure 9. Speed of platoon of vehicles with 25 vehicles/km in normal scenario.
Telecom 05 00037 g009
Figure 10. Speed of platoon of vehicles in spoofing attack scenario with a density of 25 vehicles/km.
Telecom 05 00037 g010
Figure 11. Acceleration of platoon of vehicles with 25 vehicles/km in normal scenario.
Telecom 05 00037 g011
Figure 12. Acceleration of platoon of vehicles in spoofing attack scenario with a density of 25 vehicles/km.
Telecom 05 00037 g012
Figure 13. Mean value of PDR and average total distance for different vehicle density values.
Telecom 05 00037 g013
Figure 14. Bar graphs for average total traveled distance for all nodes within a range of vehicle density.
Telecom 05 00037 g014
Table 1. Simulation parameters.
Evaluation Parameters in Veins SimulatorNormal ScenarioSpoofing Attack Scenario
Number of Lanesone per directionone per direction
Row11
RSU11
Total Simulation Time120 s120 s
Duration of Attack0 s110 s
Range of Vehicles (vehicles/km)10, 15, 20, 2510, 15, 20, 25
Desired Speed50 m/s 50 m / s
Maximum Acceleration 6.0 m / s 2 6.0 m / s 2
Maximum Deceleration 7.5 m / s 2 7.5 m / s 2
Reaction Time 1.0 to 1.5 s 1.0 to 1.5 s
Vehicle Length22
Minimum Gap2.5 m2.5 m
Victim01 (Node 1)
Spoofing Attackers01
Table 2. CoV values for acceleration.
Kind of AttackDensity of 10 vehicles/kmDensity of 15 vehicles/kmDensity of 20 vehicles/kmDensity of 25 vehicles/km
Normal Scenario664.9341678.5202679.1850679.1850
Spoofing Attack Scenario−682.9962−678.0775−680.5207−694.6582
Table 3. CoV values for speed.
Kind of AttackDensity of 10 vehicles/kmDensity of 15 vehicles/kmDensity of 20 vehicles/kmDensity of 25 vehicles/km
Normal Scenario23.412623.527223.517223.5172
Spoofing Attack Scenario190.6639191.2707190.8419190.8157
Disclaimer/Publisher’s Note: The statements, opinions and data contained in all publications are solely those of the individual author(s) and contributor(s) and not of MDPI and/or the editor(s). MDPI and/or the editor(s) disclaim responsibility for any injury to people or property resulting from any ideas, methods, instructions or products referred to in the content.

