Author Contributions
Conceptualization, A.R. and S.A.; methodology, A.R.; software, A.R.; validation, A.R. and S.A.; formal analysis, A.R.; investigation, A.R. and S.A.; resources, S.A., H.W. and T.W.; data curation, A.R.; writing—original draft preparation, A.R.; writing—review and editing, S.A.; visualization, A.R.; supervision, S.A.; project administration, S.A., H.W. and T.W. All authors have read and agreed to the published version of the manuscript.
Figure 1.
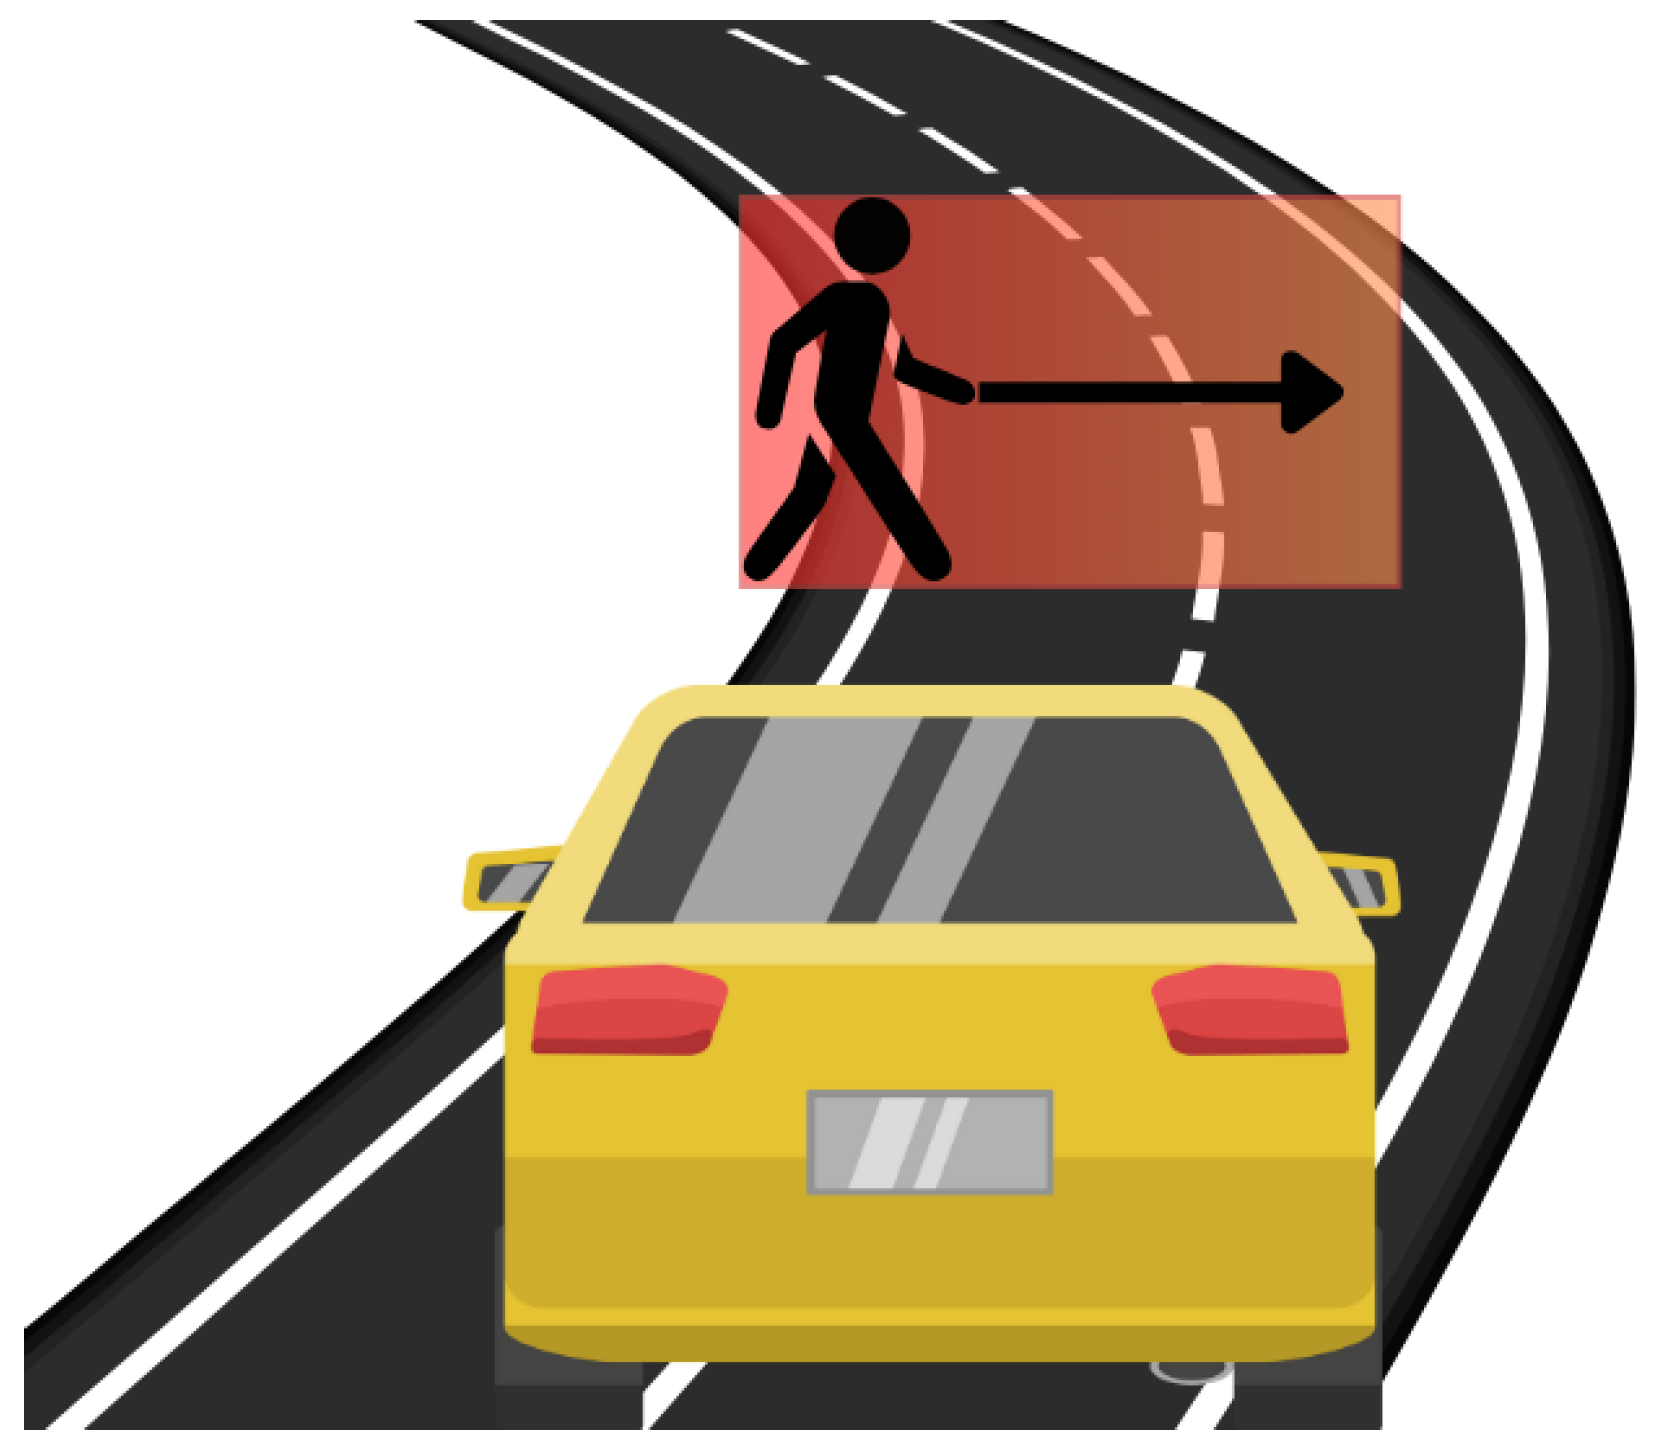
Importance of detection and tracking of objects for an autonomous vehicle. Understanding the position and motion of the object in front helps the vehicle in planning trajectories to avoid collision.
Figure 1.
Importance of detection and tracking of objects for an autonomous vehicle. Understanding the position and motion of the object in front helps the vehicle in planning trajectories to avoid collision.
Figure 2.
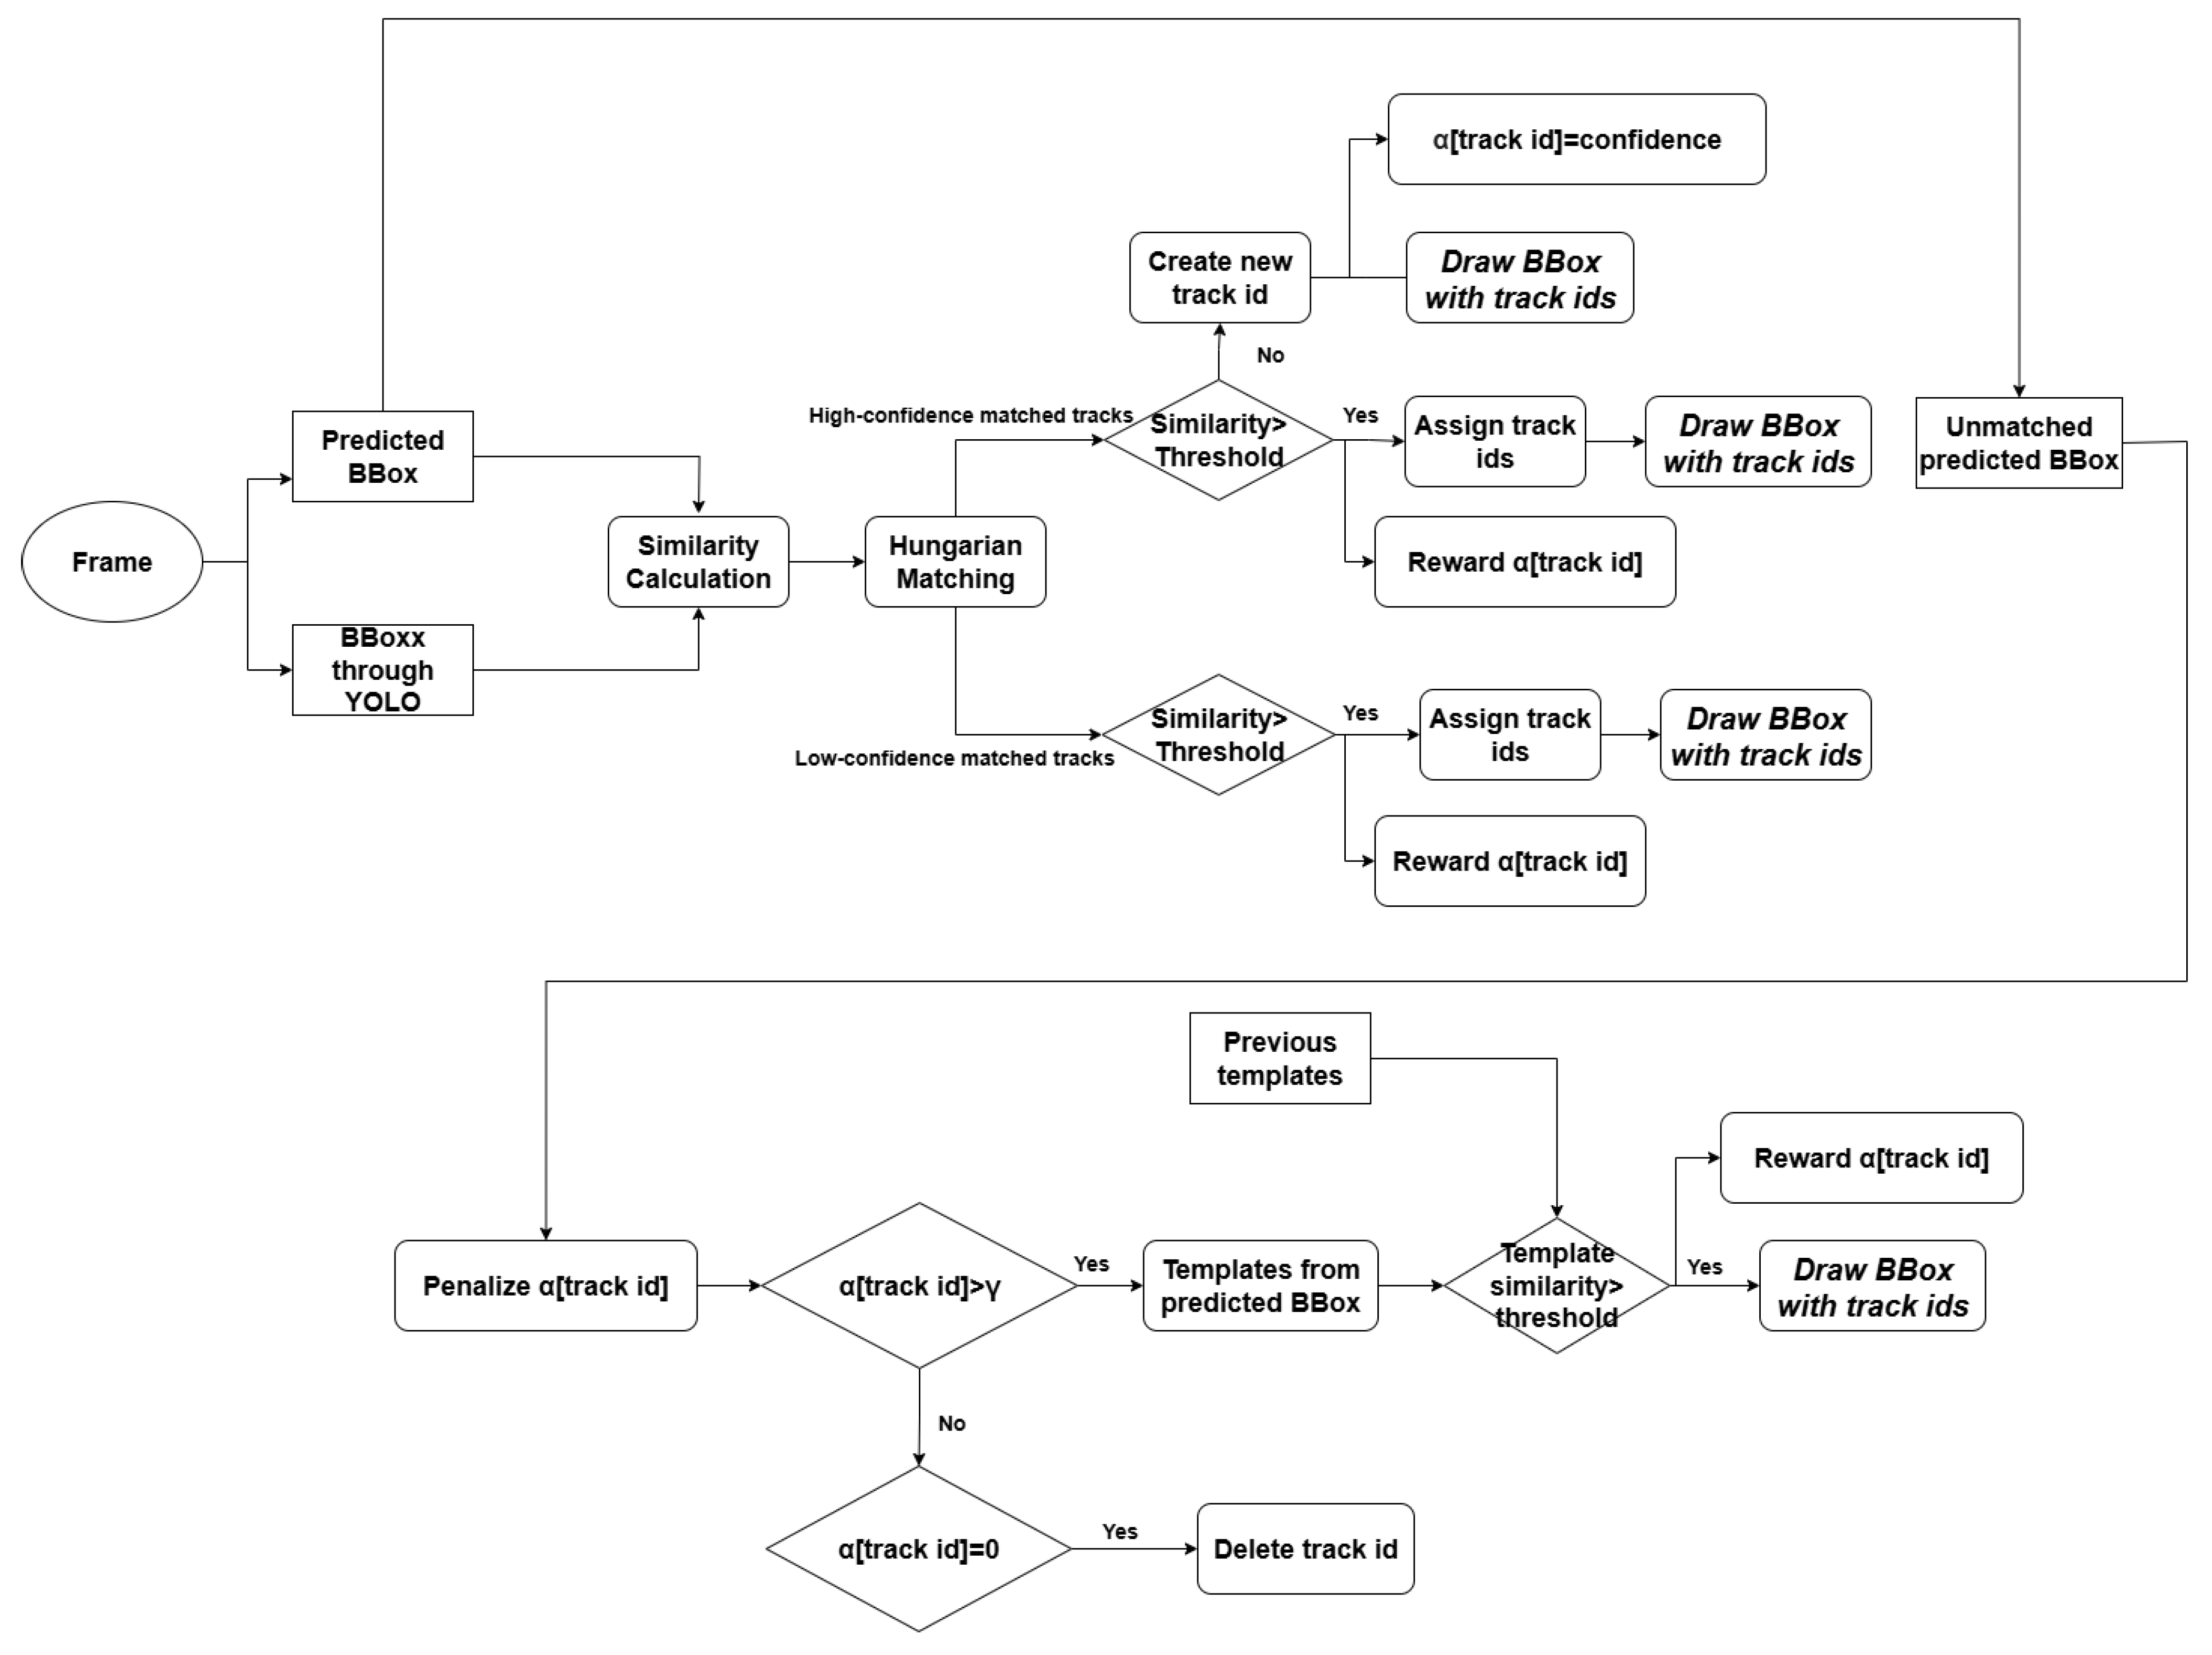
Overview of PrED.
Figure 2.
Overview of PrED.
Figure 3.
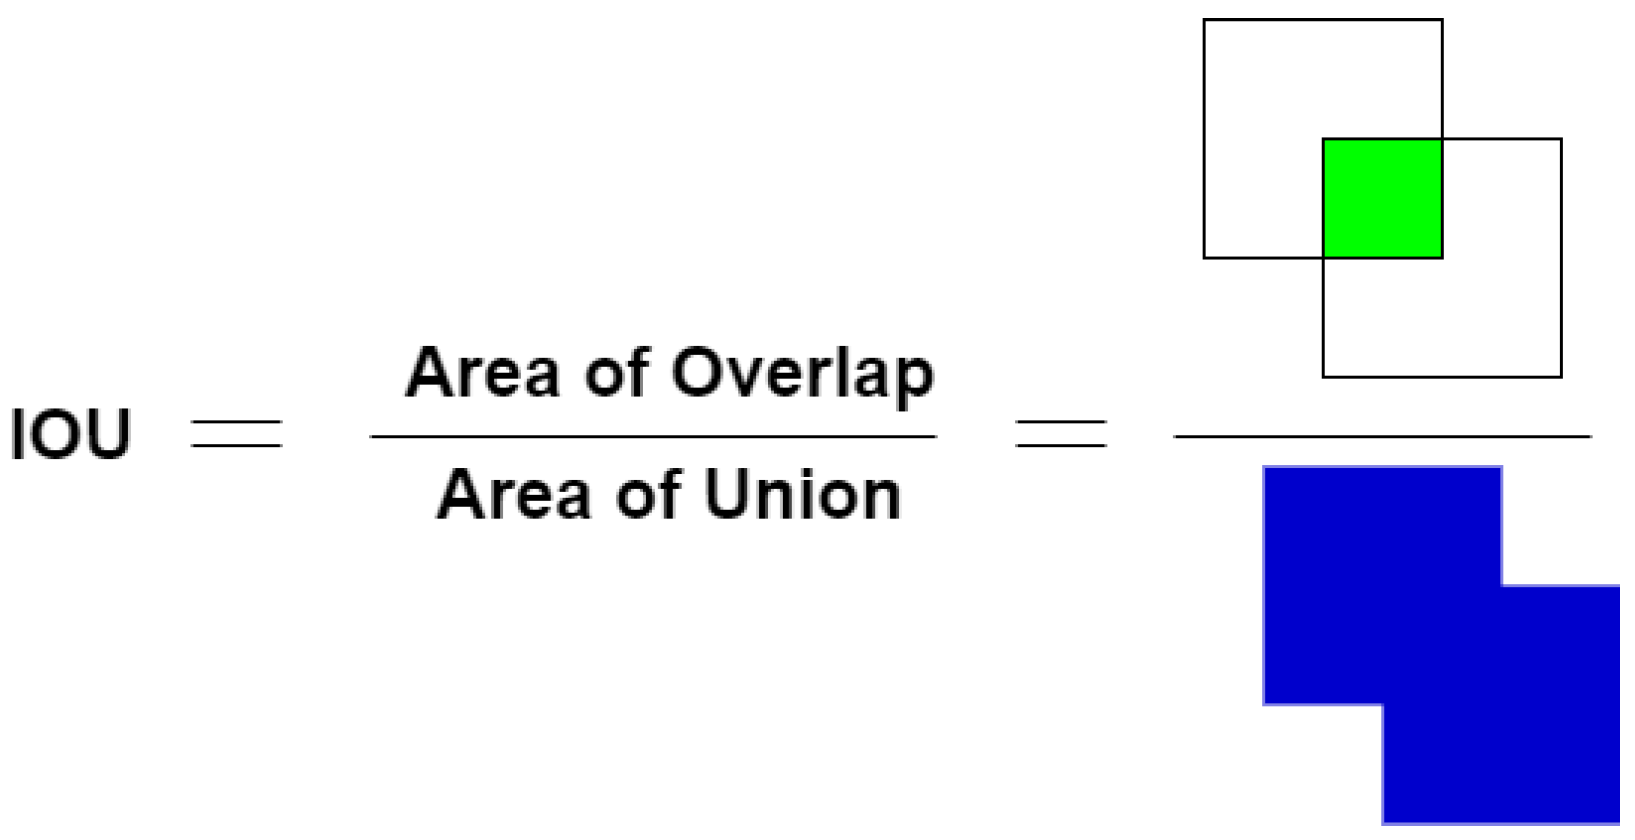
IOU calculation.
Figure 3.
IOU calculation.
Figure 4.
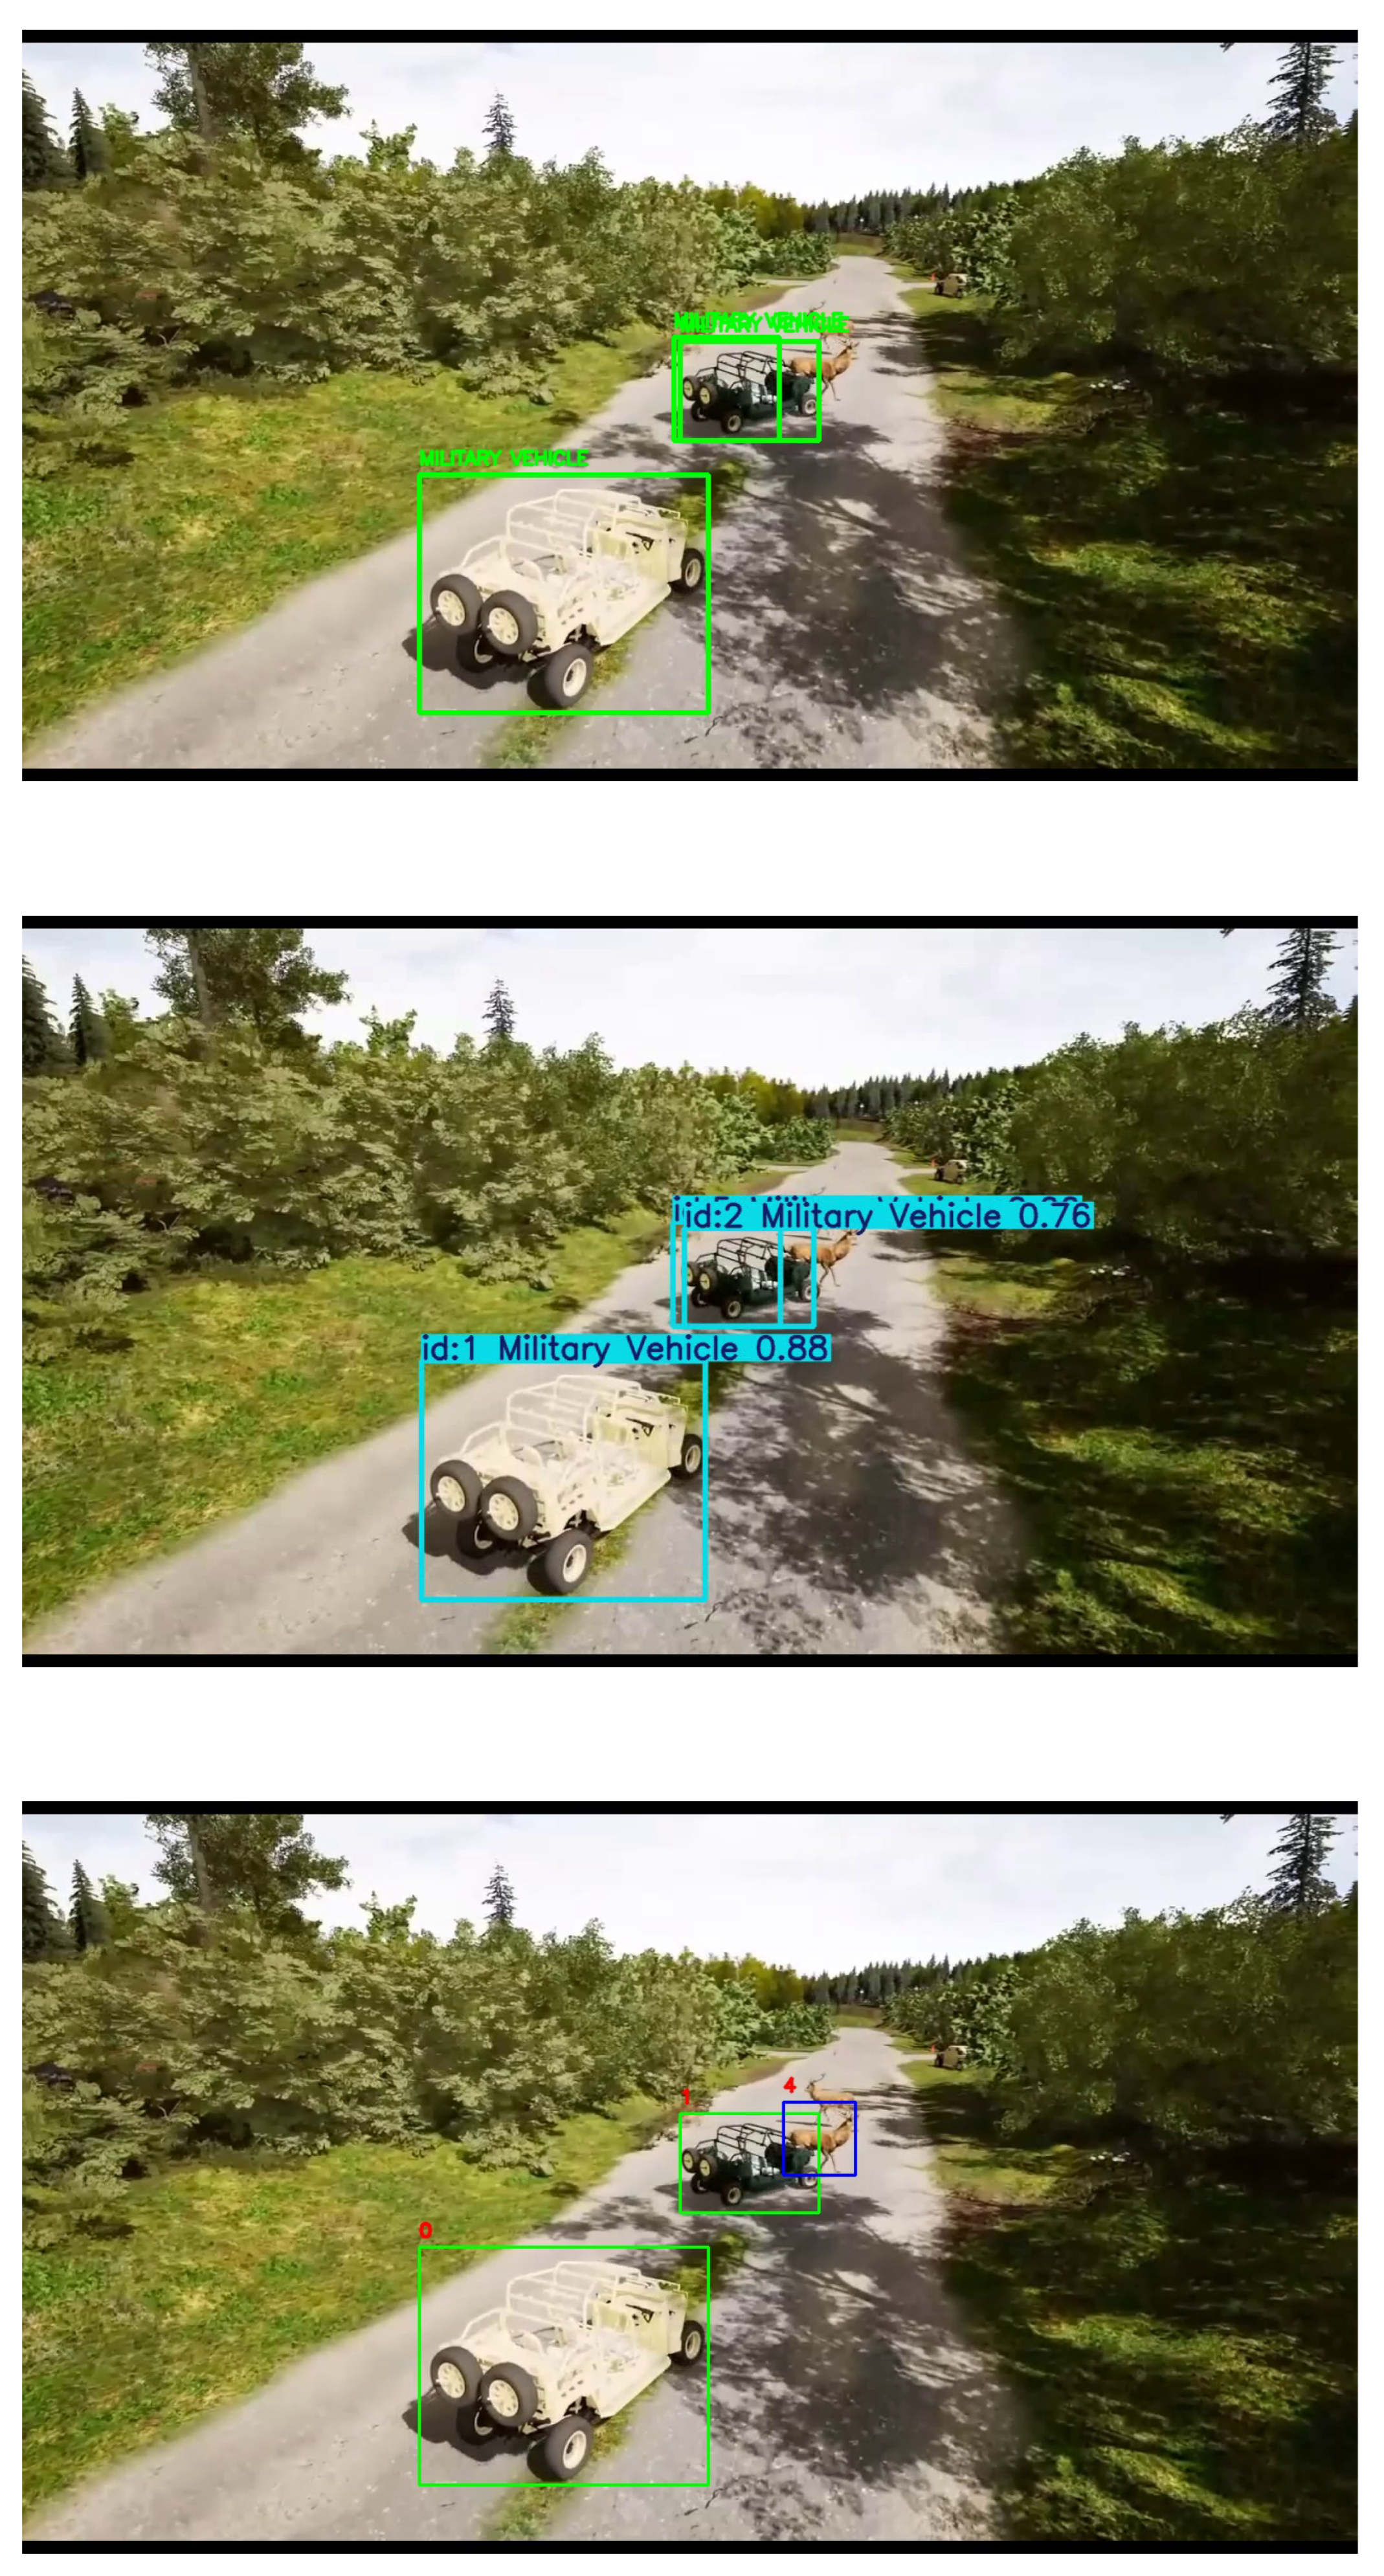
Deleting redundant bounding boxes for the same objects by PrED (bottom). Both of the bounding boxes are of high confidence scores, as predicted by base YOLO (top). ByteTrack (middle) also treats both of the bounding boxes as separate detections.
Figure 4.
Deleting redundant bounding boxes for the same objects by PrED (bottom). Both of the bounding boxes are of high confidence scores, as predicted by base YOLO (top). ByteTrack (middle) also treats both of the bounding boxes as separate detections.
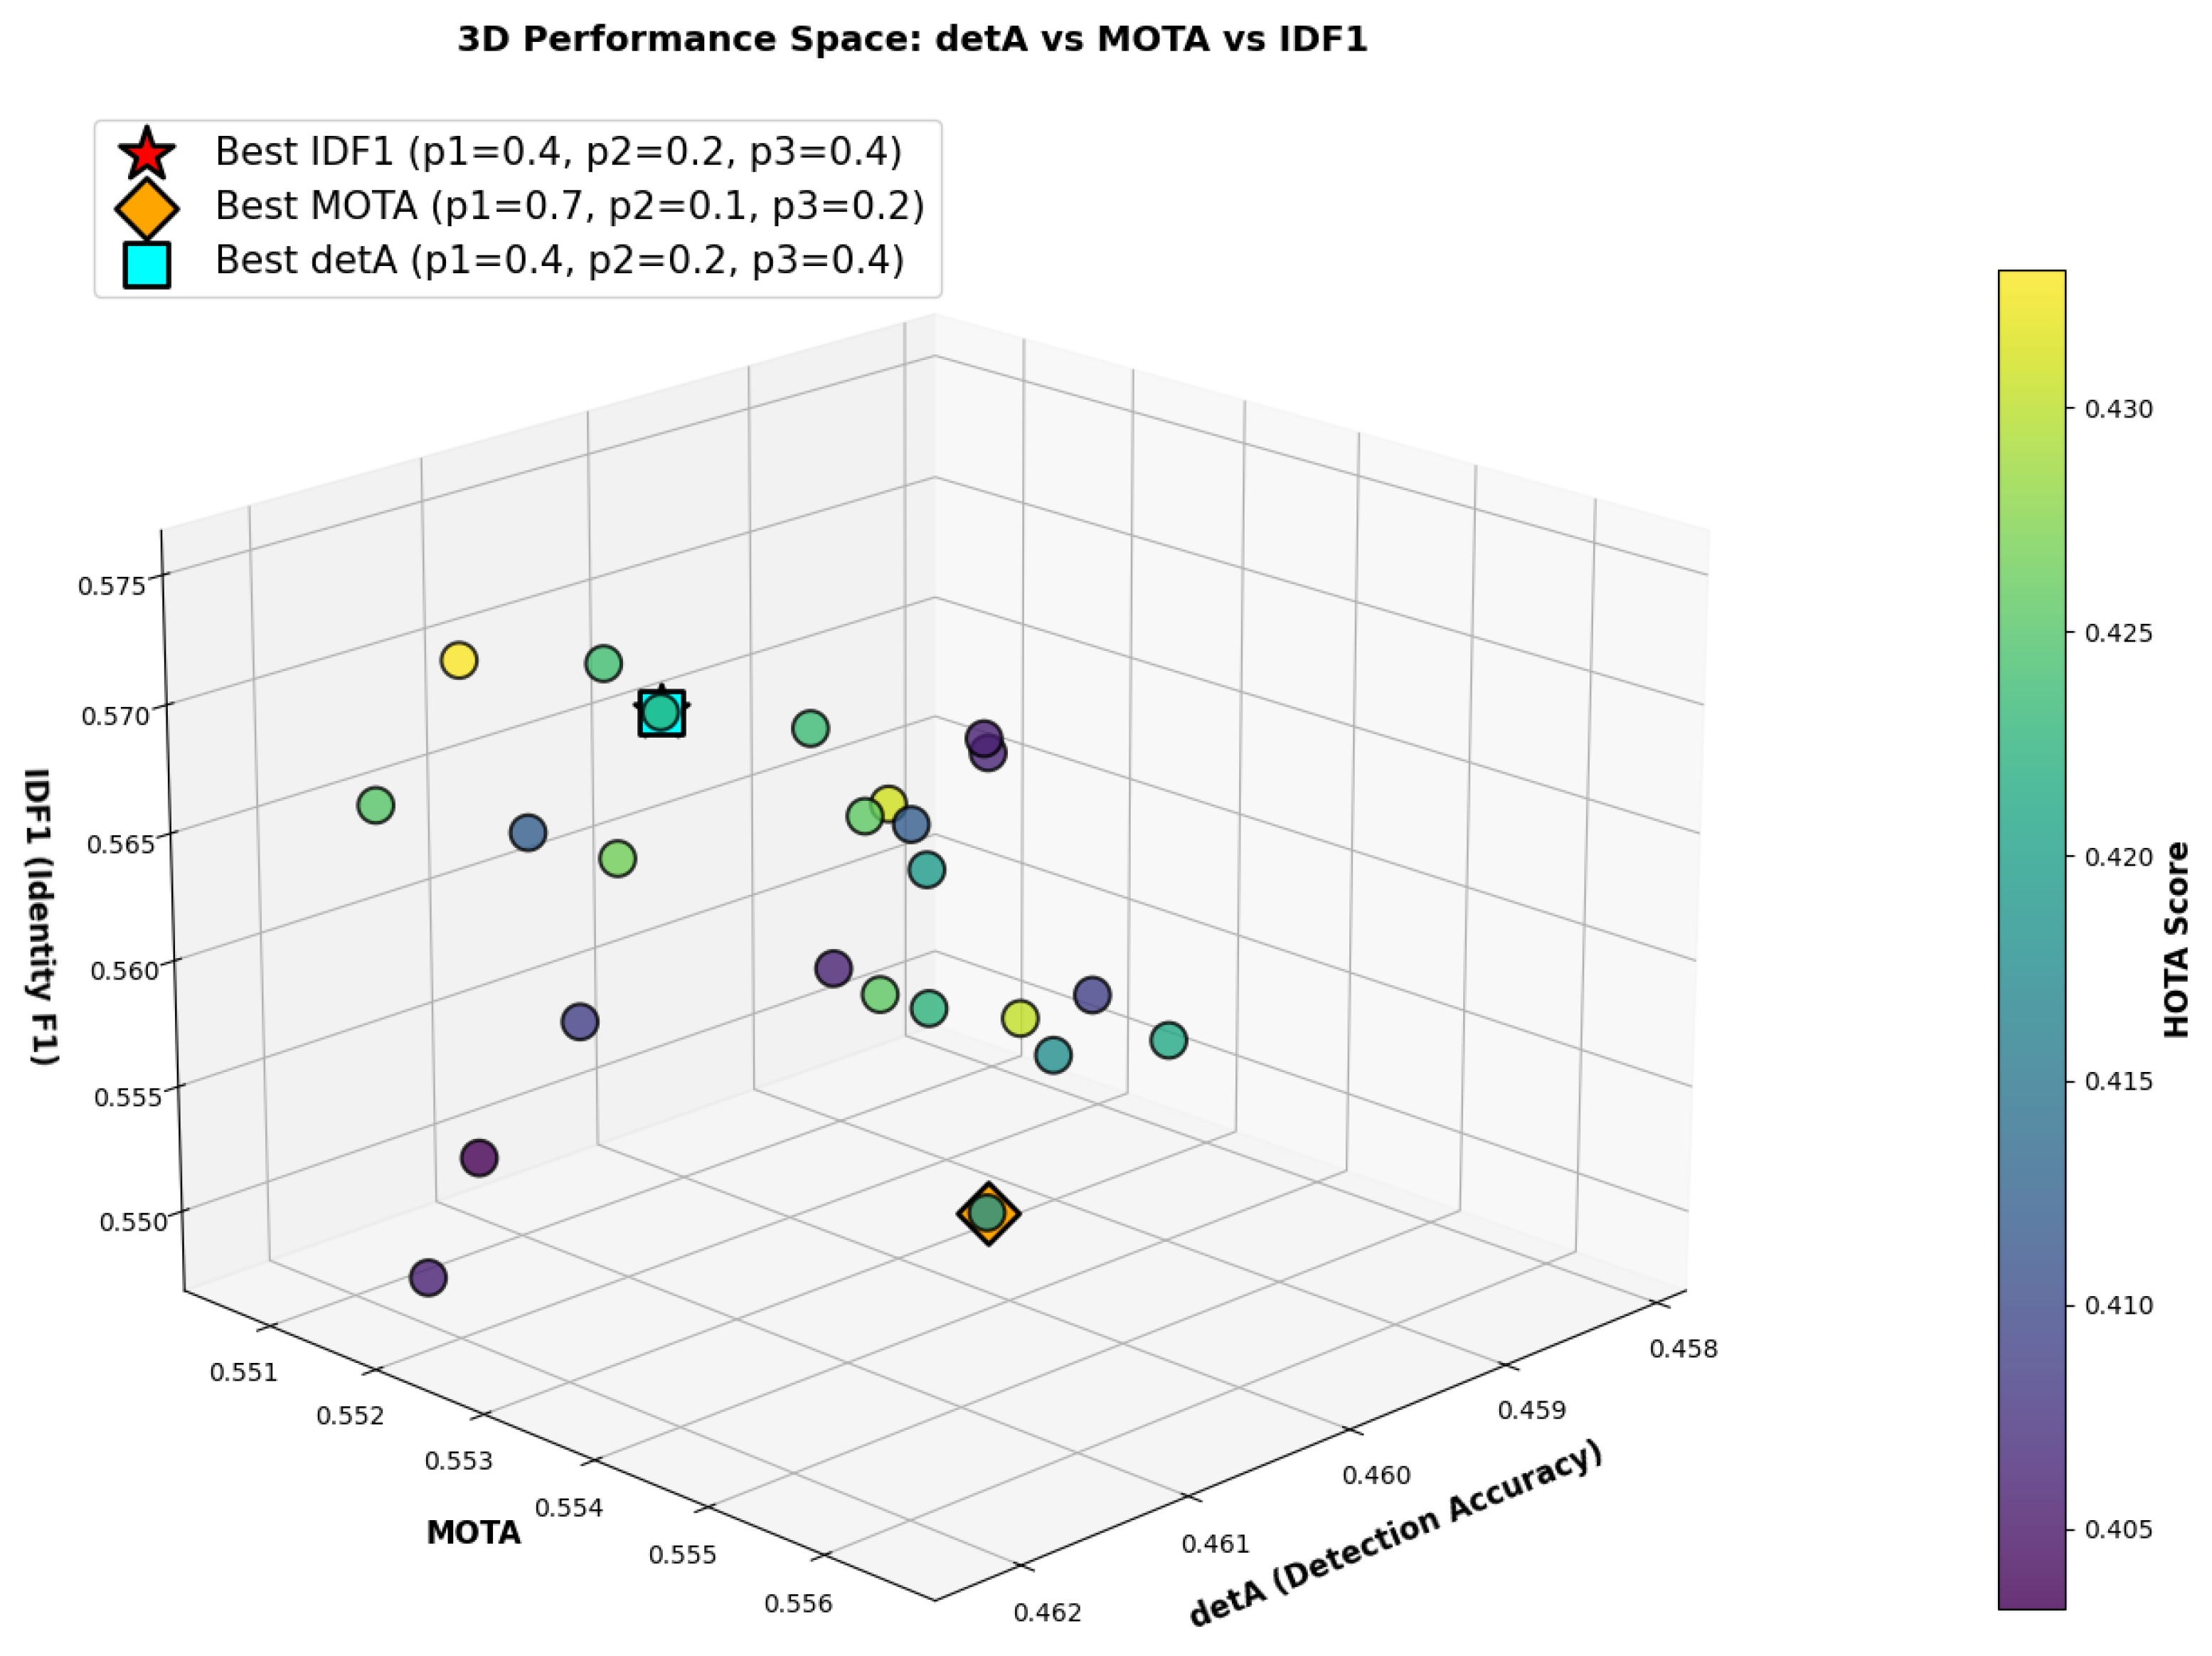
Figure 5.
Performance trends for different combinations of P1, P2, and P3. The grid search was conducted on the MOT17-13 sequence.
Figure 5.
Performance trends for different combinations of P1, P2, and P3. The grid search was conducted on the MOT17-13 sequence.
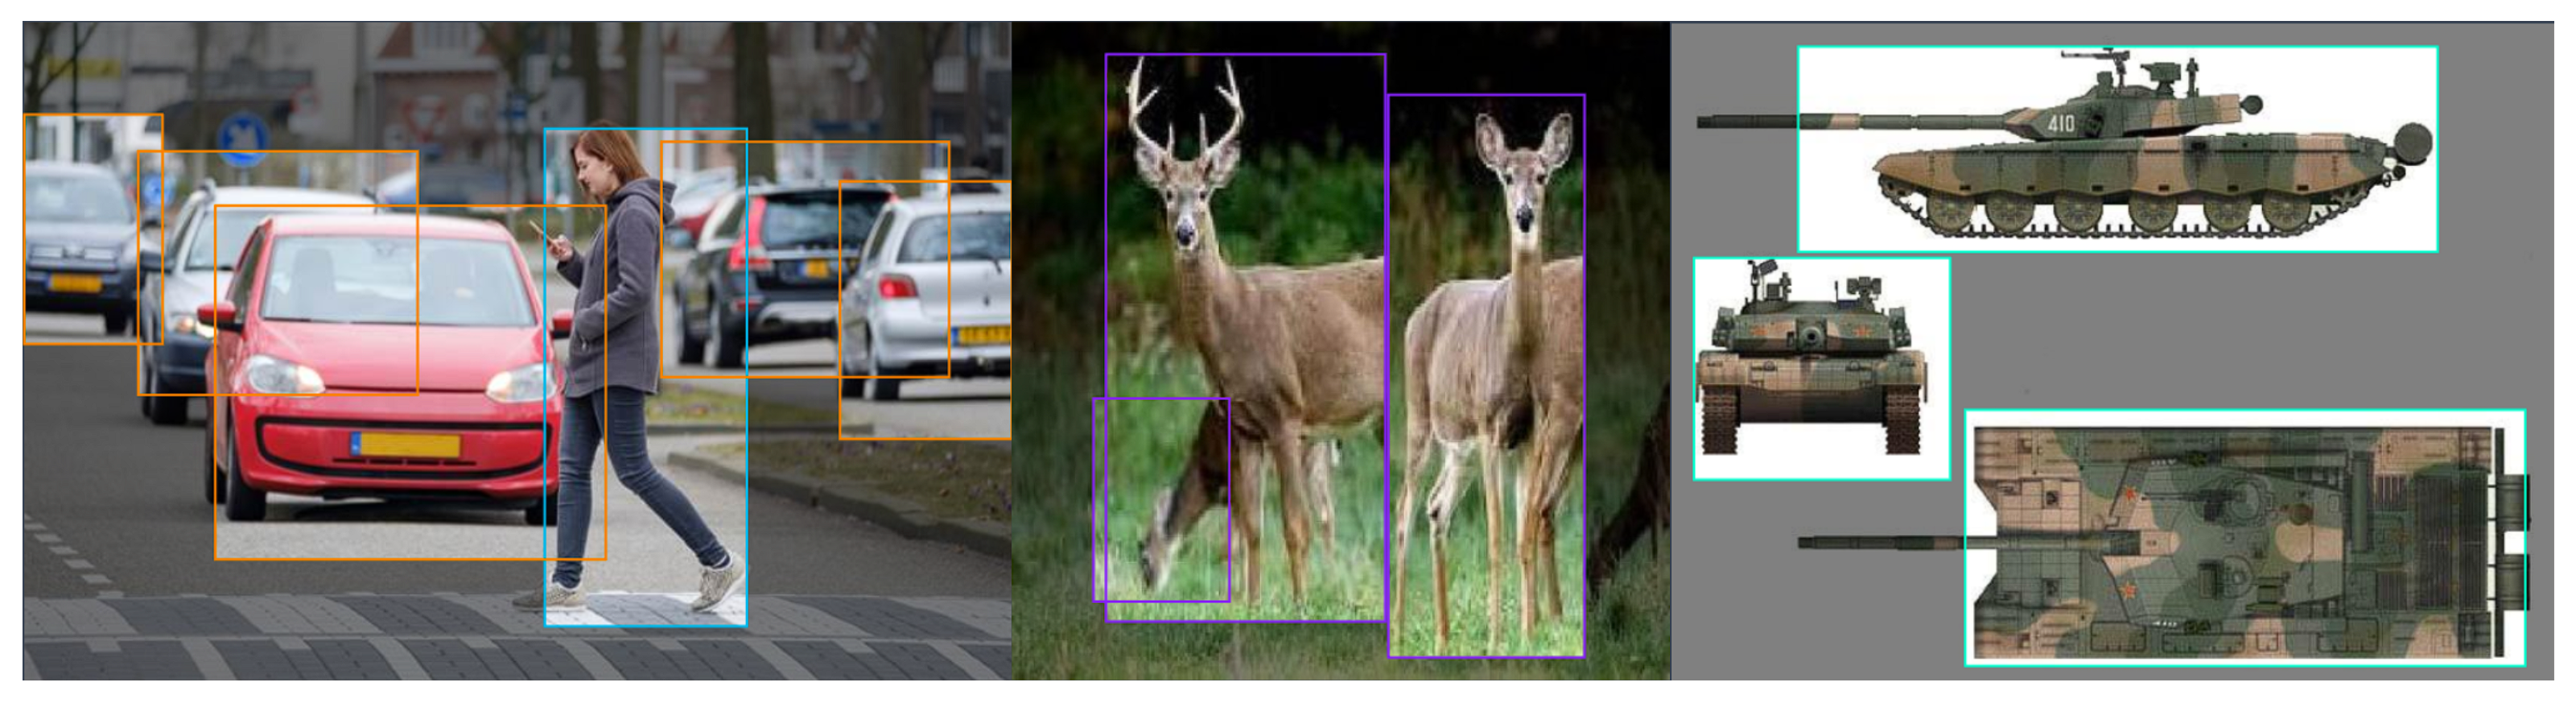
Figure 6.
Sample training images for the custom scenario model.
Figure 6.
Sample training images for the custom scenario model.
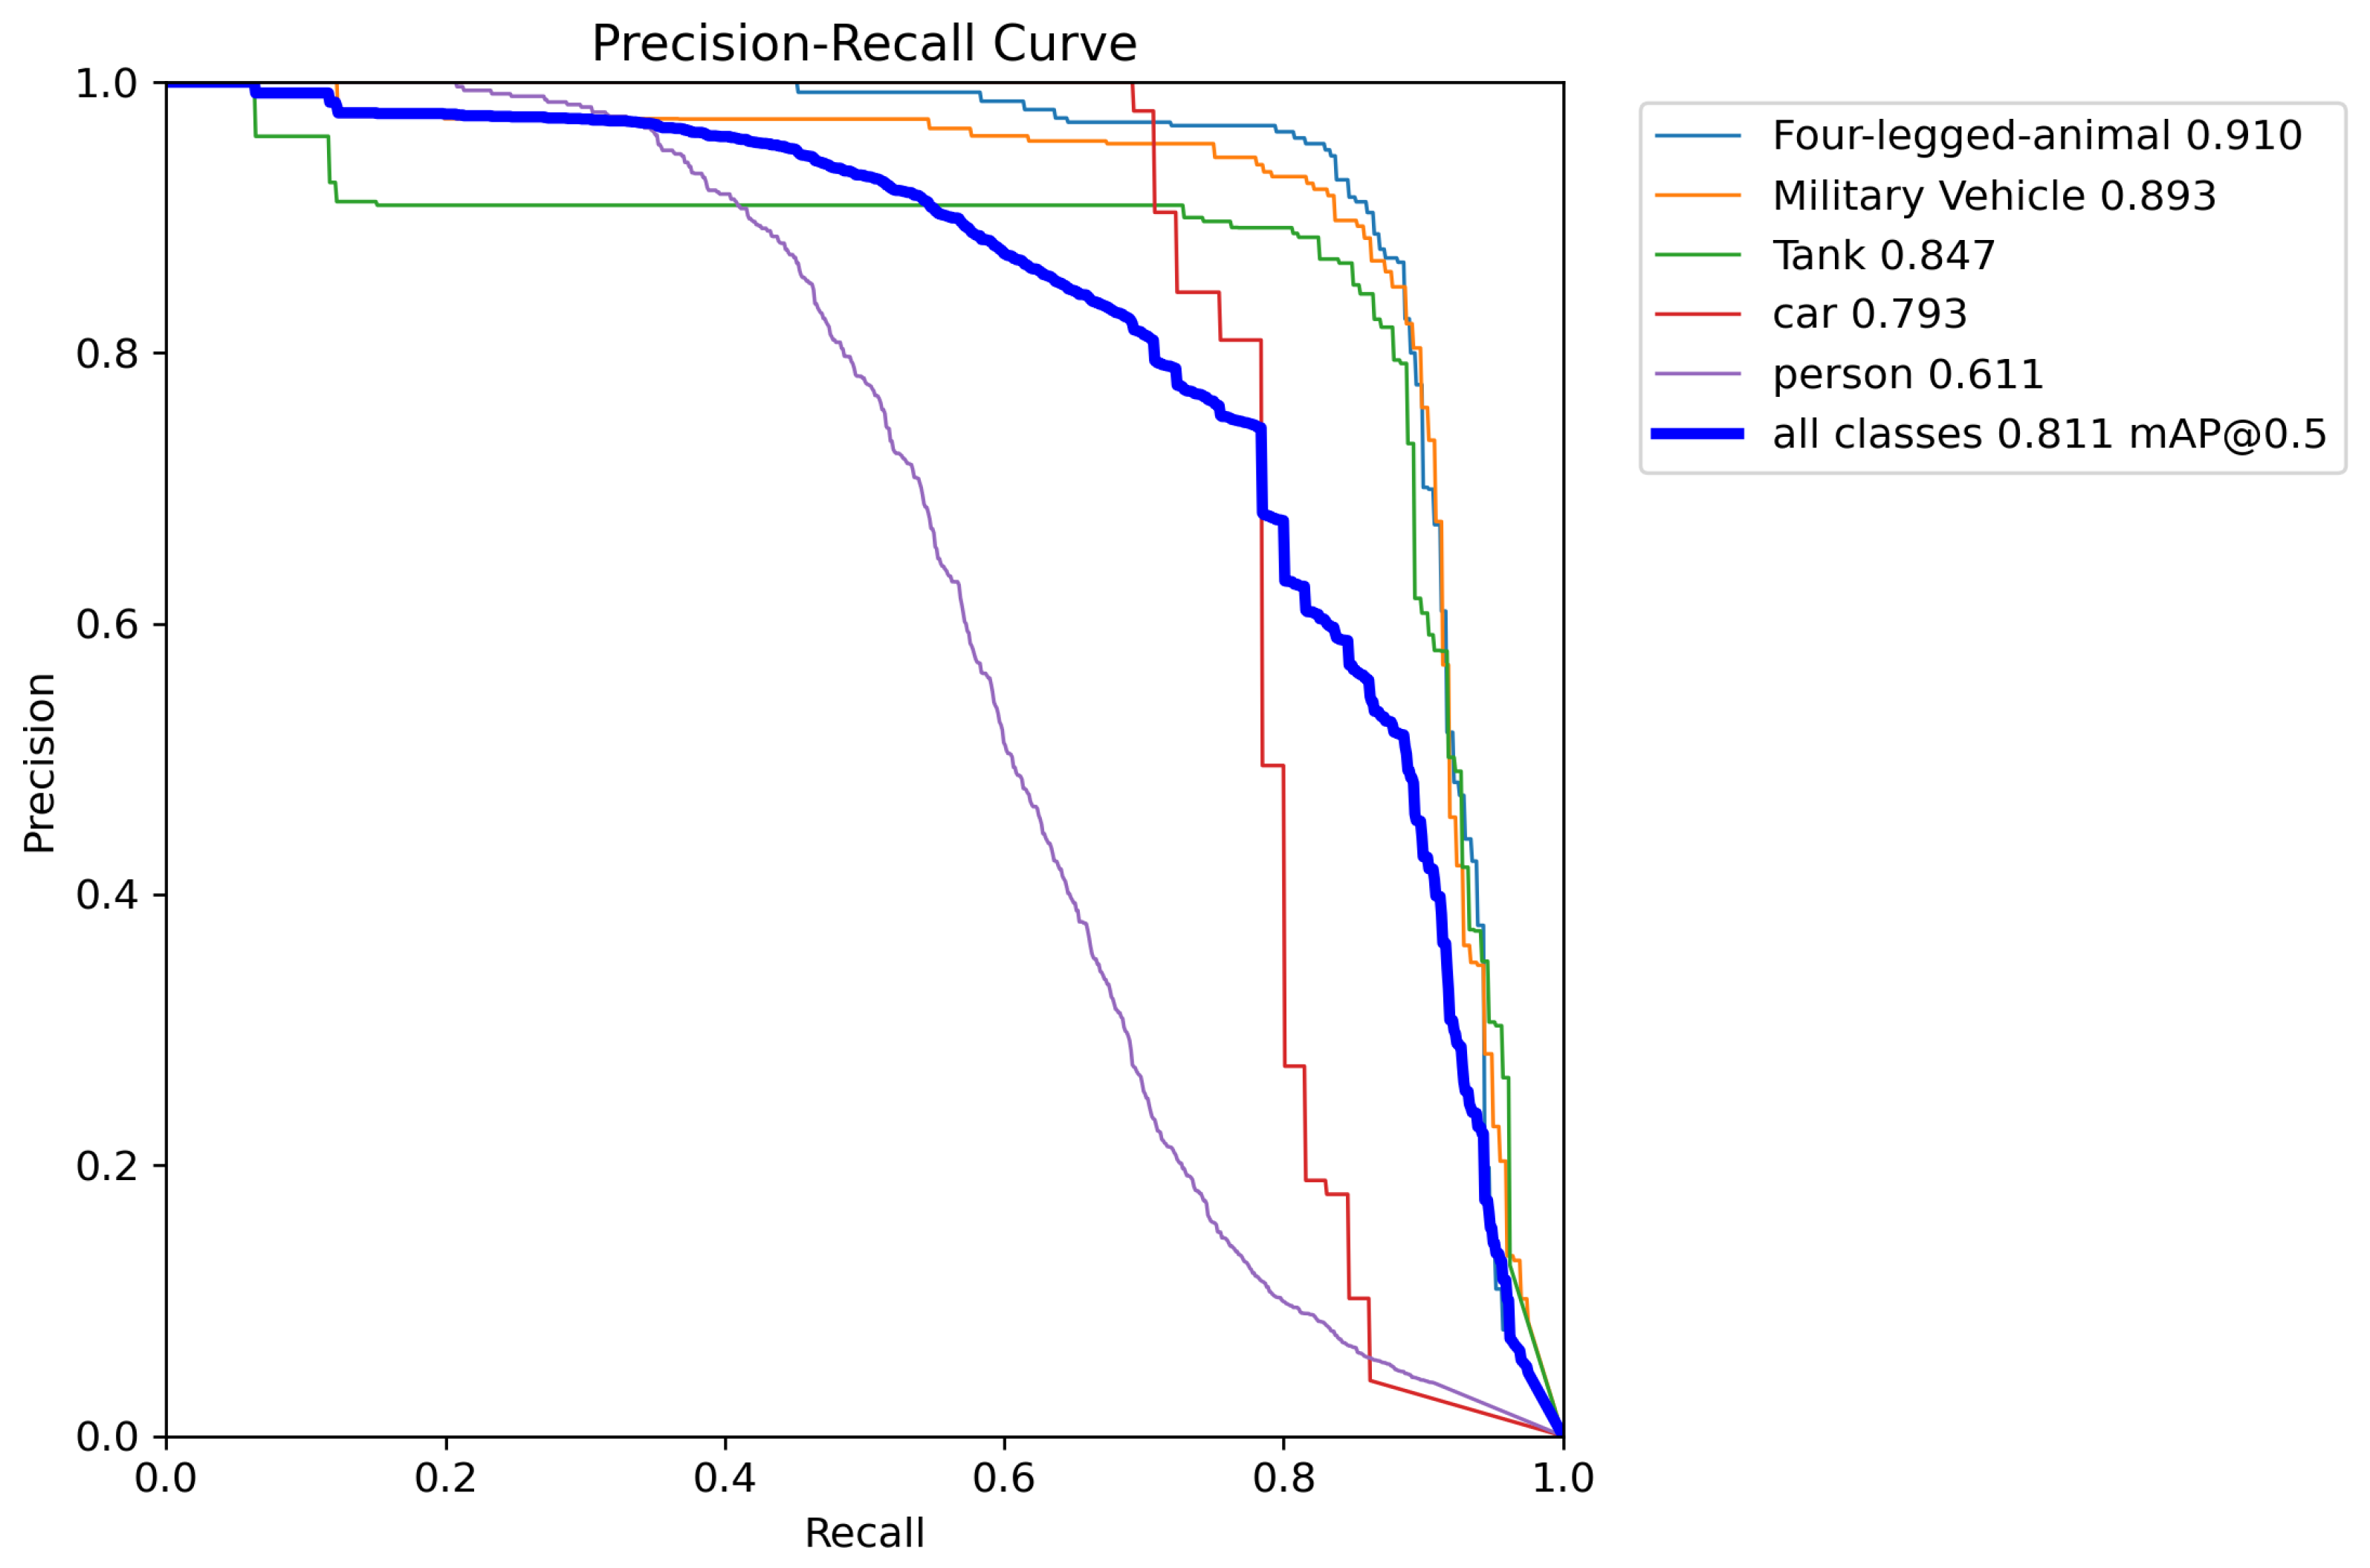
Figure 7.
Precision–Recall curve of the custom scenario detection model.
Figure 7.
Precision–Recall curve of the custom scenario detection model.
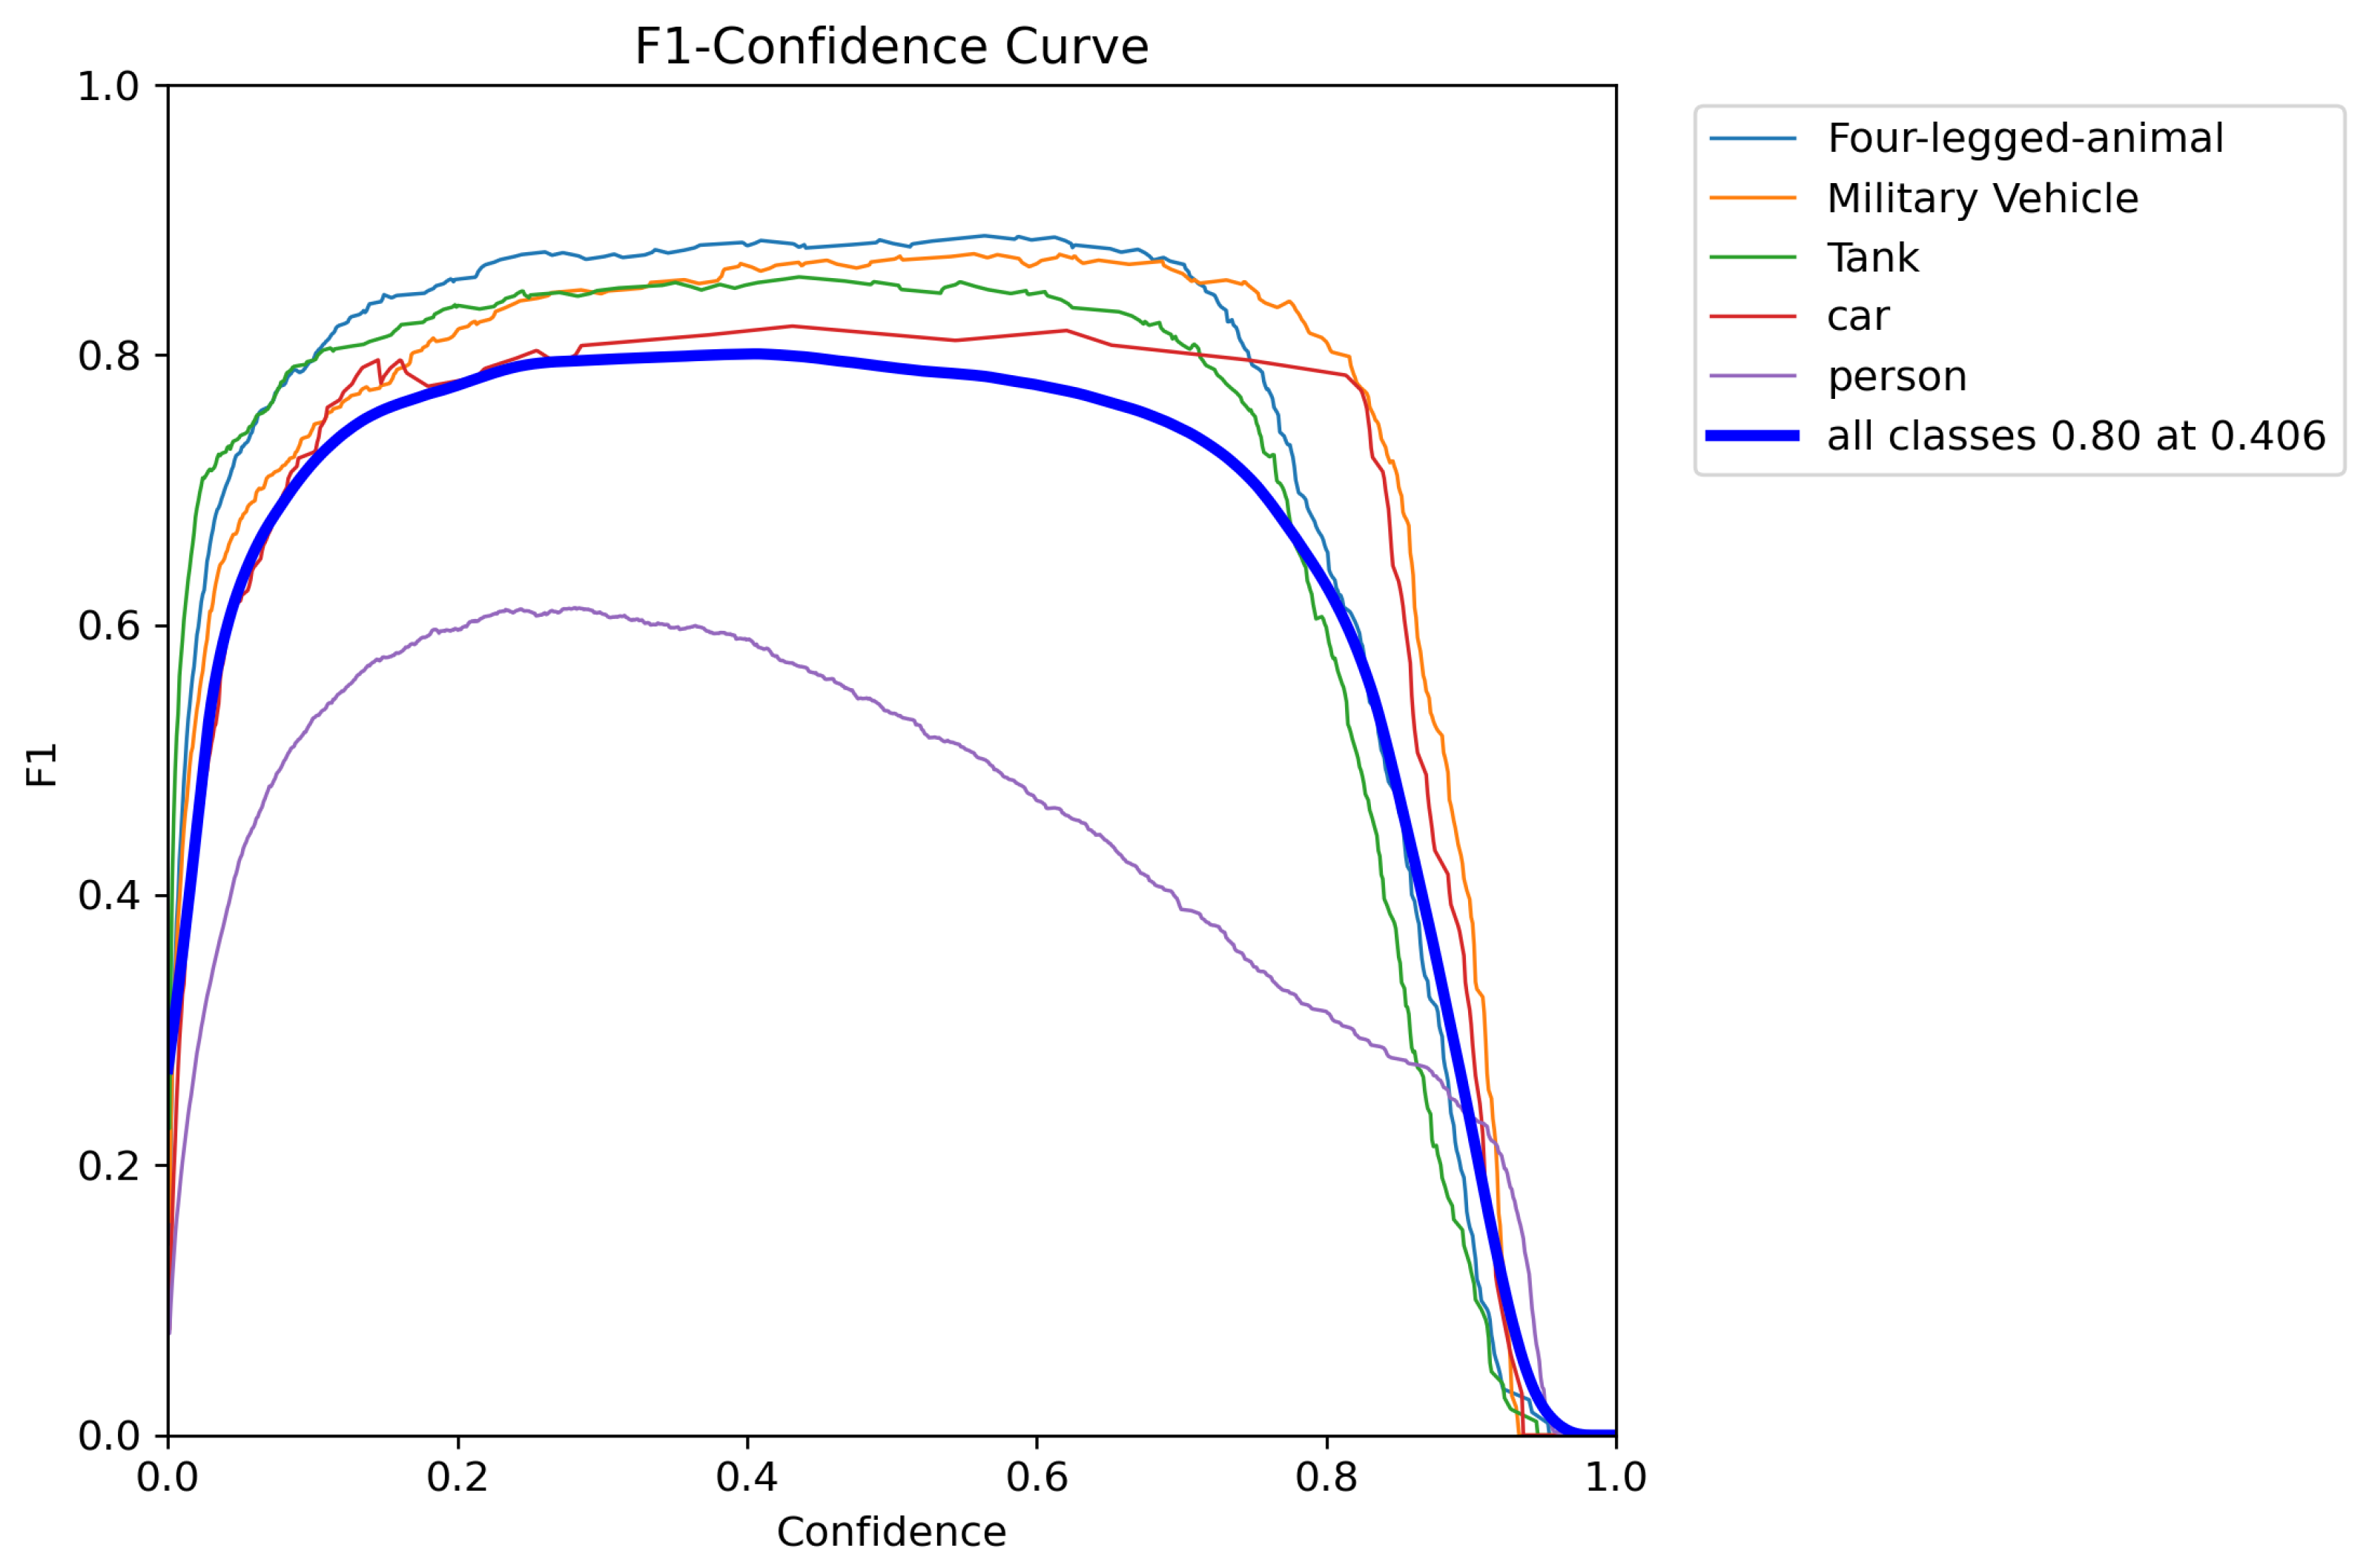
Figure 8.
F1 curve of the custom scenario detection model.
Figure 8.
F1 curve of the custom scenario detection model.
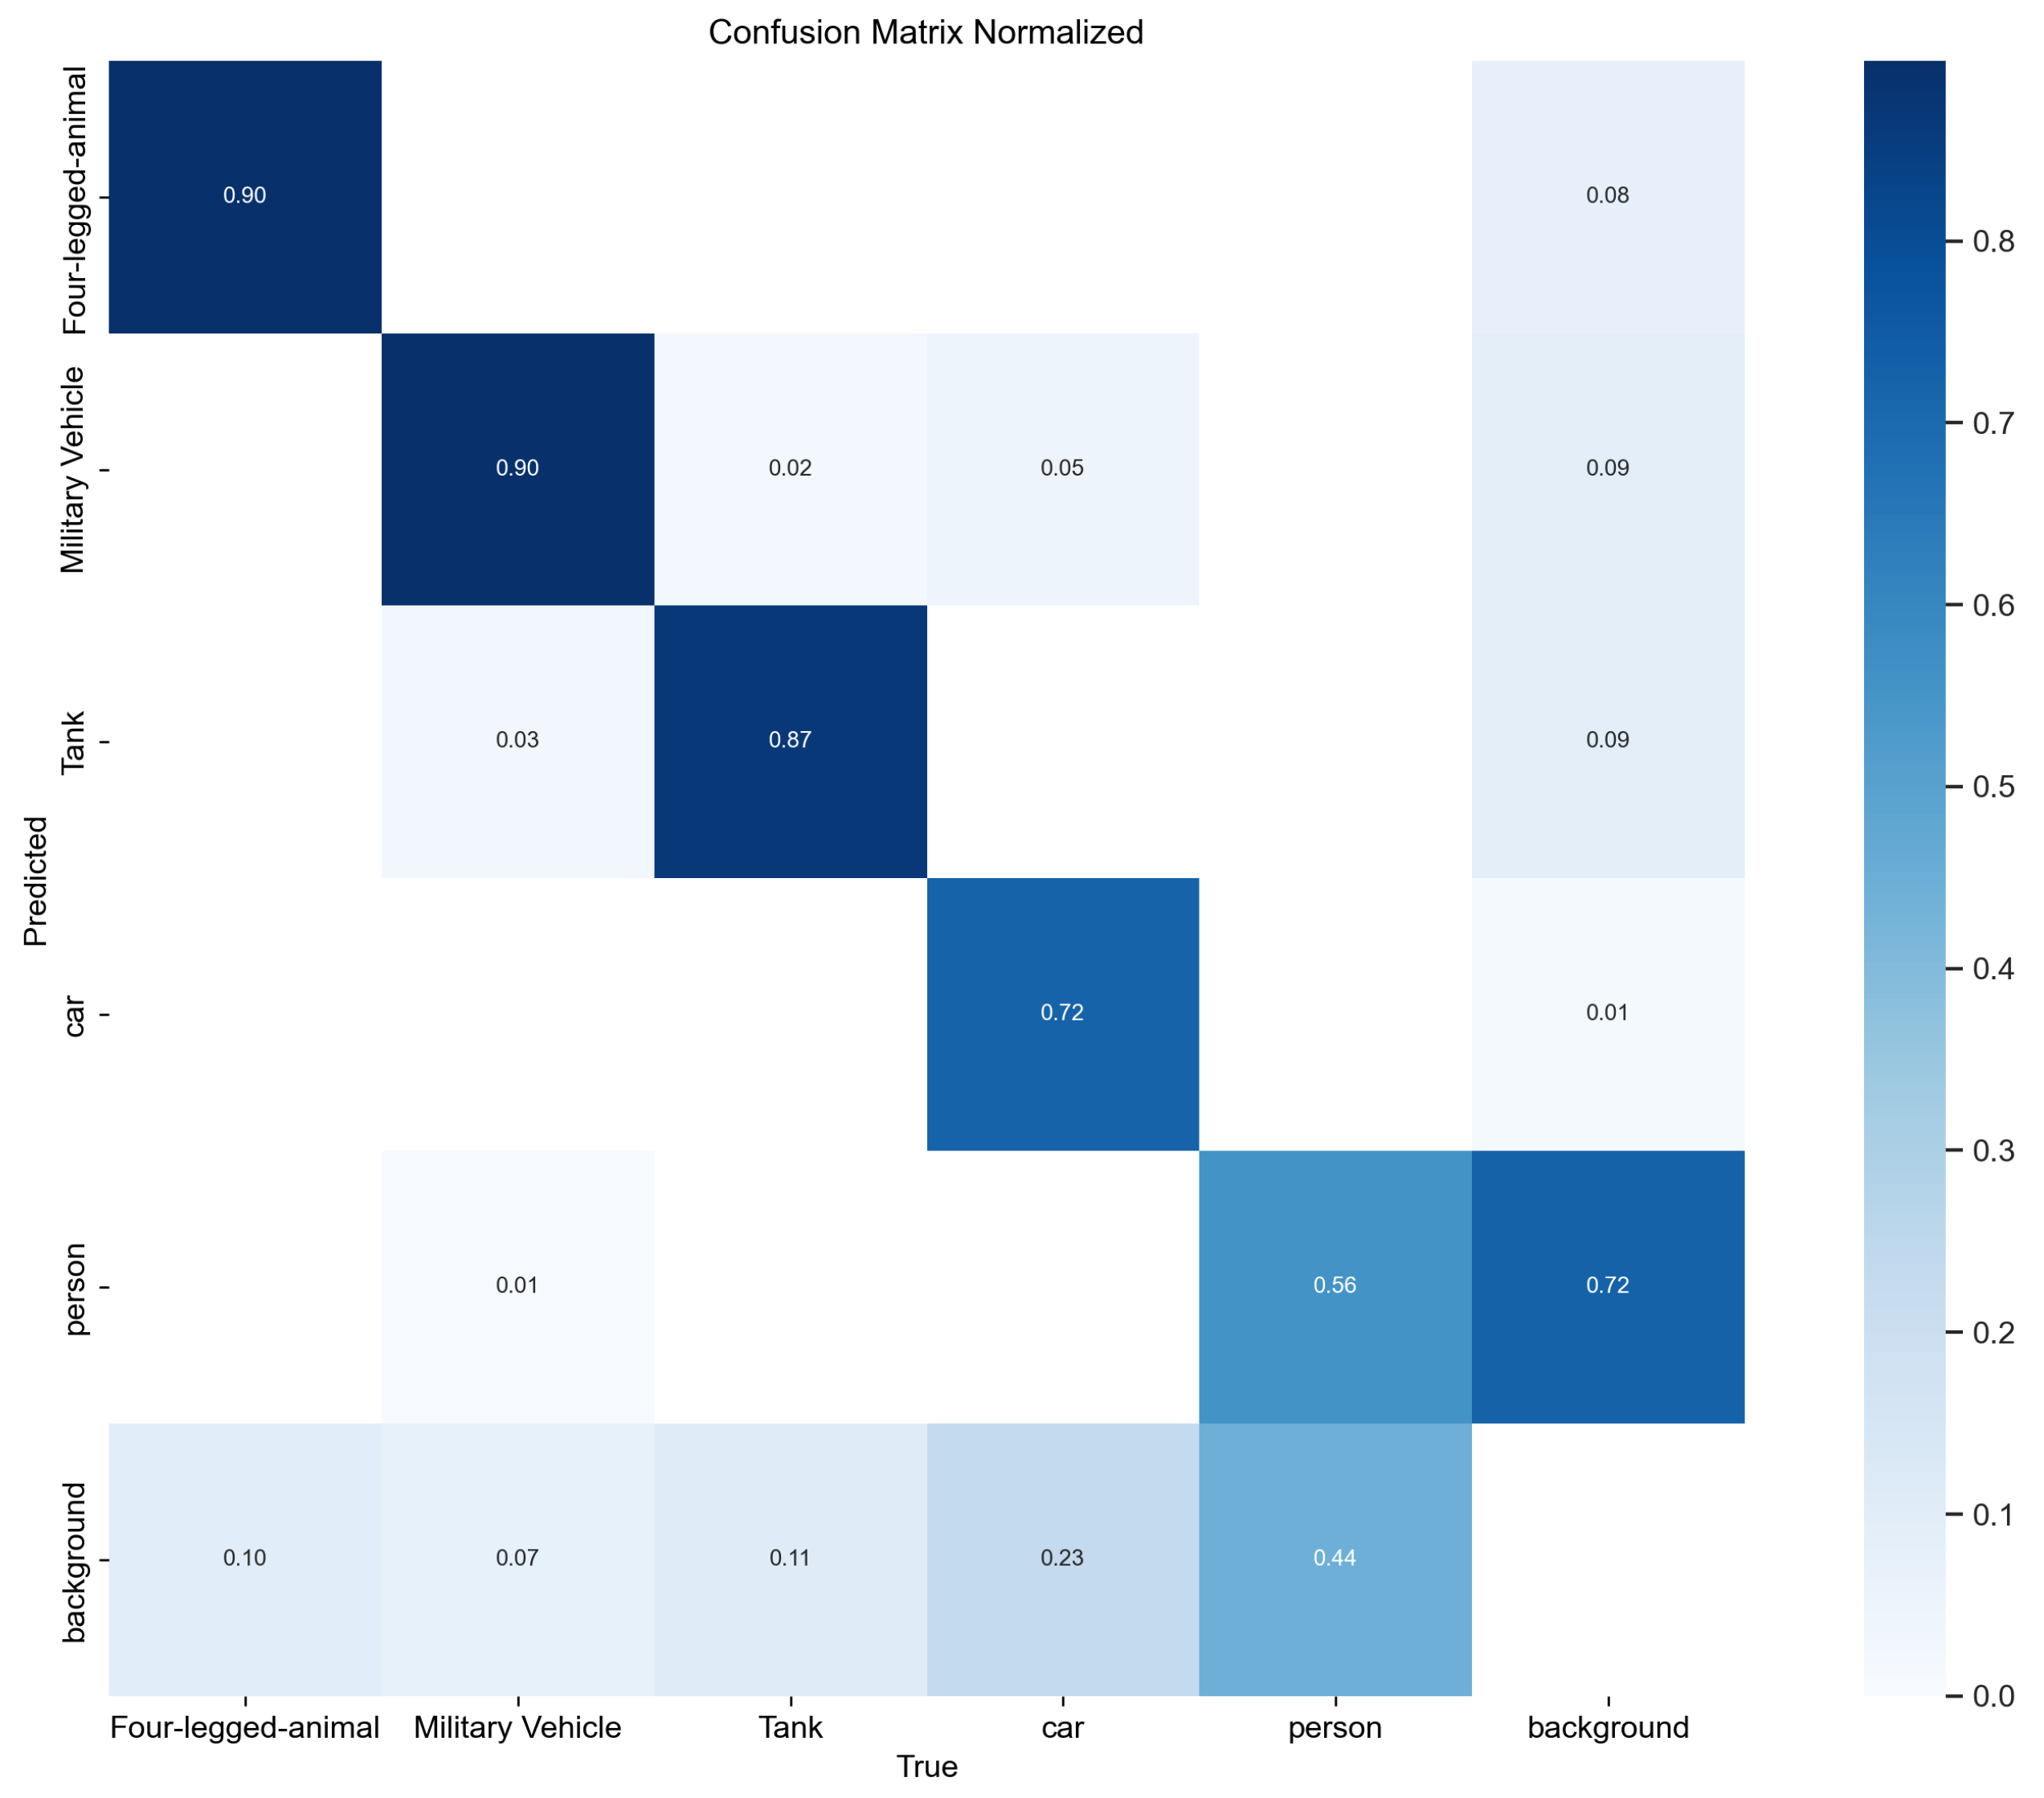
Figure 9.
Normalized confusion matrix of the trained model on the test custom detection dataset.
Figure 9.
Normalized confusion matrix of the trained model on the test custom detection dataset.
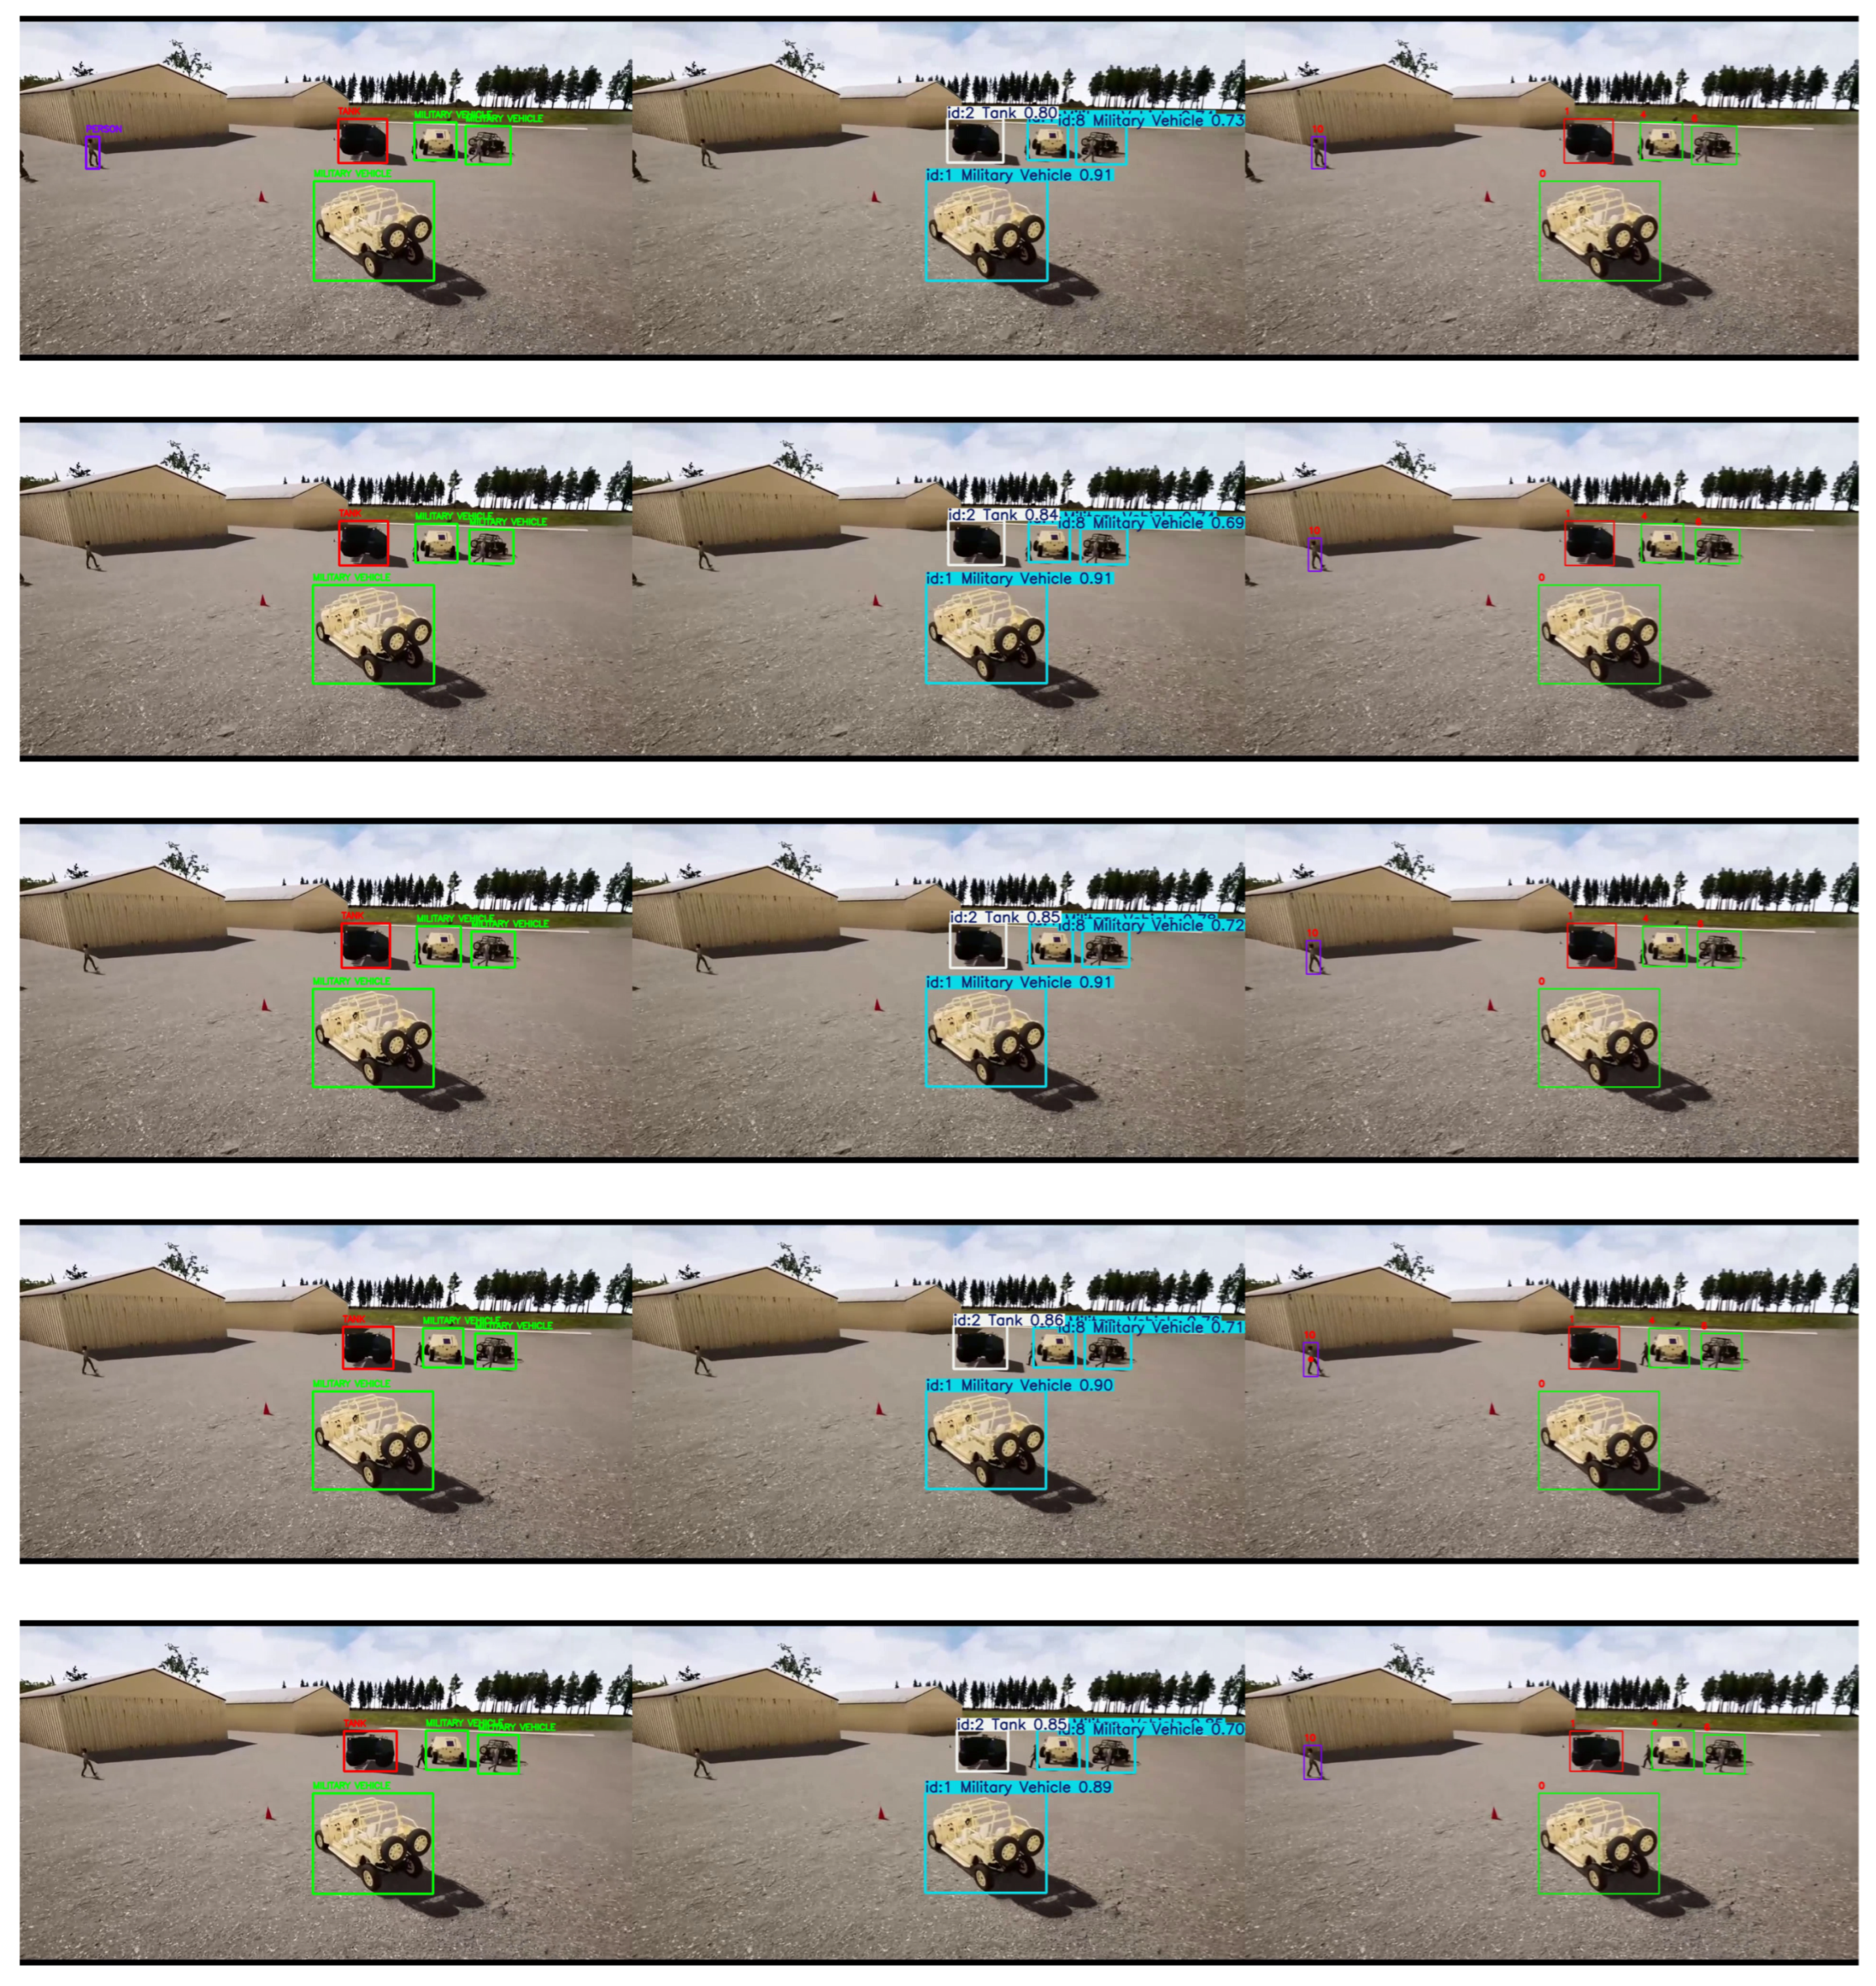
Figure 10.
Comparison of performance of ByteTrack (middle) and PrED (right) in retaining detection and tracking. The left column consists of high-confidence detection by backbone YOLO. Here, the human is getting tracked after detection by YOLO in frame 1, leveraging low-confidence bounding boxes and high values. The bounding box with a red dot at the center indicates an object missing by the base detector, but still getting tracked due to its high .
Figure 10.
Comparison of performance of ByteTrack (middle) and PrED (right) in retaining detection and tracking. The left column consists of high-confidence detection by backbone YOLO. Here, the human is getting tracked after detection by YOLO in frame 1, leveraging low-confidence bounding boxes and high values. The bounding box with a red dot at the center indicates an object missing by the base detector, but still getting tracked due to its high .
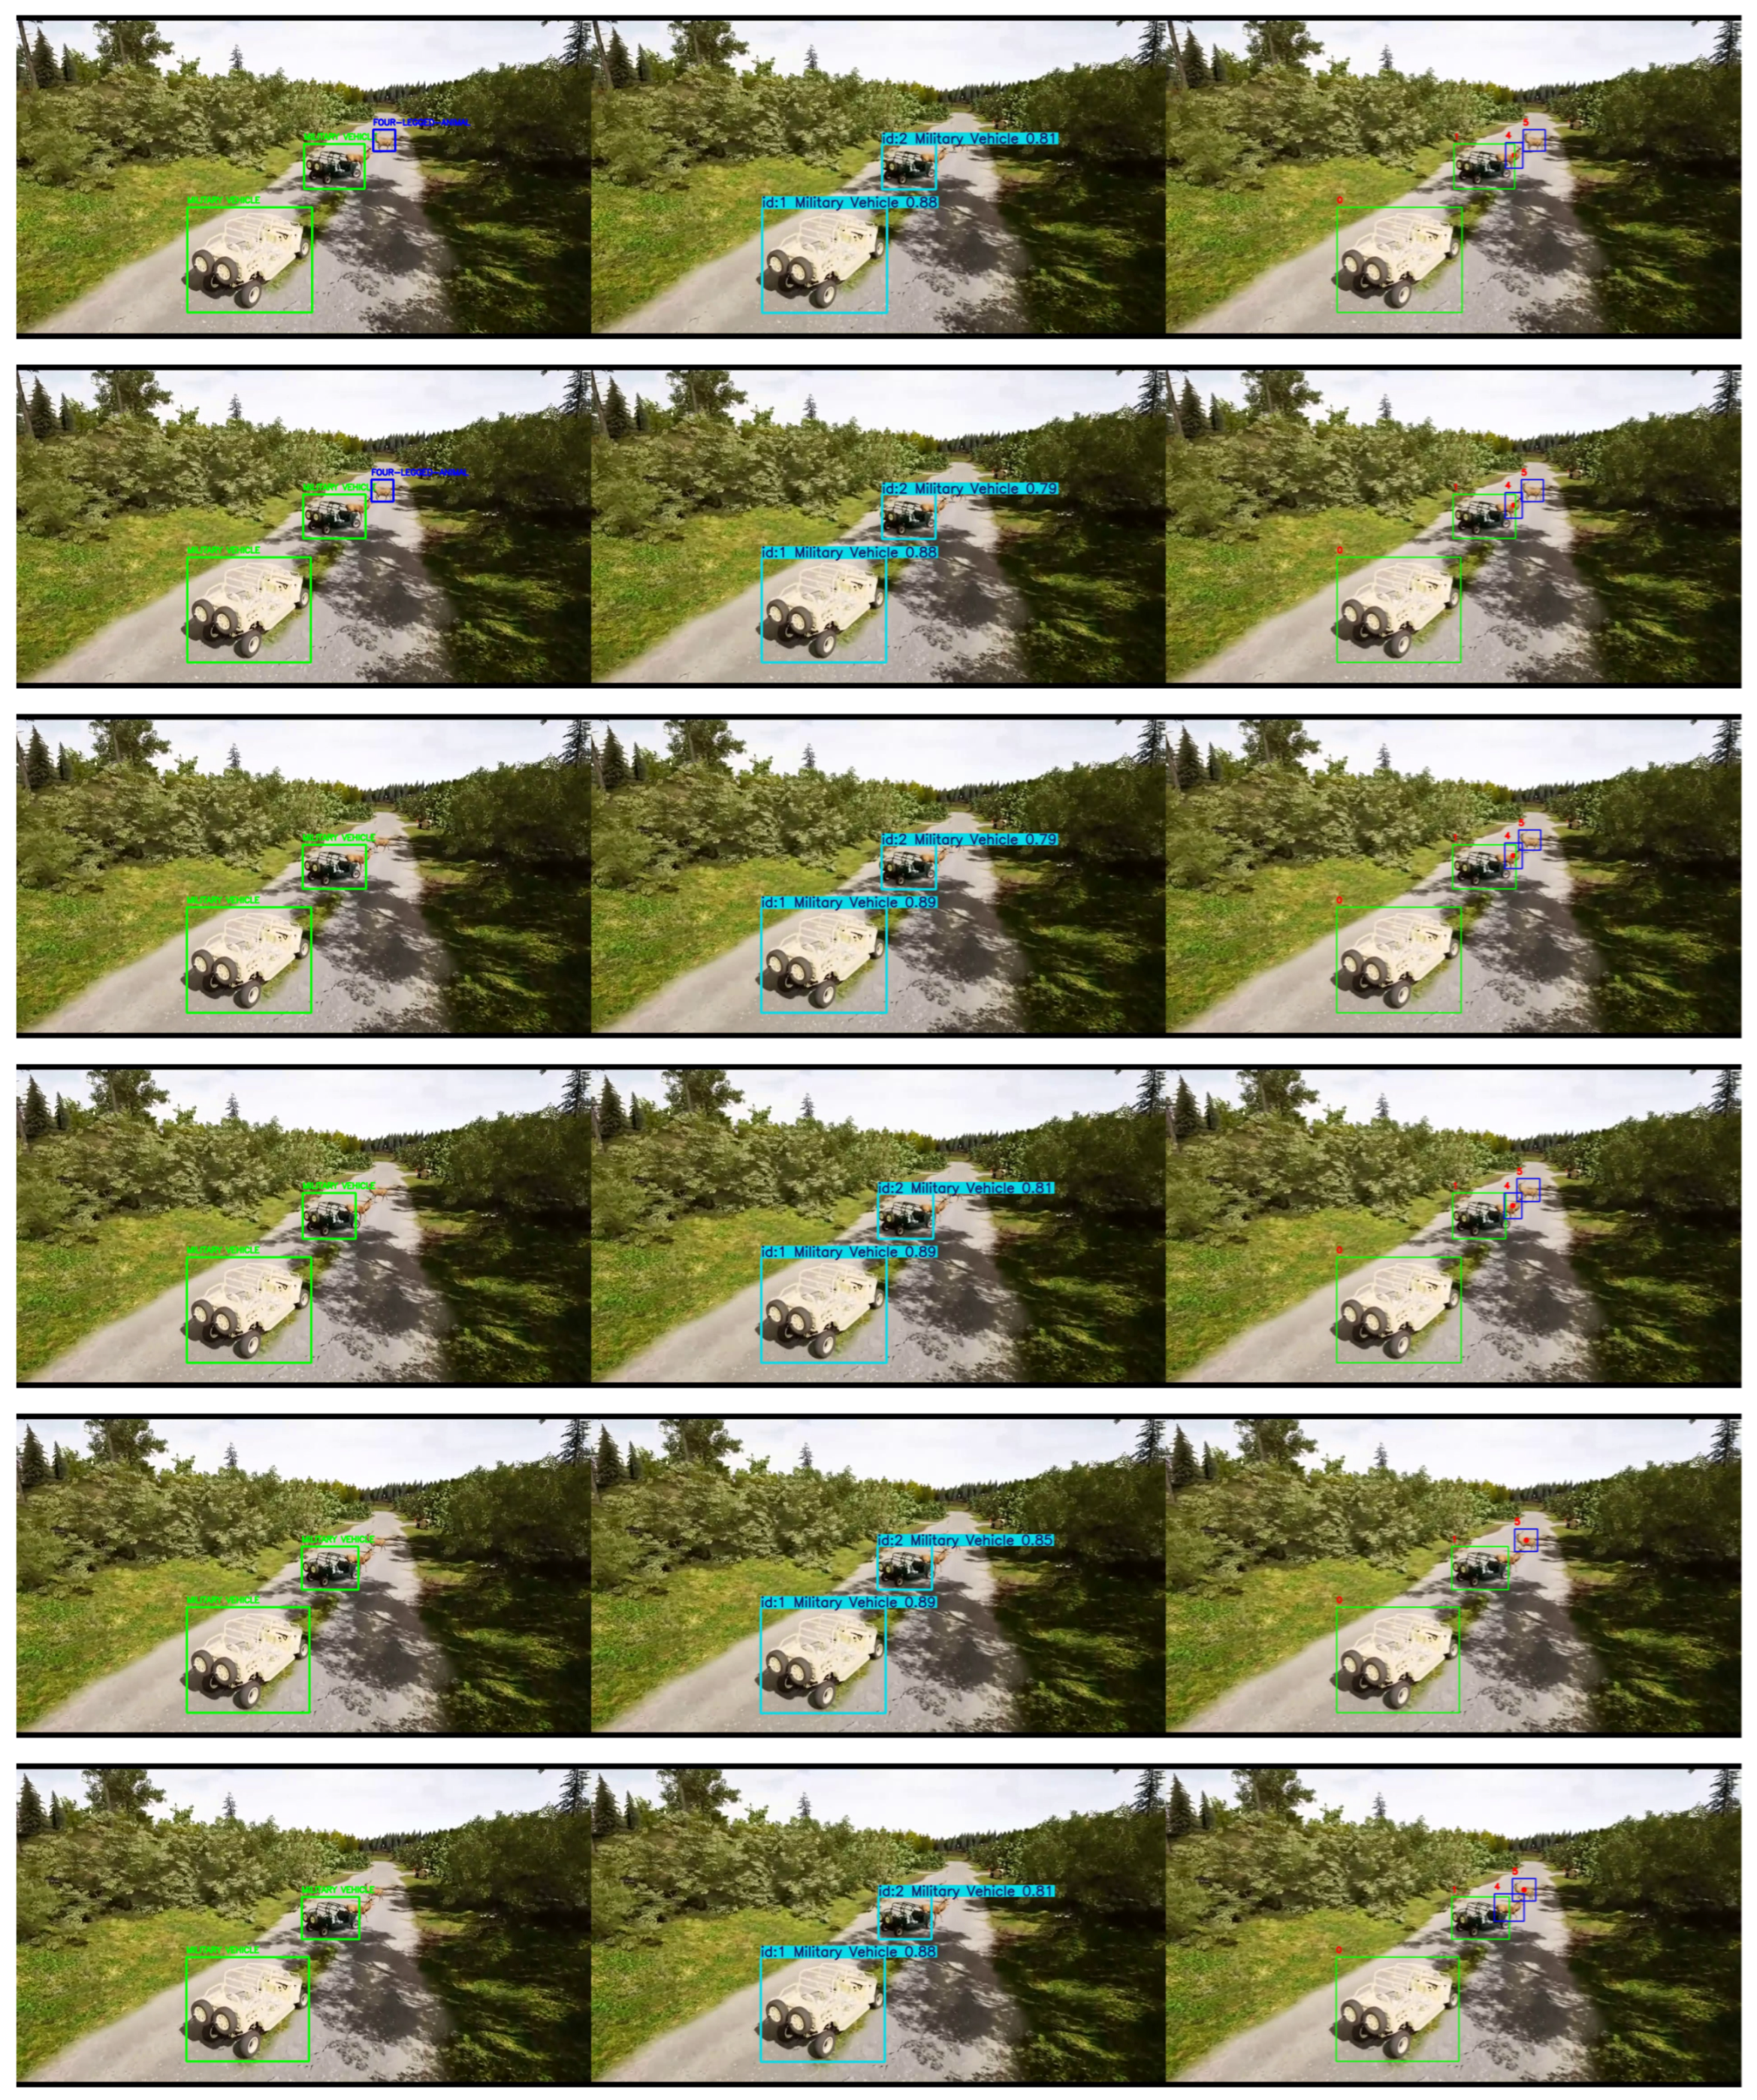
Figure 11.
Detection and tracking of low-confidence objects by ByteTrack (middle) and PrED (right). The left column consists of high-confidence detections by backbone YOLO. In the right column, track 5 is being consistently predicted in subsequent frames after getting detected by the backbone in frame 1, and successfully avoids ID-switching with track 4, despite both of them being objects of the same class (four-legged animals).
Figure 11.
Detection and tracking of low-confidence objects by ByteTrack (middle) and PrED (right). The left column consists of high-confidence detections by backbone YOLO. In the right column, track 5 is being consistently predicted in subsequent frames after getting detected by the backbone in frame 1, and successfully avoids ID-switching with track 4, despite both of them being objects of the same class (four-legged animals).
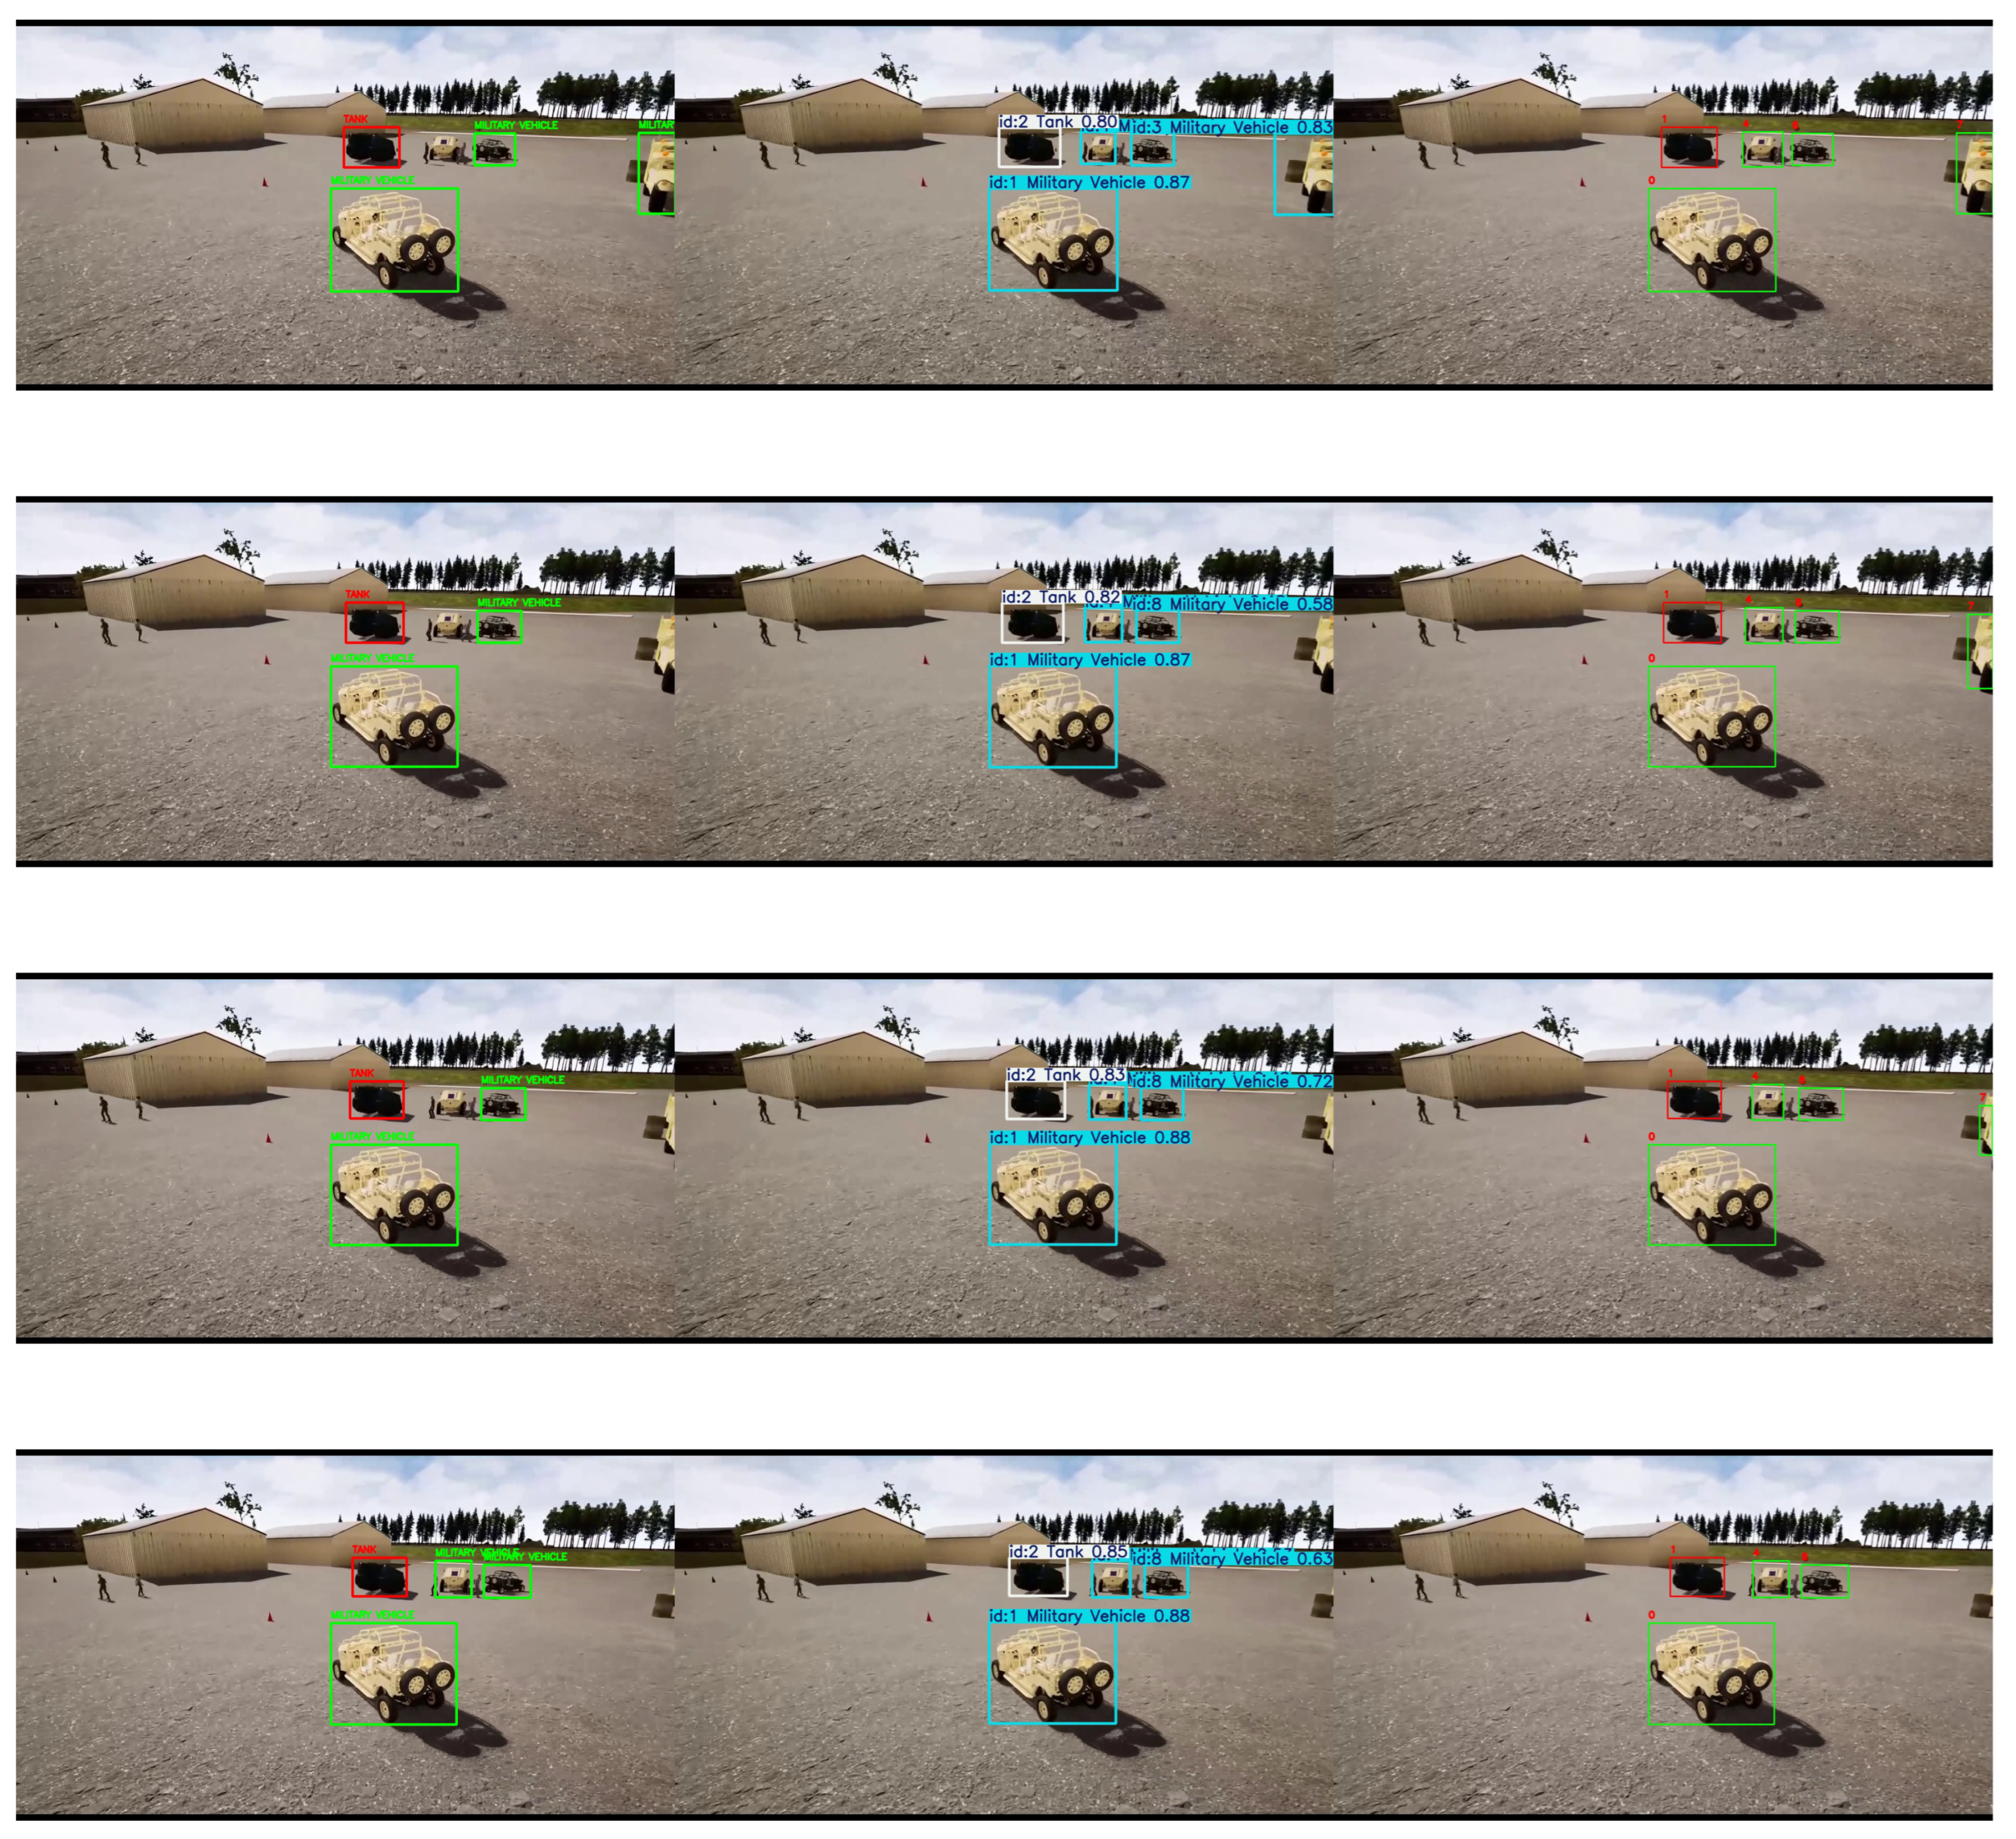
Figure 12.
Comparison of performance of ByteTrack (middle) and PrED (right) when an object gradually moves out of the frame. The left column consists of high-confidence detection by backbone YOLO. The military vehicle in the right edge of the frame (track 7) is gradually moving out of sight. PrED is tracking the vehicle till the last frame.
Figure 12.
Comparison of performance of ByteTrack (middle) and PrED (right) when an object gradually moves out of the frame. The left column consists of high-confidence detection by backbone YOLO. The military vehicle in the right edge of the frame (track 7) is gradually moving out of sight. PrED is tracking the vehicle till the last frame.
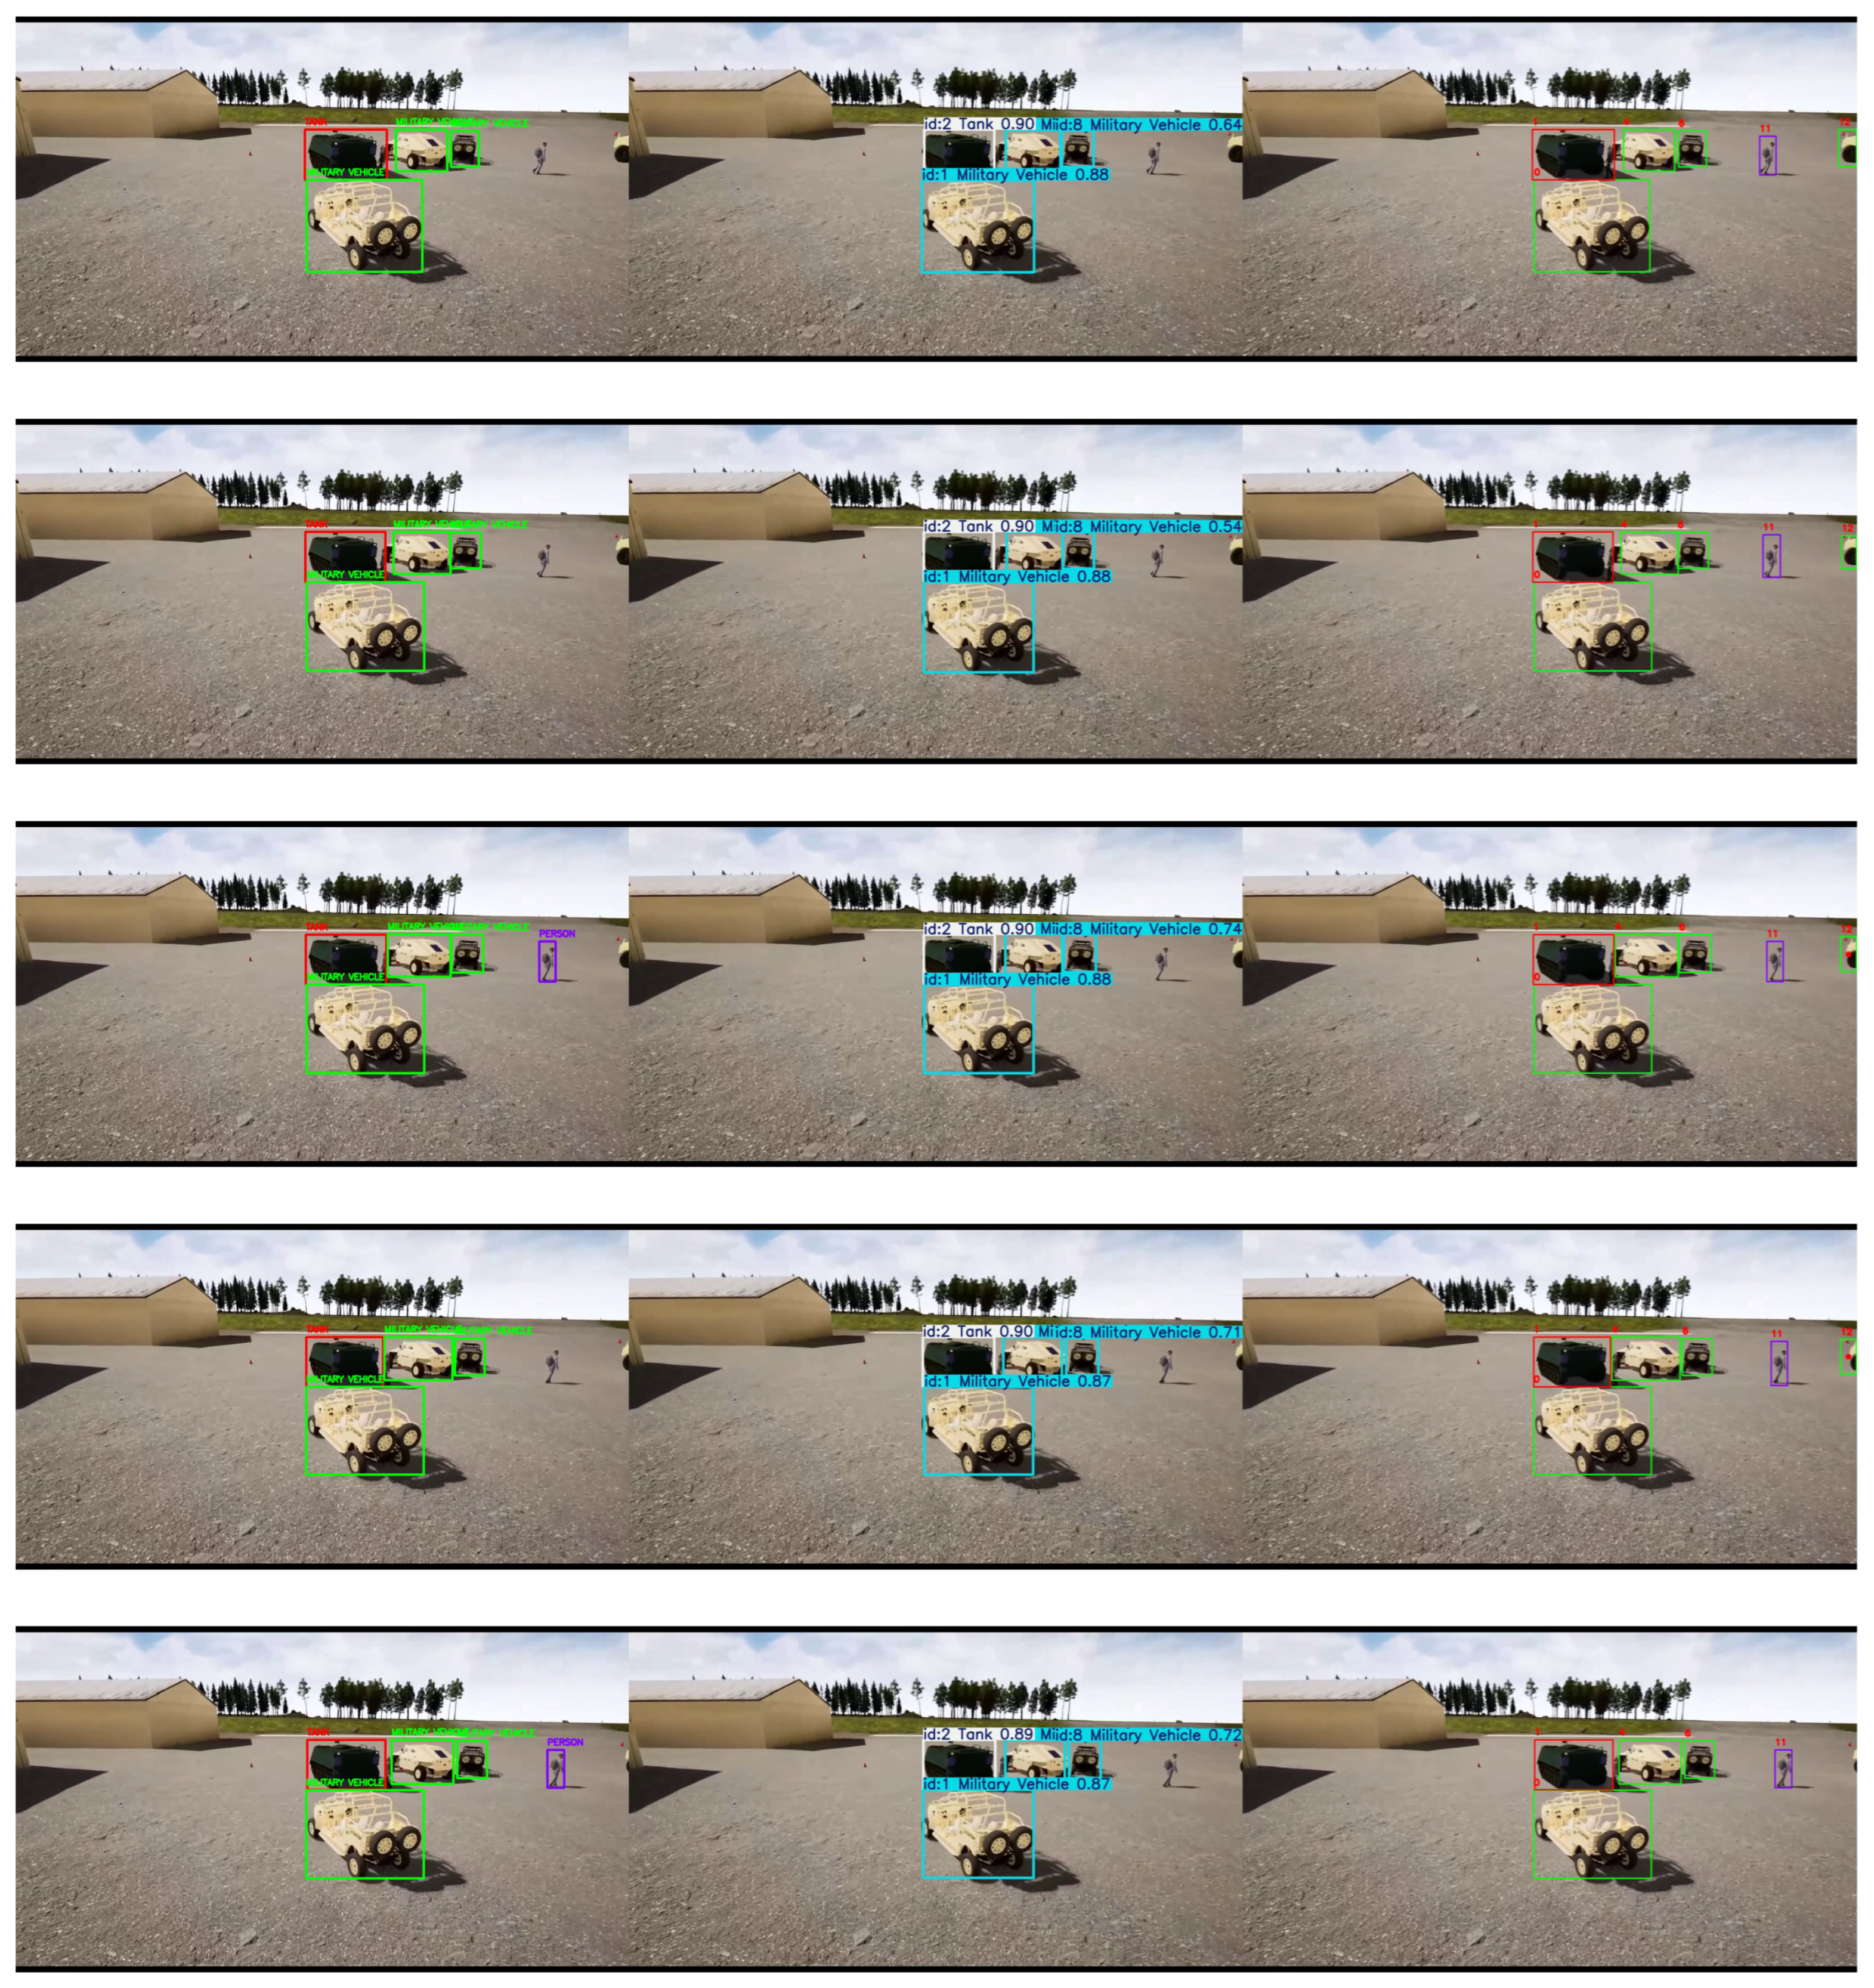
Figure 13.
Comparison of performance of ByteTrack (middle) and PrED (right) when an object gradually moves out of the frame and backbone YOLO stops generating low-confidence bounding box. The left column consists of high-confidence detection by backbone YOLO. The military vehicle (track 12) is not getting detected by YOLO even with low-confidence bounding boxes after frame 1, but PrED continues to track the vehicle till its complete absence.
Figure 13.
Comparison of performance of ByteTrack (middle) and PrED (right) when an object gradually moves out of the frame and backbone YOLO stops generating low-confidence bounding box. The left column consists of high-confidence detection by backbone YOLO. The military vehicle (track 12) is not getting detected by YOLO even with low-confidence bounding boxes after frame 1, but PrED continues to track the vehicle till its complete absence.
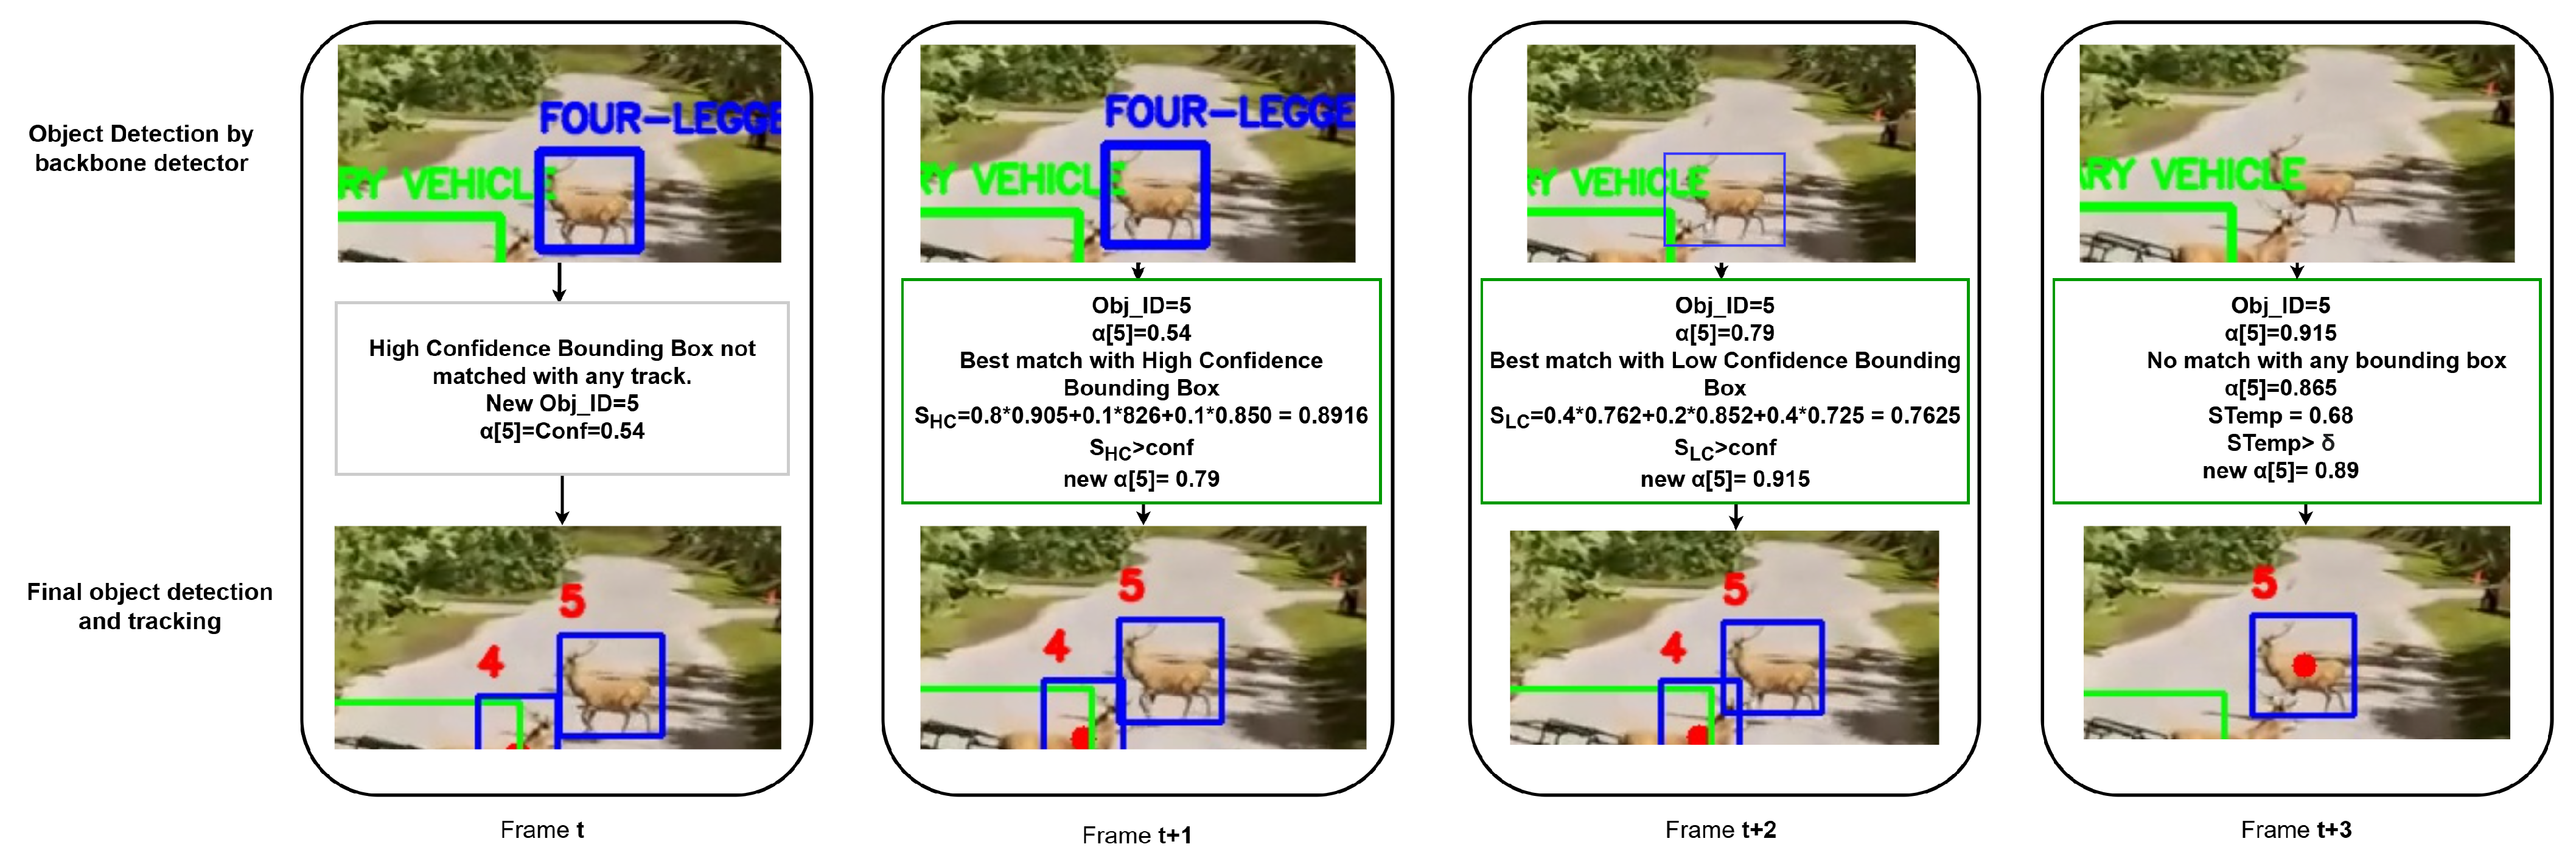
Figure 14.
Frame-by-frame evolution of predictability score . of track 5 (Four-legged animal). The object is detected by the backbone detector with high confidence in frames t and , and thus the track ID is initialized and continued to frame after calculation of . The object is detected via a low-confidence bounding box in frame . In the final frame, despite the backbone failing to detect the object, the high triggers template similarity calculation. The bounding box with a red dot at the center indicates the template-matched track continuation in the absence of backbone detection.
Figure 14.
Frame-by-frame evolution of predictability score . of track 5 (Four-legged animal). The object is detected by the backbone detector with high confidence in frames t and , and thus the track ID is initialized and continued to frame after calculation of . The object is detected via a low-confidence bounding box in frame . In the final frame, despite the backbone failing to detect the object, the high triggers template similarity calculation. The bounding box with a red dot at the center indicates the template-matched track continuation in the absence of backbone detection.
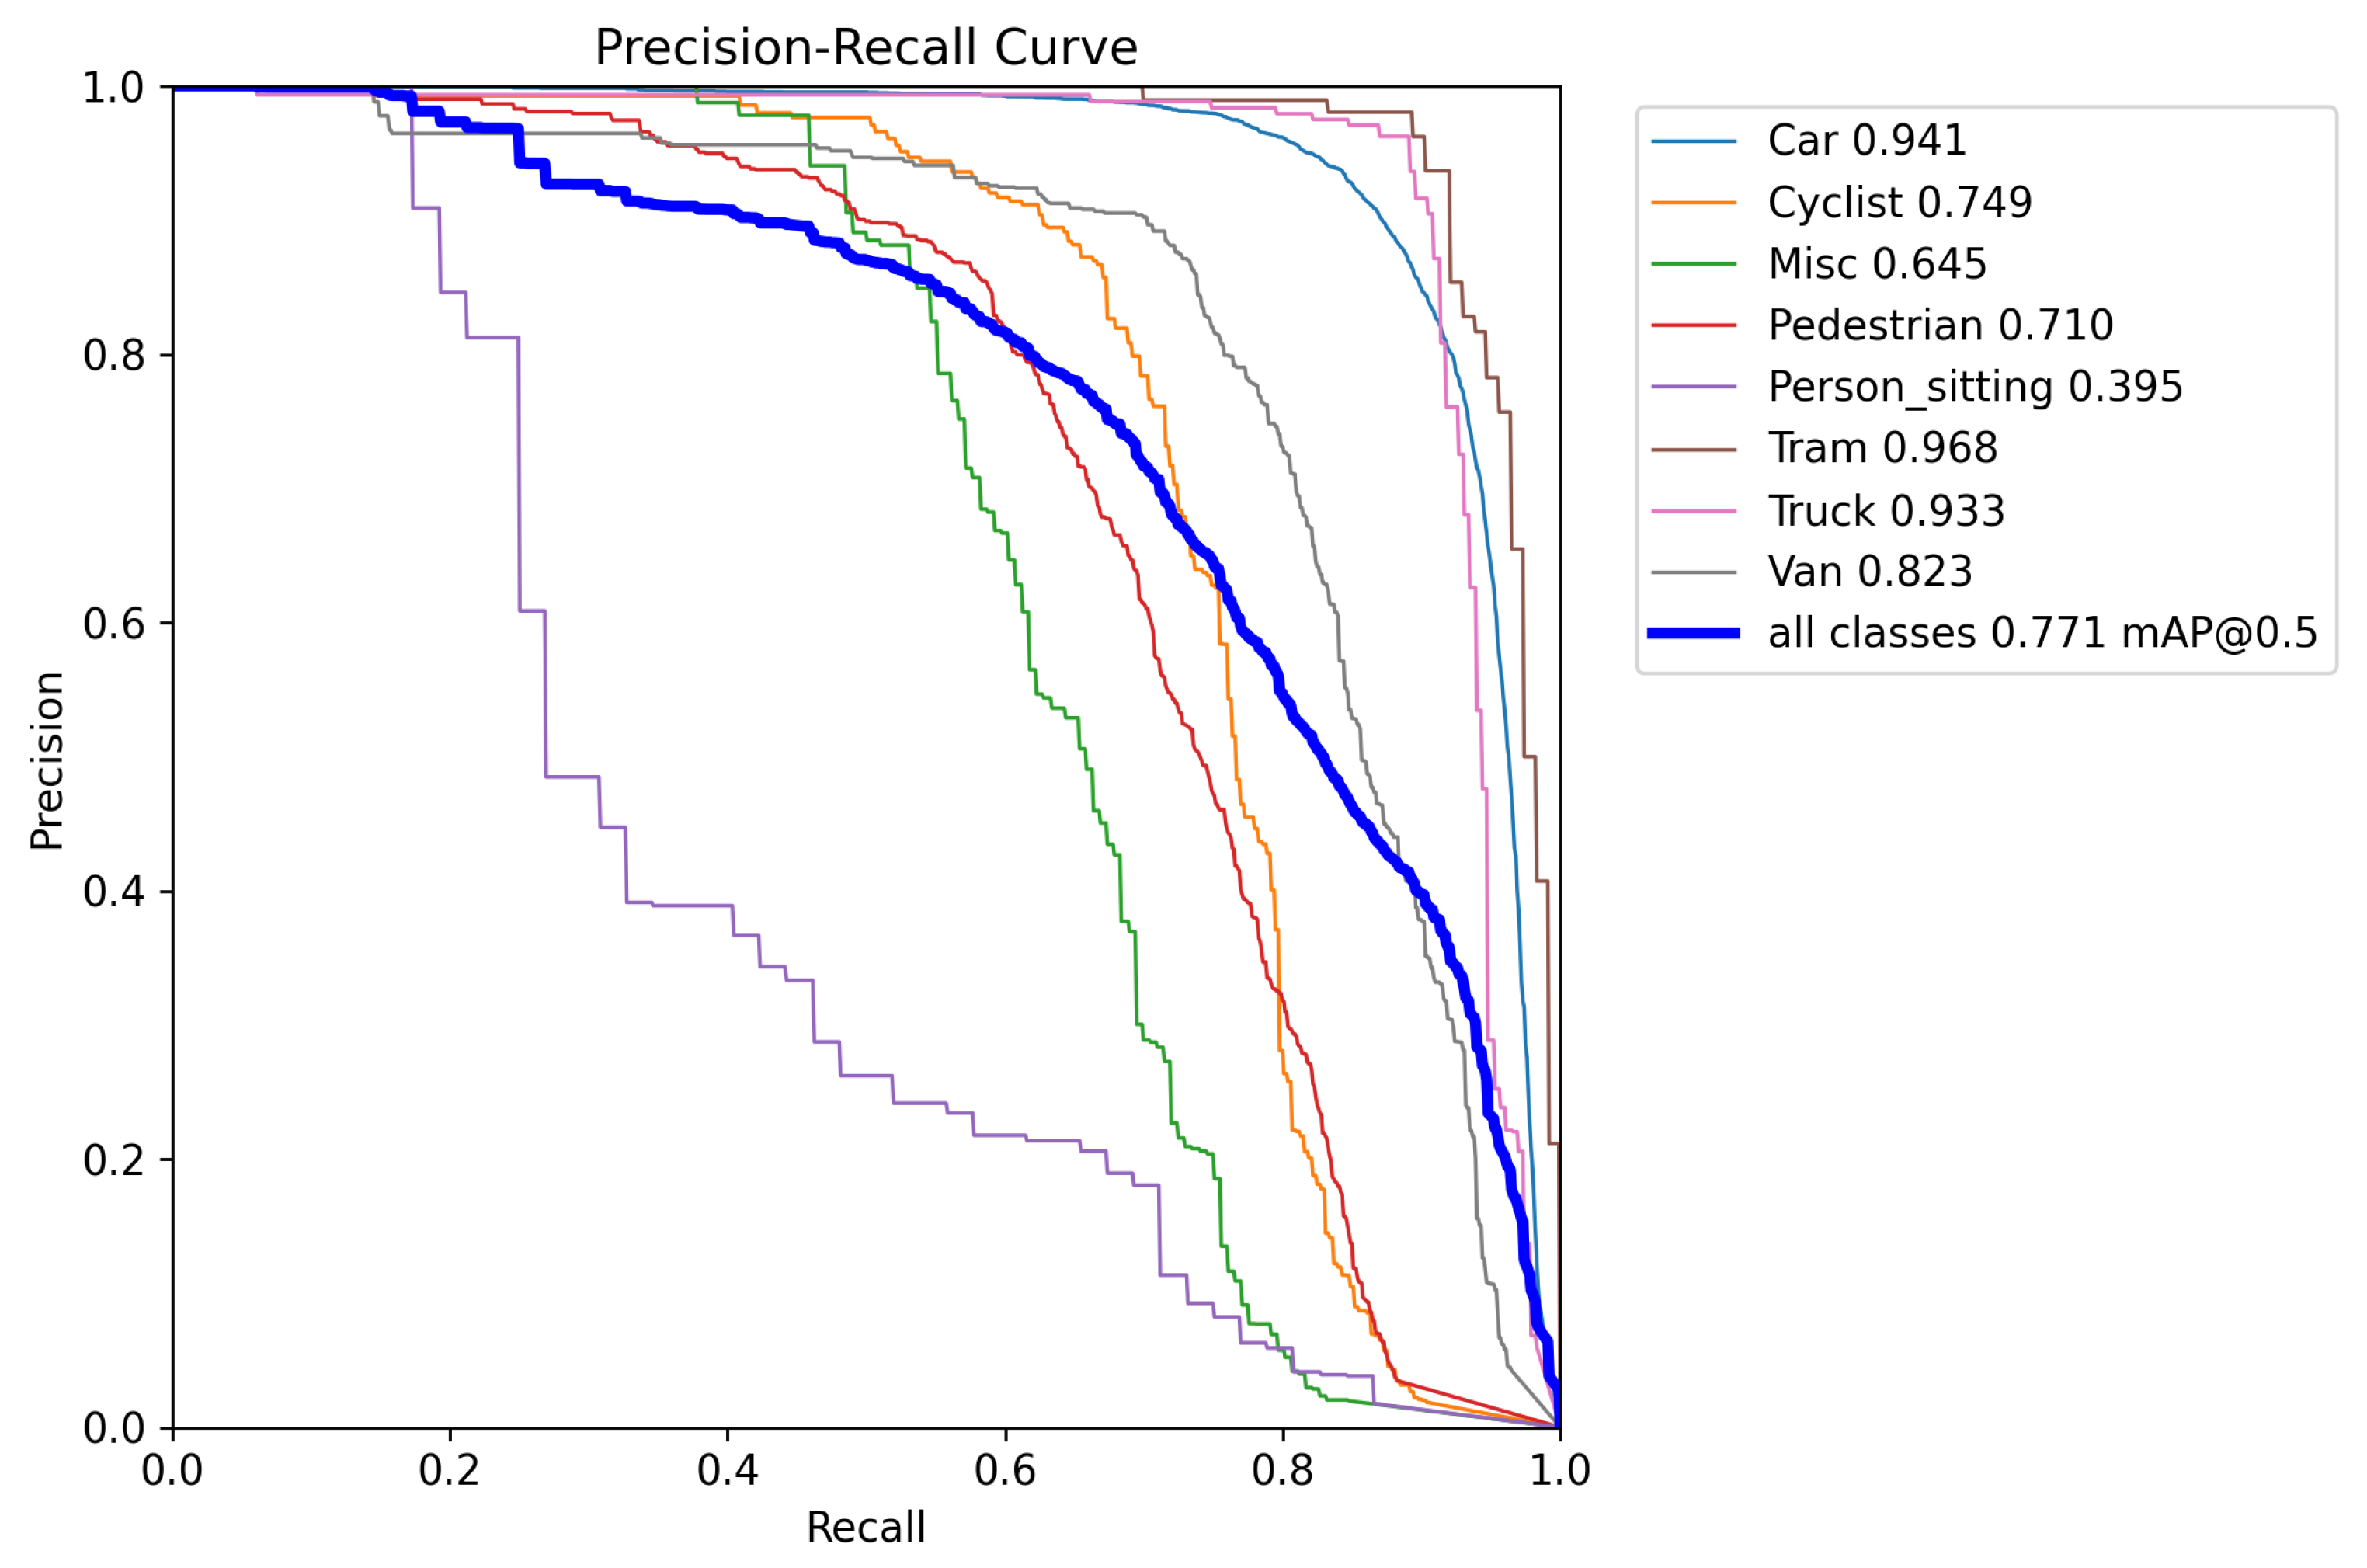
Figure 15.
Precision–Recall curve of KITTI object detection model.
Figure 15.
Precision–Recall curve of KITTI object detection model.
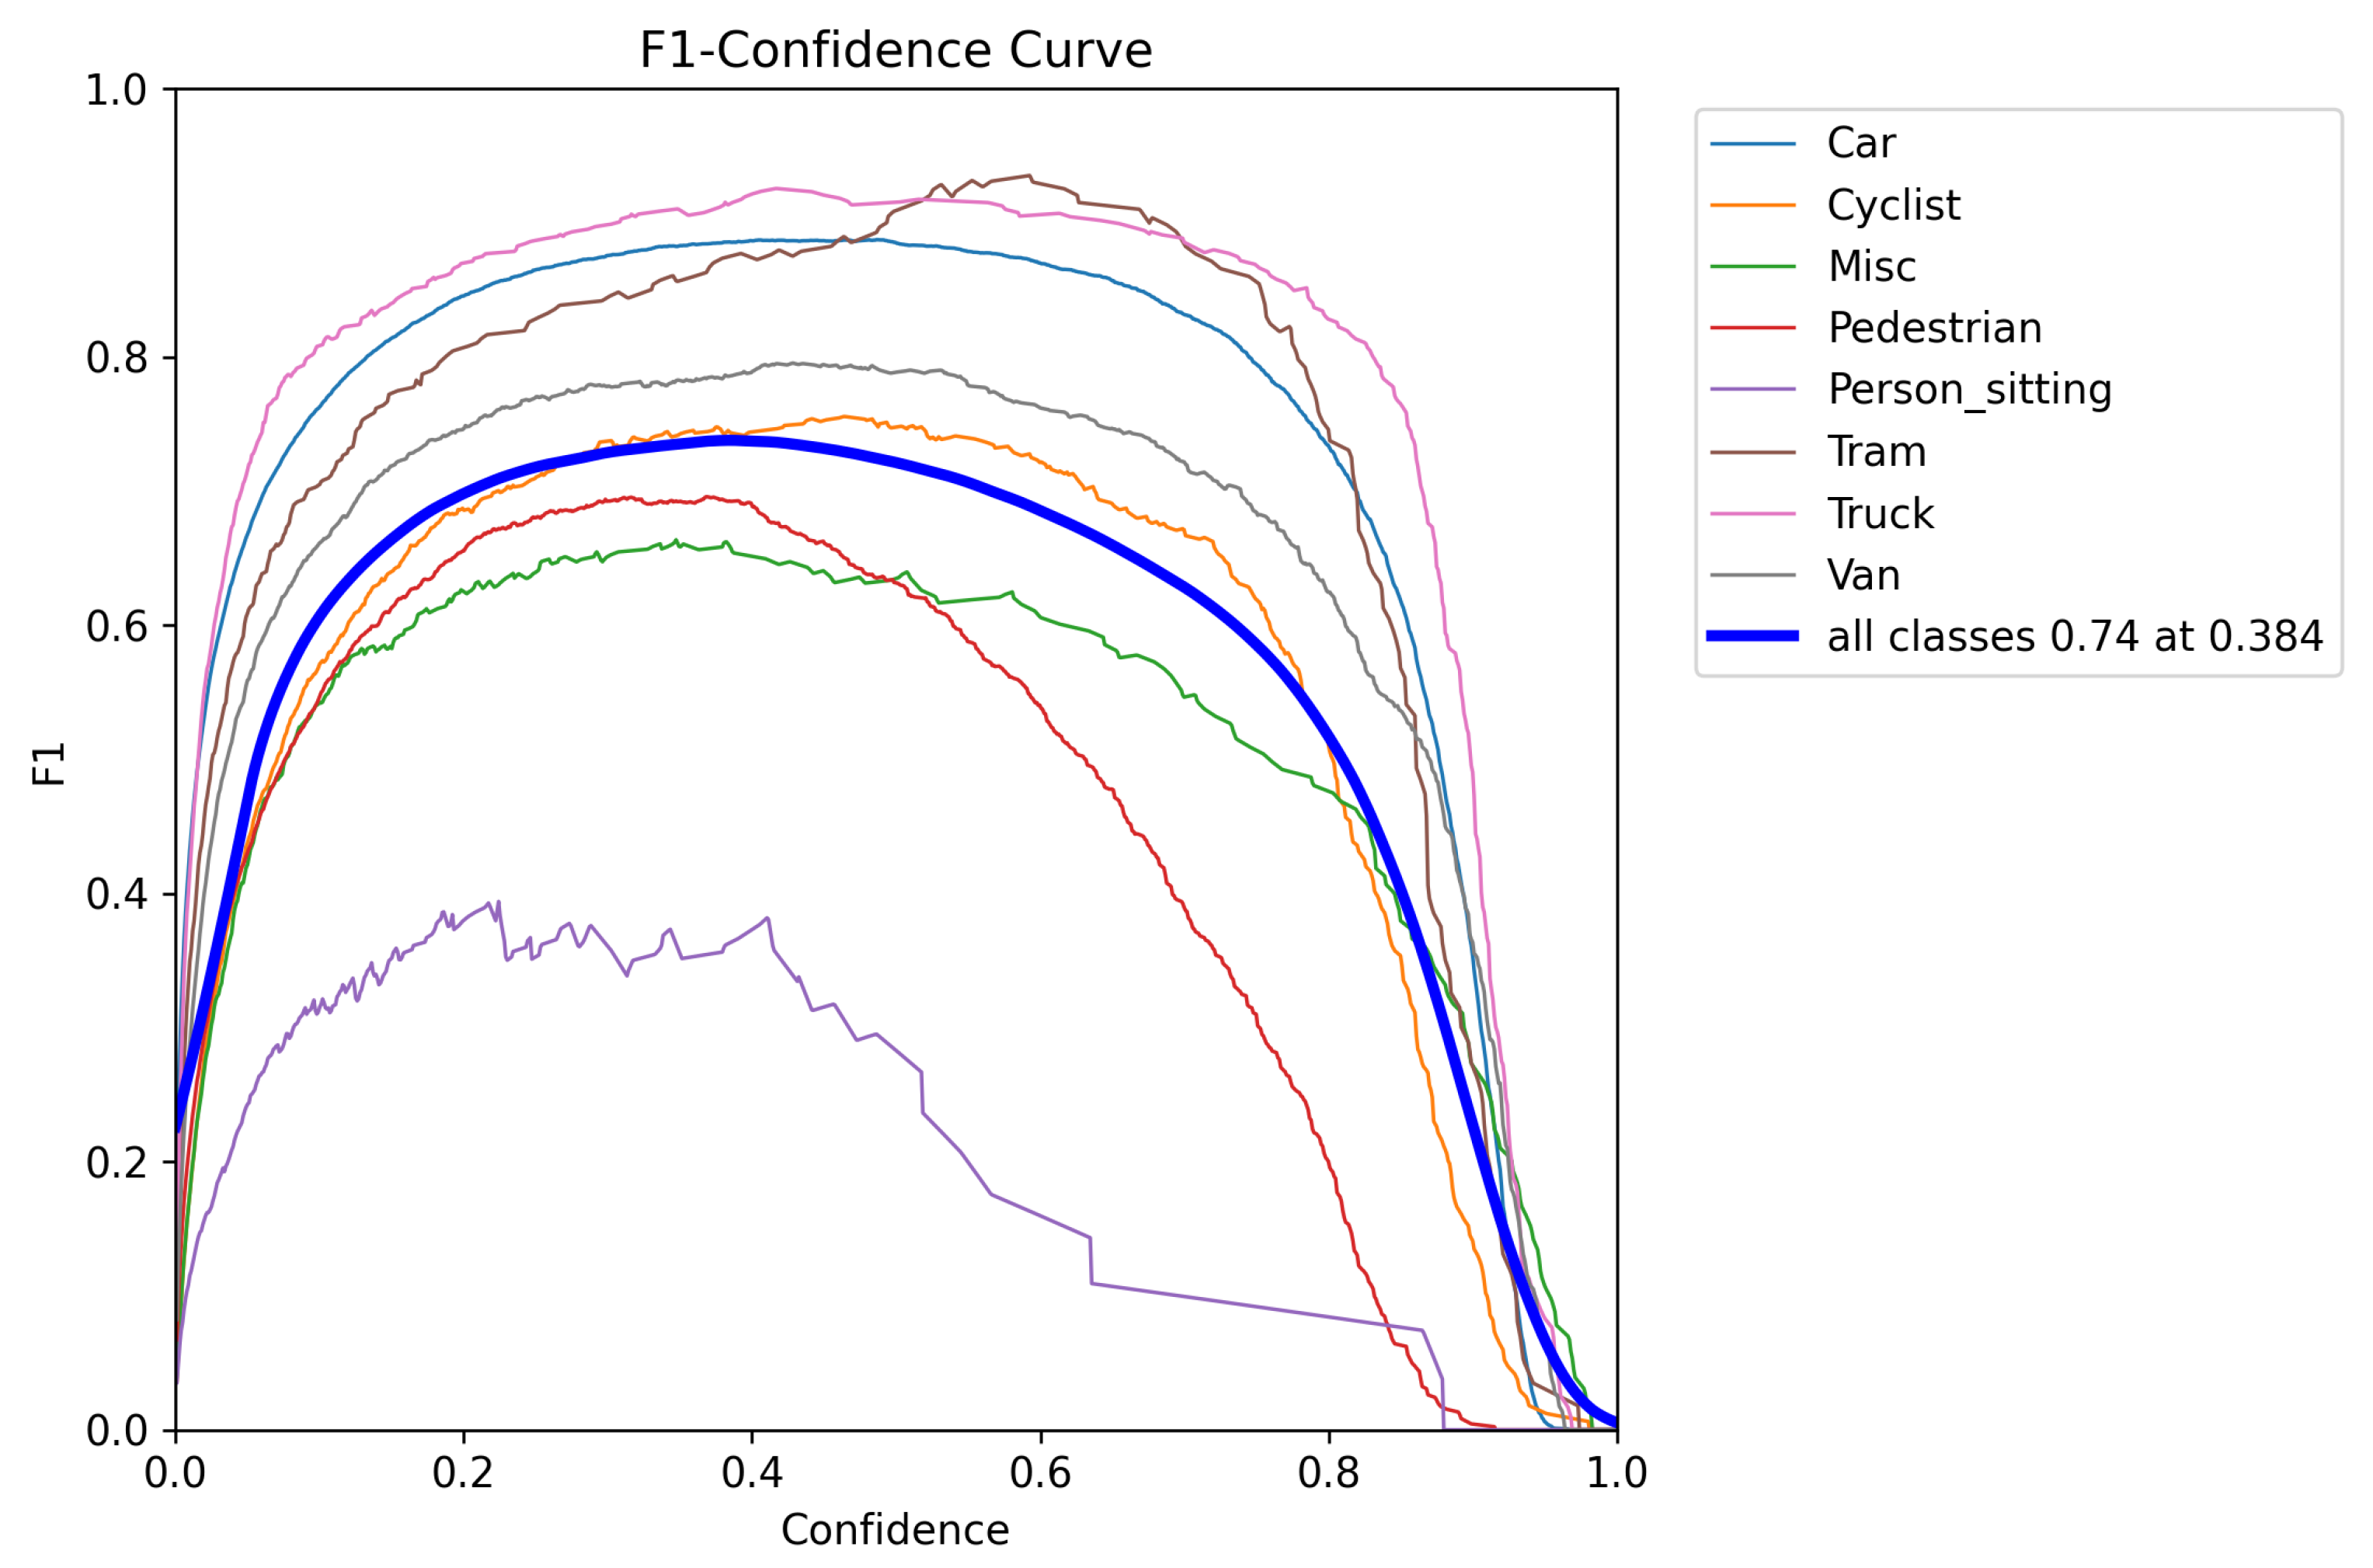
Figure 16.
F1 curve of KITTI object detection model.
Figure 16.
F1 curve of KITTI object detection model.
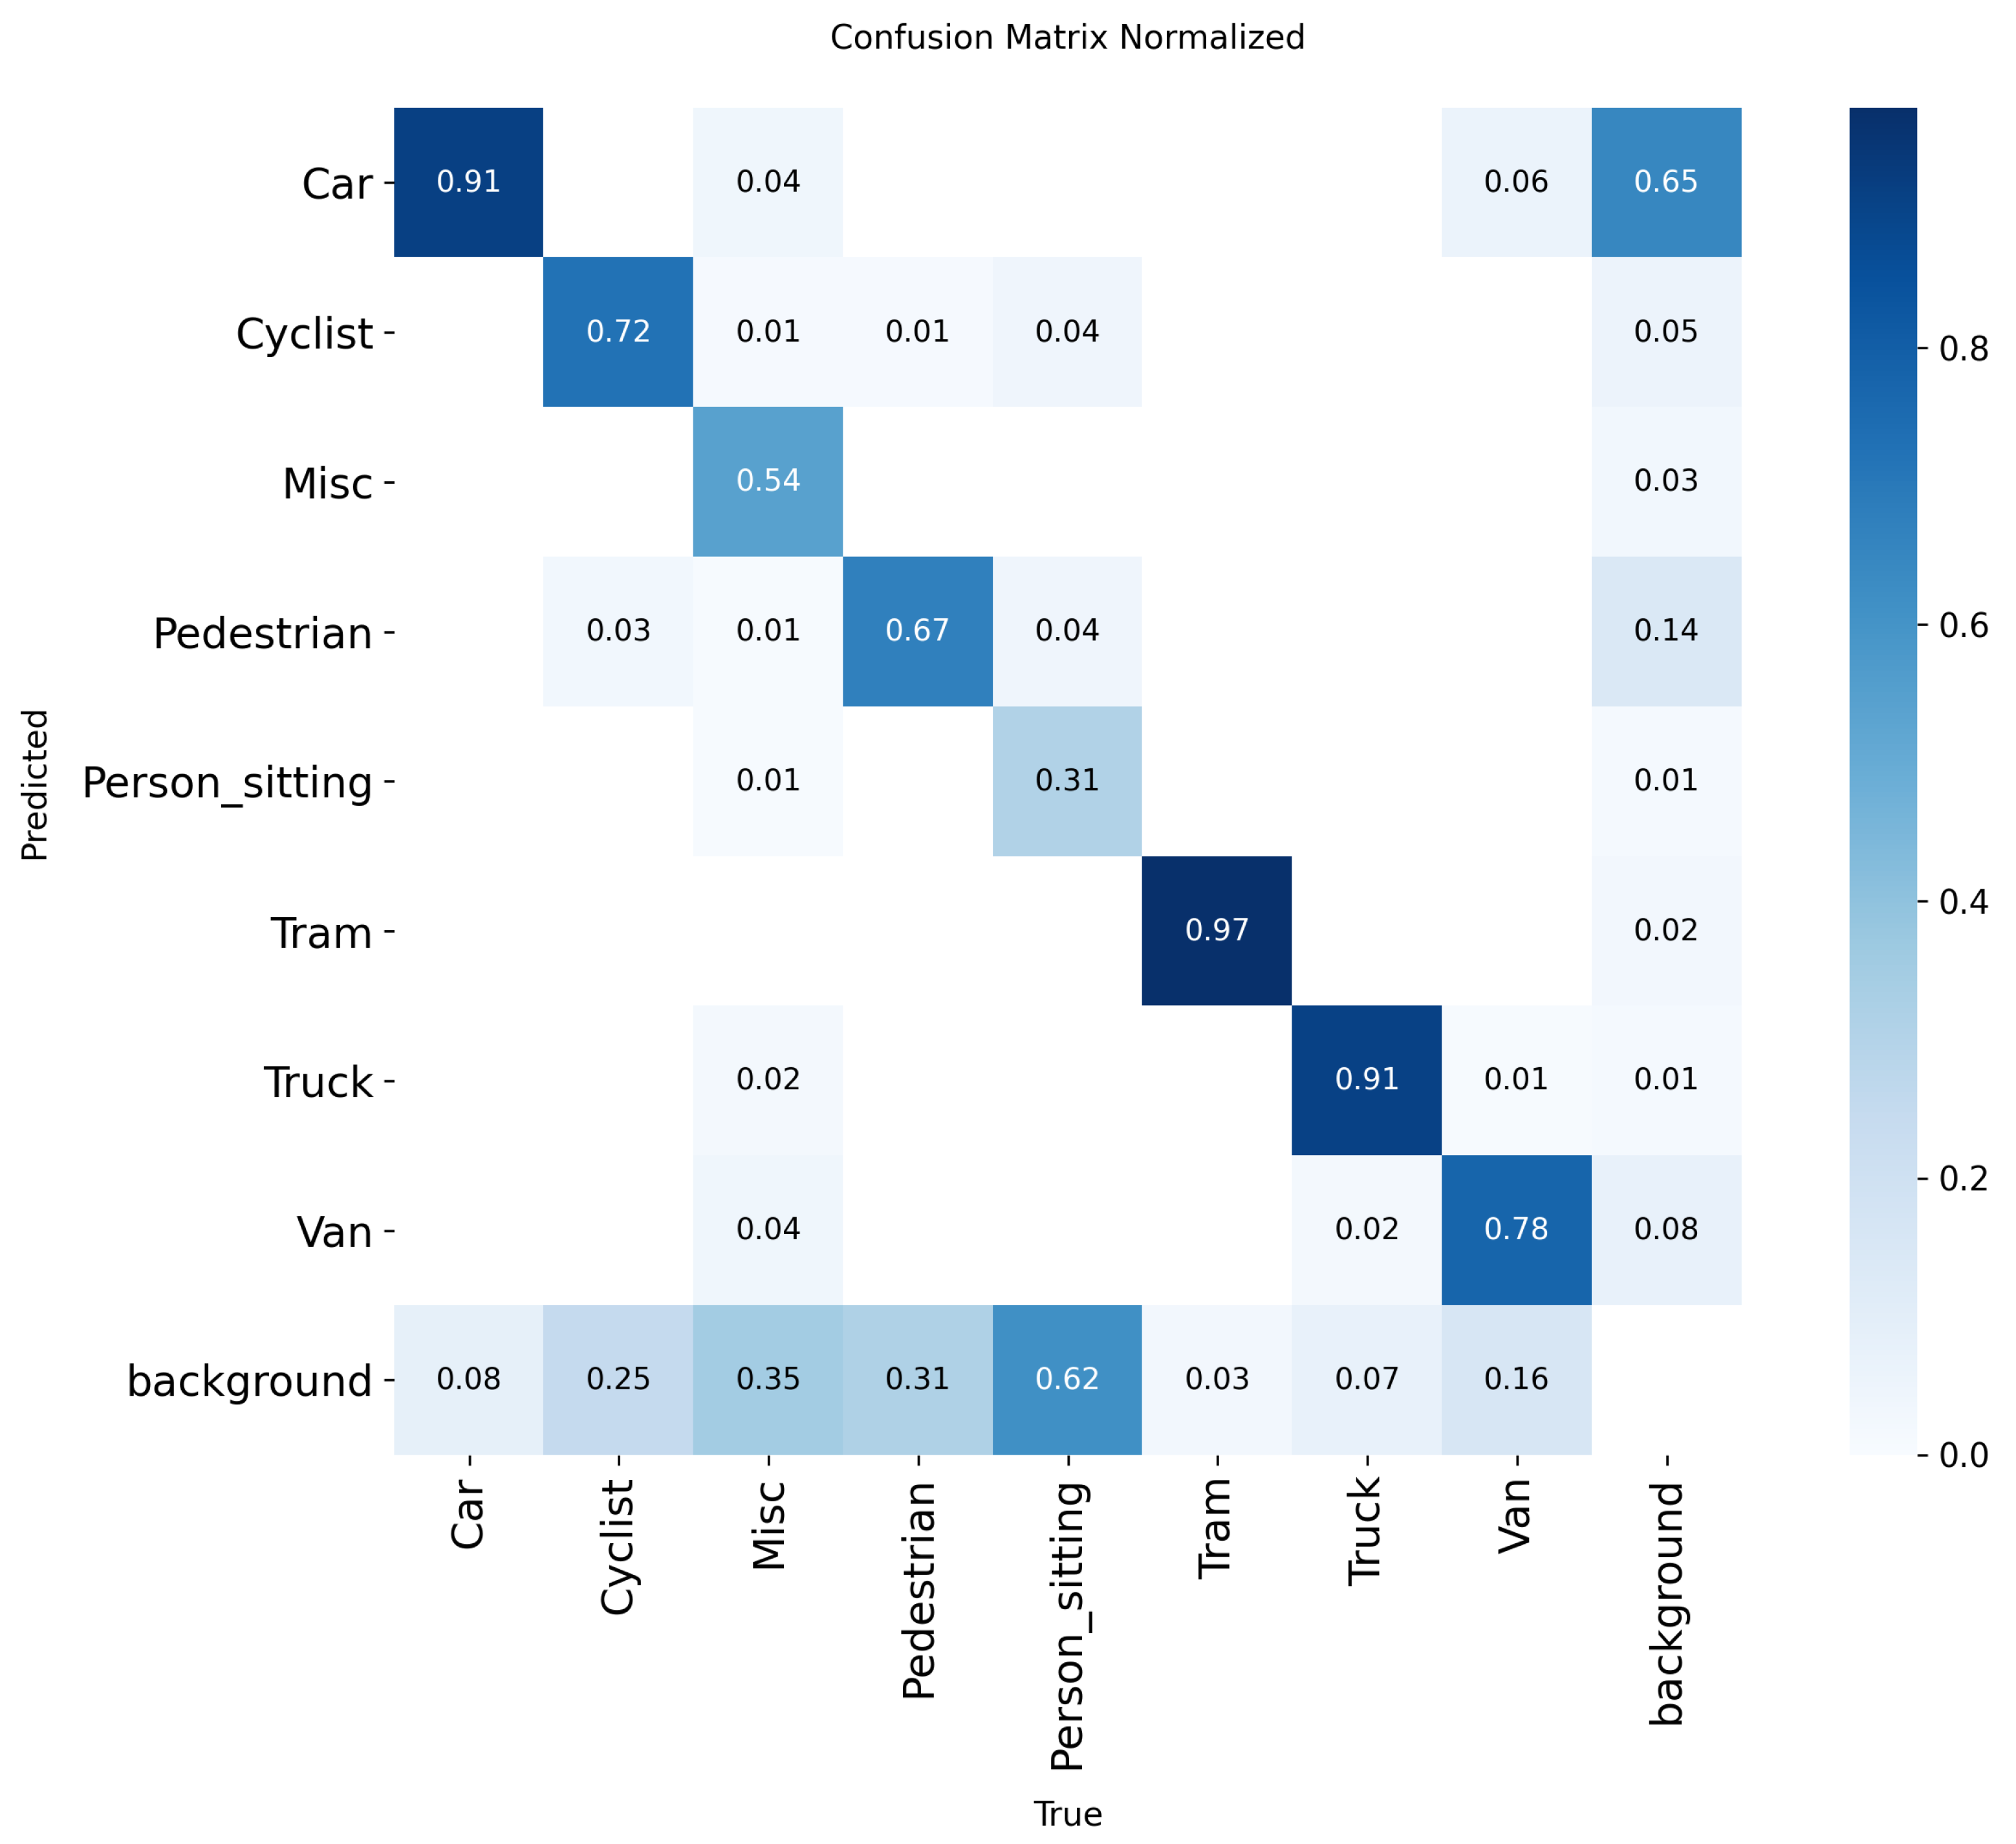
Figure 17.
Normalized confusion matrix of KITTI object detection model.
Figure 17.
Normalized confusion matrix of KITTI object detection model.
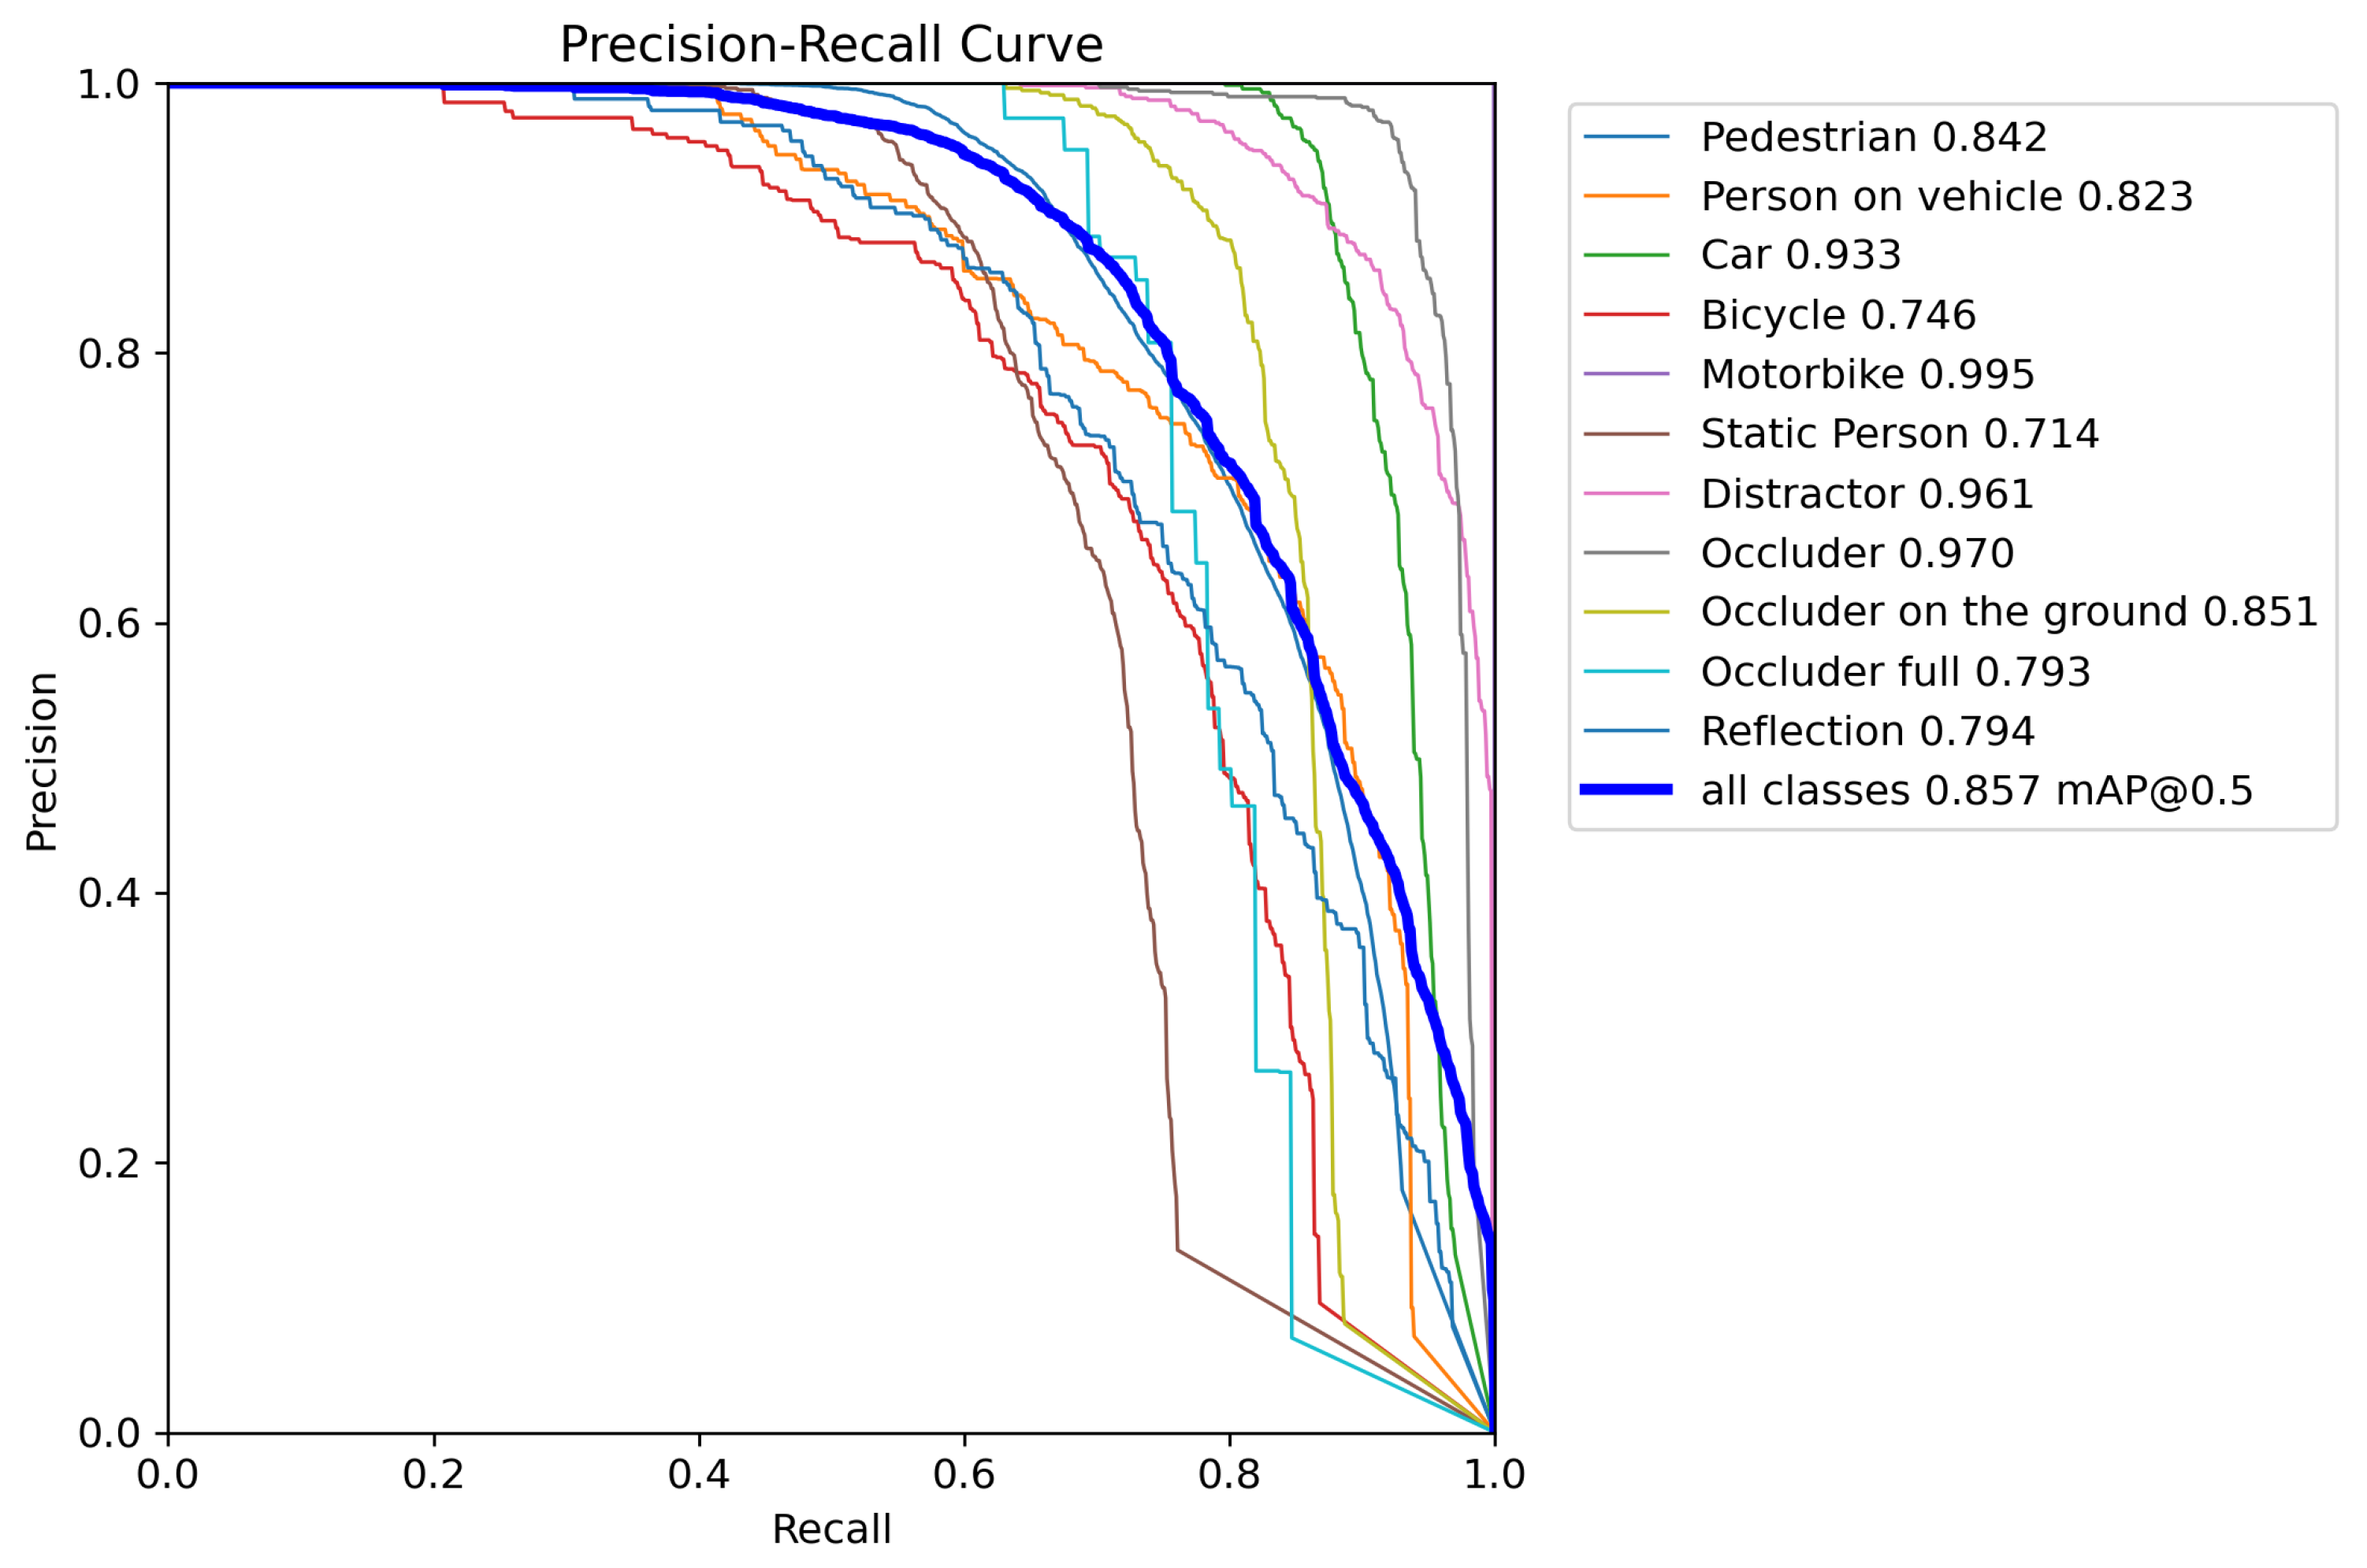
Figure 18.
Precision–Recall curve of MOT17 object detection model.
Figure 18.
Precision–Recall curve of MOT17 object detection model.
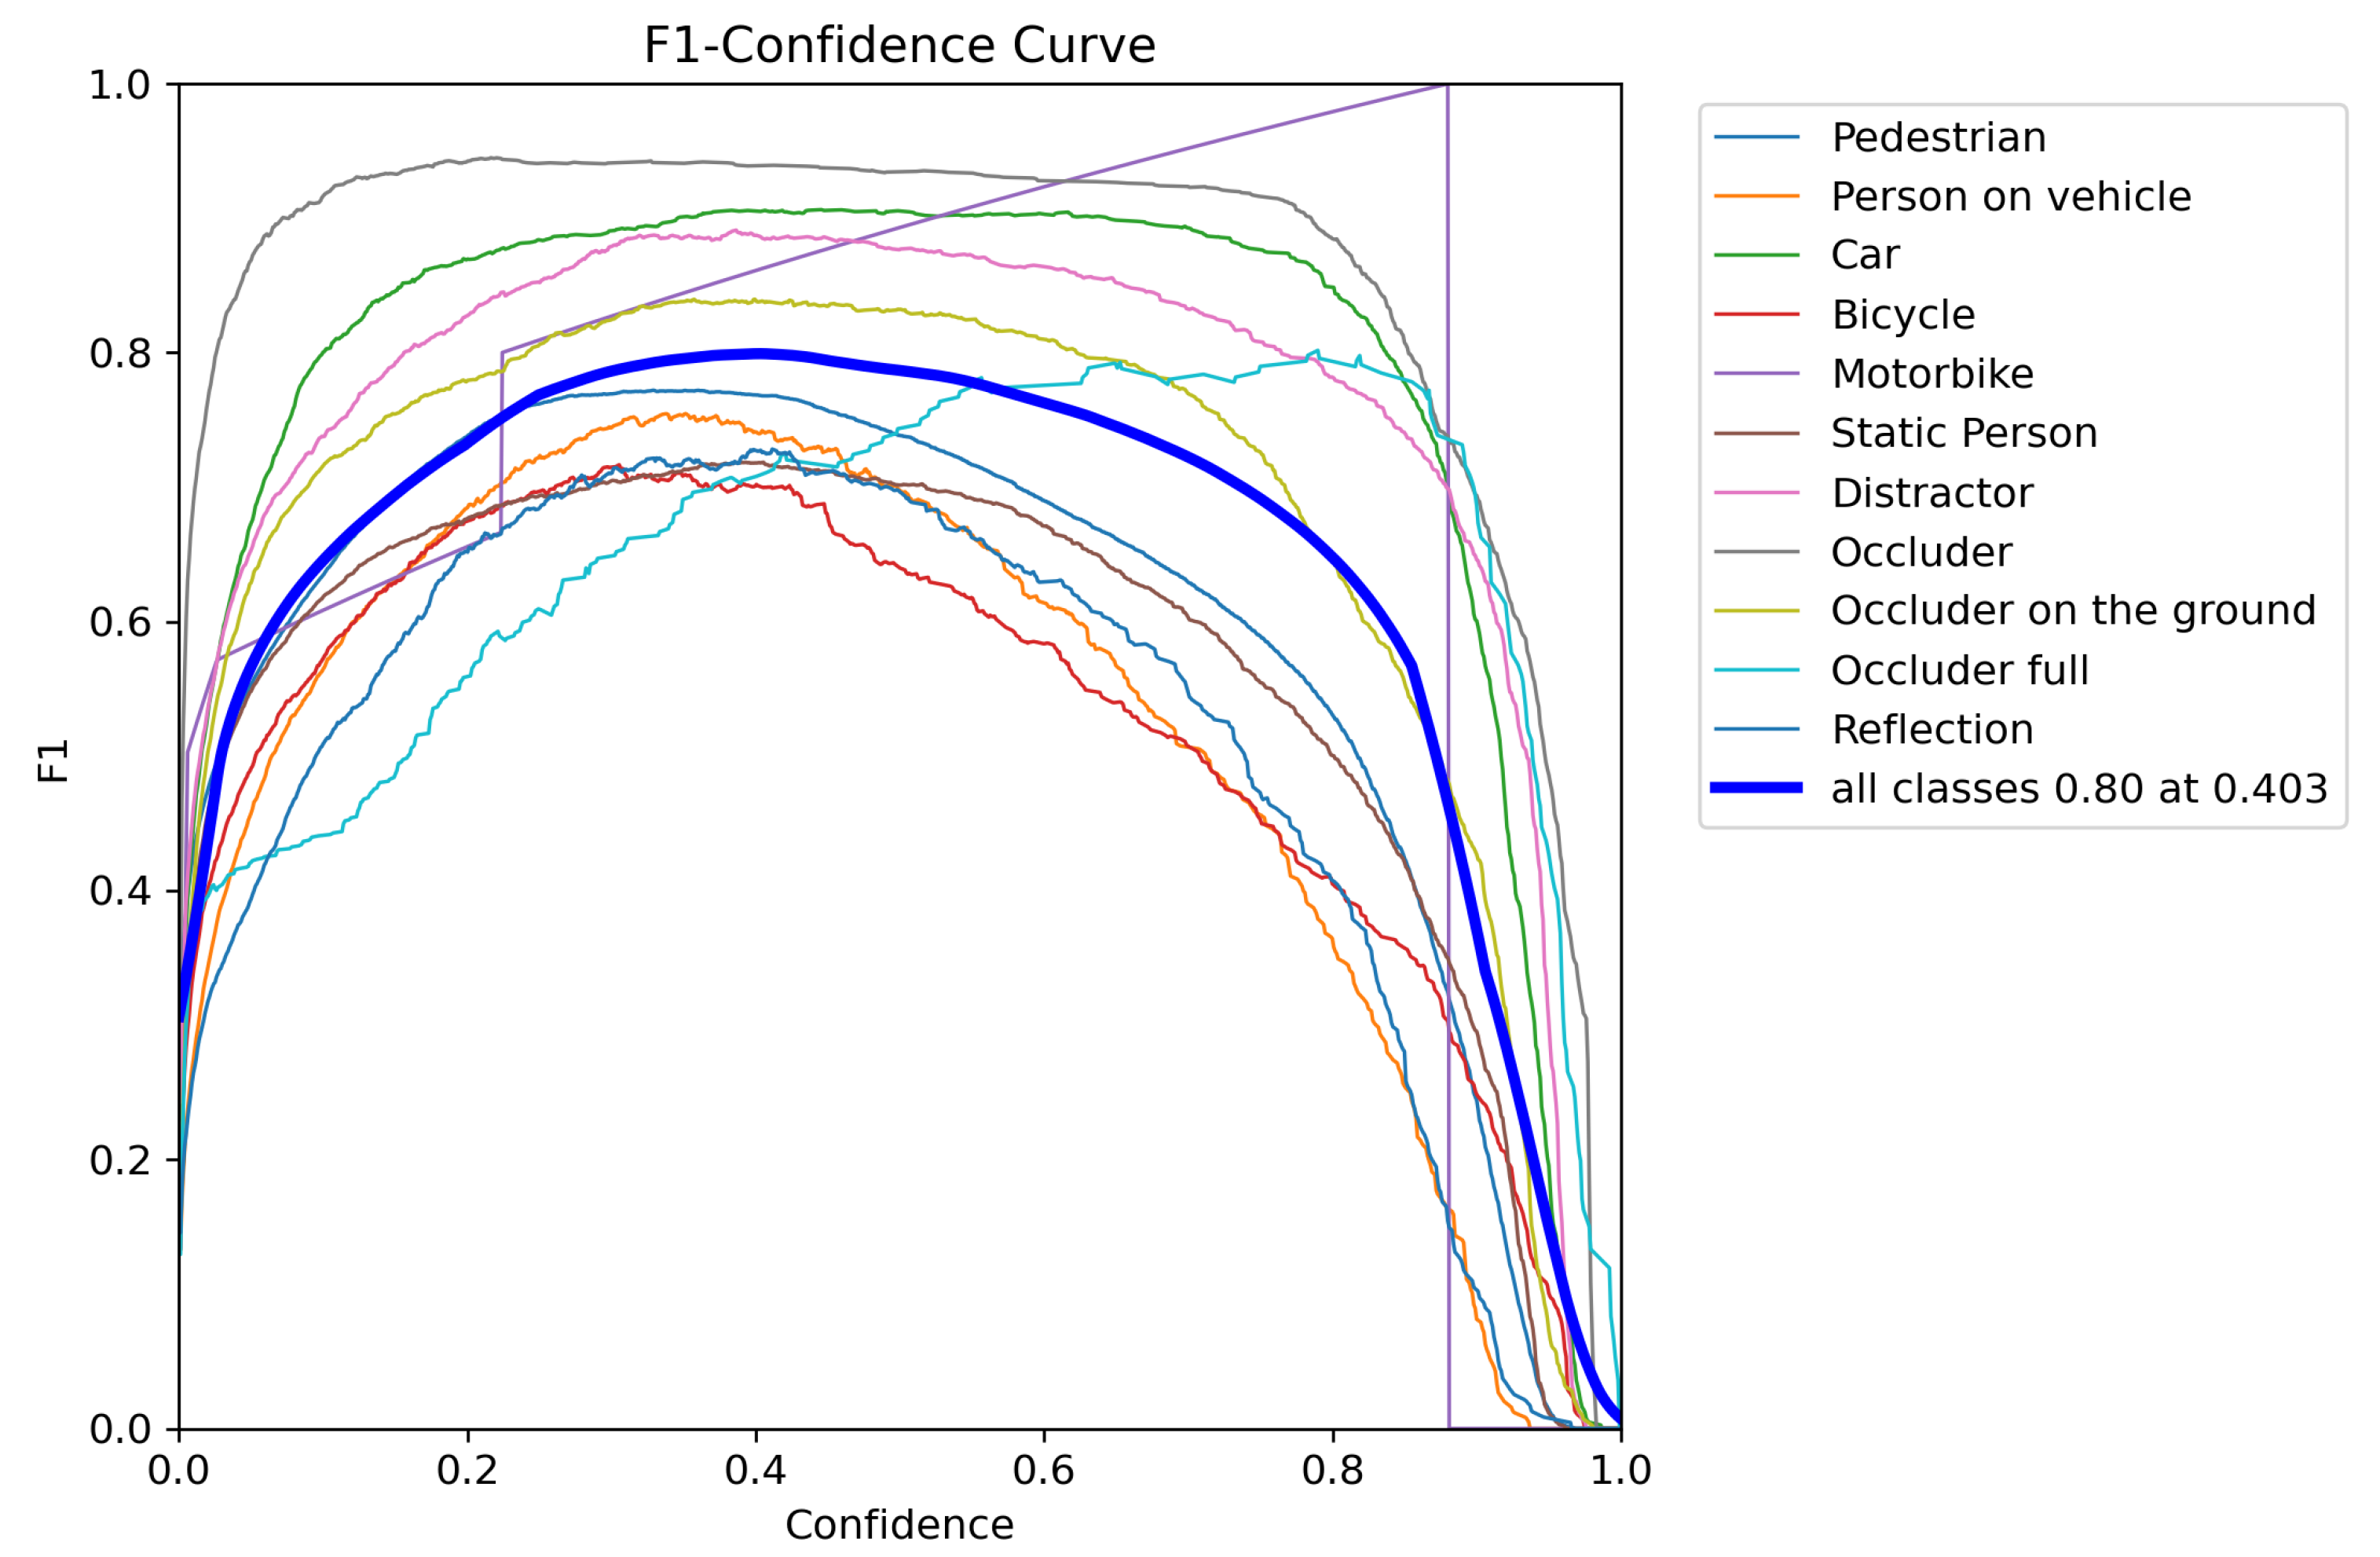
Figure 19.
F1 curve of MOT17 object detection model.
Figure 19.
F1 curve of MOT17 object detection model.
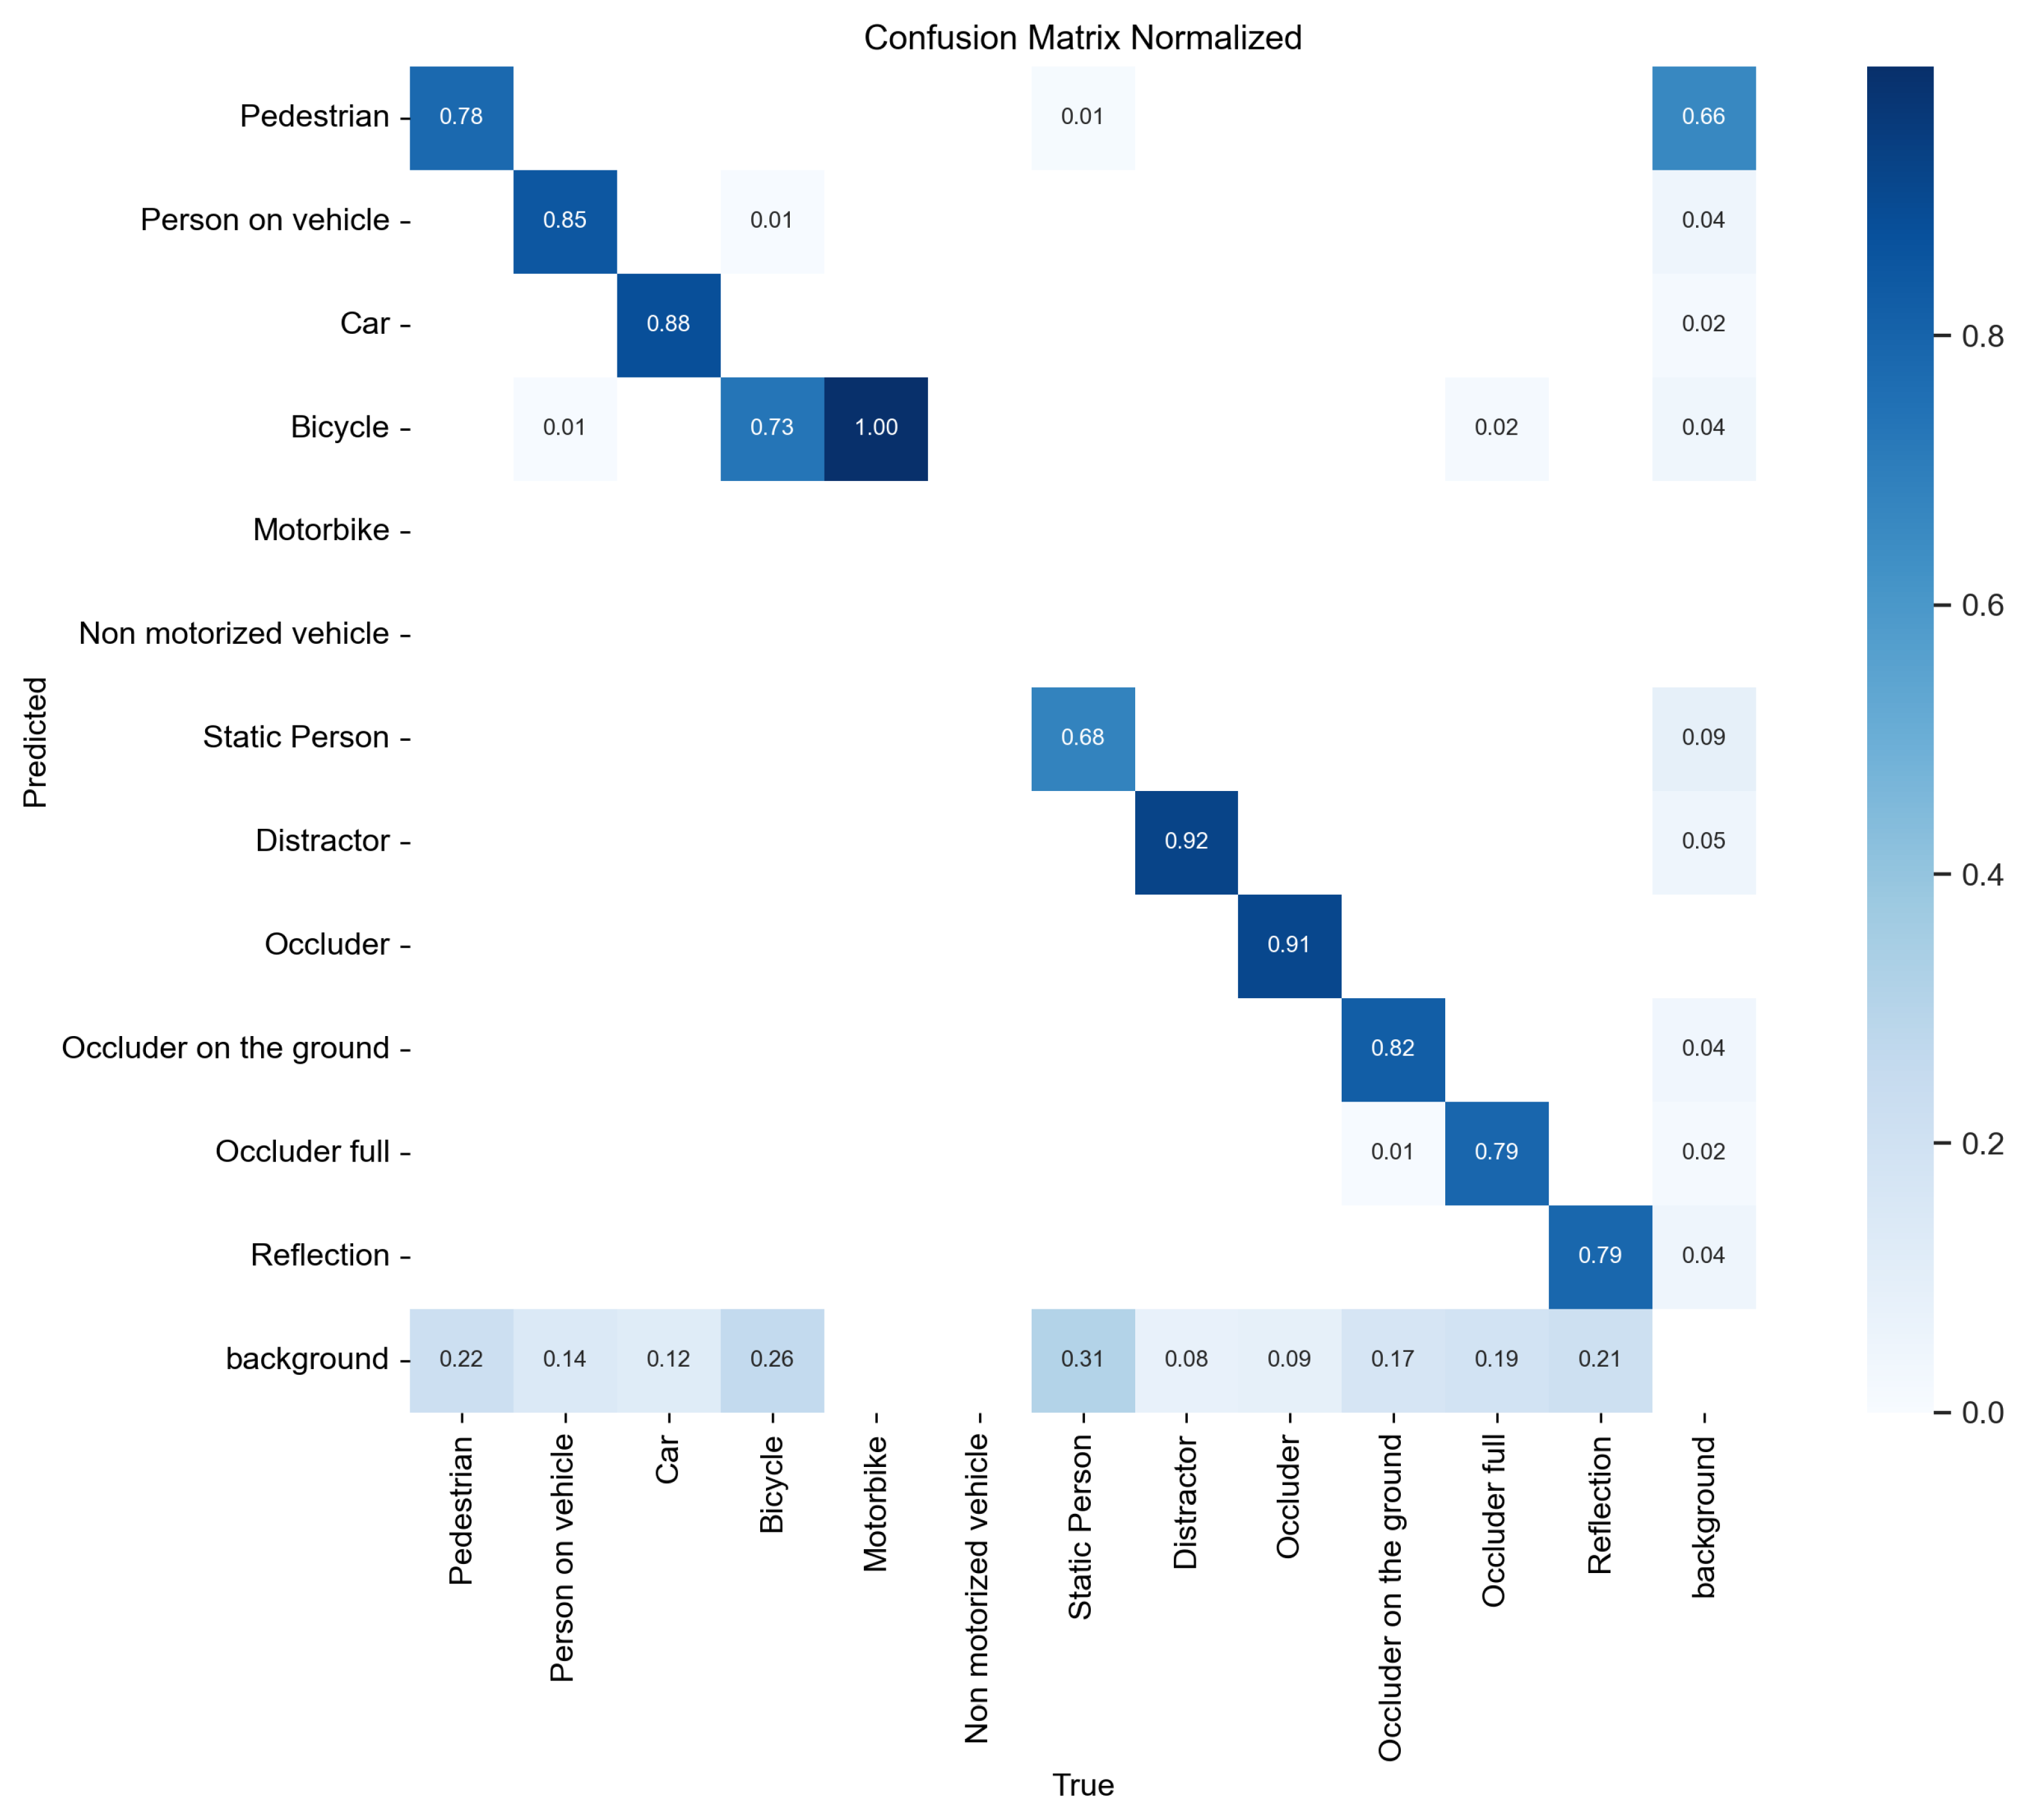
Figure 20.
Normalized confusion matrix of MOT17 object detection model.
Figure 20.
Normalized confusion matrix of MOT17 object detection model.
Table 1.
Fundamental differences among ByteTrack, Bot-SORT, BoostTrack, and PrED.
Table 1.
Fundamental differences among ByteTrack, Bot-SORT, BoostTrack, and PrED.
| Aspect | ByteTrack | Bot-SORT | BoostTrack | PrED (Proposed) |
|---|
| Core Concept | Utilizes both high- and low-confidence detections. | Extends ByteTrack by associating Camera Motion Compensation and IOU-Re-ID fusion for similarity calculation. | Utilizes high- and low-confidence boosted detections. | Incorporates high- and low-confidence rewarded detections as well as predicts bboxes where detections are missing. |
| Detection Handling | Separates detections into high- and low-confidence groups; matches high first, then recovers using low-confidence detections. | Detection separation and matching is similar to ByteTrack; utilizes modified Kalman Filter and IOU-Re-ID fusion for improved tracking. | Applies confidence boost to all tracklets and then filters low-confidence detections. | Applies one-shot matching of both high- and low-confidence tracklets before separating them based on detection confidence to achieve more accurate associations. |
| Similarity Metrics | Employs IoU-based similarity. | Employs IOU and appearance cosine similarity as a part of IOU-Re-ID fusion. | Combines IOU, Mahalanobis, and BBox Shape similarity. | Combines IOU, Mahalanobis, and Template similarity. |
| Tracklet Confidence | No confidence mechanism utilized | Incorporates track confidence using appearance embedding similarity and exponential moving average updates. | Incorporates detection bbox and track bbox confidence scores. Boosts detection and track confidences over time using adaptive weighting. | Uses object-level predictability scores with reward–penalty cycles to adapt track memory dynamically. |
| Track Deletion | Tracks are deleted after 30 consecutive unmatched frames. | Tracks are deleted after 30 consecutive unmatched frames. | Tracks are deleted after 30 consecutive unmatched frames. | Tracks are deleted after the predictability score decays to zero, allowing high-confidence objects longer memory retention. |
Table 2.
Ablation study on MOT17-13 sequence for different parameters. Here, = introduction to predictability score in algorithm, TM = template matching, ABC = artificial bbox creation, VR = variable reward Ffactor.
Table 2.
Ablation study on MOT17-13 sequence for different parameters. Here, = introduction to predictability score in algorithm, TM = template matching, ABC = artificial bbox creation, VR = variable reward Ffactor.
| Tracker | | TM | ABC | VR | FN | FP | IDSW | detA | MOTA | IDF1 |
|---|
| Baseline | ✗ | ✗ | ✗ | ✗ | 9391 | 898 | 154 | 0.4184 | 0.486 | 0.487 |
| PrED v1 | ✓ | ✗ | ✗ | ✗ | 7676 | 2080 | 377 | 0.420 | 0.498 | 0.500 |
| PrED v1.4 | ✓ | ✓ | ✗ | ✗ | 7497 | 2137 | 360 | 0.4402 | 0.4915 | 0.5344 |
| PrED v1.5 | ✓ | ✓ | ✗ | ✓ | 7593 | 1048 | 423 | 0.4571 | 0.5513 | 0.5654 |
| PrED v2.0 | ✓ | ✓ | ✓ | ✗ | 7217 | 1382 | 436 | 0.4613 | 0.5528 | 0.5726 |
| PrED v2.2 | ✓ | ✓ | ✓ | ✓ | 7192 | 1366 | 448 | 0.4622 | 0.5542 | 0.5748 |
Table 3.
Performance comparison in test scenarios. Here, our proposed algorithm is PrED (PrED v2.2).
Table 3.
Performance comparison in test scenarios. Here, our proposed algorithm is PrED (PrED v2.2).
| Density | Algorithms | FN | FP | IDSW | DetA | MOTA |
|---|
| | Base YOLO | 639 | 6 | na | 0.508 | na |
| Low | ByteTrack | 648 | 3 | 2 | 0.508 | 0.506 |
| | PrED | 425 | 1 | 3 | 0.666 | 0.664 |
| | Base YOLO | 2973 | 17 | na | 0.301 | na |
| High | Bytetrack | 2786 | 16 | 1 | 0.342 | 0.342 |
| | PrED | 2402 | 111 | 7 | 0.413 | 0.411 |
Table 4.
Performance comparison in KITTI training dataset. Here, our proposed algorithm is PrED (PrED v2.2).
Table 4.
Performance comparison in KITTI training dataset. Here, our proposed algorithm is PrED (PrED v2.2).
| Algorithms | FN | FP | IDSW | detA | MOTA | MOTP | IDF1 | HOTA |
|---|
| ByteTrack | 17,703 | 1288 | 285 | 0.488 | 0.5932 | 0.7957 | 0.6974 | 0.5681 |
| PrED | 11,055 | 3655 | 531 | 0.571 | 0.666 | 0.8087 | 0.7362 | 0.5998 |
Table 5.
Performance comparison in MOT17 training. Here, our proposed algorithm is PrED (PrED v2.2).
Table 5.
Performance comparison in MOT17 training. Here, our proposed algorithm is PrED (PrED v2.2).
| Algorithms | FN | FP | IDSW | detA | MOTA | MOTP | IDF1 | HOTA |
|---|
| ByteTrack | 72,555 | 41,182 | 8288 | 0.4804 | 0.5507 | 0.8071 | 0.5579 | 0.4407 |
| PrED | 63,518 | 43,833 | 11,294 | 0.520 | 0.5652 | 0.786 | 0.5134 | 0.402 |