Article

Butt Jointing of Prefabricated Concrete Columns

iBMB (Institute of Building Materials, Concrete Constructions and Fire Safety), Division of Concrete Construction, TU Braunschweig, 38106 Braunschweig, Germany
*
Author to whom correspondence should be addressed.
CivilEng 2022, 3(4), 1108-1125; https://doi.org/10.3390/civileng3040063
Submission received: 20 November 2022 / Revised: 9 December 2022 / Accepted: 12 December 2022 / Published: 16 December 2022
(This article belongs to the Topic Advances on Structural Engineering, 2nd Volume)

Abstract

:
In response to housing shortages in densely inhabited urban areas, there is a search for structural engineering solutions for serial and modular construction. Prefabricated concrete columns can make an important difference. Using industrial manufacturing processes, it is possible to produce highly loadable, durable and true-to-size columns that enable accelerated construction progress and dismantling or reuse of the components at the end of the structure’s economic life. However, there are challenges in designing the detachable connection between highly loaded columns due to an undesired reduction of the load-bearing capacity on the one hand and a high sensitivity to geometrical deviations on the other hand. To investigate the load-bearing and deformation behaviour of butt-jointed columns, large-scale component tests as well as three-dimensional numerical analyses using the finite element method were carried out. The analyses show that measures to increase the stiffness of the joint, such as thicker steel plates, lower mortar thickness, etc., lead to an increase of the ultimate load. It could also be demonstrated that butt-jointed columns are very sensitive to unevenness of the end faces. Finally, the investigations allow first conclusions on the design and detailing of detachable compression connections between prefabricated concrete columns.

1. Introduction

The prefabrication of reinforced concrete compression members is very advantageous for many reasons, such as, for example, the rapid construction progress, modularisation or the high quality and thus durability of the concrete components. Prefabrication also plays an important role in terms of sustainability, as components can be replaced or reinstalled in other structural surroundings once the end of the framework’s economic lifecycle is reached.
Designing detachable joints is a complex issue in prefabricated compression members, where high requirements exist concerning a high load-bearing capacity, tolerance compensation and fast production, etc. The dimensioning of these joints depends on the forces to be transmitted and other boundary conditions.
Butt joints have proven to be suitable for connections that are mainly subjected to vertical forces. This also means that butt joints may not be used in areas with potential seismic activity. Recent studies on column–column joints subjected to seismic or other horizontal loads can be found in [1,2,3,4,5]. In Germany, prefabricated columns for high-rise buildings have been a major application of butt joints since the 2010s. Well-known examples are the “Tanzende Türme” in Hamburg (2013), the “TaunusTurm” in Frankfurt (2013) [6] and the “Omniturm” in Frankfurt (2019) [7]. Figure 1a shows the “Four” high-rise project that is currently under construction in Frankfurt. Taking the corresponding columns in Figure 1b as an example, exceptional details of the trend towards high-performance columns can be recognised. These include the application of high-strength concrete and high-strength steel as well as the structural design with high reinforcement ratios and large bar diameters. This development leads to a reduction of column dimensions in order to maximize the rentable floorspace, to generate a filigree appearance and to build in a resource-efficient way [8].
A key focus in the design of prefabricated concrete columns is on butt joints, characterising a significant region of both discontinuity and transmission of high vertical forces. This paper focuses on the joints of prefabricated columns using high longitudinal reinforcement ratios and large bar diameters. New detailed evaluations of the force and deformation behaviour of butt joints from large-scale experimental tests are presented. Based on the findings, numerical mesoscale models were derived idealising the load-bearing behaviour and providing insights into the failure modes of butt joints. The models allow first parameter studies on influences on the ultimate load of butt-jointed precast columns and reveal important factors to be taken into account for the design of butt joints.

2. State of the Art

Joints are usually the weakest point in prefabricated concrete columns. In the past, a number of designs were investigated for optimal force transmission via butt joints, e.g., elastomeric bearings [10], glued joints [11], grouted joints [12,13,14,15,16] or end-face-reinforced joints [17,18,19]. In Germany, tolerance-compensating grouted butt joints with steel plates as lateral strain restraints have been established for prefabricated columns that are predominantly loaded centrically [20,21,22] (cf. Figure 2a).
The absence of design and detailing rules in Eurocode 2 makes application difficult [23]. In Germany, for each high-rise project with prefabricated butt-jointed columns, an individual approval has to be applied. In this context, the recommendations of the German commentary on Eurocode 2 are mostly referred to [24]. Thus, the design load of butt-jointed columns can be determined according to Equation (1) by adding the load-bearing parts of concrete and steel in the same way as for the regular column design and introducing the factor κ for quantifying the influence of the butt joint.
N Rd = κ     ( A c     f cd + A s     f yd )
In analogy to the design of monolithic columns, the confinement effect of the transverse reinforcement can be neglected for simplification. A more detailed consideration of the strength-increasing confinement effect in reinforced concrete columns can be achieved, for example, using the basic approaches in [25,26,27,28,29] or novel approaches in [30,31,32,33,34].
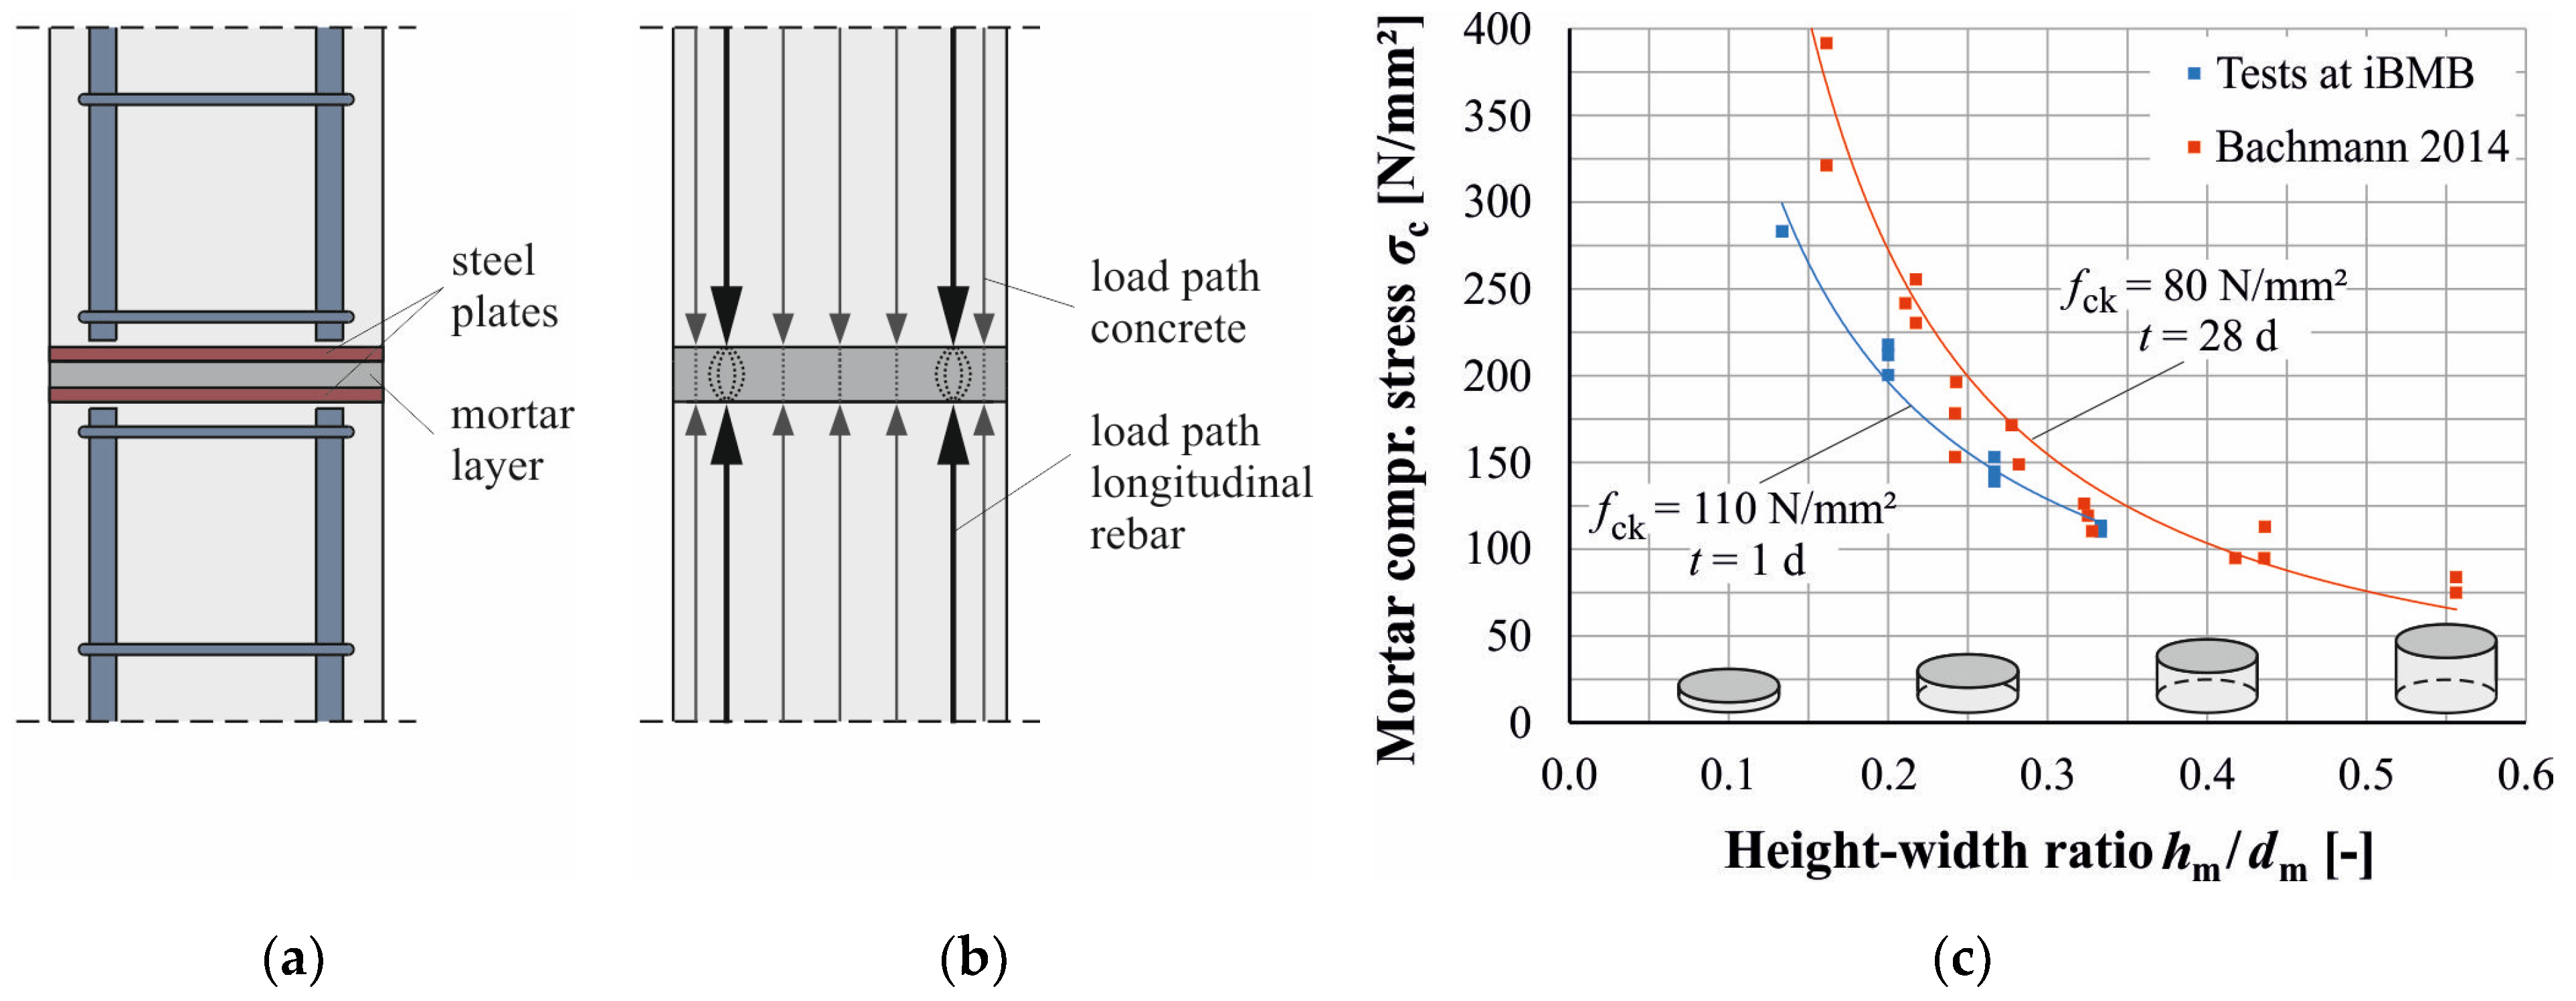
For butt joints with steel plates, κ = 1.0 is given in the German commentary on Eurocode 2 [24]. This means that according to [24], the application of butt joints with steel plates does not lead to a reduction of the ultimate load of the respective monolithically manufactured, reinforced concrete column. The background and confirmation of Equation (1) is provided by the research of Paschen, Minnert and Bachmann [6,17,18]. They state that the total load of the longitudinal reinforcement bars is transferred through the joint via peak pressure (cf. Figure 2b) [6]. Due to the multiaxial compression stress state between the steel plates, the mortar is able to transfer the high stresses of the longitudinal bars through the butt joint. Figure 2c shows experimental investigations on mortar discs with different thicknesses conducted by Bachmann [6] and supplementary investigations carried out at iBMB, which prove the high load-bearing capacity of mortar layers. The lower the height–width ratio of the mortar discs, the higher the mortar compressive strength due to multi-axial compression stress states. According to Minnert and Bachmann [6,18], the forces transmitted directly through the joint do not lead to any bond stresses between the longitudinal reinforcement and the concrete. As a result, no time-independent stress redistribution between steel and concrete is to be expected. Closer stirrup spacing to provide increased confinement of the concrete core compared to the adjacent column is therefore not required. It is important to emphasise that this approach is based on low- and normal-reinforced concrete columns [18].
The experimental investigations leading to a factor κ = 1.0 were carried out on butt-jointed reinforced concrete columns with longitudinal reinforcement ratios ρ l     6   % and small bar diameters ϕ l     16   mm [18]. The applicability is additionally limited to:
  • Mortar thickness h m     20   mm .
  • Steel plate thickness h s     10   mm .
  • Compressive mortar strength f cm , m     f cm , c .
The list above is according to the German commentary on Eurocode 2 [24]. The high-reinforced concrete columns commonly used in high-rise construction are not considered by the investigations in [18] and recommendations in [24]. However, initial investigations in [35,36,37] already indicate that the recommendation κ = 1.0 is no longer valid for high reinforcement ratios and large bar diameters.

3. Large-Scale Tests

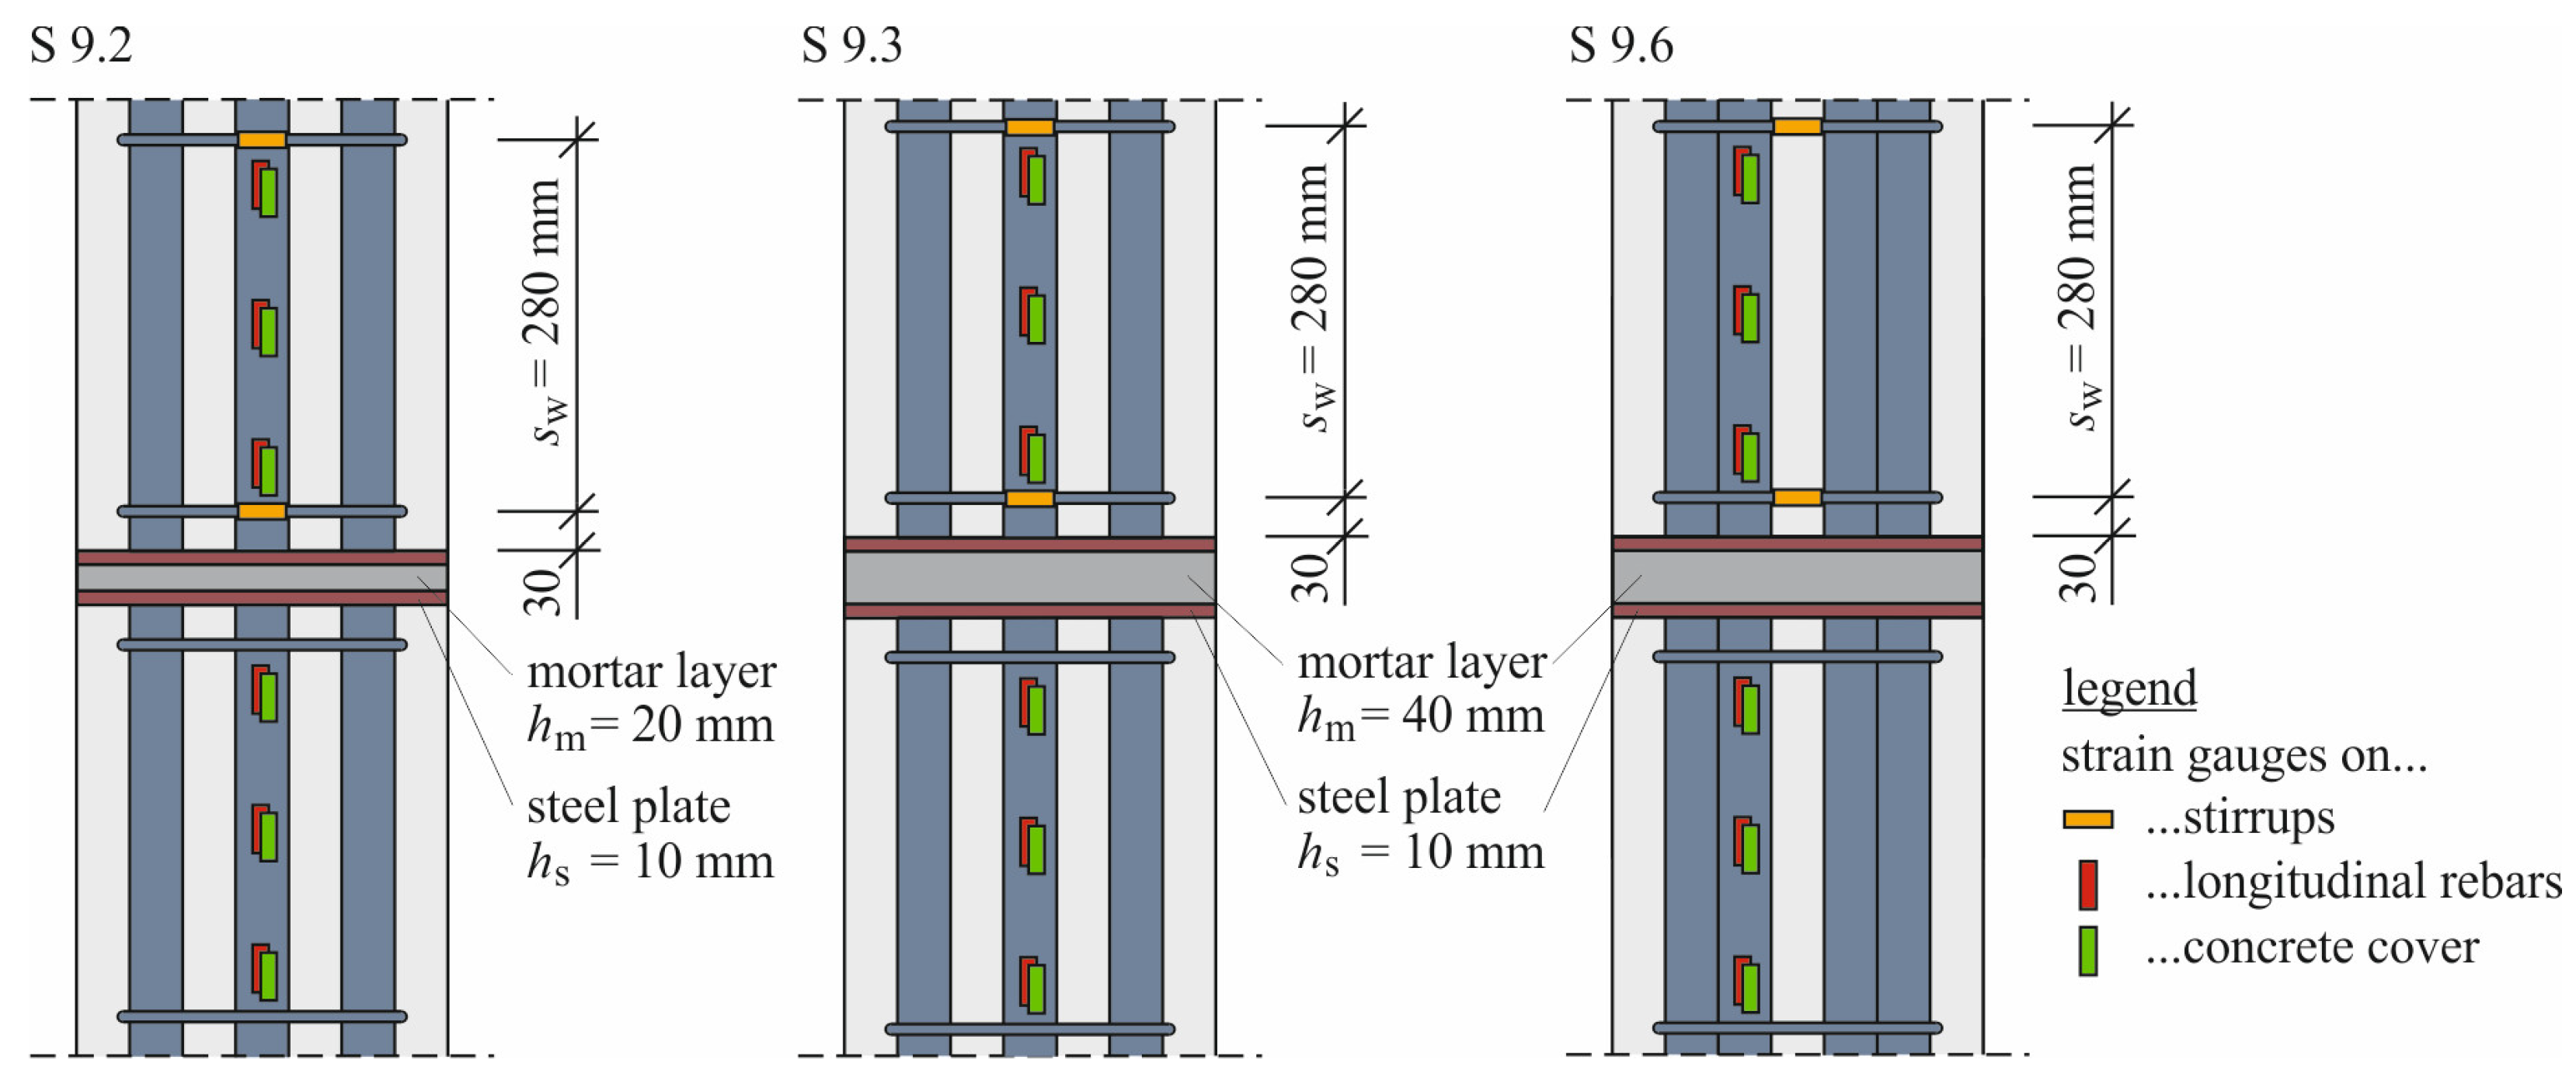
For the investigation of butt-jointed reinforced concrete columns with high longitudinal reinforcement ratios and large bar diameters, five large-scale component tests were carried out at iBMB, TU Braunschweig. In addition to two monolithically manufactured reference columns S 9.1 and S 7.7, three butt-jointed column configurations shown in Figure 3 will be considered in detail.
The component tests had a length of h = 202   cm and a square cross-section with a side length of a = 28   cm . For all tests, concrete C50/60 as well as reinforcing steel B500 with bar diameter ϕ l = 40   mm were used. For the jointed columns, the longitudinal reinforcement ratio varies between ρ l = 12.8 % and ρ l = 25.6 % , and the mortar thickness varies between h m = 20   mm and h m = 40   mm . In accordance with the recommendations [24], the stirrup spacing was chosen to be s w = 28   cm as specified in Eurocode 2 [23]. The corresponding configurations as well as the properties of concrete, mortar and longitudinal reinforcement are summarised in Table 1.
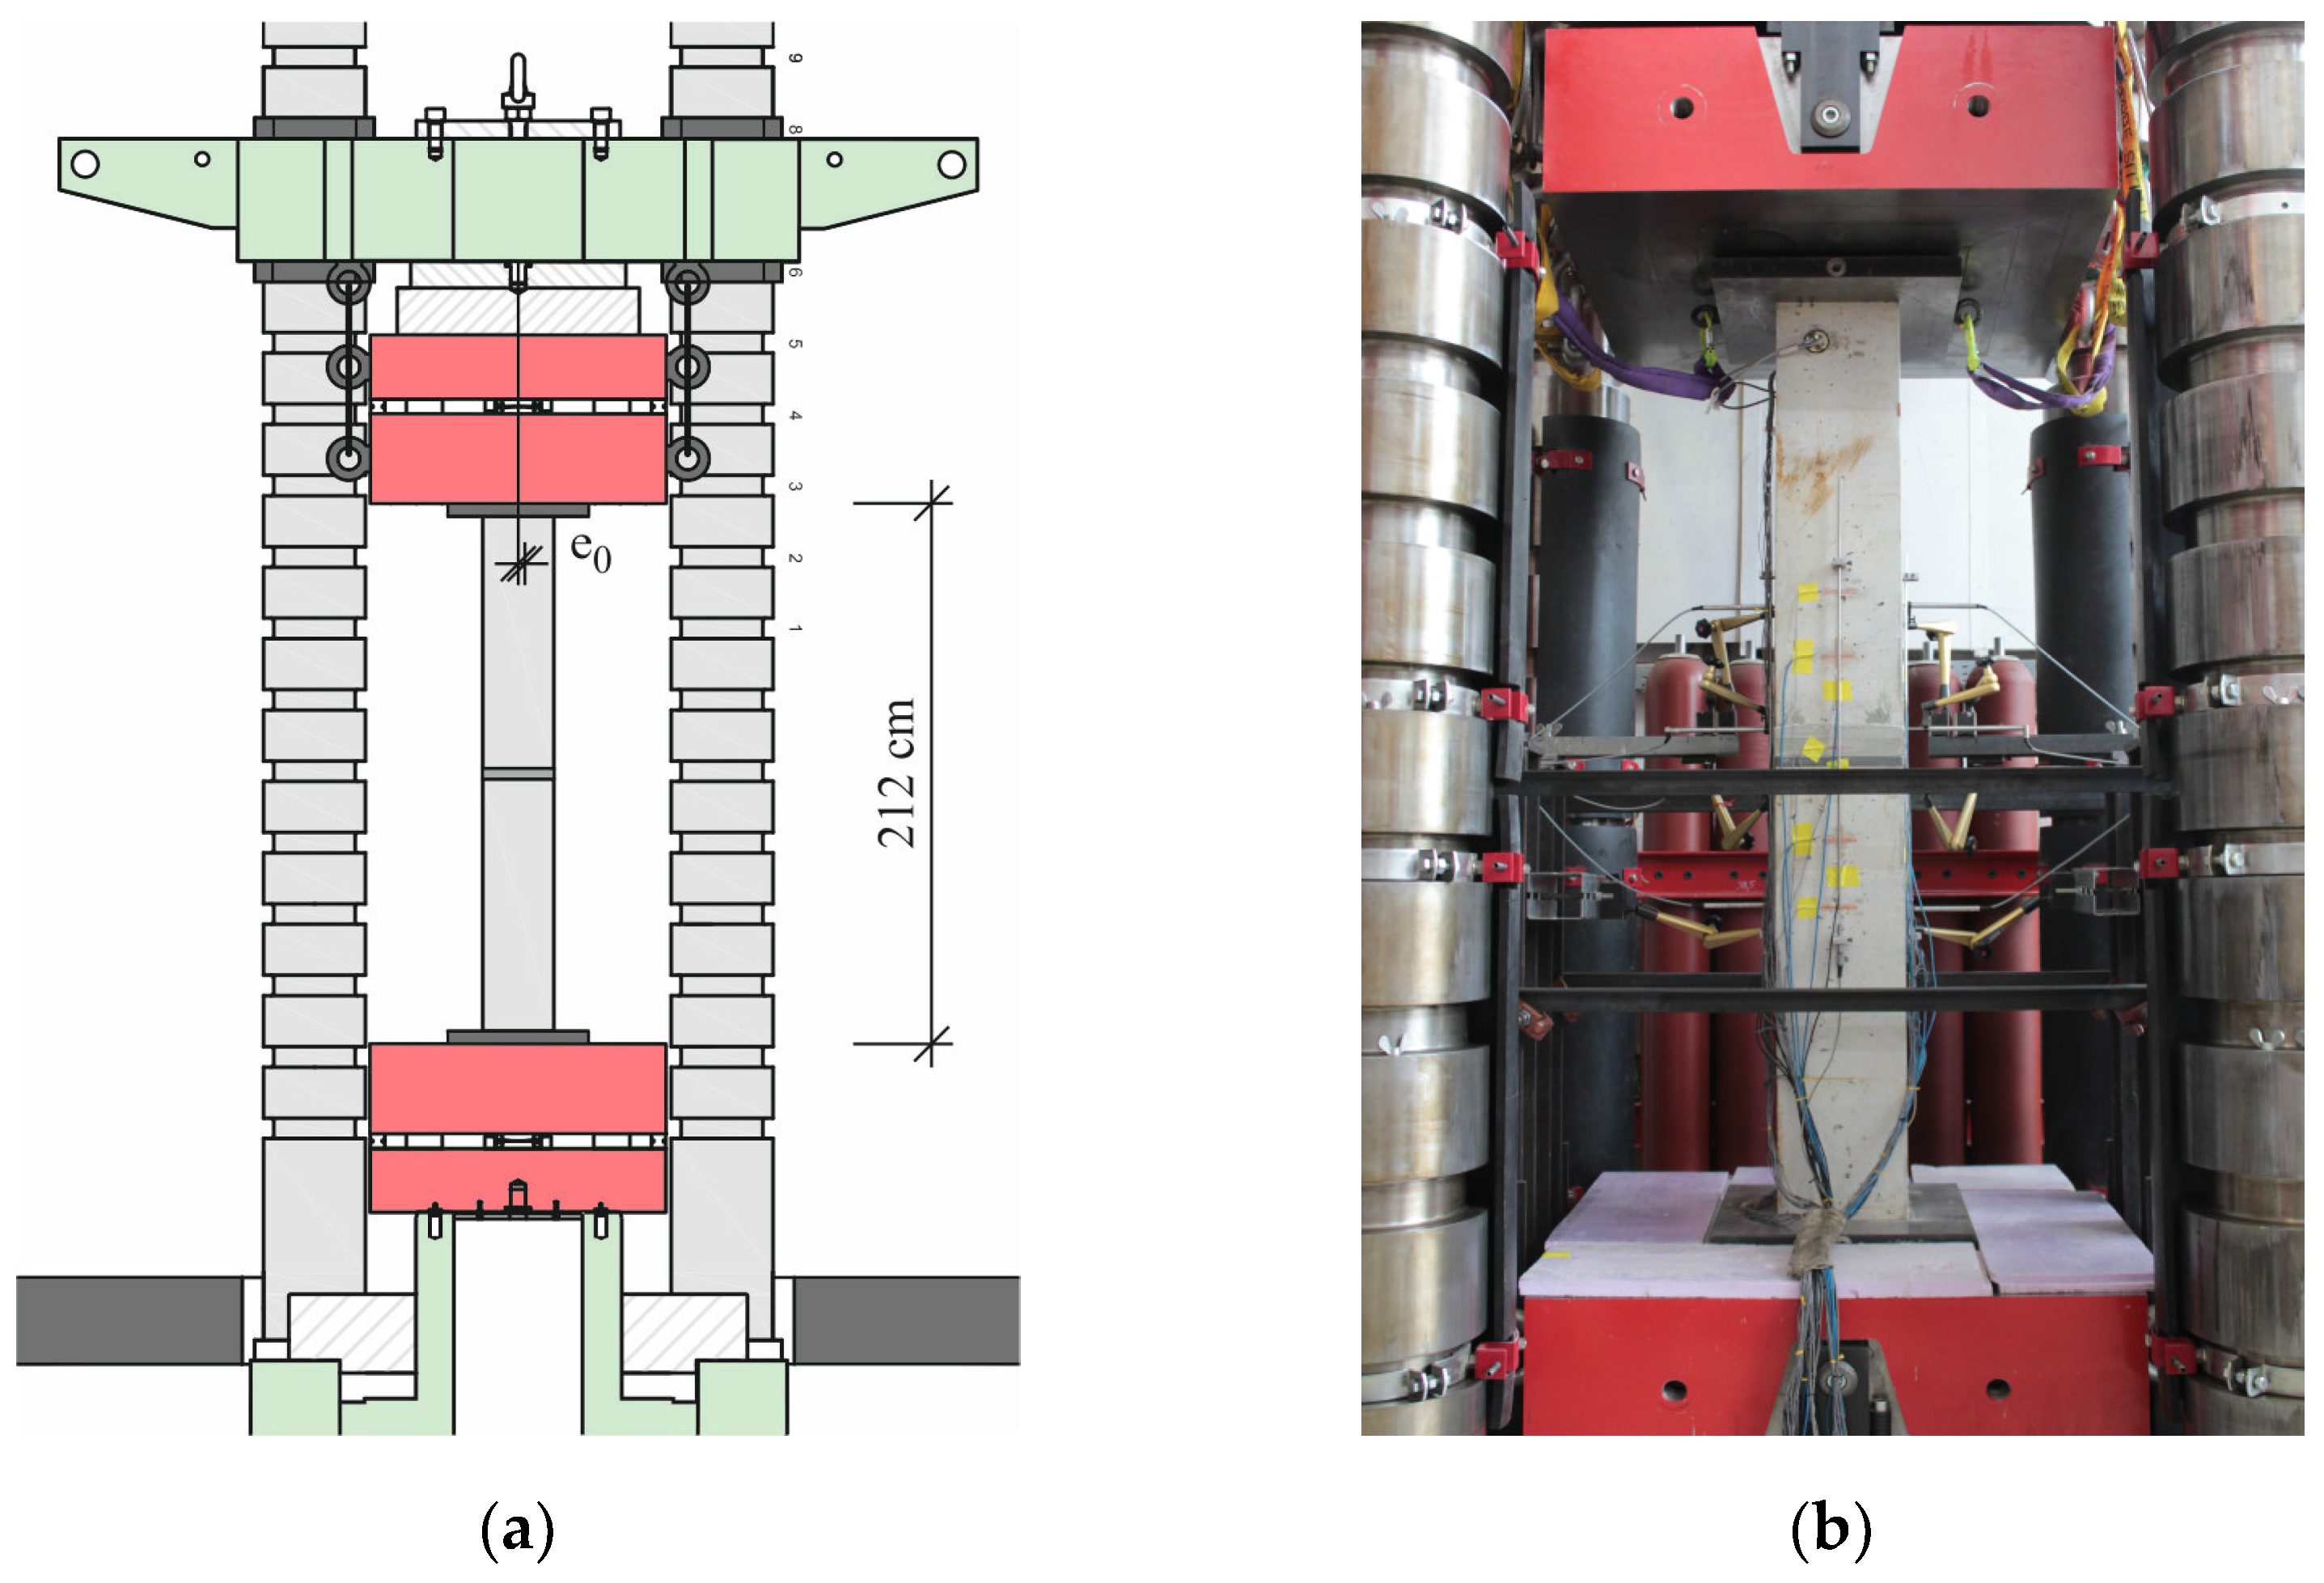
The tests were performed in a 30 MN testing machine with a low eccentricity e 0 = 10   mm and a path-controlled load application. Figure 4 shows the assembled column S 9.3 in the testing machine just before testing. Detailed information on the test specimens, experimental procedure as well as further tests on butt joints with end-face reinforcement can be found in [35,36].
The failure of the test specimens S 9.2 and S 9.3 ( ρ l = 12.8 % ) was characterised by the abrupt formation of vertical cracks as well as concrete spalling of the upper and lower column segment, respectively. While the mortar joint in S 9.2 remained more or less intact (Figure 5, left), severe spalling of the mortar and deformation of the steel plate could be observed in S 9.3 (Figure 5, middle). The formation of vertical cracks at the corners of the joint area initiated the failure of the test specimen S 9.6 ( ρ l = 25.6 % ). Subsequently, sudden spalling of the concrete cover in the corner areas of the column segments occurred. The steel plates surrounding the mortar layer deformed significantly during the failure process (Figure 5, right).
Table 2 shows the measured ultimate load values F u , exp of the large-scale tests. The calculated ultimate load F u , cal of the monolithically manufactured column is determined by nonlinear calculations taking into account the eccentricity and the concrete properties measured on concrete cylinders. The influence of different stress rates between the cylinders   σ ˙ = 0.6   N / ( mm 2 s ) and the columns σ ˙   0.1   N / ( mm 2 s ) was taken into account by reducing the concrete compressive strength with the factor 0.97 calculated according to Model Code 1990 [28]. The influence of the test specimen’s geometry was captured in a simplified way using the reduction factor 0.95 according to [38,39,40]. Component-specific effects according to [39,41] resulting from the column configuration are not taken into account in the calculation in order not to affect the influence of the joint on the one hand and to obtain an ultimate load calculation by analogy with Eurocode 2 on the other hand.
The utilisation factor η bj in Equation (2) represents the ratio of the experimental load F u , exp and calculated load F u , cal , with the latter corresponding to the ultimate load of a monolithic column.
η bj = F u , exp F u , cal
The evaluation of the reduction factor η bj shows that the ultimate load of the monolithically manufactured columns can be calculated in very good accordance. However, with η bj   <   1.00 , the jointed columns show a reduction in load-bearing capacity and a premature failure, respectively. The test results indicate that with higher longitudinal reinforcement ratios or greater mortar thicknesses, only reduced ultimate loads can be transmitted through the butt joint. For an investigation of the causes, also with regard to future specifications, research on the stress and deformation behaviour of the butt joint is essential.

4. Deformation of the Steel Plate

4.1. Experimental Findings

As part of the large-scale component tests, intensive evaluations were carried out on the deformations in the region of the butt joint. First, the visible deformations of the steel plates are presented (Figure 6a), which were detached manually from the columns after conducting the tests and sandblasted to remove mortar and concrete residues. Subsequently, all steel plates were analysed with the 3D laser scanner GOM Scan 1 of Carl Zeiss GOM Metrology (Figure 6b). While Figure 6c shows the corresponding deformations of the lower steel plate of S 9.3, Figure 7 shows the deformations of the upper steel plate of S 9.2 and the lower steel plate of S 9.6.
Figure 6 and Figure 7 clearly display indentations of the longitudinal bars into the steel plate as well as bended edges in the area of the spalled concrete cover. The asymmetric deformation is caused by the eccentric load application in the large-scale tests (see Section 3). The indentations into the steel plates correspond to the post-cracking stage and therefore vary, nevertheless giving a good impression of the scale of the indentations. For the lower steel plate of S 9.3, for example, a maximum indentation of 4.5 mm can be observed.
Since only one side of the jointed column has failed in the tests S 9.2 and S 9.3, the nearly intact column ends can be used to estimate the deformations approximately at the point of ultimate load. Figure 8 and Figure 9 show the evaluations of 3D laser scan measurements for these two respective steel plates. The deformation is analysed in a cross-sectional cut around the bearing point of a highly stressed longitudinal bar. An excerpted detail reveals the indentations of the longitudinal bars into the steel plates.
The evaluations show a maximum indentation of about 0.07 mm for the lower steel plate of S 9.2 and an indentation of about 0.28 mm for the upper steel plate of S 9.3. The difference between these values possibly represents the influence of the mortar thickness in the butt joint, as the size of the mortar layer is the most important distinction between the test setups S 9.2 und S 9.3. In the following, numerical analyses are presented examining the correlation between mortar thickness and indentations of rebars into the steel plates in detail.

4.2. Numerical Investigations

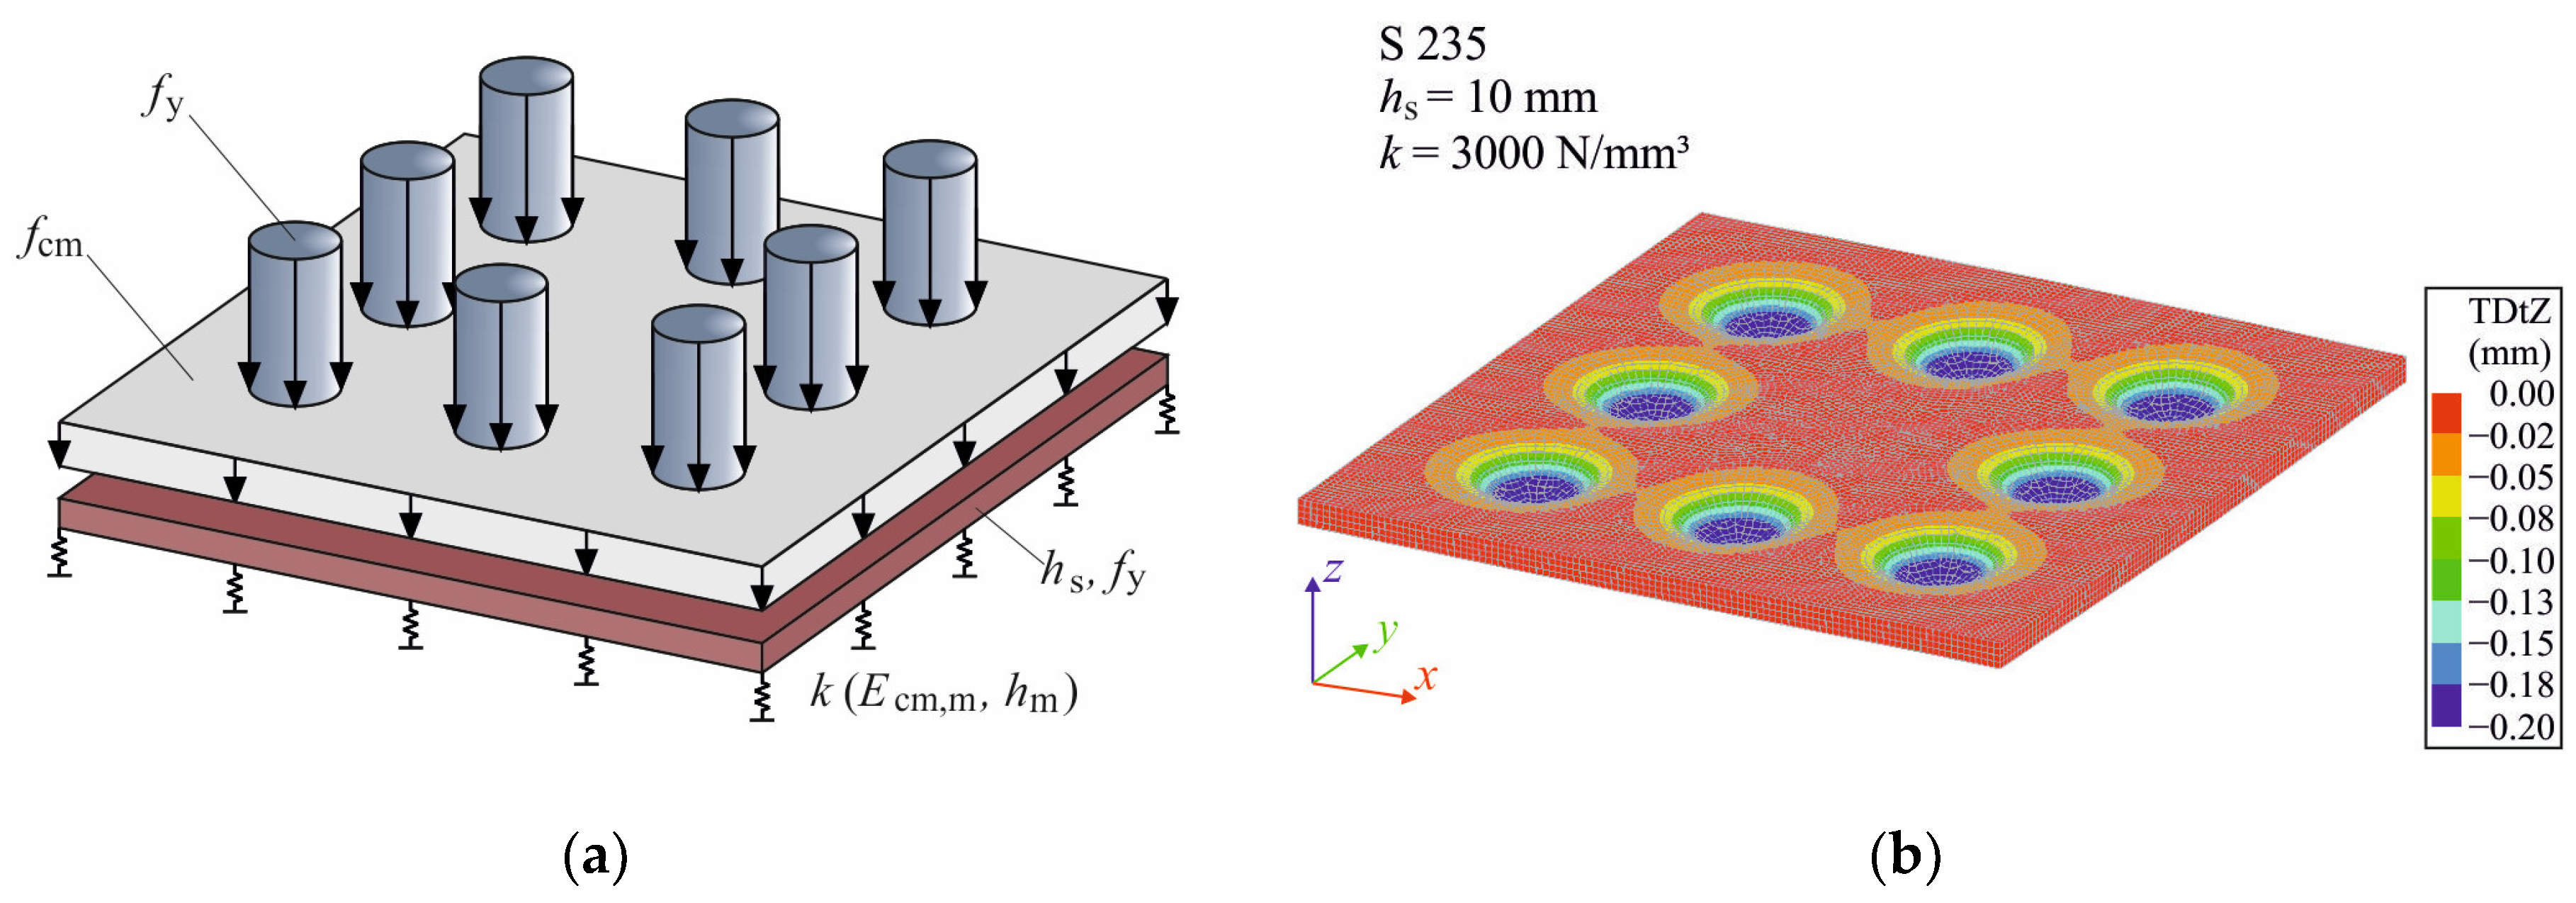
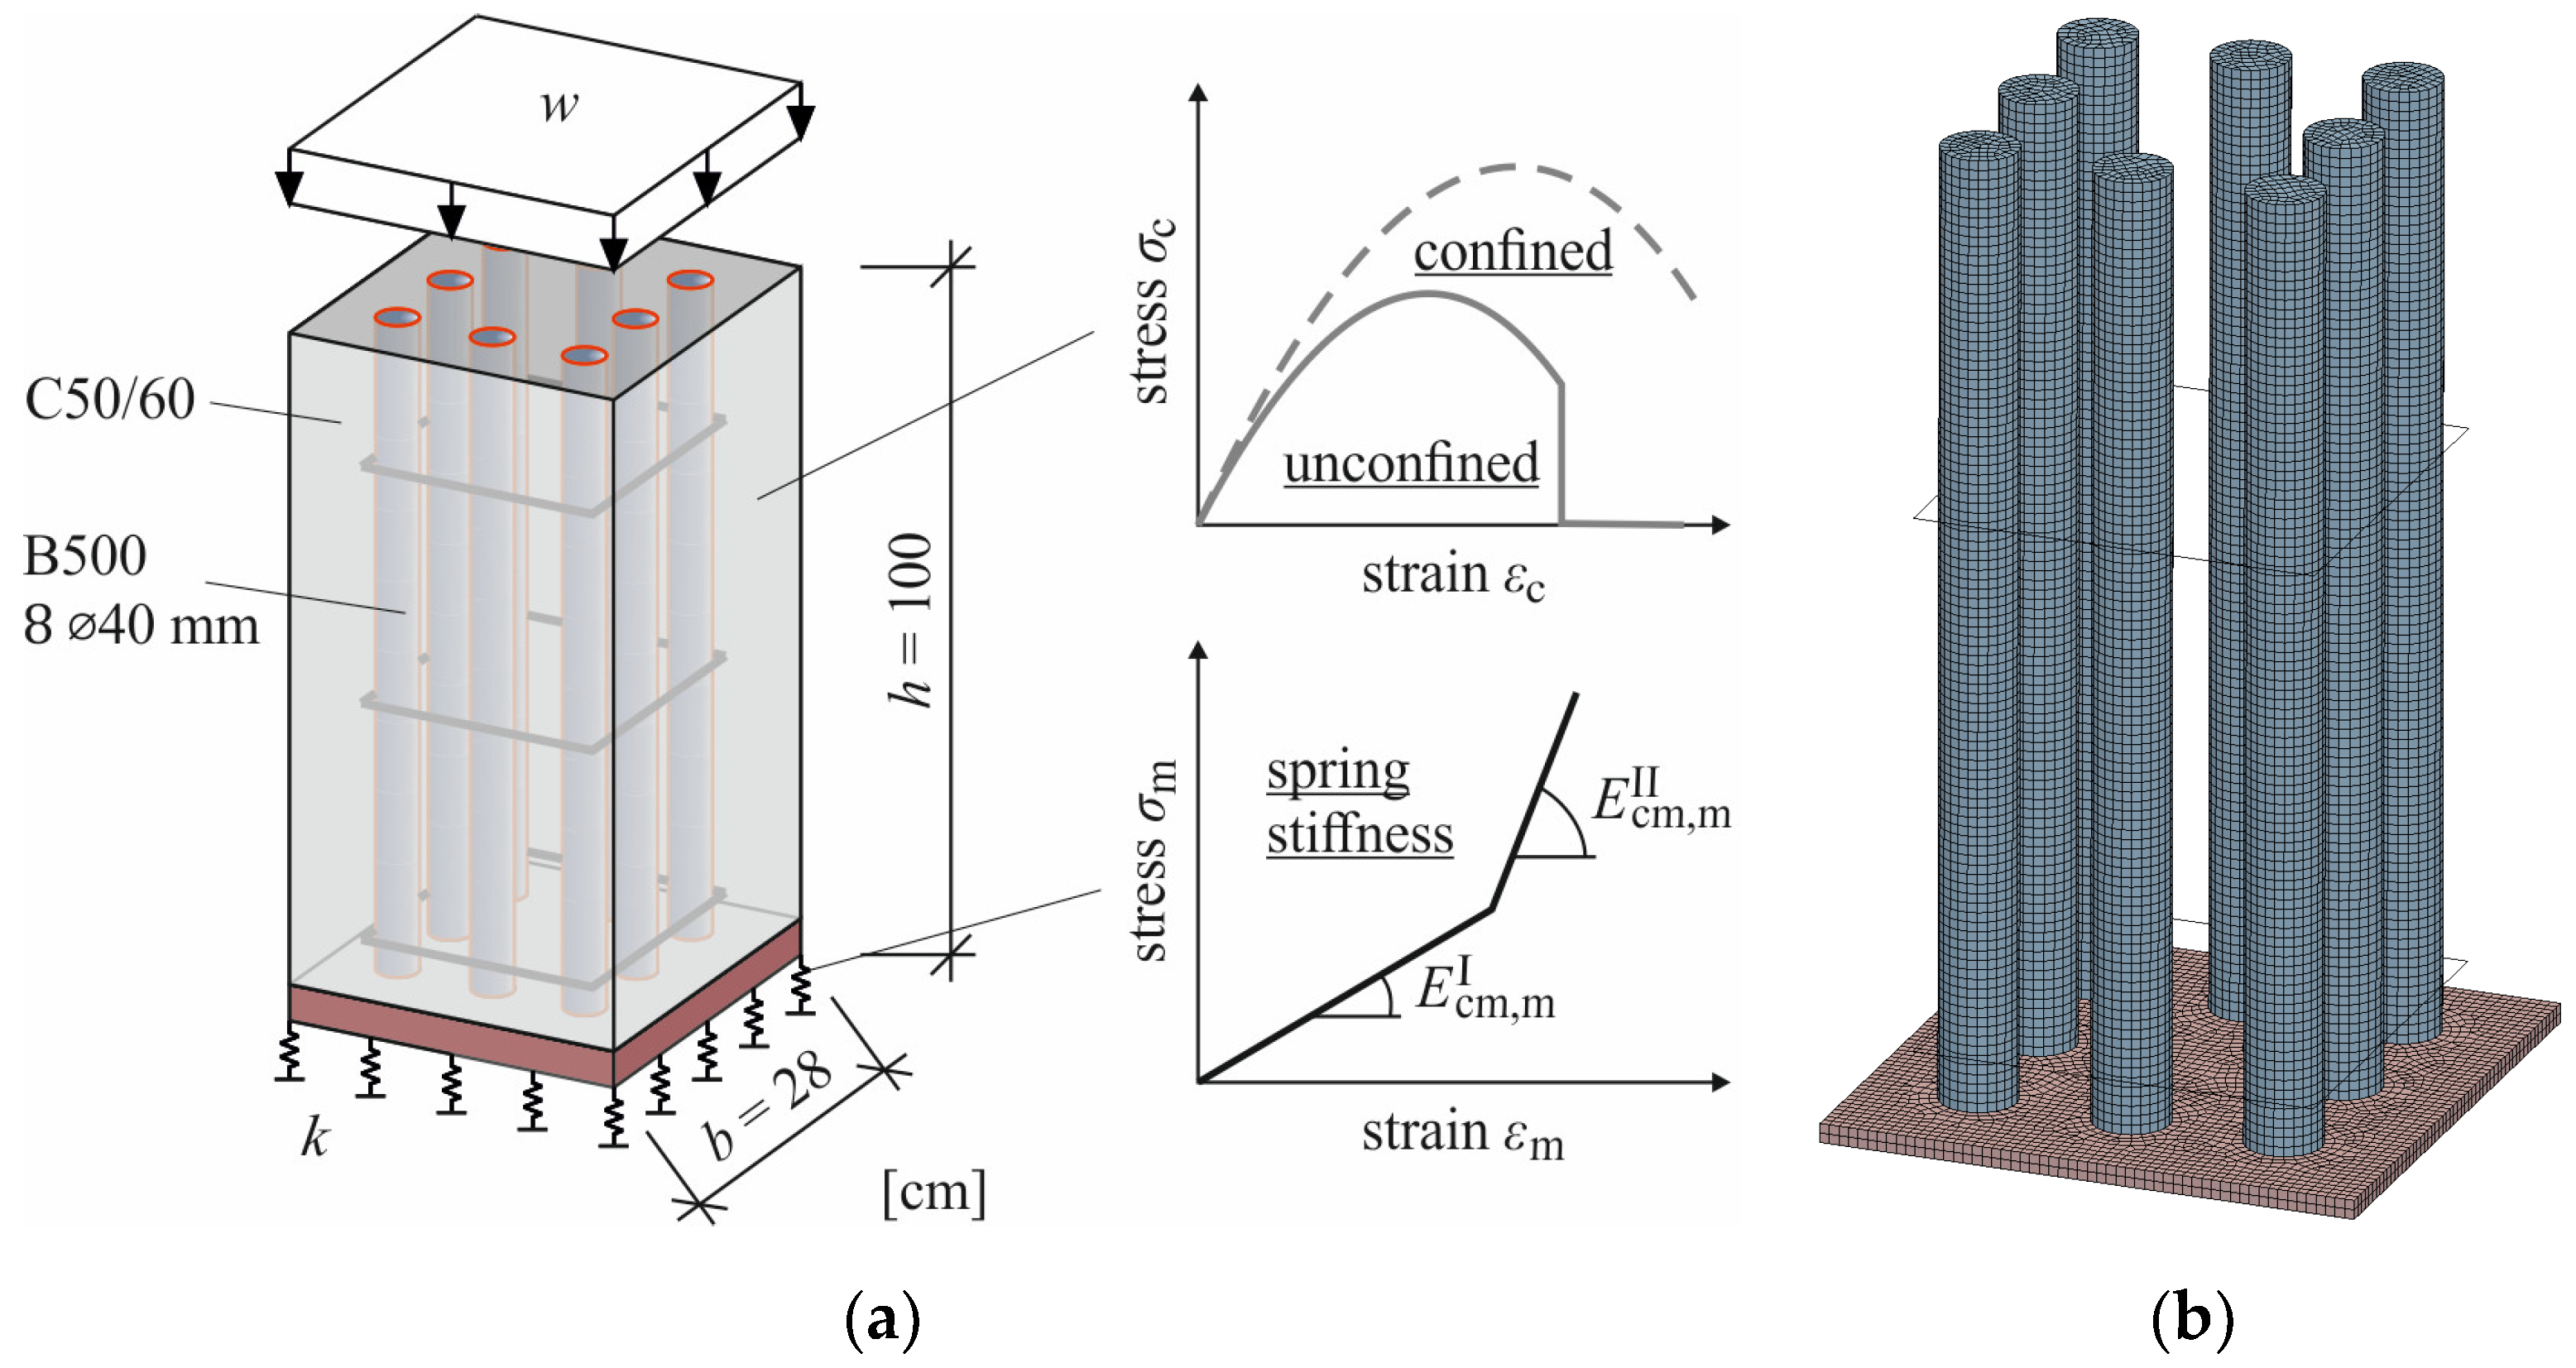
A three-dimensional finite element (FE) model evaluated with the software Diana FEA version 10.6 [42] shown in Figure 10a is used to approximate the indentations into the steel plates numerically. The model describes the load-deformation behaviour of a steel plate with continuous elastic spring support and non-uniformly distributed loading. The surface load covers the mean concrete compressive strength f cm and the yield strength of the longitudinal reinforcement f y within discrete areas. An eccentric load application in analogy to the tests is omitted in the numerical investigations for simplification. The spring stiffness k = E cm , m / h m / 2 of the two-dimensional elastic support represents the compressed mortar layer within the butt joint. The steel plate is modelled with ideal elastic–plastic material behaviour. The side length of the steel plate a = 28   cm , the concrete compressive strength class C50/60 and the steel grade B500 are implemented from the component tests.
The discretisation of the steel plate is realised with eight-node isoparametric solid brick elements with an average side length of 2.5 mm. The force-controlled load application induces deformations within 25 uniform load steps. The Newton–Raphson method is used for the iteration procedure in association with convergence criteria regarding the balance of forces and displacements, as well as a maximum number of iterations n = 20 .
Figure 11 (left) shows the indentations into the steel plate depending on the mortar thickness determined by numerical simulations. In addition, the grade and the thickness of the steel plate are varied. The resulting diagram in Figure 11 (left) displays the influence of all three parameters. The indentations of rebars into the steel plate are reduced with decreasing mortar thickness. The same context applies for increasing thickness of steel plates and increasing steel grades. As a complementary output of the parameter studies, Figure 11 (right) reveals that an increase of the steel force in the longitudinal reinforcement using larger bar diameters or higher steel strength leads to greater indentations. The solid grey line shows that the combination of high-strength reinforcing steel with diameters ϕ l   >   32   mm and a steel plate S235 with h s = 10   mm results in a type of disproportionate failure mode.
The experimentally determined indentations (see Figure 8 and Figure 9) are slightly smaller than the values from the FE simulation since premature failure occurred in the tests and neither the concrete compressive strength nor the steel yield strength were reached across the whole cross-sectional area. Another reason for the numerical overestimation is the elastic modelling of the mortar support. In reality, the mortar voids compact simultaneously, increasing the stiffness of the mortar with growing deformation. Nevertheless, the model provides an insight into the main influences on the indentations into the steel plate, which are the amount of applied peak pressure as well as the resistance of the mortar layer and of the steel plate itself.

5. Stress Redistribution in Column End Regions

5.1. Experimental Findings

The indentations of the longitudinal rebars into the steel plate investigated in Section 4 lead to relative displacements between concrete and steel. Such relative displacements activate bond stresses and therefore stress redistributions from the longitudinal reinforcement to the surrounding concrete.
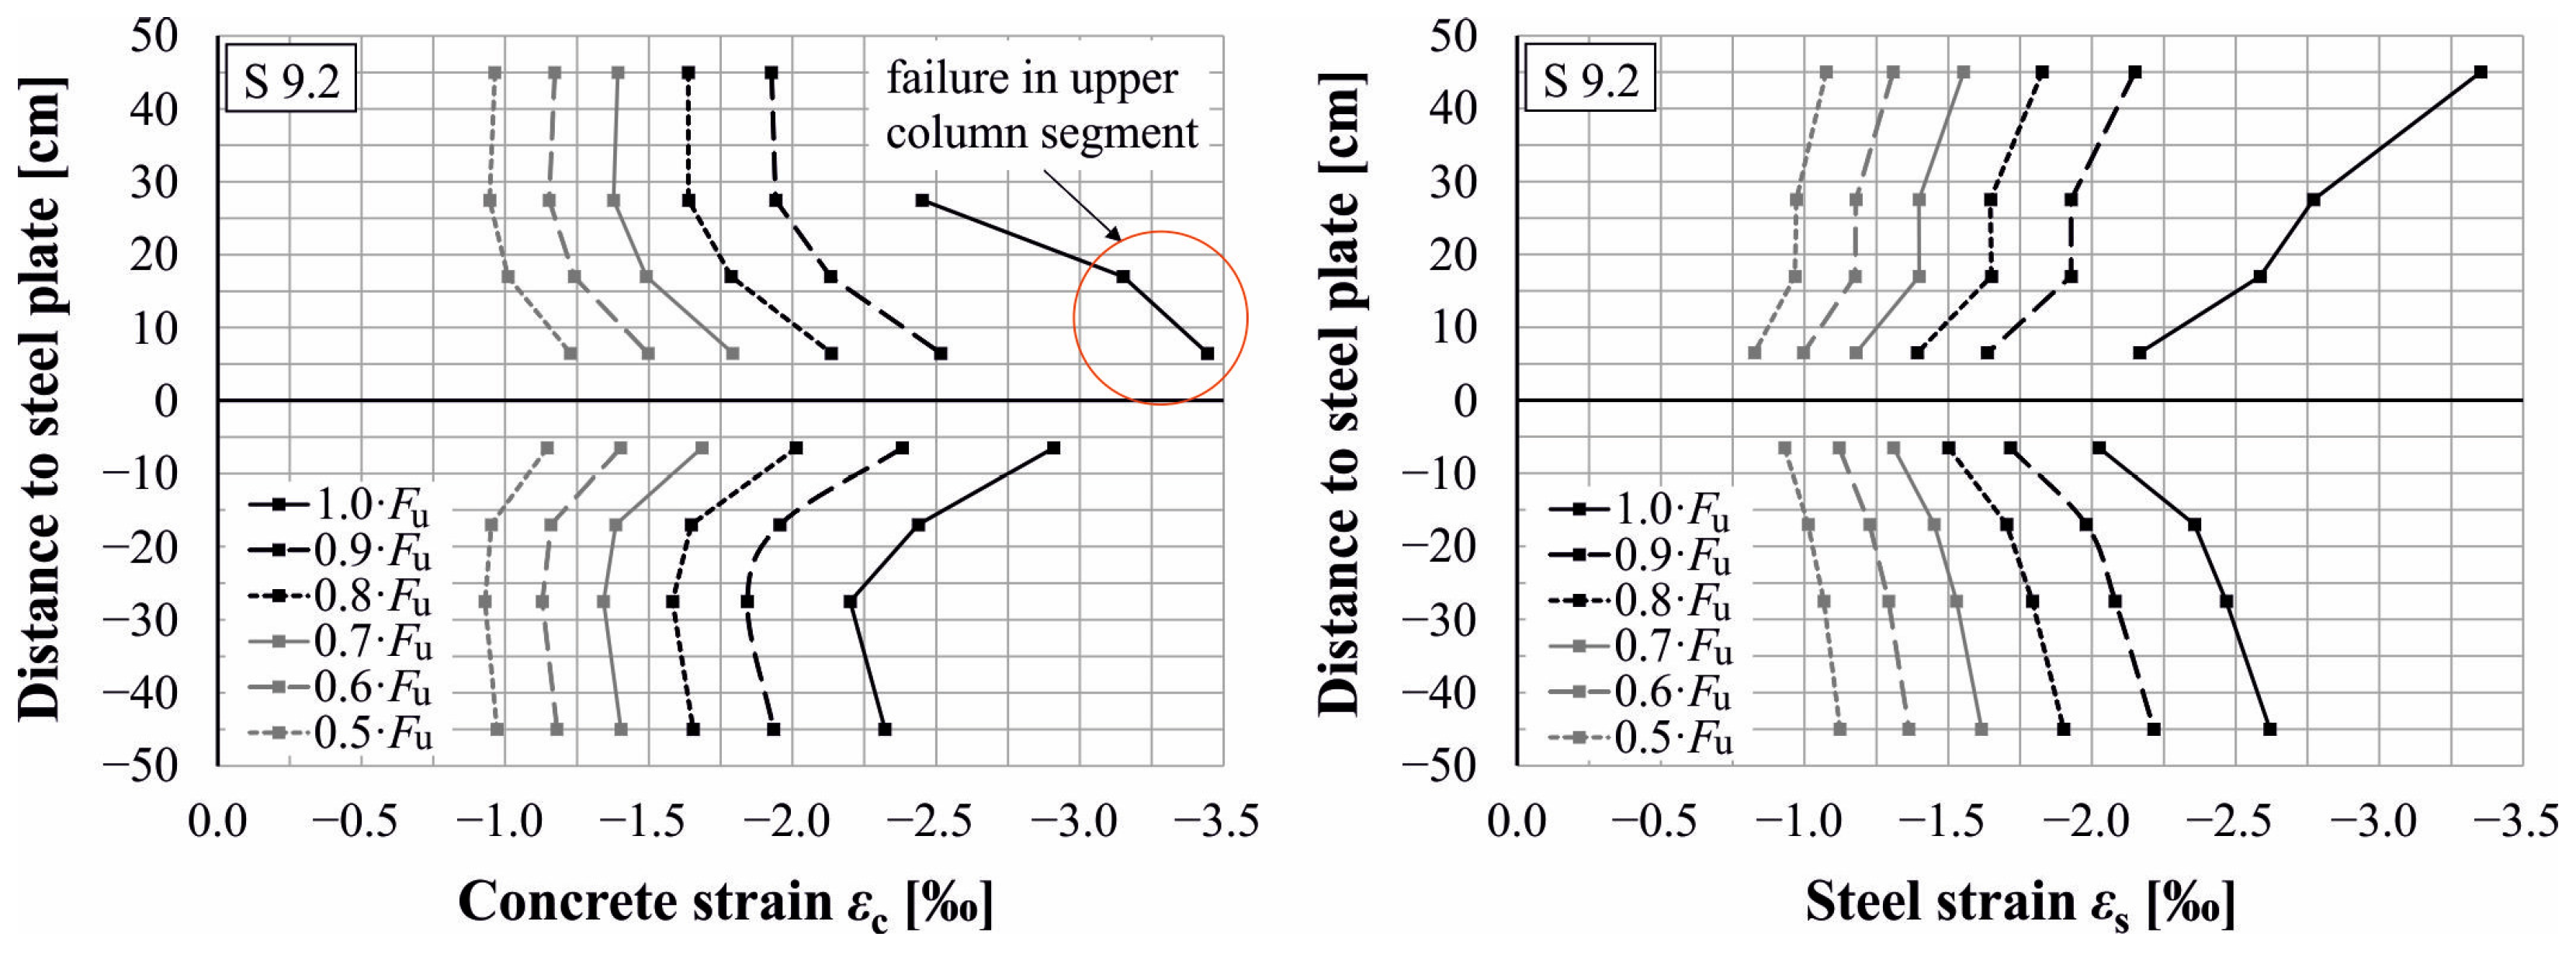
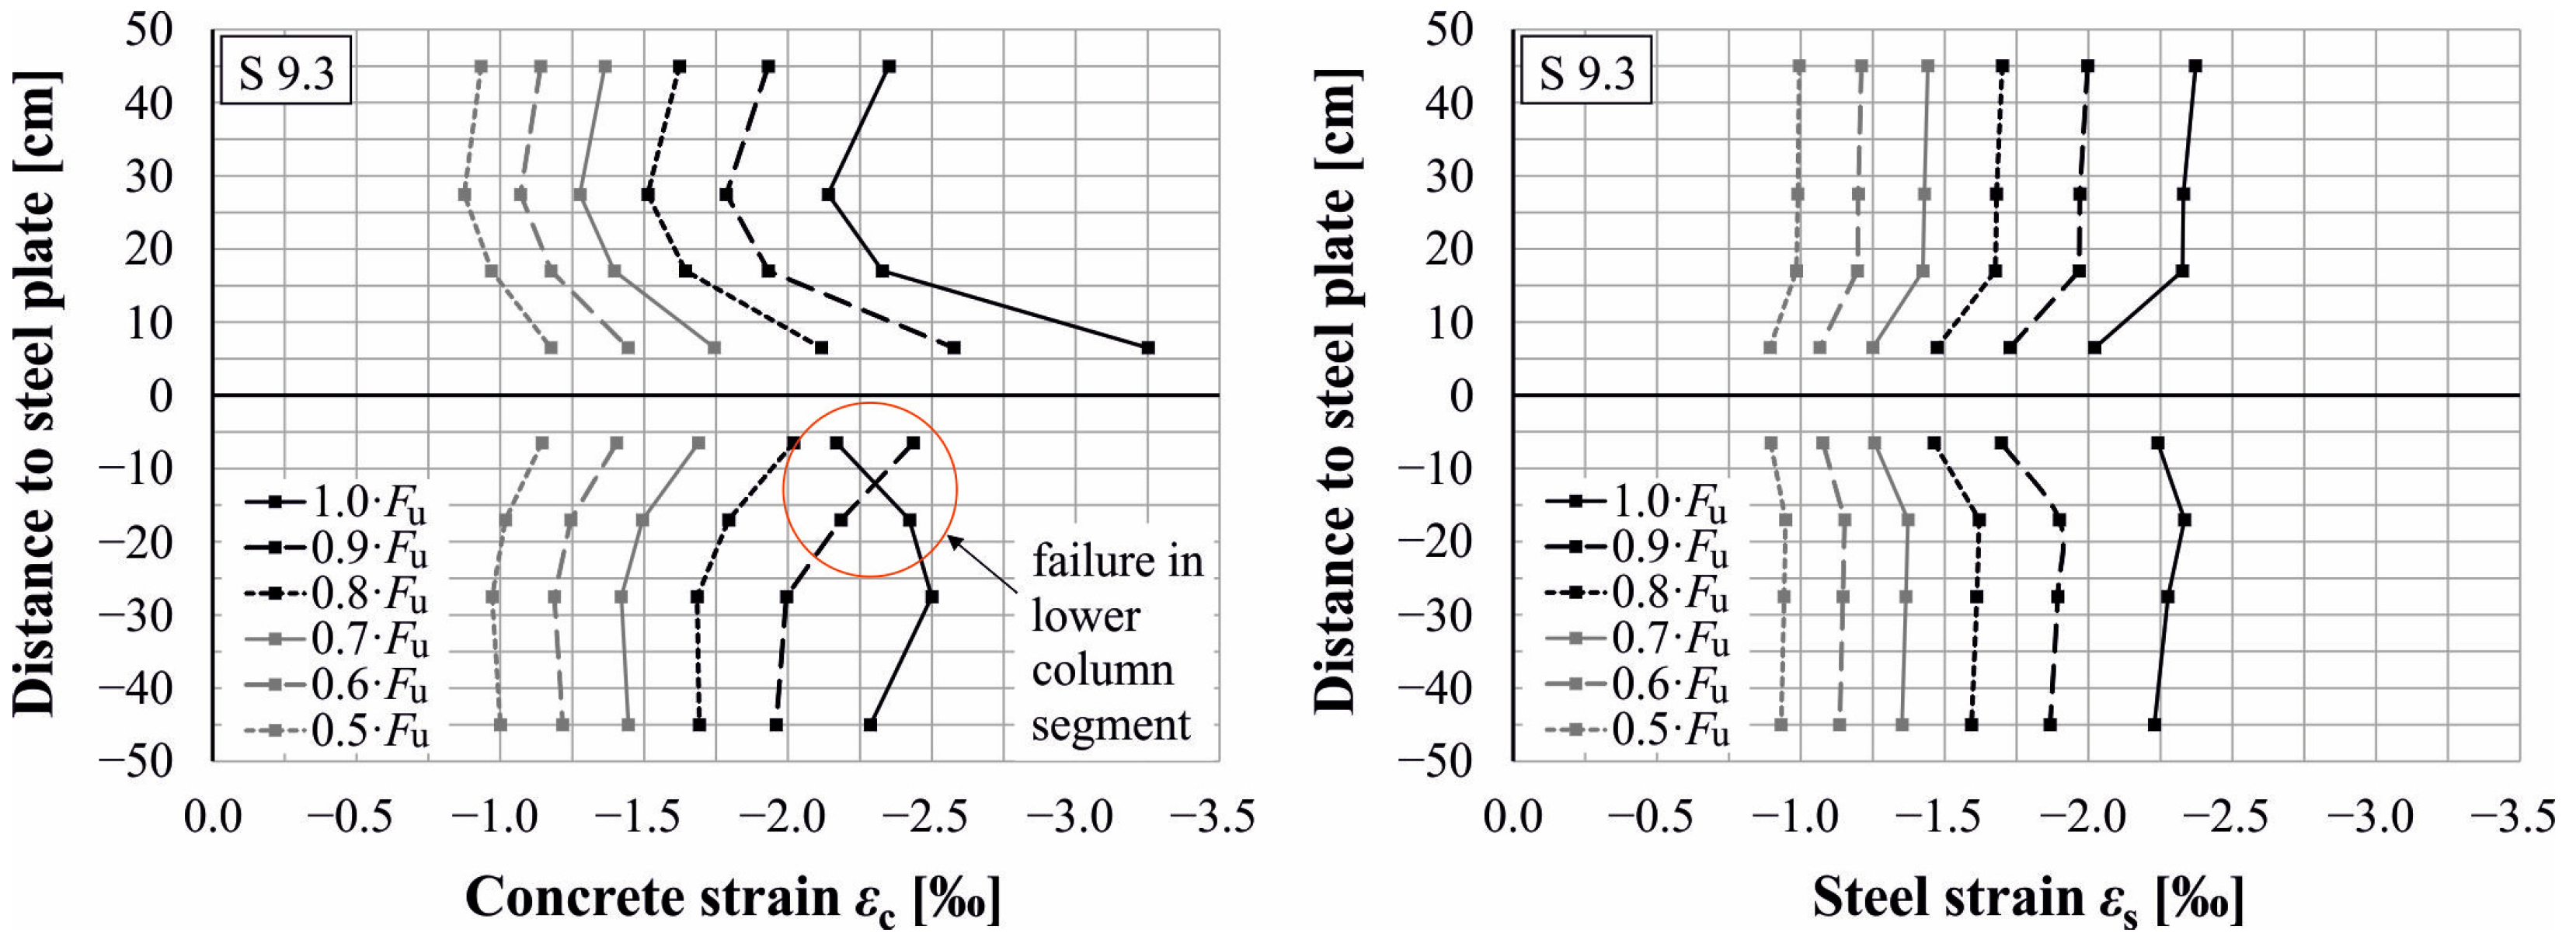
Figure 12 and Figure 13 show the evaluations of the strain gauges attached on the longitudinal reinforcement and on the concrete cover for the tests S 9.2 and S 9.3, respectively, along the column axis and over the course of the test regime, up to reaching the ultimate load. The locations of the strain measurements are indicated in Figure 3.
Figure 12 (left) reveals that the compressive strains in the concrete cover increase continuously along the column towards the butt joint. Figure 12 (right) shows that the steel strains decrease accordingly. The redistribution of compressive stresses parallel to the bar axis becomes visible starting at a distance of about 25 cm apart from the steel plates. The ultimate compressive concrete strain can be calculated according to EC2 [23] using the formulation ε c 1 = 0.7     f cm 0.31 resulting in 2.52 for S 9.2. In the upper column segment, the compressive strain in the concrete cover reaches the ultimate strain of the concrete ε c 1 at about 90% of the ultimate load. Failure occurs above the butt joint due to exceeding the concrete compressive strength and spalling of the concrete cover.
The steel strains in Figure 12 (right) display that the yield strain R p , 0.2 / E s = 592   N / mm 2 / 200,000   N / mm 2 = 2.96 is not reached before the ultimate load. Only one strain gauge in the failing upper column segment denotes the yield strength according to the spalling of the concrete cover.
Figure 13 shows the concrete and steel strains for S 9.3 with an increased mortar thickness of h m = 40   mm . In this test, failure of the concrete cover occurs in the lower column segment. Furthermore, the measurements indicate that the ultimate compressive concrete strain is also exceeded in the upper column segment.
The diagrams confirm the hypothesis of time-independent stress redistributions from the steel to the concrete due to indentations of steel bars into the steel plate. The absorption of additional compressive stress leads to premature overloading and spalling of the concrete cover initiating the failure of the butt-jointed column. The tested columns therefore did not reach the anticipated ultimate load of monolithically manufactured columns.

5.2. Confinement

The concrete core is confined by transverse reinforcement. The load-bearing effect of confinement can be estimated using the strain gauges at the measuring points on the stirrups shown in Figure 3. The highest strain is obtained in the stirrups arranged 3.0   cm above and below the steel plate, respectively. In the upper column segment, strains of ε S 9.2 = 0.53 , ε S 9.3 = 0.37 and ε S 9.6 = 0.59 were measured for these stirrups. Assuming an ideal elastic–plastic stress–strain material behaviour for the steel stirrups, the corresponding tensile stresses result in σ sw , u , S   9.2 = 106   N / mm 2 , σ sw , u , S   9.3 = 74   N / mm 2 and σ sw , u , S   9.6 = 118   N / mm 2 .
Exemplarily, the increase of the concrete compressive strength in the column core is calculated for S 9.2. According to Equation (3), the stirrup stress σ sw , u , S   9.2 = 106   N / mm 2 leads to a confinement stress σ 2 = σ 3 [43].
σ 2 = 2     A s , w     σ sw , u b 0     0.5 s w + 30   mm = 2     78.5   mm 2     106   N / mm 2 220   mm     0.5 280   mm + 30   mm = 0.49   N / mm 2
For transverse compressive stresses σ 2     0.05     f cm , Equation (4) can be applied to determine the multiaxial concrete compressive strength f cm , c according to Eurocode 2 [23]. As a result, for f cm = 62.5   N / mm 2 , the multiaxial concrete compressive strength f cm , c in the column core results in f cm , c = 1.04     f cm = 65.0   N / mm 2 according to Equation (4).
f cm , c f cm = 1.0 + 5.0   σ 2 f cm = 1.0 + 5.0     0.49   N / mm 2 62.5   N / mm 2 = 1.04
The estimation of the compressive state due to confinement reveals that the chosen transverse reinforcement does not lead to a significant increase of the concrete compressive strength within the column core. Hence, in the following numerical investigations, the confinement effect is neglected for simplification. Further studies featuring closer stirrup spacing might be useful to achieve substantial confinement effects.

5.3. Numerical Investigations

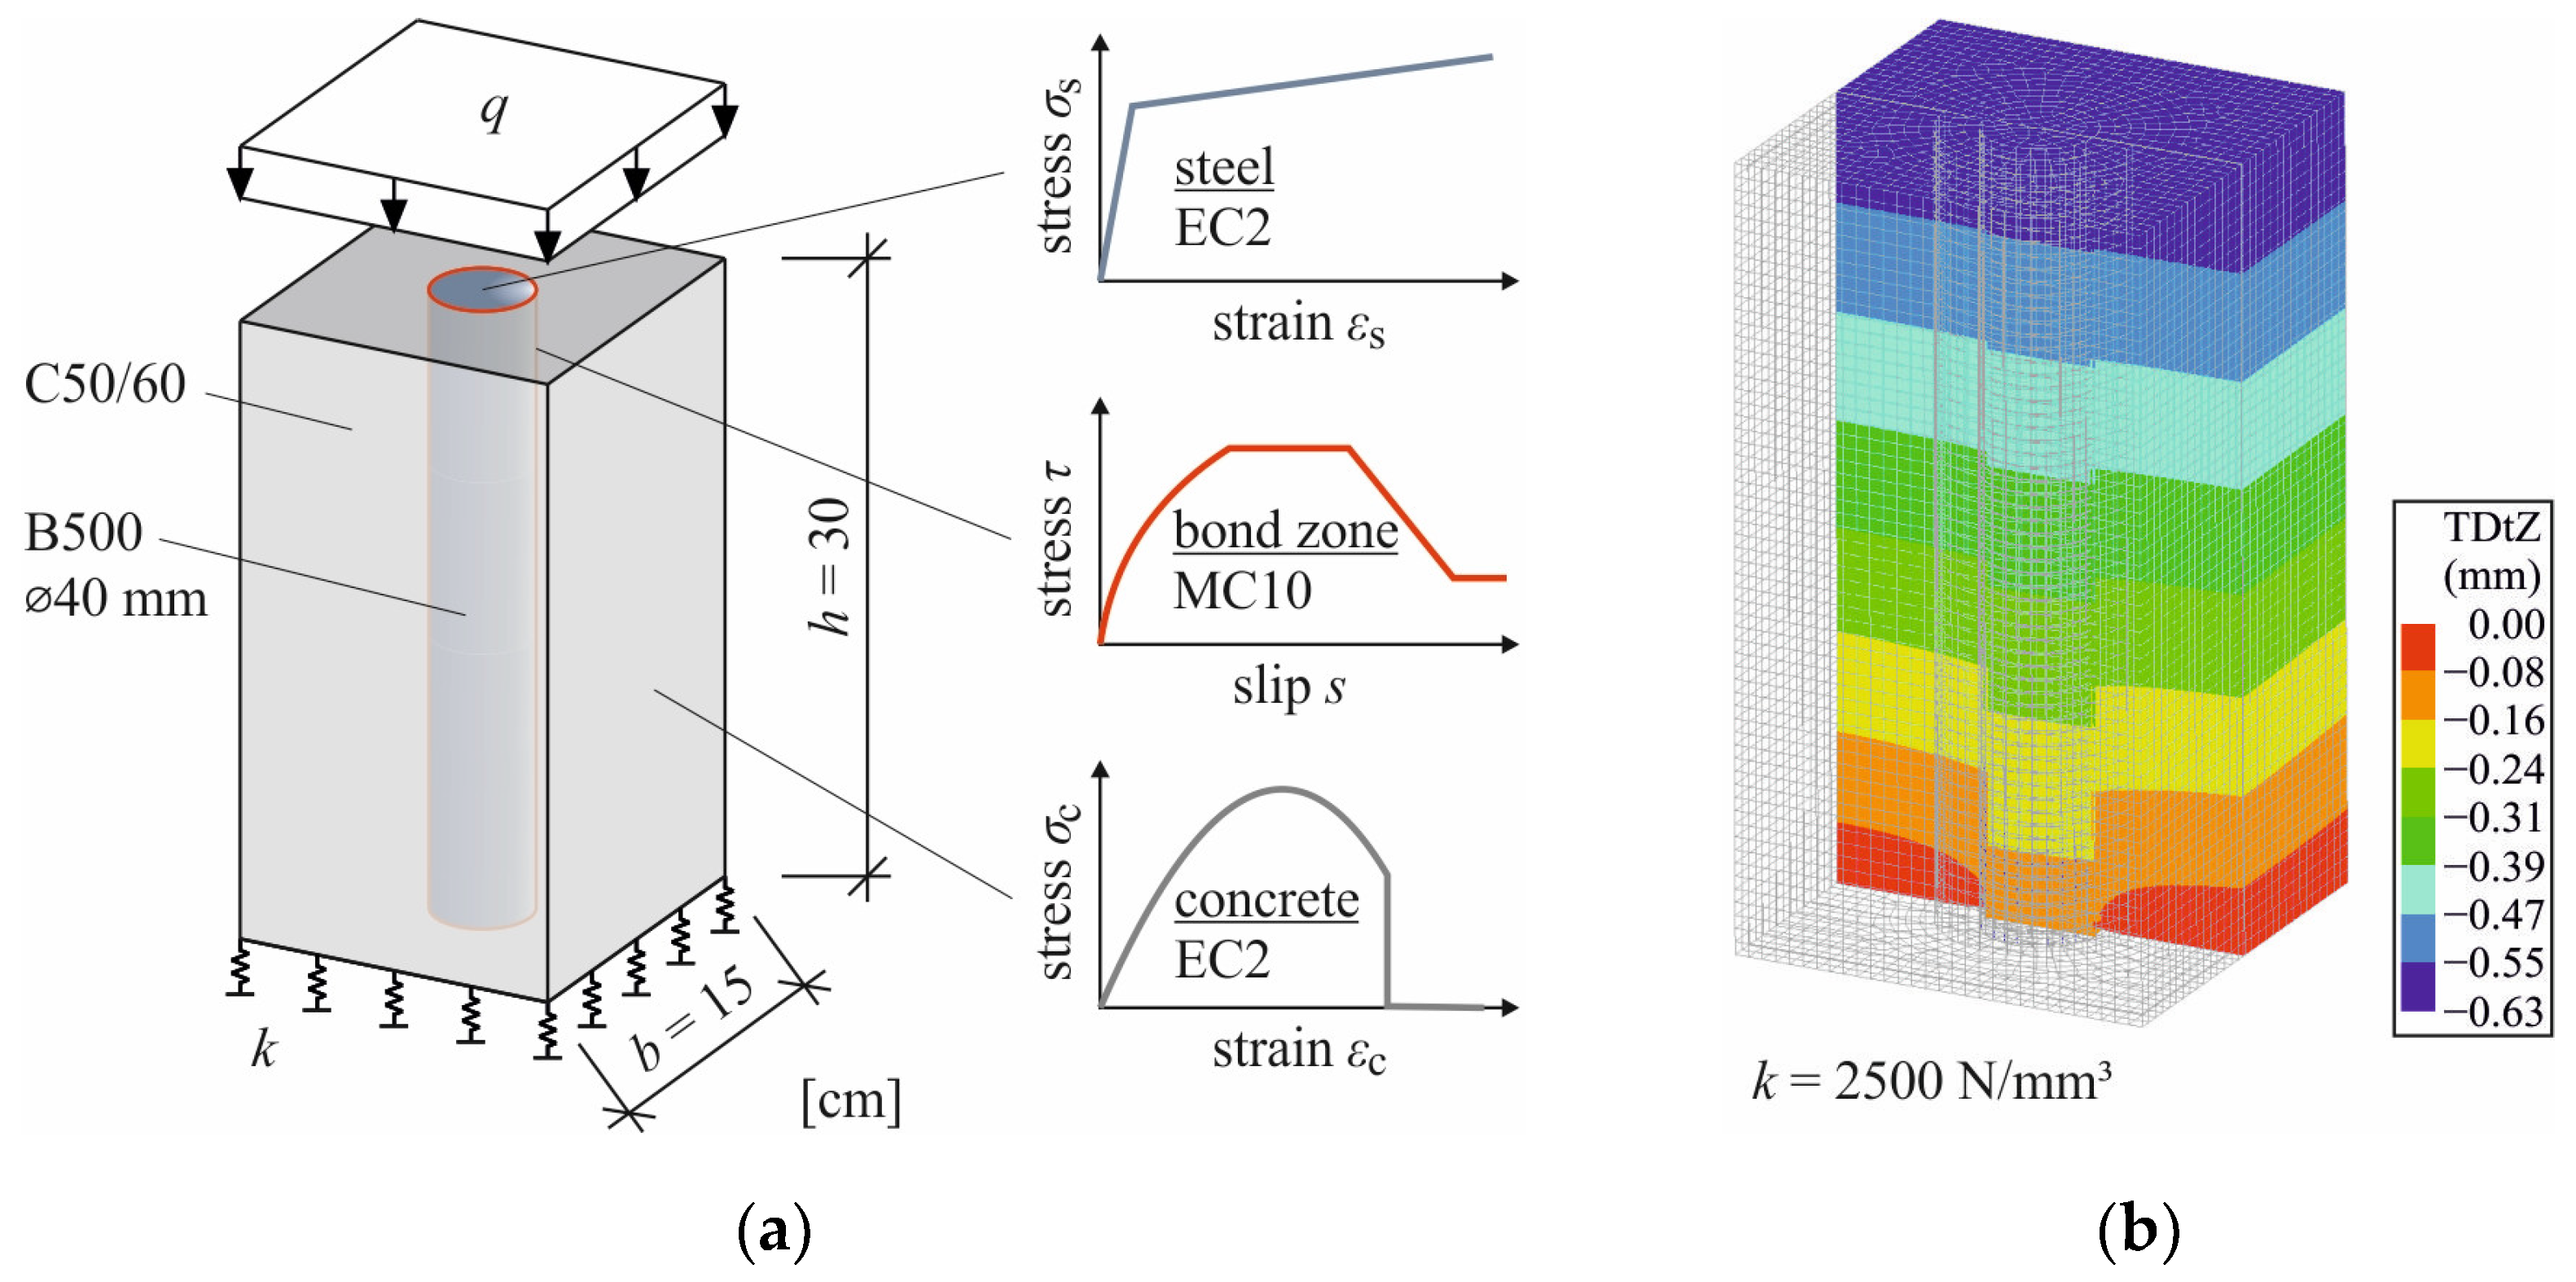
In order to obtain more detailed knowledge about the failure modes of butt-jointed columns, the time-independent redistribution of compressive stresses due to the activation of bond stresses above and below the butt joint is analysed numerically. Figure 14a represents the three-dimensional FE model, which is a rectangular concrete prism with a height of h = 30   cm and a single embedded reinforcement bar ϕ l = 40   mm resolved discretely. In agreement with the experimental large-scale tests described in Section 3, the material properties of concrete C50/60 and reinforcing steel B500 are taken into consideration. The material behaviour of the longitudinal reinforcement is described using a von Mises yield criterion enhanced with strain-hardening behaviour. The performance of the surrounding concrete is modelled using the Total Strain Based Crack Model from the Diana FEA library [42]. The uniaxial stress–strain relationship for structural analyses according to Eurocode 2 approaches the compressive behaviour of the concrete matrix [23]. Additionally, tensile stresses are limited with the help of a yield criterion preventing premature failure in the region of geometrical and physical discontinuity. The bond zone between the longitudinal rebar and the concrete is discretised with zero-thickness interface elements. For the description of its material behaviour, the bond model from Model Code 2010 is applied [44].
Both the steel bar and the concrete matrix are discretised with an average element side length of e = 5.0   mm . Isoparametric CHX60 elements with 20 nodes are applied. The discretisation of the interface is realised with square Q24IF elements with eight nodes, i.e., four nodes per face. The upper surface of the prism is loaded by applying a uniformly distributed stress q. The linear-elastic spring support at the bottom of the setup is characterised by spring stiffness k. The configuration of the model is summarised in Figure 14a. General simulation settings agree with the previously presented numerical analyses of steel plates in Section 4.2.
Figure 14b shows the vertical displacement w of a cuboid specimen with a spring support k = 2500   N / mm 3 as a coloured concentric section-cut with superelevated deformations. The incrementally increased loading is bounded by the compressive failure of the concrete, induced by unavailable convergence of the nonlinear iterative solution. The relative displacement between the longitudinal rebar and the surrounding concrete is clearly visible and increases towards the butt joint.
Figure 15a depicts the tangential bond stresses in the bond zone parallel to the loading direction. With a spring stiffness k = 2500   N / mm 3 , a maximum bond stress of τ     6.20   N / mm 2 is generated, which is significantly below τ bmax = 2.5     58   N / mm 2   = 19.04   N / mm 2 for good bond conditions or τ bmax = 1.25     58   N / mm 2 = 9.52   N / mm 2 for all other bond conditions proposed in Model Code 2010 [44]. The diagrams in Figure 15b show the distribution of corresponding concrete and steel stresses in vertical z-direction evaluated in the axis of the rebar and at the edge of the matrix, respectively, over the prism’s height. In accordance with Figure 12 and Figure 13, there is a downward increase of concrete stresses and a stress decrease within the longitudinal rebar. Furthermore, the expected load capacity of the specimen due to superposition of load-bearing parts cannot be reached due to the premature failure of the concrete immediately above the support. In line with this, the steel bar only reaches stresses of a maximum of σ s = 370   N / mm 2 .
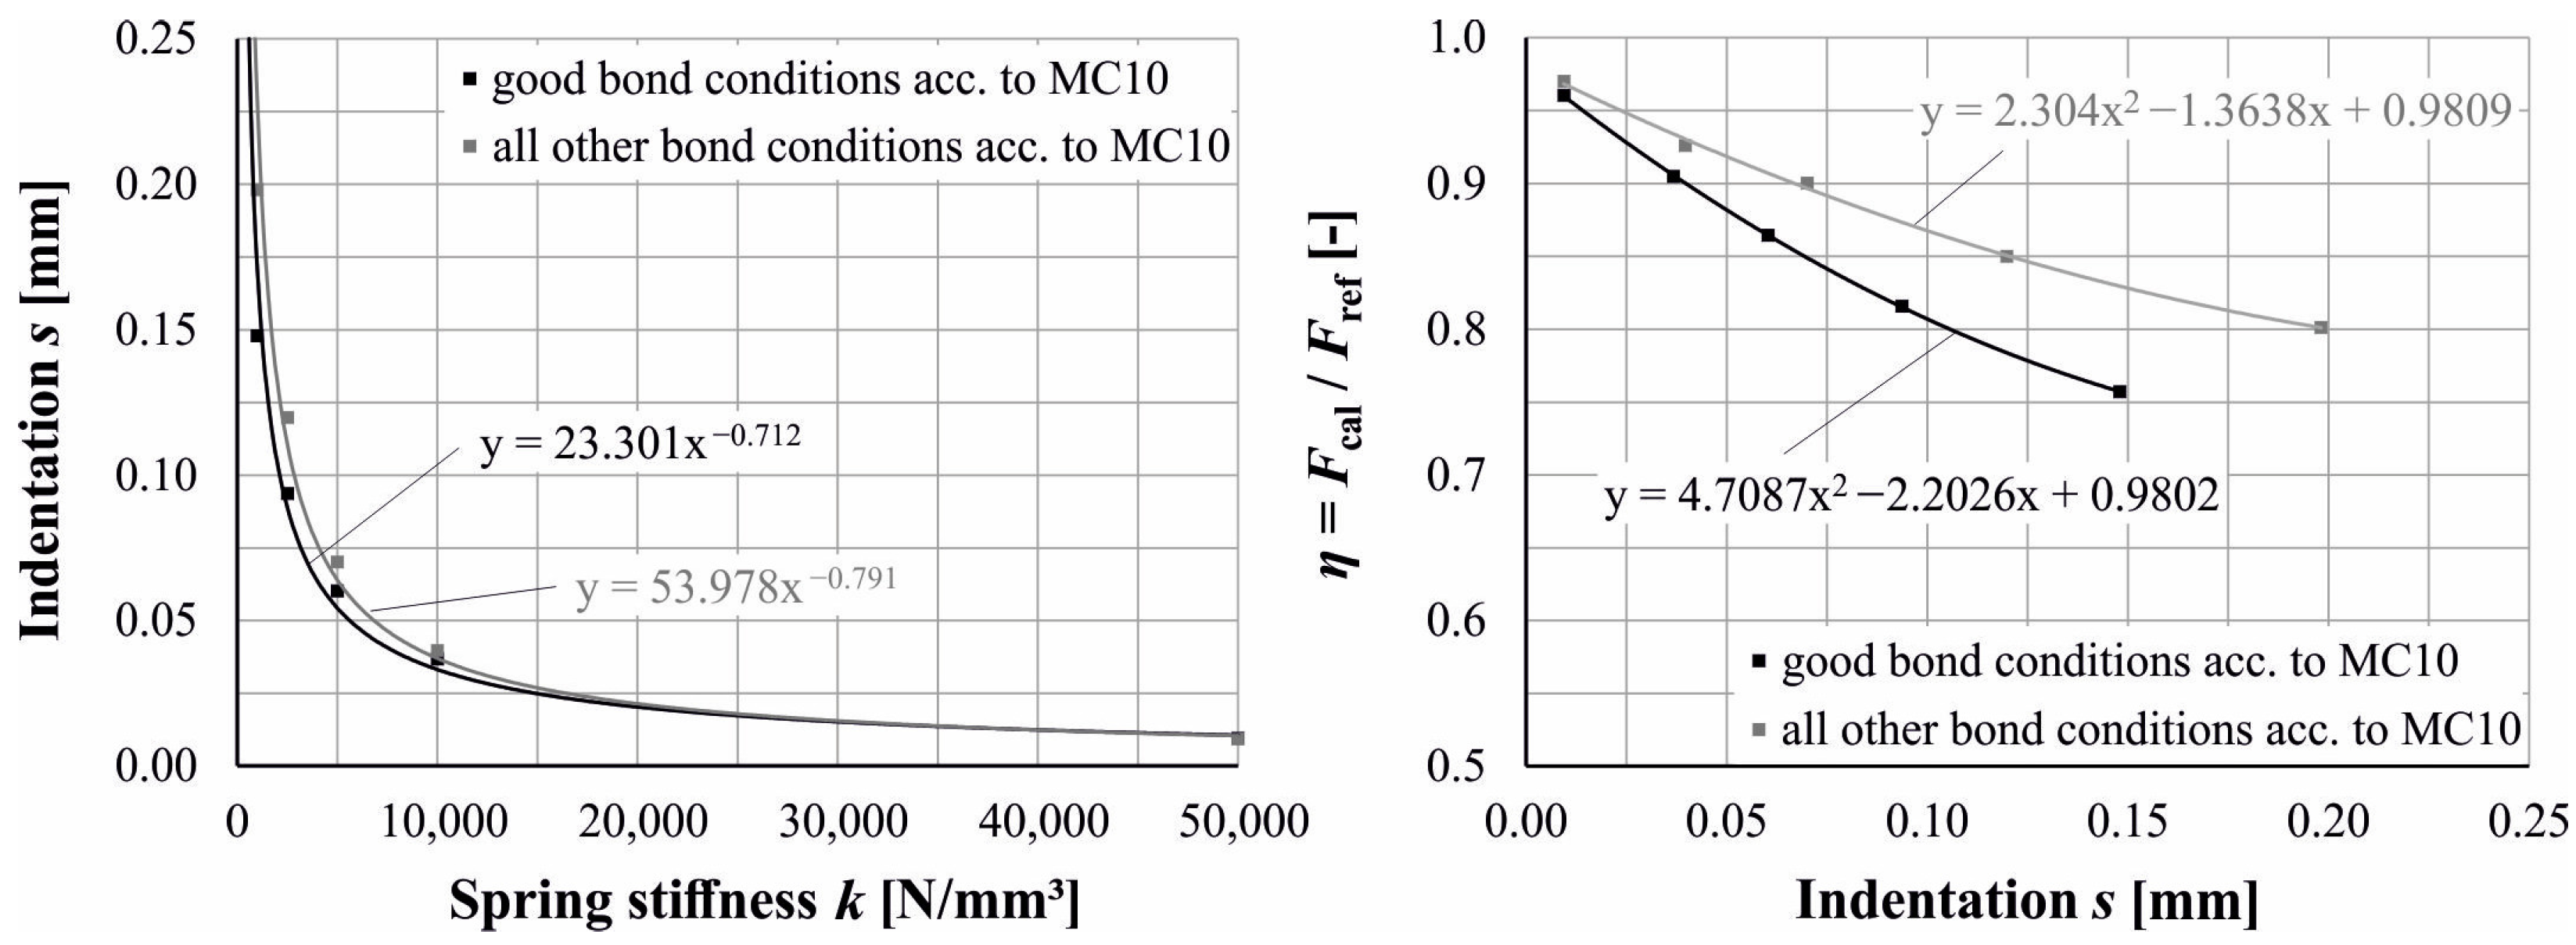
Further numerical simulations with a varying spring stiffness provide different maximum slip values representing the indentation of the longitudinal rebar into the support layer. Figure 16 (left) summarises the resulting indentation s relative to the applied spring stiffness k. The indentation decreases with increasing stiffness of the spring support, which is equivalent to the resilience of the butt joint. The diagram further indicates that with application of the bond model for good bond conditions from the MC 10 [44], which provides a higher stiffness and strength of the bond layer, the resulting slip is less than using the proposed model for all other bond conditions.
The right-hand diagram displays the utilisation η = F cal / F ref of the cross-section relative to the indentation s. The reference load F ref = A cn     f cm + A s     R p , 0 , 2 is determined including the average concrete strength f cm = 58   N / mm 2 and the steel yield stress R p , 0.2 = 592   N / mm 2 . The greater the indentations, the lesser the calculated ultimate load that can be utilised. It is noticeable that the MC 10 bond model for good bond conditions leads to greater reduction factors η compared to all other bond conditions. Due to the better bond between steel and concrete, higher bond stresses are activated with the same indentation resp. slip; thus, the concrete is subjected to a greater increase in compressive stress, leading to earlier failure.

6. Evaluation of Load-Bearing Behaviour

6.1. Large-Scale FE Model

In the following FE analyses, a combination of the models in Section 4.2 and Section 5.3 is generated in order to carry out numerical simulation of large-scale butt-jointed concrete columns corresponding to the tests in Section 3.
Figure 17 displays the three-dimensional FE model for a butt-jointed reinforced concrete column. Due to symmetry, only the upper column segment is considered. Typical model properties as well as the simulation settings such as load application and iteration method agree with the presented models in the previous sections. The average element length is e = 5.0   mm . The configuration of the applied material models is adopted from the previous analyses in Section 4.2 and Section 5.3. To control the bond behaviour between the steel plate and the column’s end face, a further interface is introduced tolerating minor relative displacements of the bonded surfaces.
As a modification of the material behaviour, the increased concrete compressive strength due to multiaxial stress conditions is considered using the constitutive concrete model by Selby and Vecchio provided by the Diana FEA library [45].
Another additional effect to be included is the squeezing out of voids from the mortar layer due to very high compression. This effect is modelled in a simplified way by introducing hardening by 20% to the spring support for the stress–strain relationship above the mortar compressive strength f cm , m = 80   N / mm 2 . Due to its importance for the entire load-bearing behaviour, further investigations on the effect of the increasing stiffness of highly compressed mortar should be considered. Figure 17a illustrates both adaptations in terms of resulting stress–strain diagrams.
The loading applied is path-controlled. Initially, load steps are defined as 0.10 mm/step, whereas the load increments are reduced to 0.01 mm/step reaching the region of non-linear material behaviour. In analogy to previously presented analyses, the Newton–Raphson method is used to achieve consistently good convergence behaviour.
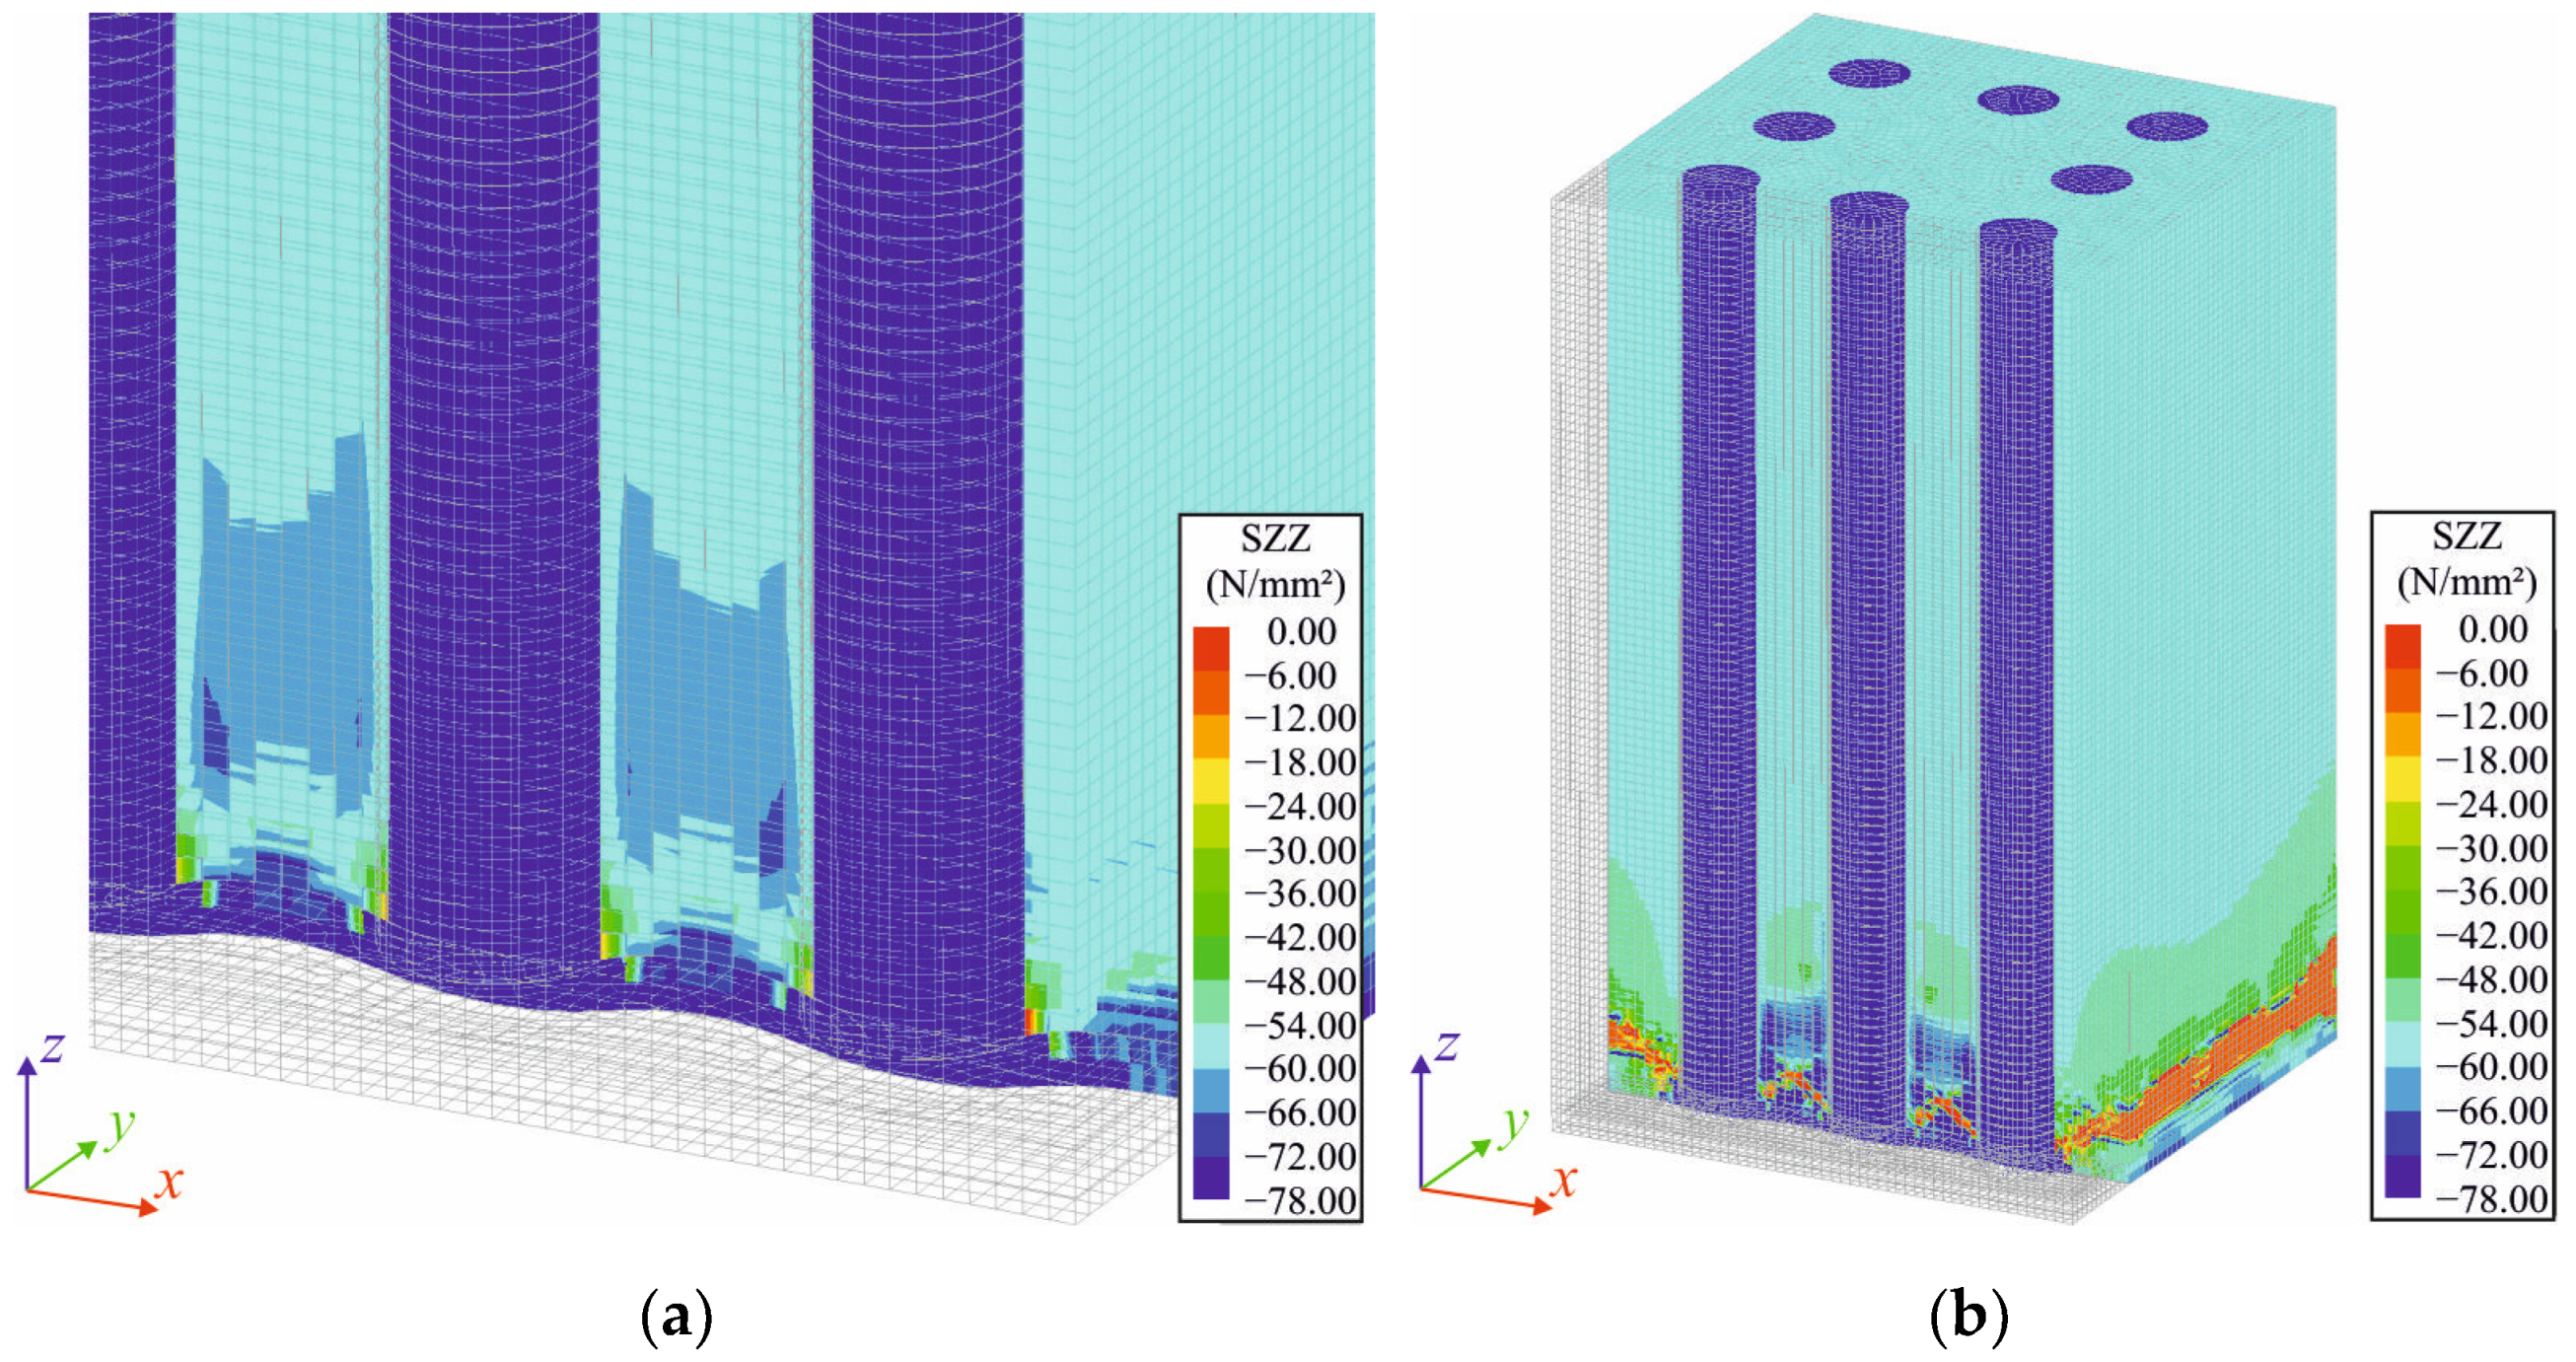
The evaluation of the stress distribution in the butt-jointed specimen reveals the failure behaviour. In Figure 18, two contour plots with superelevated deformations and a section-cut in the layer of the rebars are compared to each other regarding the vertical compressive stresses in the concrete matrix. The plot in Figure 18a shows the stress state at about 90% of the ultimate load in detail, whereas in Figure 18b, the ultimate stress state is depicted.
In Figure 18a, the rebars are already deforming the steel plate and a minor multiaxial compressive stress state is activated in the concrete core between the bars. In the concrete cover, no significant confinement is generated so that failure is initiated here by exceeding the mean concrete compressive strength f cm = 58   N / mm 2 . In particular, the steel plate prevents the development of slip between the rebars and surrounding concrete in the vertical z-direction. Right there, Figure 18a shows a small area coloured red, where the elements of the concrete matrix can no longer bear any significant compressive stresses. In contrast to the model in Section 5.3, the nodes within the column’s end face have to displace together in a vertical direction because of the continuous steel plate, which does not tolerate surface warping. This restraint leads to increased distortion of the adjacent concrete elements compared with the simulation without steel plates, as indentations of the longitudinal reinforcement into the steel plate occur due to the high peak pressure thus leading to a local premature failure.
In comparison to the stress state in Figure 18a right before the introduction of the collapse, the compressive stresses are redistributed in Figure 18b due to the failure of the concrete cover. The contour plot contains broad regions with red resp. orange colours indicating the failure of material with diminishing load-bearing capacity. The blue colouring within the concrete core represents the exhausted compensation of the cover’s loss of load-bearing capacity. The increased compressive stress in the concrete core due to multiaxial confinement contributes to the resilience of the butt-jointed column in the residual state.
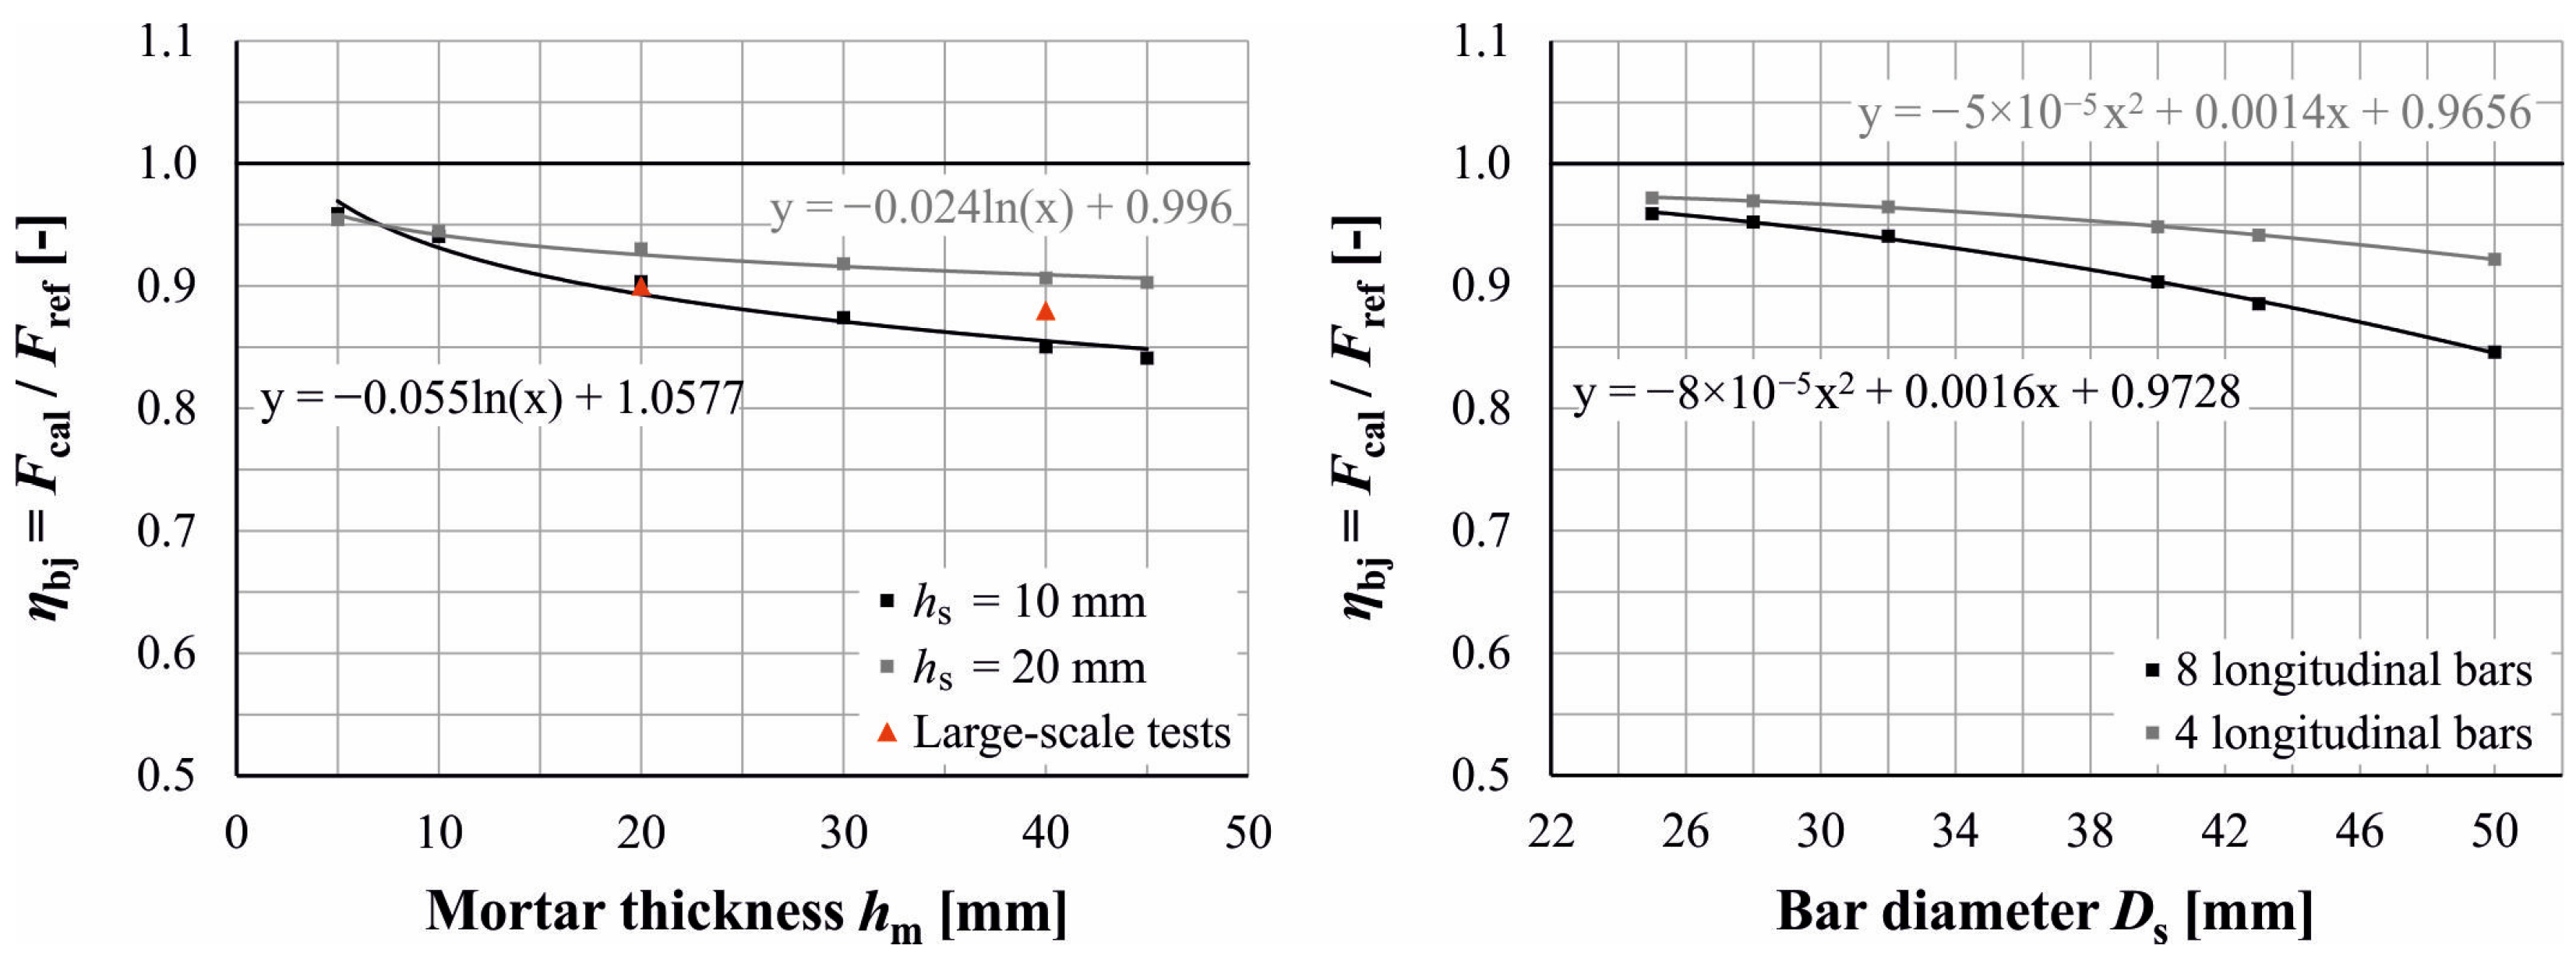
Based on this FE model, the prevalent influences on the reduction factor η bj derived in the previous analyses are investigated with the help of numerical simulations with distinct parameters varying. Visualised in Figure 19, the results demonstrate the remarkable effect of the butt joint design on the load-bearing capacity of jointed columns.
Figure 19 (left) shows the reduction factor η bj as a function of the mortar thickness h m . The experimental results correlate well with the numerical simulations. The reduction factors calculated by the FE model η bj , num , S 9.2 = 0.90 for the jointed column S 9.2 and η bj , num , S 9.3 = 0.85 for S 9.3 are a good approximation of the experimentally determined values η bj , exp , S 9.2 = 0.90 and η bj , exp , S 9.3 = 0.88 . The stiffer the grouted butt joint, i.e., for example, lower mortar thickness and greater steel plate thickness, respectively, the smaller the deformations of the butt joint appear and thus the lesser the load-bearing capacity decreases. With a very thin mortar layer, almost the entire load in the longitudinal bars can be transferred via peak stress across the joint. An enhancement of the steel plate thickness provides advantages, especially with larger mortar thicknesses. Increasing the steel plate thickness from h s = 10   mm to 20 mm generates a relative improvement of the load-bearing capacity of about 5% concerning a mortar thickness h m = 40   mm , for example.
Figure 19 (right) illustrates the effect of enlarging longitudinal bar diameters on the load-bearing capacity, simultaneously influencing the longitudinal reinforcement ratio. Furthermore, two reinforcement setups are considered: eight longitudinal rebars in accordance with the experiments and as an alternative only four longitudinal rebars each in the corners. The concrete cover was modified to c nom = Ø l . The diagram shows that with bigger longitudinal bar diameters, severe reductions occur in the ultimate load, in case no additional measure is conducted. The corresponding trend line agrees with the observations in Figure 11 (right).
Figure 19 (right) also indicates that reinforcement ratios ρ l   <   6 % lead to minor deviations of the ultimate load to the monolithically manufactured column. Regarding the investigated configurations, at least η bj = 0.96 is achieved reliably for ρ l   <   6 % . Thus, the respective statements in the German commentary on EC2 [24] and Minnert [18] concerning the reinforcement ratio are supported as there is no need for a reduction factor for butt-jointed columns with low reinforcement ratios ρ l   <   6 % . However, concerning large longitudinal rebar diameters ϕ l     40   mm and eight longitudinal bars, there are significant deficits in the ultimate load ( η bj   <   0.90 ). These configurations require special attention to the detailing of the butt joint in order to limit the reduction factor η bj .

6.2. Influences on the Load-Bearing Behaviour

The simulations with the mesoscale models in Section 4.2 and Section 5.3 as well as the combined large-scale model of the butt-jointed column show that both the steel force and the stiffness of the butt joint have a great influence on the generated load-bearing capacity. The indentations of the longitudinal rebars into the steel plates have a significant impact on the stress redistribution from the steel bars to the concrete cover and therefore lead to premature failure. Due to the sensitivity of precast columns to relative displacements between steel and concrete, production-related size tolerances of the longitudinal rebars are also critical, so that any potential slip should be kept to a minimum.
The following detailing modifications of the butt joint can lead to an improvement of the load-bearing capacity of jointed columns:
  • Increasing the thickness and grade of the steel plates.
  • Increasing the Young’s modulus of the mortar.
  • Reducing the thickness of the mortar layer.
  • High planarity of the end faces of the columns.
  • Minimum gap between longitudinal reinforcement and the steel plate.
Furthermore, the confinement of the concrete core using effective stirrup reinforcement has a great influence on the load-bearing behaviour of jointed columns. Sufficient transverse reinforcement in addition to the confining steel plate most likely compensates the load-bearing ratio due to failure of the concrete cover and possibly enables a further increase of the ultimate load, respectively. However, it should be remarked that these efforts lead to reduction of stiffness. In this article, moderate transverse reinforcement ratios were considered. Further investigations regarding the influence of the transverse reinforcement ratio on the load-bearing behaviour of butt-jointed reinforced concrete columns are required.

7. Conclusions and Outlook

Prefabricated reinforced concrete columns can contribute to the rapid and also sustainable construction of buildings or even high-rise buildings. The use of high reinforcement ratios and large bar diameters provides reductions in the number and the dimensions of the columns, respectively. The joint between precast columns has a great influence on the design and construction and requires special attention. Grouted butt joints, which are able to transfer high forces compensating tolerances simultaneously and can afford to be dismantled in terms of future re-utilisation, have become an established state of the art in German-speaking countries within the last 10 years.
In order to analyse the load-bearing behaviour and the deformations of the butt-jointed columns, five large-scale tests were carried out at the TU Braunschweig. They indicated that:
  • The ultimate load of the monolithically manufactured columns could no longer be achieved with the addition of butt joints.
  • The reduction of the ultimate load increases with greater mortar thickness.
  • The reduction of the ultimate load increases with higher longitudinal reinforcement ratio.
  • Failure is initiated by spalling off the concrete cover immediately above or below the butt joint.
  • There are considerable indentations of the longitudinal rebars into the steel plates.
  • The strain of the longitudinal rebars decreases in the direction of the butt joint and that the strain in the concrete cover simultaneously increases.
  • Premature failure occurs due to overloading of the concrete cover when the concrete compressive strength is reached.
Using mesoscale FE models, the experimental phenomena could be analysed more deeply. With the large-scale FE analyses, the load-bearing behaviour of the large-scale tests could be reproduced and the influences on the effect of the load reduction at butt-jointed concrete columns illustrated. From the mesoscale models and the large-scale model, it can be deduced that:
  • The indentations of the longitudinal bars into the steel plate increase with enlarging bar diameter as well as thinner steel plates.
  • Due to slip between reinforcement and concrete, bond stresses are activated right above the joint.
  • Deep indentations lead to significant ultimate load reductions.
  • The application of thick mortar layers, thin steel plates, large bar diameters and high reinforcement ratios, respectively, leads to considerable reductions in the ultimate load of the jointed column.
The investigated failure modes of butt joints can also be transferred to length tolerances of the longitudinal reinforcement, which is especially important in the case of high load-bearing precast columns.
A further important aspect is the load-increasing influence of confining the inner concrete core. In this respect, research on the influence of the connection between the steel plate and the end face of the column confining the column is also necessary. The better the adhesive and frictional bond between the steel plate and the column, the higher the multiaxial stress state emerges in the concrete and the higher the performance of the butt joint.
An additional discussion point is the bond behaviour between longitudinal reinforcement and concrete. In this paper, the characteristic equations according to MC 2010, derived from pull-out tests, were used. However, it should be examined whether they are also valid for compression with simultaneous high loading of the surrounding concrete.

Author Contributions

Conceptualization, methodology, software, validation, formal analysis, investigation, resources, data curation, writing—original draft preparation, writing—review and editing and visualization, H.M.; supervision, M.E. All authors have read and agreed to the published version of the manuscript.

Funding

This research received no external funding.

Data Availability Statement

No new data were created or analyzed in this study. Data sharing is not applicable to this article.

Conflicts of Interest

The authors declare no conflict of interest.

References

  1. Hu, J.-Y.; Hong, W.-K.; Park, S.-C. Experimental investigation of precast concrete based dry mechanical column-column joints for precast concrete frames. Struct. Des. Tall Spec. Build. 2017, 26, e1337. [Google Scholar] [CrossRef]
  2. Nzabonimpa, J.D.; Hong, W.-K. Structural performance of detachable precast composite column joints with mechanical metal plates. Eng. Struct. 2018, 160, 366–382. [Google Scholar] [CrossRef]
  3. Rave-Arango, J.F.; Blandón, C.A.; Restrepo, J.I.; Carmona, F. Seismic performance of precast concrete column-to-column lap-splice connections. Eng. Struct. 2018, 172, 687–699. [Google Scholar] [CrossRef]
  4. Tullini, N.; Minghini, F. Grouted sleeve connections used in precast reinforced concrete construction—Experimental investigation of a column-to-column joint. Eng. Struct. 2016, 127, 784–803. [Google Scholar] [CrossRef]
  5. Yu, Z.; Lv, X.; Yu, Y.; Ding, F.; Peng, X. Seismic Performance of Precast Concrete Columns with Improved U-type Reinforcement Ferrule Connections. Int. J. Concr. Struct. Mater. 2019, 13, 54. [Google Scholar] [CrossRef]
  6. Bachmann, H. Stützen mit hochfestem Betonstahl sind im Hochhausbau eine gute Alternative zu Stahl- und Stahlverbundstützen: Versuche und Erfahrungen bei den Tanzenden Türmen in Hamburg und beim Bau des Taunusturms in Frankfurt. Der Prüfingenieur 2014, 23, 12–27. [Google Scholar]
  7. Pfeifer, M. A skyscraper with hip-swing: The Omniturm in Frankfurt am Main. Bautechnik 2021, 98, 446–456. [Google Scholar] [CrossRef]
  8. Oettel, V.; Empelmann, M. Large bar diameters and high reinforcement ratios—Part 3: Columns. Beton Und Stahlbetonbau 2018, 113, 789–798. [Google Scholar] [CrossRef]
  9. Empelmann, M. Bewertung des Stumpfstoßes mit Mörtelfuge der Hochhausstützen beim Bauvorhaben FOUR in Frankfurt am Main; Expert report; Technische Universität Braunschweig: Braunschweig, Germany, 2021. [Google Scholar]
  10. Müller, F.; Sasse, H.R.; Thormählen, U. Stützenstöße im Stahlbeton-Fertigteilbau mit unbewehrten Elastomerlagern, DAfStb-Heft 339, 1st ed.; Beuth Verlag: Berlin, Germany, 1982. [Google Scholar]
  11. Mühlbauer, C. Fügen von Bauteilen aus ultrahochfestem Beton (UHPC) durch Verkleben. Ph.D. Thesis, Technical University of Munich, Munich, Germany, 2012. [Google Scholar]
  12. Stroband, J.; Poot, S.; Walraven, J. The effect of mortar joints between precast HSC columns loaded in compression. In Proceedings of the 4th International Symposium on Utilization of High-Strength/High-Performance Concrete, Paris, France, 29–31 May 1996; Volume 4, pp. 817–825. [Google Scholar]
  13. Somerville, G. The Behaviour of Mortar Joints in Compression; Technical report 42.476; Cement and Concrete Association: London, UK, 1972. [Google Scholar]
  14. Vambersky, J.N.J.A. Mortar Joints Loaded in Compression; Annual Report; TU Delft: Delft, The Netherlands, 1991. [Google Scholar]
  15. Barboza, A.d.S.R.; El Debs, M.K. Load-bearing capacity of mortar joints between precast elements. Mag. Concr. Res. 2006, 58, 589–599. [Google Scholar] [CrossRef]
  16. Empelmann, M.; Wichert, M.; Matz, H. Splitting Failure of Grouted Joints between UHPC Segments. Bauingenieur 2020, 95, 55–63. [Google Scholar] [CrossRef]
  17. Paschen, H.; Zillich, V.C. Versuche zur Bestimmung der Tragfähigkeit Stumpf Gestoßener Stahlbetonfertigteilstützen. DAfStb-Heft 316, 1st ed.; Ernst & Sohn: Berlin, Germany, 1980. [Google Scholar]
  18. Minnert, J. Tragverhalten von Stumpf Gestoßenen Fertigteilstützen aus Hochfestem Beton. DAfStb-Heft 499, 1st ed.; Beuth Verlag: Berlin, Germany, 2000. [Google Scholar]
  19. Saleh, H. Ein Beitrag zur Untersuchung und Bemessung von Stumpf Gestoßenen Fertigteilstützen aus Normalfestem Beton. Ph.D. Thesis, Universität Leipzig, Leipzig, Germany, 2002. [Google Scholar]
  20. Steinle, A.; Bachmann, H.; Tillmann, M. Bauen mit Betonfertigteilen im Hochbau, 3rd ed.; Ernst & Sohn: Berlin, Germany, 2018. [Google Scholar]
  21. König, G.; Tue, N.V.; Saleh, H.; Kliver, J. Herstellung und Bemessung stumpf gestoßener Fertigteilstützen. Beton Fertigteil Jahrbuch 2003, 198–206. [Google Scholar]
  22. Schoening, J.; Della Pietra, R.; Hegger, J.; Tue, N.V. Connections of precast UHPC elements. Bautechnik 2013, 90, 304–313. [Google Scholar] [CrossRef]
  23. EN 1992-1-1; Eurocode 2: Design of Concrete Structures—Part 1-1: General Rules and Rules for Buildings. European Committee for Standardization CEN: Brussels, Belgium, 2004.
  24. Fingerloos, F.; Hegger, J.; Zilch, K. EUROCODE 2 für Deutschland: Kommentierte und konsolidierte Fassung; Ernst & Sohn: Berlin, Germany, 2016. [Google Scholar]
  25. Martinez, S. Spirally-Reinforced High-Strength Concrete Columns. Ph.D. Thesis, Cornell University, New York, NY, USA, 1982. [Google Scholar]
  26. Sheikh, S.A.; Uzumeri, S.M. Analytical Model for Concrete Confinement in Tied Columns. J. Struct. Div. 1982, 108, 2703–2722. [Google Scholar] [CrossRef]
  27. Mander, J.B.; Priestley, M.J.N.; Park, R. Theoretical Stress-Strain Model for Confined Concrete. J. Struct. Eng. 1988, 114, 1804–1826. [Google Scholar] [CrossRef] [Green Version]
  28. Euro-International Committee for Concrete; Fédération Internationale de la Précontrainte. CEB-FIP Model Code 1990: Design Code; Telford: London, UK, 1993. [Google Scholar]
  29. Razvi, S.; Saatcioglu, M. Confinement Model for High-Strength Concrete. J. Struct. Eng. 1999, 125, 281–289. [Google Scholar] [CrossRef]
  30. Kim, S.; Hong, H.; Han, T. Behavior of an Internally Confined Hollow Reinforced Concrete Column with a Polygonal Cross-Section. Appl. Sci. 2021, 11, 4302. [Google Scholar] [CrossRef]
  31. Sadrossadat, E.; Ghorbani, B.; Hamooni, M.; Moradpoor Sheikhkanloo, M.H. Numerical formulation of confined compressive strength and strain of circular reinforced concrete columns using gene expression programming approach. Struct. Concr. 2018, 19, 783–794. [Google Scholar] [CrossRef]
  32. Amirkhani, S.; Lezgy-Nazargah, M. Nonlinear finite element analysis of reinforced concrete columns: Evaluation of different modeling approaches for considering stirrup confinement effects. Struct. Concr. 2022, 23, 2820–2836. [Google Scholar] [CrossRef]
  33. Li, J.; Deng, Z.; Yao, J. Research on uniaxial compressive behavior of high-strength spiral stirrups confined circular ultra-high performance concrete columns. Struct. Concr. 2020, 21, 2584–2600. [Google Scholar] [CrossRef]
  34. Chang, W.; Hao, M.; Zheng, W. Strength and ductility of laterally confined concrete. Struct. Concr. 2021, 22, 2967–2991. [Google Scholar] [CrossRef]
  35. Matz, H.; Empelmann, M. Butt Joints in Prefabricated Columns with High Reinforcement Ratios. In Proceedings of the 6th fib Congress, Oslo, Norway, 12–16 June 2022; Volume 6, pp. 1966–1975. [Google Scholar]
  36. Matz, H.; Empelmann, M. Butt joints in precast columns using high reinforcement ratios and large bar diameters. Beton Und Stahlbetonbau 2021, 116, 701–711. [Google Scholar] [CrossRef]
  37. Wolfger, H.; Kollegger, J. Butt jointed precast columns with high-strength reinforcement and large bar diameters. Beton Und Stahlbetonbau 2021, 116, 689–700. [Google Scholar] [CrossRef]
  38. Wolfger, H.; Kollegger, J. Early failure of high-strength concrete columns with large bar diameters. Beton Und Stahlbetonbau 2022, 117, 397–409. [Google Scholar] [CrossRef]
  39. Matz, H.; Empelmann, M. Component-specific compressive strength of reinforced concrete columns made of normal- and high-strength concrete. Beton Und Stahlbetonbau 2021, 117, 12–23. [Google Scholar] [CrossRef]
  40. Empelmann, M.; Javidmehr, S. Sustained load behaviour of normal-strength concrete. Beton Und Stahlbetonbau 2020, 115, 260–269. [Google Scholar] [CrossRef]
  41. Moccia, F.; Yu, Q.; Fernández Ruiz, M.; Muttoni, A. Concrete compressive strength: From material characterization to a structural value. Struct. Concr. 2021, 22, 634–654. [Google Scholar] [CrossRef]
  42. DIANA Finite Element Analysis, B.V. User’s Manual—Release 10.6; DIANA FEA BV: Delft, Netherlands, 2022. [Google Scholar]
  43. Empelmann, M.; Matz, H. Robustness of reinforced concrete columns. Beton Und Stahlbetonbau 2019, 114, 837–846. [Google Scholar] [CrossRef]
  44. Fédéracion Internationale du Béton Fib. Model Code for Concrete Structures 2010; Ernst & Sohn: Berlin, Germany, 2013. [Google Scholar]
  45. Selby, R.G.; Vecchio, F.J. A constitutive model for analysis of reinforced concrete solids. Can. J. Civ. Eng. 1997, 24, 460–470. [Google Scholar] [CrossRef]
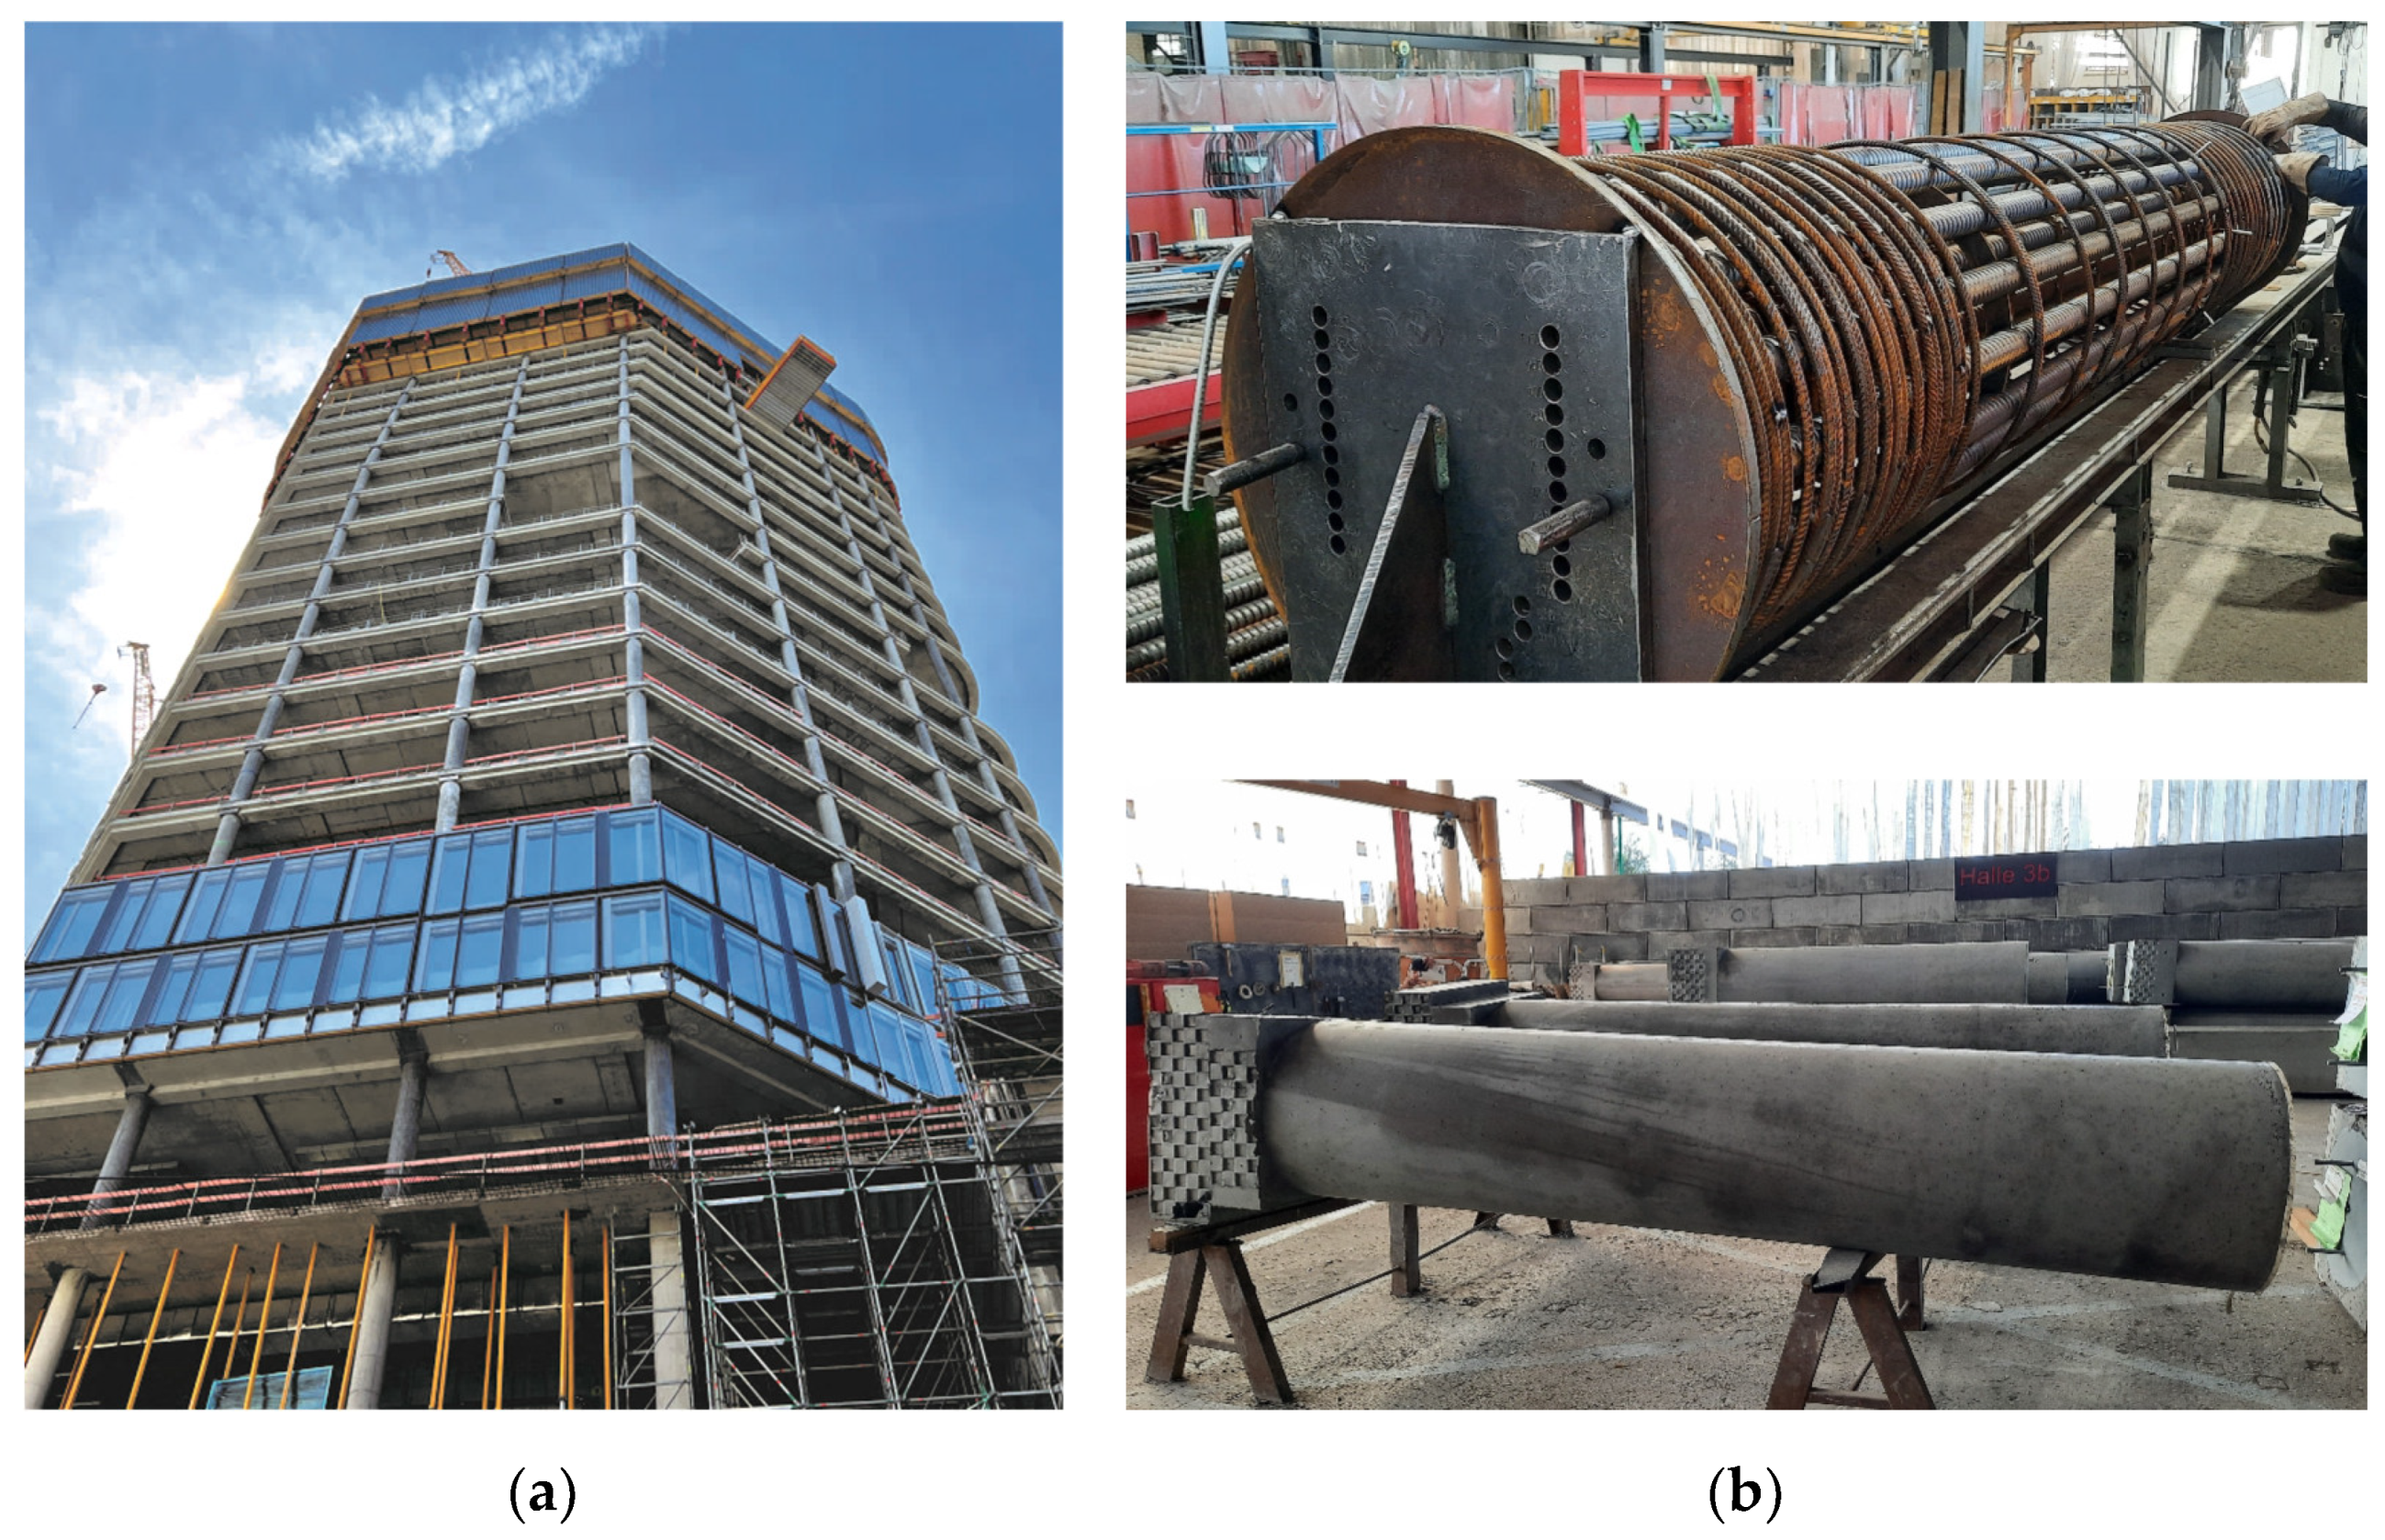
Figure 1. FOUR high-rise project in Frankfurt: (a) precast columns installed in high-rise structure; (b) reinforcement cage and finished column at SACAC AG in Lenzburg, Switzerland [9].
Civileng 03 00063 g001
Figure 2. (a) Butt joint with steel plates; (b) model for force transmission according to [20]; (c) mortar compressive strength depending on height–width ratio [6].
Civileng 03 00063 g002
Figure 3. Configurations of the test specimens S 9.2, S 9.3 and S 9.6.
Civileng 03 00063 g003
Figure 4. Experimental setup: (a) schematic draft of 30 MN testing machine with butt-jointed column; (b) installed large-scale test S 9.3 before testing.
Civileng 03 00063 g004
Figure 5. Test specimens after failure: S 9.2 (left), S 9.3 (middle) and S 9.6 (right).
Civileng 03 00063 g005
Figure 6. Lower steel plate of component test S 9.3: (a) photography; (b) 3D laser scan; (c) measured deformations.
Civileng 03 00063 g006
Figure 7. Three-dimensional laser scans: (a) upper steel plate of S 9.2; (b) lower steel plate of S 9.6.
Civileng 03 00063 g007
Figure 8. Deformations of the lower steel plate of S 9.2.
Civileng 03 00063 g008
Figure 9. Deformations of the upper steel plate of S 9.3.
Civileng 03 00063 g009
Figure 10. (a) FE model of elastically supported steel plate; (b) exemplary deformation plot.
Civileng 03 00063 g010
Figure 11. Indentations in relation to mortar thickness (left) and in relation to longitudinal bar diameter (right).
Civileng 03 00063 g011
Figure 12. Measured concrete (left) and steel stains (right) above and below the butt joint for S 9.2.
Civileng 03 00063 g012
Figure 13. Measured concrete (left) and steel stains (right) above and below the butt joint for S 9.3.
Civileng 03 00063 g013
Figure 14. (a) FE model of reinforced concrete member with elastic spring support; (b) vertical deformation plot.
Civileng 03 00063 g014
Figure 15. Evaluation of stresses: (a) bond stresses in the interface; (b) development of concrete and steel stresses over the height.
Civileng 03 00063 g015
Figure 16. Relationship between modulus of spring stiffness and indentations (left) and reduction of ultimate load as a function of indentations (right).
Civileng 03 00063 g016
Figure 17. FE model of the butt joint in a reinforced concrete column: (a) entire model with specific model properties; (b) detail with hidden concrete elements.
Civileng 03 00063 g017
Figure 18. Contour plot of compressive stresses: (a) detail of rebars deforming the steel plate at 90% of ultimate load; (b) compressive concrete stresses at ultimate load.
Civileng 03 00063 g018
Figure 19. Utilisation of the ultimate load as a function of mortar thickness and steel plate thickness (left) and the longitudinal bar diameter (right) for square column segments with 28 cm width.
Civileng 03 00063 g019
Table 1. Configurations of the test specimens and material properties of concrete, mortar and longitudinal reinforcement.
ReferencesButt-Jointed Columns
S 9.1S 7.7S 9.2S 9.3S 9.6
Longitudinal bar diameter ϕ l (mm)4040404040
Number of longitudinal bars n sl (-)8168816
Reinforcement ratio ρ l (%)12.825.612.812.825.6
Stirrup diameter ϕ w (mm)1010101010
Distance between stirrups s cl , t (mm)280280280280280
Mortar thickness h m (mm)--204040
ConcreteCompressive strength f cm (N/mm²)49.046.962.555.261.0
Young’s modulus E cm (N/mm²)38,000-40,70039,20037,800
MortarCompressive strength f cm , M (N/mm²)--80.381.874.4
Young’s modulus E cm , M (N/mm²)--29,90029,40029,100
SteelCompressive yield strength R p , 0.2 (N/mm²)592592592592592
Compressive strength R m (N/mm²)637437637637637
Table 2. Comparison of experimentally and mathematically determined ultimate loads.
ReferencesButt-Jointed Columns
S 9.1S 7.7S 9.2S 9.3S 9.6
Experimental ultimate load F u , exp (kN)64999811656860637725
Calculated ultimate load F u , cal (kN)644598607295684510,232
Reduction factor η bj (-)1.010.990.900.880.75
Publisher’s Note: MDPI stays neutral with regard to jurisdictional claims in published maps and institutional affiliations.