Article

Advancing Construction Efficiency through Geochemical Remediation: Limescale Management in Jet Grout-Driven Pumping Facilities

by
No’am Zach Dvory
1,2,* and
Yariv Tsafrir
2
1
Energy & Geoscience Institute, Department of Civil & Environmental Engineering, University of Utah, 423 Wakara Way, Salt Lake City, UT 84108, USA
2
Etgar A. Engineering, Ra’anana 4338004, Israel
*
Author to whom correspondence should be addressed.
Eng 2024, 5(2), 614-628; https://doi.org/10.3390/eng5020035
Submission received: 1 March 2024 / Revised: 11 April 2024 / Accepted: 12 April 2024 / Published: 17 April 2024
(This article belongs to the Section Chemical, Civil and Environmental Engineering)

Abstract

:
We address the challenges of limescale deposition and its management in urban construction sites, specifically within the Sumayil North project in Tel Aviv. Jet grouting, a method increasingly favored over conventional dewatering techniques for its minimal environmental impact and efficiency, is scrutinized for its unintended consequences on groundwater chemistry, particularly in relation to limescale formation. Our investigation centers on a dual approach: dissecting the geochemical dynamics leading to limescale deposition following jet grouting operations, and evaluating a remedial acid injection strategy implemented to counteract this phenomenon. We identify the critical factors influencing aquifer water chemistry through a detailed hydro-chemical analysis encompassing the Pleistocene Coastal Aquifer’s dynamics. The study reveals that the interaction between grout components and aquifer water significantly alters groundwater pH, driving the precipitation of calcium carbonate. The subsequent implementation of a sulfuric acid injection regimen successfully mitigated limescale accumulation, restoring pumping efficiency and neutralizing pH levels. We propose a workflow to manage and prevent limescale, emphasizing preemptive measures like custom grout compositions and controlled dewatering, with strict post-intervention groundwater monitoring. This approach balances operational efficiency, infrastructure integrity, and environmental stewardship in urban construction projects interfacing with sensitive aquifer systems.

1. Introduction

Jet grouting has emerged as a superior alternative to conventional dewatering techniques in urban construction, particularly in areas above freshwater aquifers [1]. This innovative method offers a multitude of advantages, notably in the context of safeguarding groundwater resources. Jet grouting minimizes groundwater extraction, effectively preserving aquifer levels and averting subsidence issues that can potentially impact nearby structures. Jet grouting reduces the environmental footprint. It confines groundwater control to the site, addressing concerns of water depletion linked to traditional dewatering. Furthermore, it enables a more controlled and efficient construction process, potentially leading to substantial cost savings by mitigating structural damage and diminishing the need for environmental remediation due to pollutant migration.
One significant challenge during dewatering operations is the presence of limescale, primarily composed of calcium carbonate [1,2]. Limescale accumulation within pipes and on pump components can lead to blockages and reduced water flow, compromising the overall efficiency of the dewatering system and necessitating frequent maintenance and cleaning [3,4,5]. This buildup also diminishes the operational effectiveness of equipment, as it acts as an insulating layer on heat transfer surfaces in pumps or engines, potentially resulting in overheating and equipment failure. Consequently, increased energy consumption is incurred as pumps and other machinery require more power to maintain the desired dewatering level, escalating operational costs. Although limescale is non-corrosive, it can trap corrosive substances against metal surfaces, hastening the wear and tear of dewatering infrastructure. This issue has implications for water quality, particularly when dewatered water is reused or discharged, potentially leading to challenges in meeting environmental compliance standards.
The Sumayil North project in Tel Aviv (Figure 1), a 45-story skyscraper with five underground levels, is a pertinent case study. This project is currently in the construction phase. Given the significant reliance on shallow aquifer groundwater in the Tel Aviv metropolis for potable water, stringent production constraints were imposed on all dewatering operations. These constraints necessitated the implementation of deep diaphragm retaining walls and jet grouting as lateral and vertical impenetrable barriers in the project. Shortly after initiating dewatering production in September 2020, an unusual and accelerated limescale deposition issue emerged. This limescale deposition caused severe damage, restricting pumping capacities through the drilling pipes and leading to the shutdown of numerous pumps. Notably, limescale deposition predominantly occurred on pump surfaces and pipe walls (Figure 2). In response, a pilot remedy involving injecting 35% sulfuric acid into one of the pumping wells at a capacity of 30 cubic meters per hour was carried out on October 15. Following this pilot, a system for sulfuric acid injection into the aquifer water, coupled with pH monitoring, was established. Lift values performed acid injection at a depth of 19 m. As of March 2021, the limescale phenomenon significantly reduced or disappeared with the acid injection, and pH levels returned to neutral values.
However, despite the apparent success of the acid injection approach, a comprehensive understanding of the limescale formation mechanism at the site remains elusive. Furthermore, the implementation of the solution has occurred without a thorough analysis of potential damage resulting from the acid injection. Therefore, the primary objectives of this study are twofold: first, to unravel the mechanism underlying limescale formation at the site by conducting an extensive hydro-chemical analysis of the factors influencing aquifer water; and second, to propose a cost-effective workflow for preventing limescale deposition, emphasizing the precautions required to prevent collateral damages both at the construction site and to equipment. In this paper, we present the findings of our comprehensive hydro-chemical analysis and provide recommendations for future management, prevention, and mitigation of similar cases.

2. Materials and Methods

2.1. Aquifer Dynamics and Local Stratigraphy

The Pleistocene Coastal Aquifer is a hydrogeological feature that extends across a vast region, ranging from the northern slopes of Mount Carmel in the north to the southern reaches of Sinai in the south. It stretches from the foothills of the Judean and Samarian hills in the east to the picturesque Mediterranean coastline in the west (Figure 3). In a vertical cross-section perpendicular to the coastline, this aquifer exhibits considerable variation in thickness, starting from just a few meters in the eastern portions and gradually thickening to an impressive 200 m as one moves westward.
The coastal area adjacent to the aquifer is characterized by distinct divisions into several sub-aquifers, demarcated by impermeable layers. These divisions manifest as stratigraphic units comprising calcareous sandstone and sand, interspersed with silt, clay, and marl layers.
Under natural conditions, the aquifer receives its water primarily through the percolation of rainwater. This freshwater flows westward toward the coastline, eventually reaching the sea through underground outlets. However, the history of human intervention in this aquifer has significantly altered its dynamics.
In the 1930s, groundwater extraction activities initiated a series of local depressions within the aquifer. The most notable is the “Gush Dan depression”, located northwest of the Sumayil North site. Over the years, the size and intensity of these depressions have undergone dynamic changes, influenced by annual aquifer recharge rates and the production schemes employed, particularly during the excessive exploration efforts of the 1950s.
In the winter of 1991/92, heavy rainfall significantly raised ground levels, reducing the “Gush Dan depression” and causing widespread changes across the coastal aquifer. Subsequently, annual production rates escalated, reaching their zenith in the hydrological year 2000/01. During that year, pumping in the Gush Dan area reached a staggering 27.04 million cubic meters (MCM), of which 10.33 MCM was extracted near the Sumayil North site. This significantly increased compared to the 5.71 MCM extracted from the aquifer near the site during 1990/91 and the overall 18.76 MCM extracted in the entire Gush Dan area.
The Sumayil North site is located approximately 1.2 km from the coastline (Figure 3). The ground surface at this site stands at around +11 m above mean sea level, while the excavation’s planned depth reaches as low as −12.9 m relative to sea level. In terms of its geological composition, the upper section of the site consists of interbedded calcareous sandstone and sand, extending from the ground surface to a depth of 32 m. Within this fraction, thin brittle layers intermingle with sandy deposits. Below this, a robust calcareous sandstone layer stretches from a depth of 32 m to approximately 43 m, forming a permeable section. This permeable section is bounded by an impermeable clayey layer, which extends from a depth of 43 m to about 48 m. Finally, below the clay layer, another calcareous sandstone layer with sand fill is documented, extending from a depth of 48 m to 62 m.

2.2. Water Barriers and Jet Grouting

The excavation area encompasses an area of approximately 2225 square meters. Diaphragm retaining walls are the primary structural elements employed for excavation support, extending to a depth of −22.0 m below the ground surface (Figure 4). On the southwestern perimeter of the site, secant pile walls have been deployed instead of diaphragm walls. This substitution has led to an extension of groundwater infiltration pathways through these walls. A sealing technique, the Dual Fluid System, has been applied to secure the excavation base. This technique involves injecting a blend of high-pressure water and grout into the soil to enhance its stability and strength. This process begins with drilling a borehole to the desired depth, followed by inserting a jet grouting monitor, a device equipped with specialized nozzles. Initially, high-pressure water, typically between 300 to 600 bar, is injected to loosen the soil and create a cavity. This is succeeded by the injection of a grout mixture, here, based on Portland cement, at similar pressures. The grout mixes with the disturbed soil, forming a reinforced, cemented zone. The monitor is carefully retracted while rotating and moving vertically to ensure the grout thoroughly mixes with the soil, forming either columnar or cylindrical zones of improved soil. This creates soil–cement columns with diameters usually between 0.5 and 2.5 m, which exhibit enhanced strength and reduced permeability. These columns are strategically placed with overlaps for comprehensive ground improvement.

2.3. Dewatering Design

To determine the extent of pumping required to lower water levels, a local flow model was developed using the Modflow software package [8]. The model encompasses an area of 2000 × 2000 m, with the project site located at its center. Cell widths vary, ranging from 0.5 m in the region designated for water level reduction to approximately 50 m at the model’s periphery. This model comprises seven layers (Table 1), with a total of 218,169 cells. The model orientation is parallel to the coastline, inclined at an angle of 16.3 degrees from the north in a clockwise direction. While horizontal hydraulic conductivity values will be discussed later, vertical hydraulic conductivity values were set to one-third of the horizontal values. Specific yield and specific storage values were established in accordance with accepted values from the literature (15% and 0.0001–1 m, respectively).
The simulation of the local flow system was conducted in two stages. Initially, a simulation of the natural equilibrium flow system without pumping was executed. The results of this stage served as the foundation for the second stage, in which simulations were performed to estimate the necessary production to lower water levels at the project site. These simulations were based on typical horizontal hydraulic conductivity values for the region (20–25 m per day for sandy layers and 2–10 m per day for lower permeability layers). The initial water level map for the aquifer in 2016 was used as the basis for the initial levels in the model [6]. However, on-site groundwater level measurements indicated slightly higher levels than those depicted on the map, necessitating adjustments. Model calibration was achieved by implementing constant head conditions at the model boundaries, informed by this map and on-site measurements.
The required pumping extent was calculated over time intervals, averaging from half a day to thirty days. The pumping rates are initially higher and subsequently decrease due to changes in local storage. These variations result from the reduction in the aquifer’s reservoir and the progression toward a steady flow state. The initial pumping rates are theoretical, and in practice, pumping during this period aligned with the installation progress of the pumping system at the site.
To conserve freshwater resources, the water produced was reinjected into the lower portion of the aquifer through two injection wells located 45 m northeast of the dewatering site. Simulation indicated that reinjection increased the production rate by 23%. Production commenced in September 2020 and reached a stable rate of 75 cubic meters per hour.

2.4. Geochemical Response

Figure 5 illustrates the site’s geochemical response to the grouting operation, with notable changes in pH and ion concentrations observed. Groundwater samples were collected at the construction site before and during the construction phase, and the results are summarized in Table 2.
The pH values displayed substantial variations during the construction activities. In December 2016, prior to commencing work, the pH at the construction site was measured at a basic level of 8.4. Following the initiation of pumping operations in October 2020, significantly alkaline pH values ranging from 10.6 to 11 were recorded. Starting on 17 January 2021, a 35% concentration of sulfuric acid, totaling approximately 2500 kg per week, was introduced into the system. Following the implementation of the treatment, subsequent measurements on 4 February 2021, and 17 February 2021, indicated a decrease in pH values to approximately 6.1 to 6.7.
Additionally, changes in water hardness, as indicated by calcium (Ca) and magnesium (Mg) concentrations, provide complementary insights. In December 2016, the ion concentrations were approximately 92 mg/L and 17 mg/L, respectively, resulting in a water hardness value of 300 mg/L CaCO3. The significant shift towards alkaline conditions observed in November 2020 was accompanied by a noticeable decrease in calcium and magnesium concentrations compared to 2016, with 81 mg/L and 14.6 mg/L, respectively, yielding a water hardness value of 255 mg/L CaCO3. This indicates the limescale deposition process, which removes calcium and magnesium from the system. Subsequent measurements on 18 February 2021, showed average concentrations of approximately 108 mg/L for calcium and 22 mg/L for magnesium, resulting in a water hardness value of 306 mg/L CaCO3, closely resembling the preconstruction chemical pattern of the aquifer.
A parallel trend can be observed in the alteration of sodium (Na) and potassium (K) concentrations, which serve as indicators of NaOH and KOH base leakage. Initial values of 65 mg/L and 14 mg/L, respectively, were measured at the construction site in December 2016. After initiating grout application and dewatering operations, sodium and potassium concentrations increased to about 167 mg/L and 47 mg/L, respectively. After the acid injection phase, measurements taken on 18 February 2021, indicated a reduction in sodium and potassium concentrations to approximately 150 mg/L and 18.5 mg/L, respectively.

3. Result and Discussion

3.1. Groundwater Geochemical Evolution

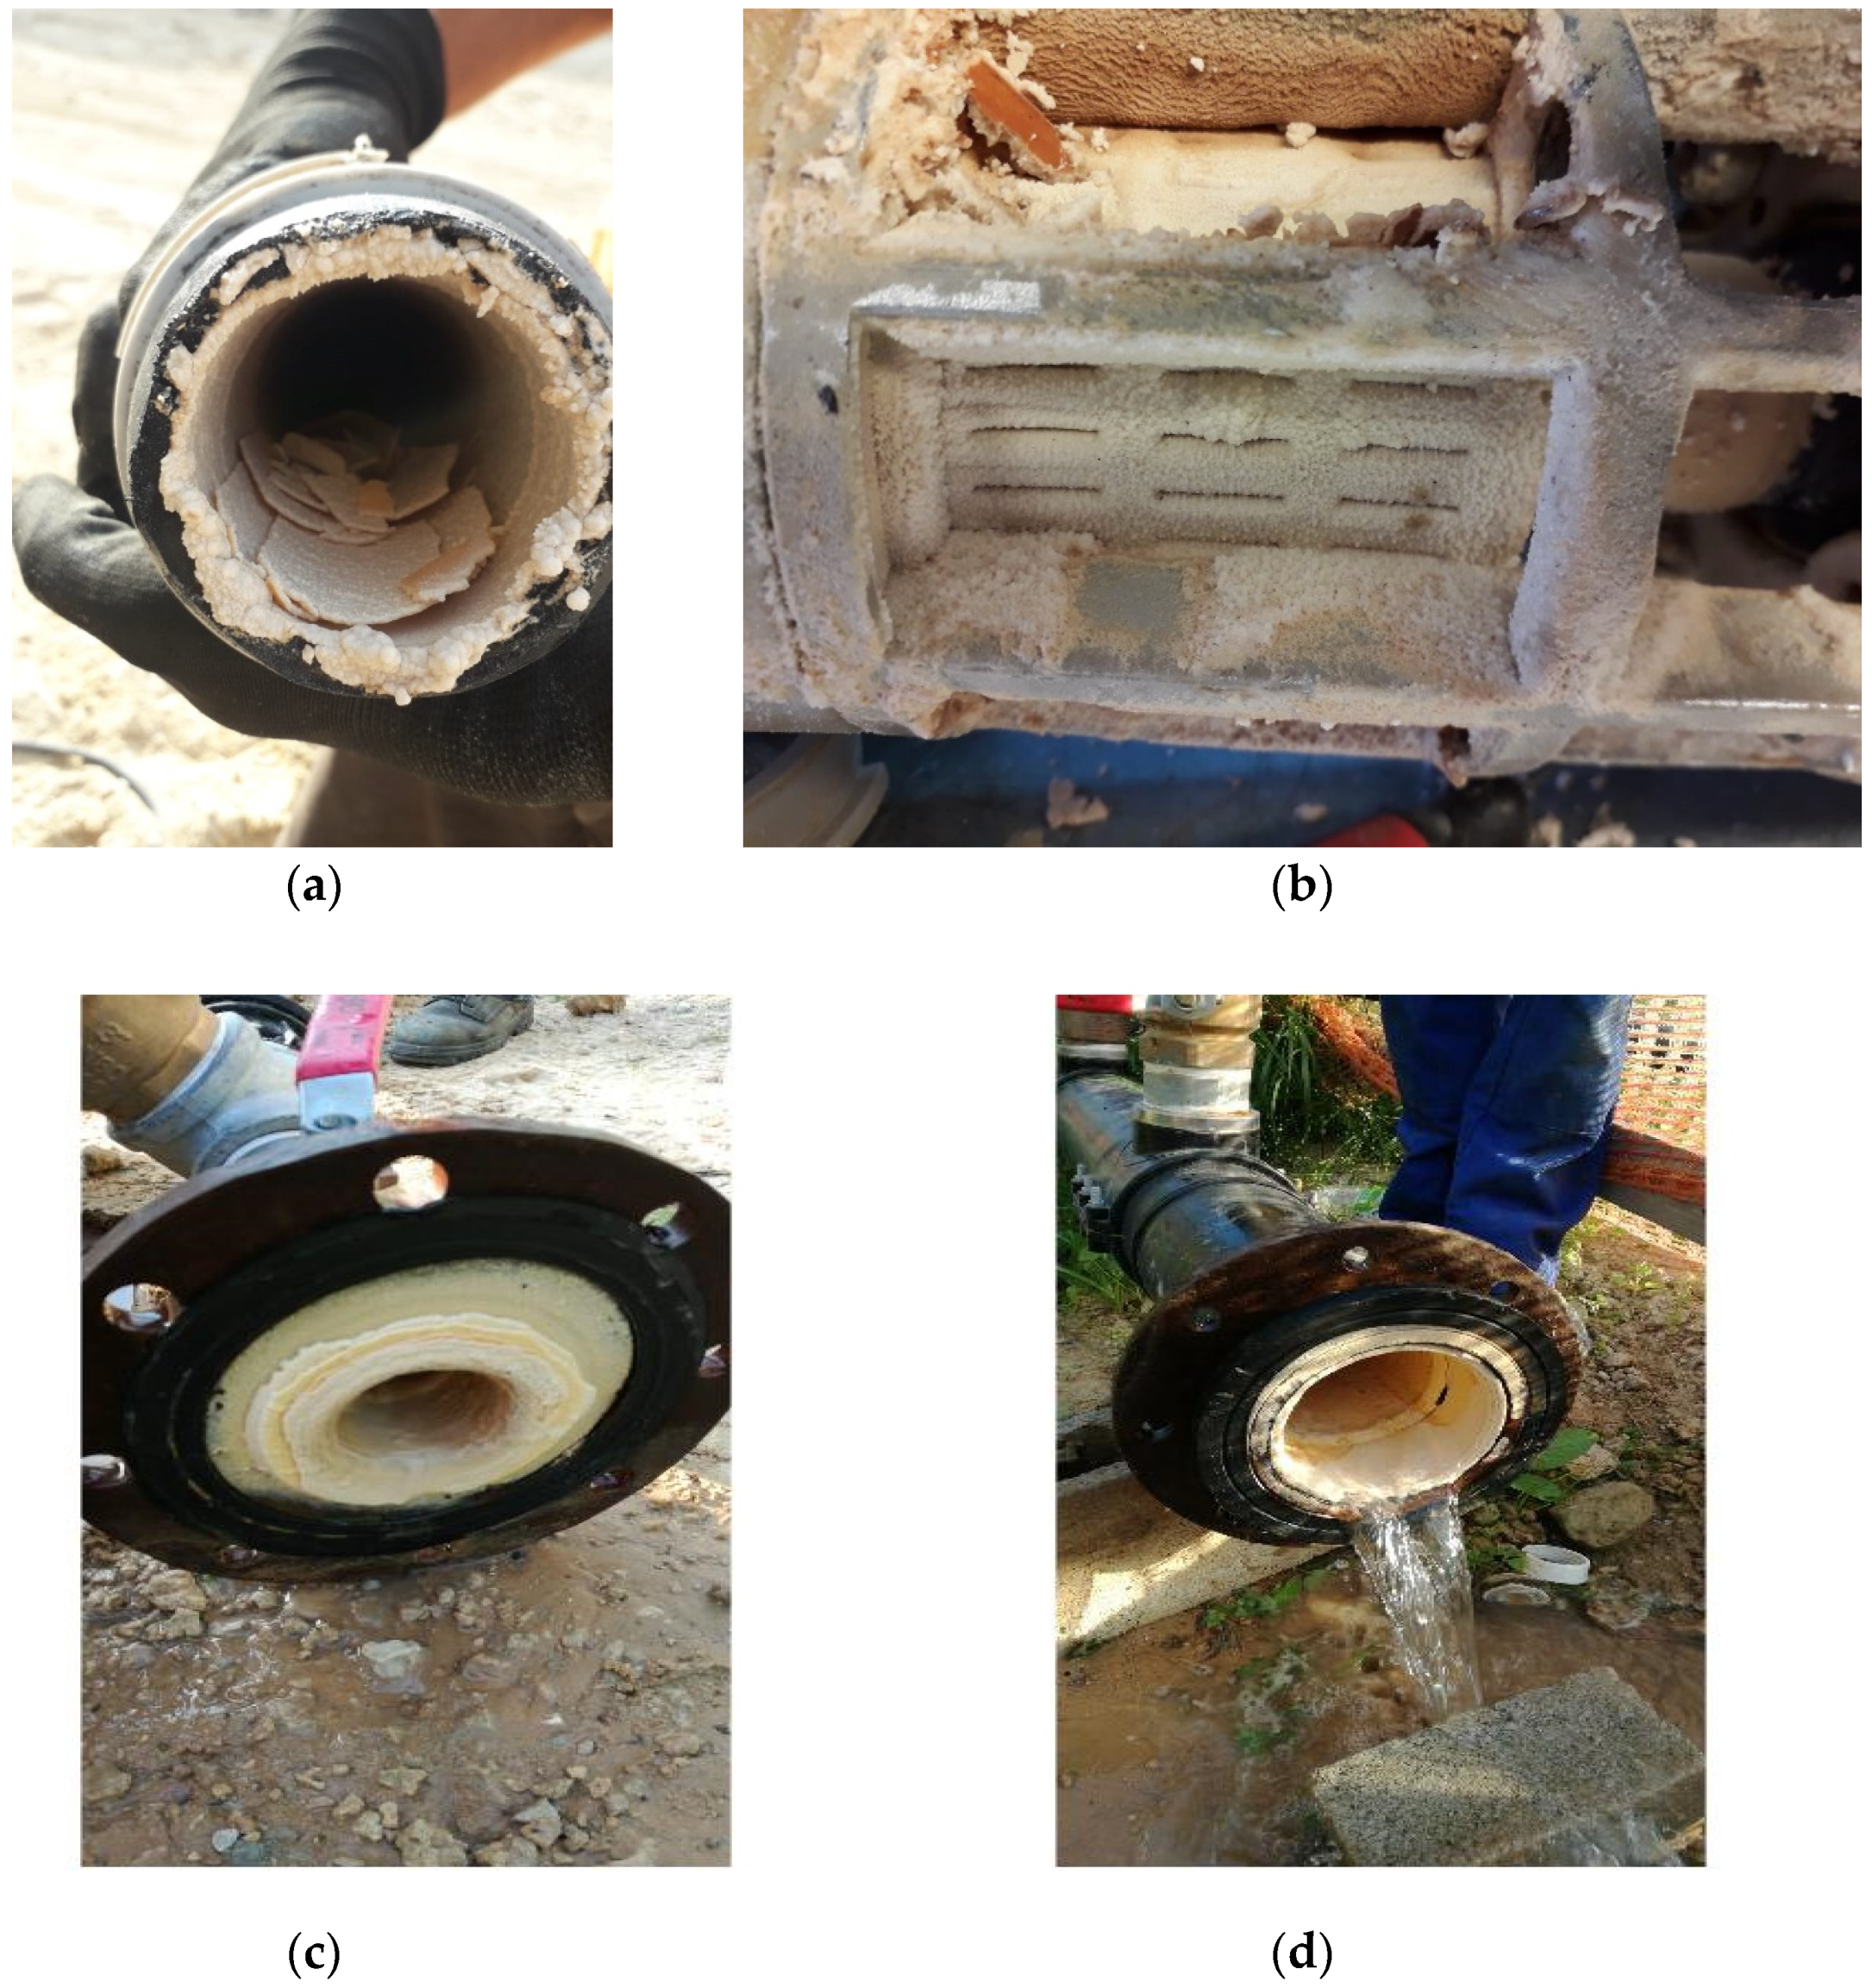
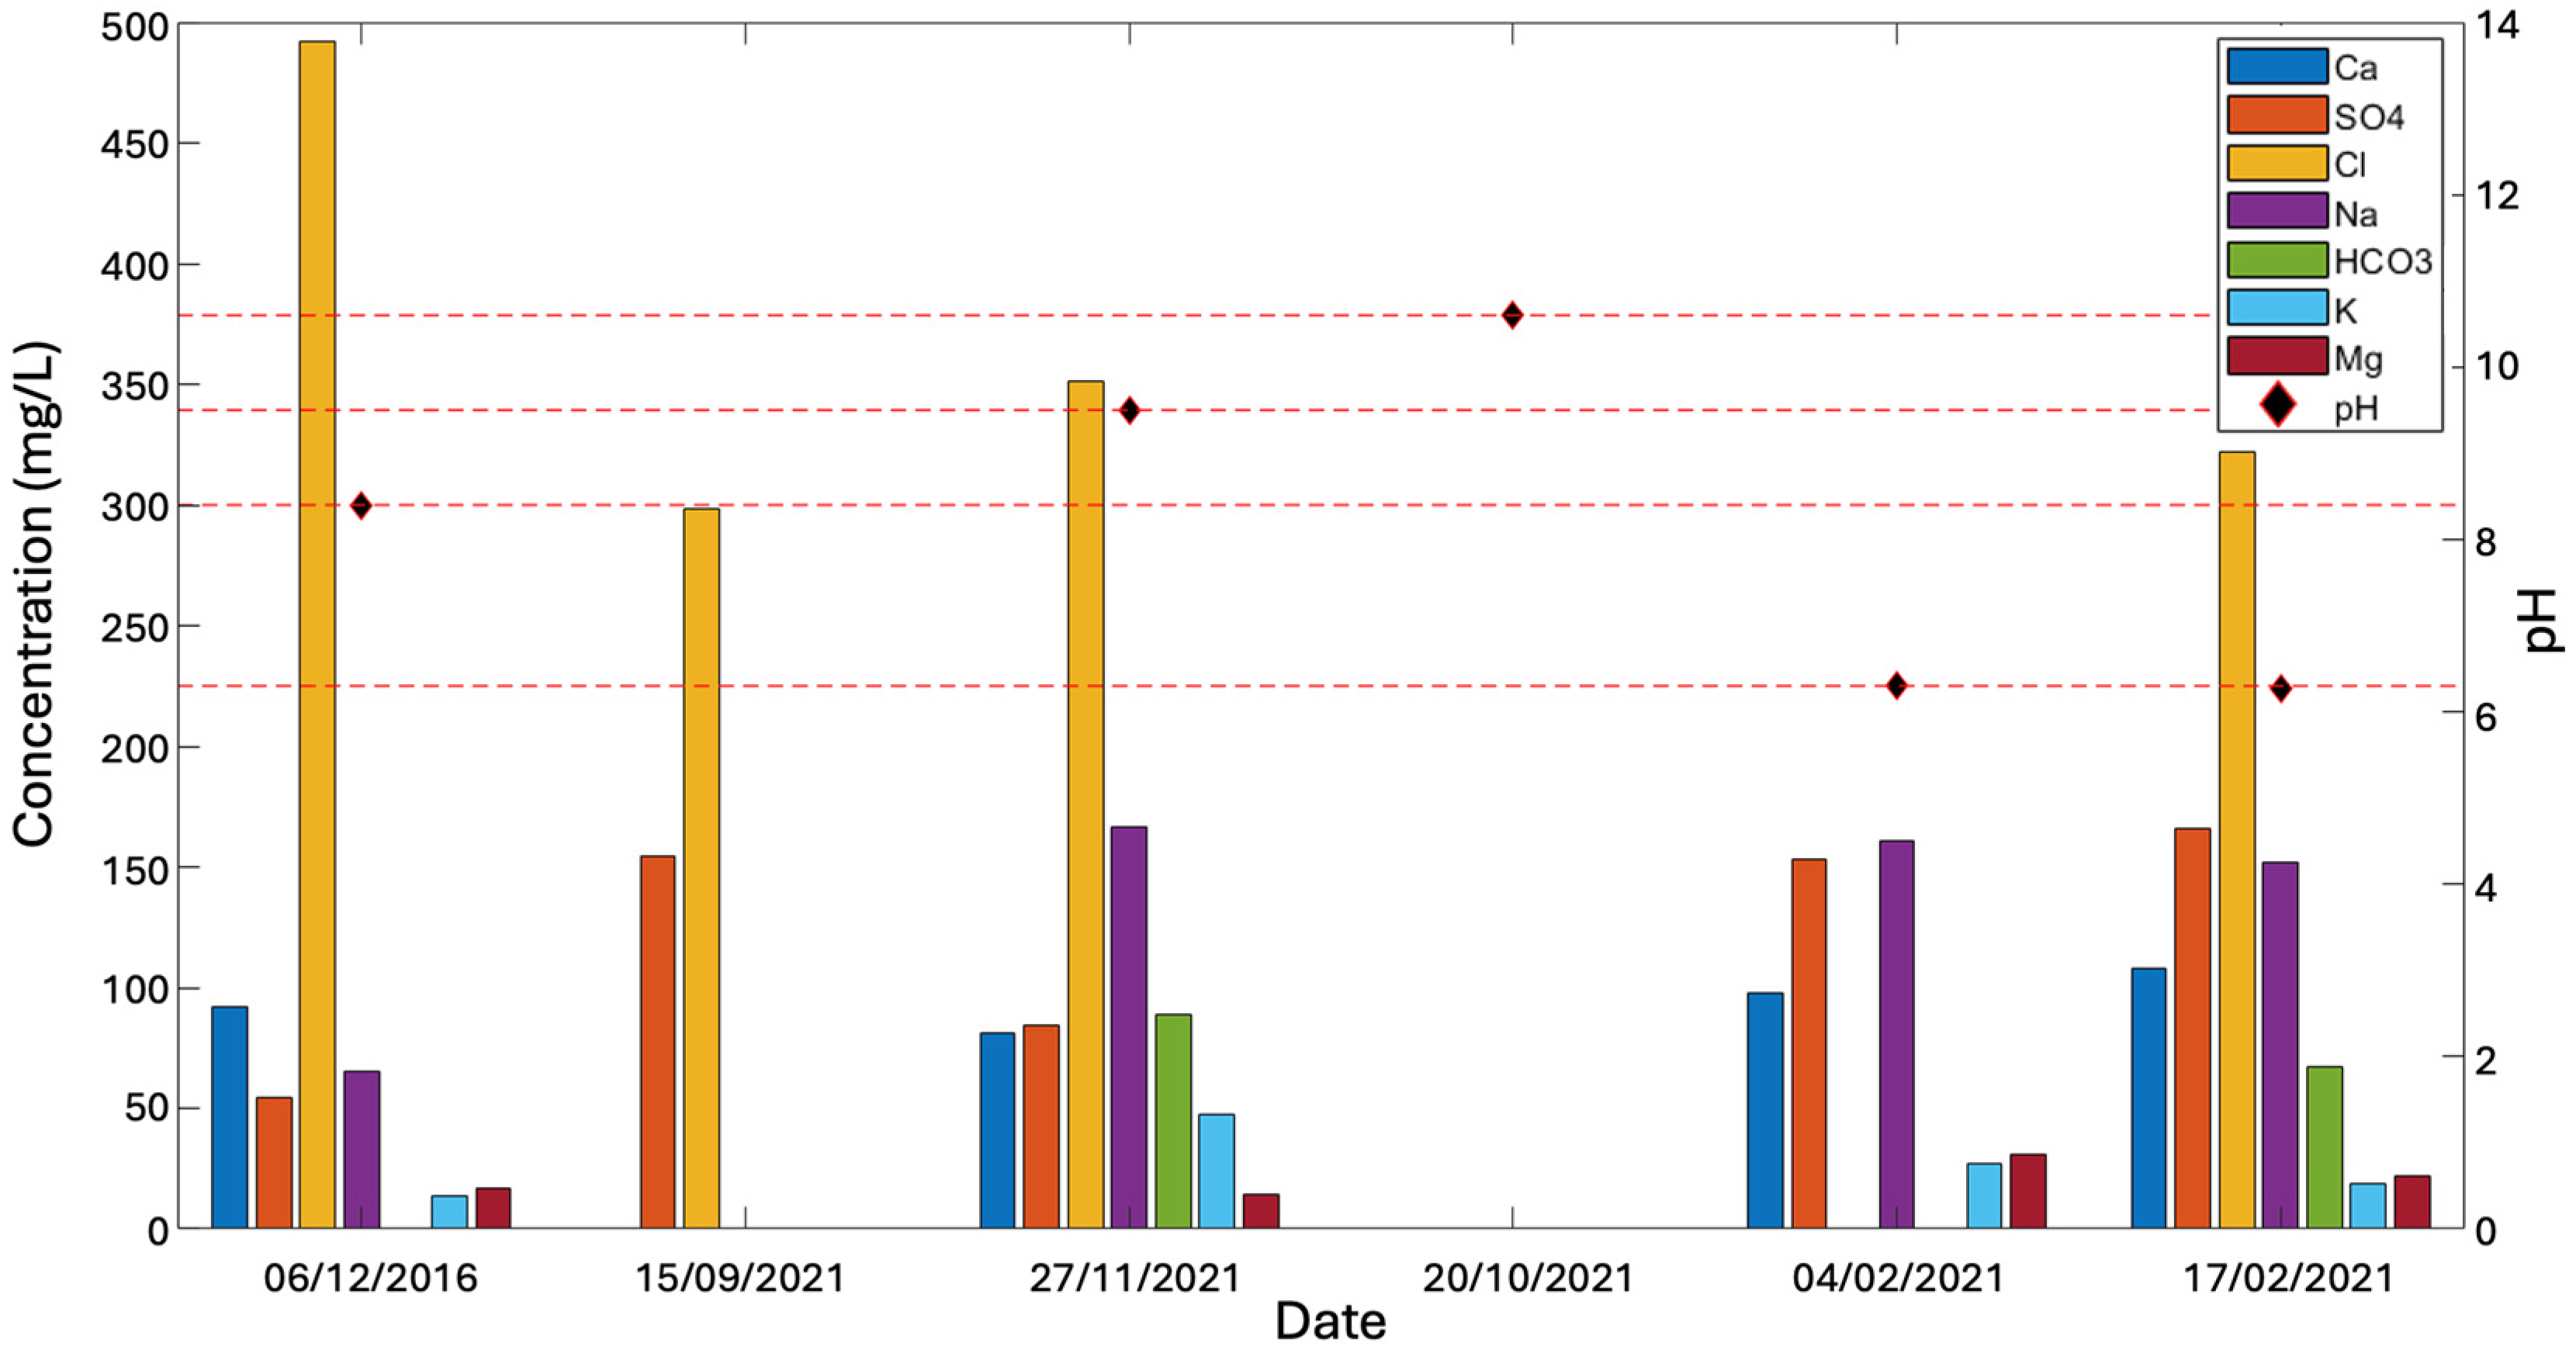
Soon after starting the pumping operations, we observed two related phenomena: a notable rise in groundwater pH and fast calcite buildup on pump walls and well pipes. The substantial rise in groundwater pH can be unequivocally attributed to contact with the grout plug. Evidence of material leakage from the grout is substantiated by notable increases in the concentrations of potassium, sodium, and aluminum, all indicative of grout material leakage, particularly the bases NaOH and KOH. Specifically, the sodium concentration increased 2.5 times, from 65 mg/L in December 2016 to 166 mg/L after the commencement of groundwater lowering in November 2020, while the potassium concentration surged 3.5 times, rising from 14 mg/L in December 2016 to 47 mg/L in November 2020. Additionally, aluminum concentration exhibited an increase from less than 0.02 mg/L in December 2016 to 0.4 and 0.05 mg/L in February 2021.
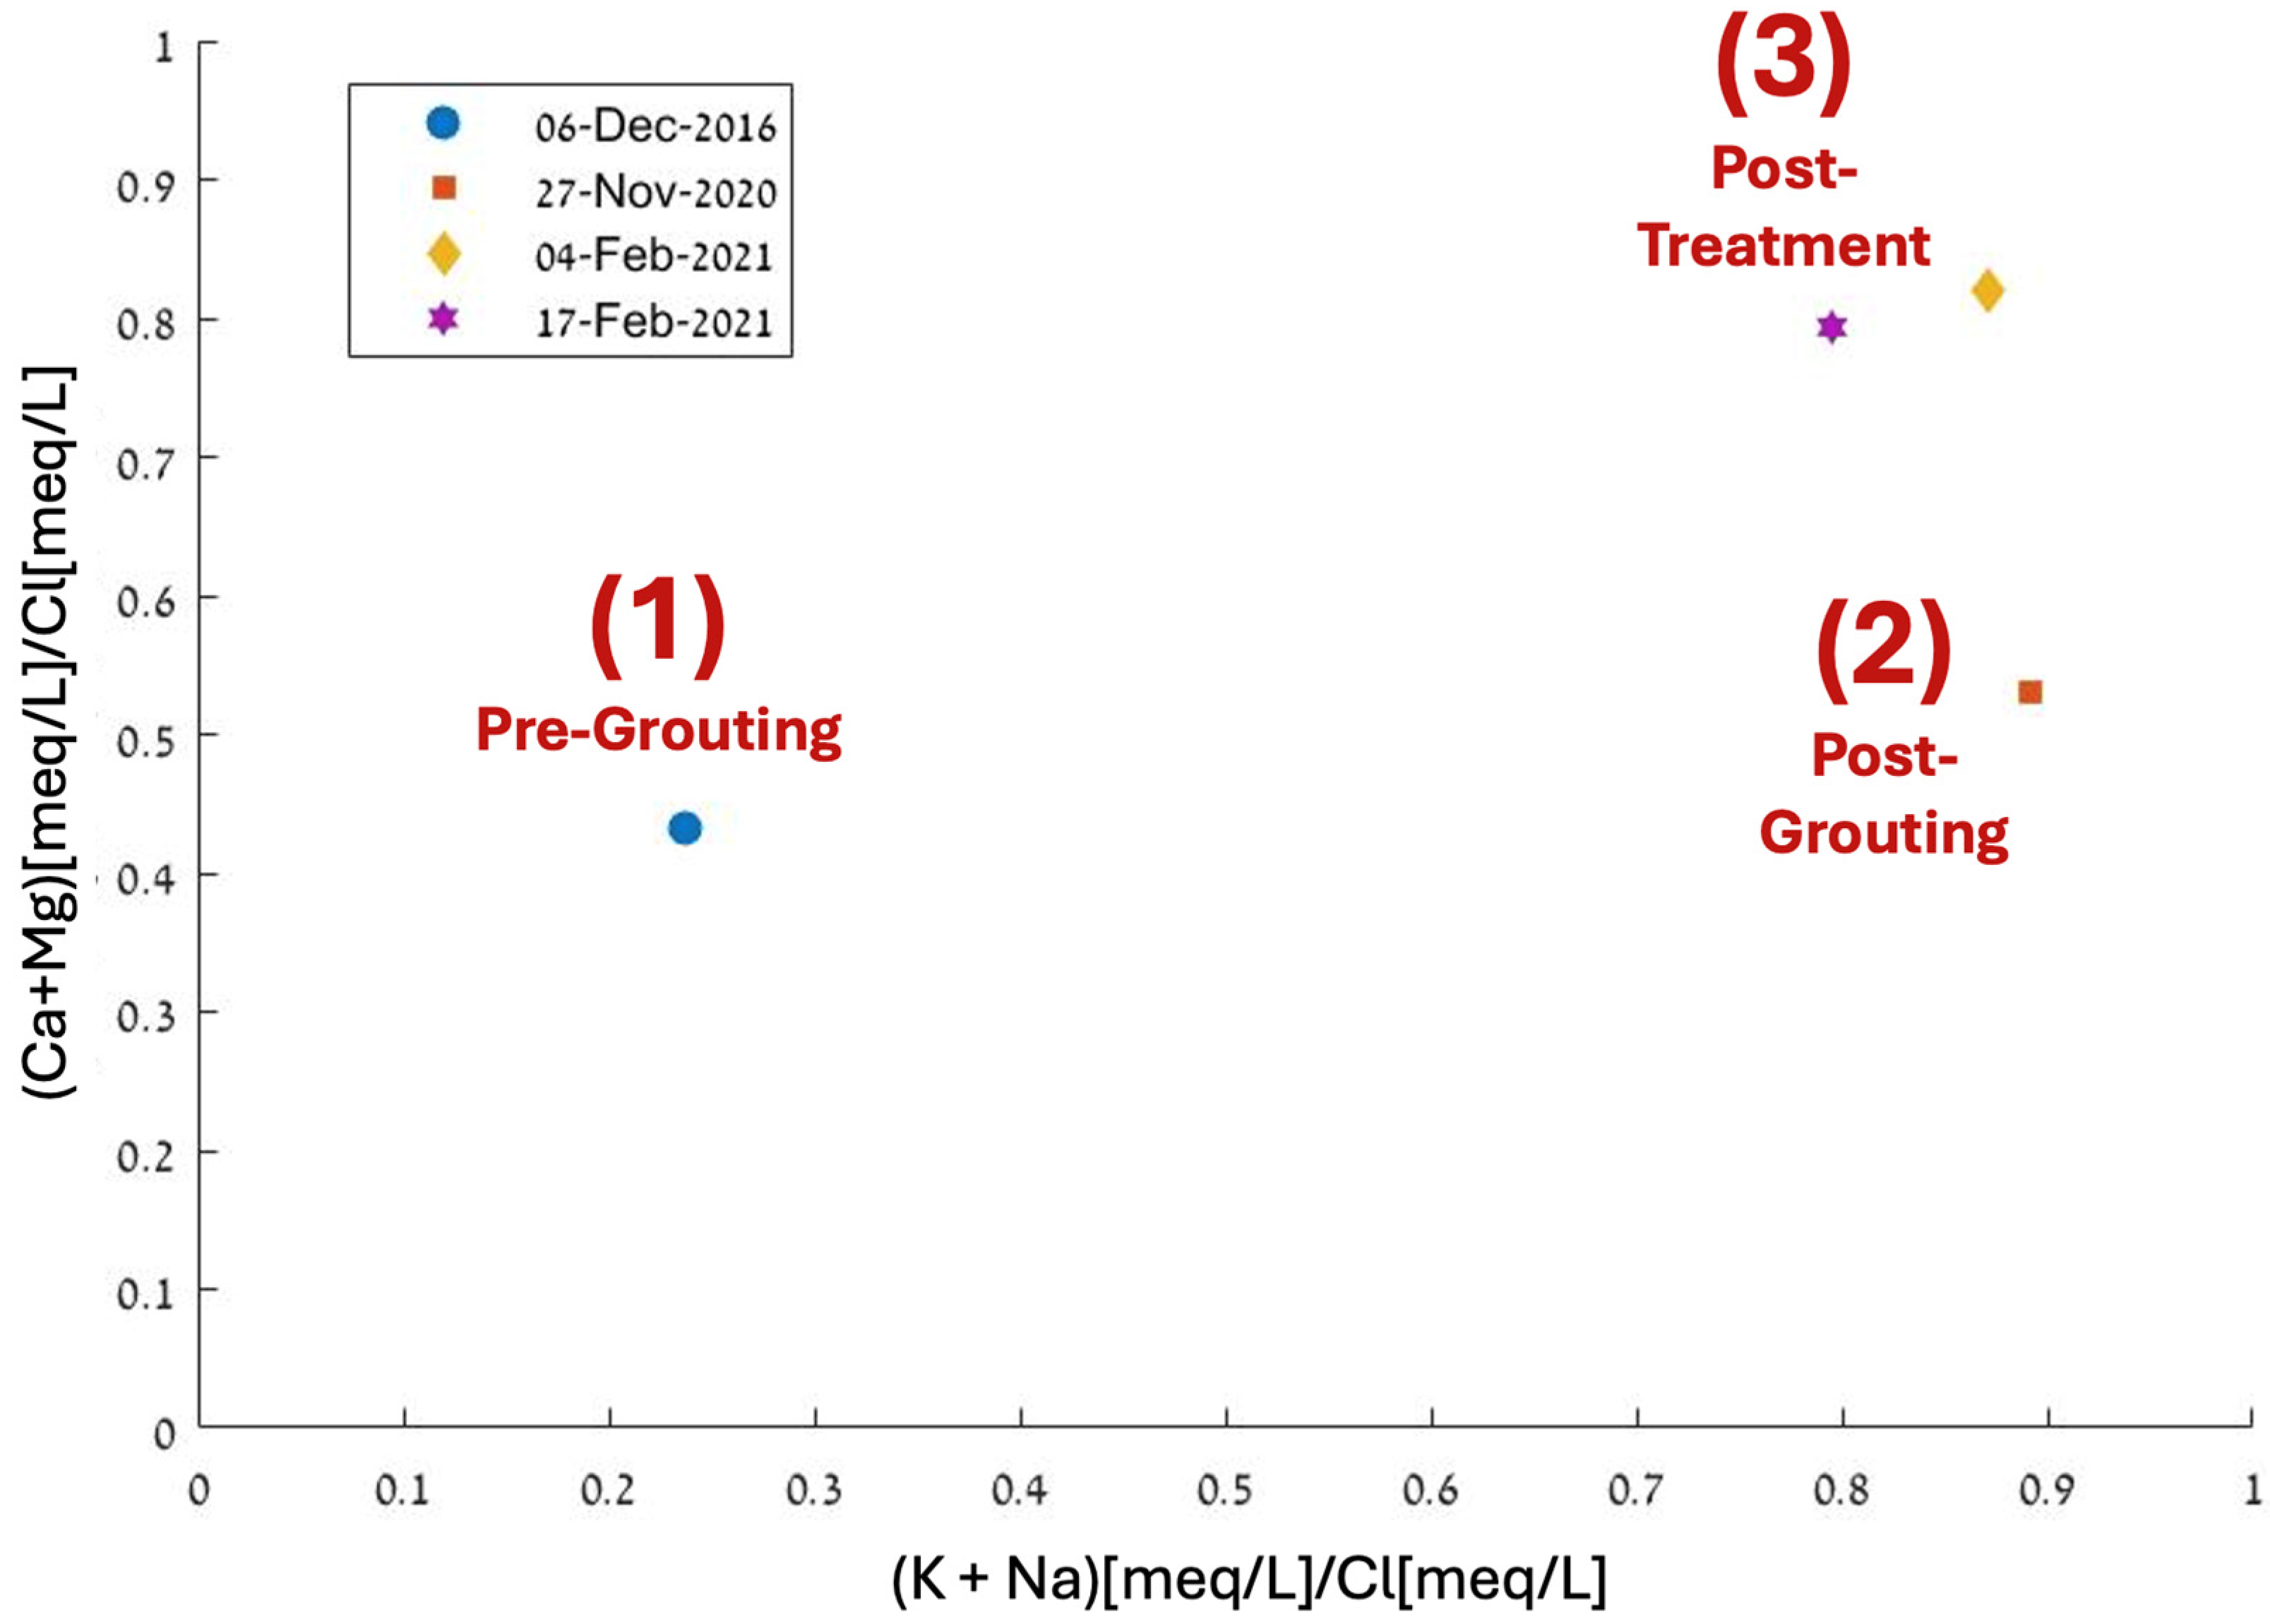
Figure 6 illustrates the groundwater geochemical evolution, with normalized calcium and magnesium concentrations in milliequivalents compared to sodium and potassium concentrations. This view suggests that the impact of sodium and potassium release on the system due to grouting application remains significant despite the acidic treatment, which also increased the availability of calcium and magnesium ions in the groundwater.
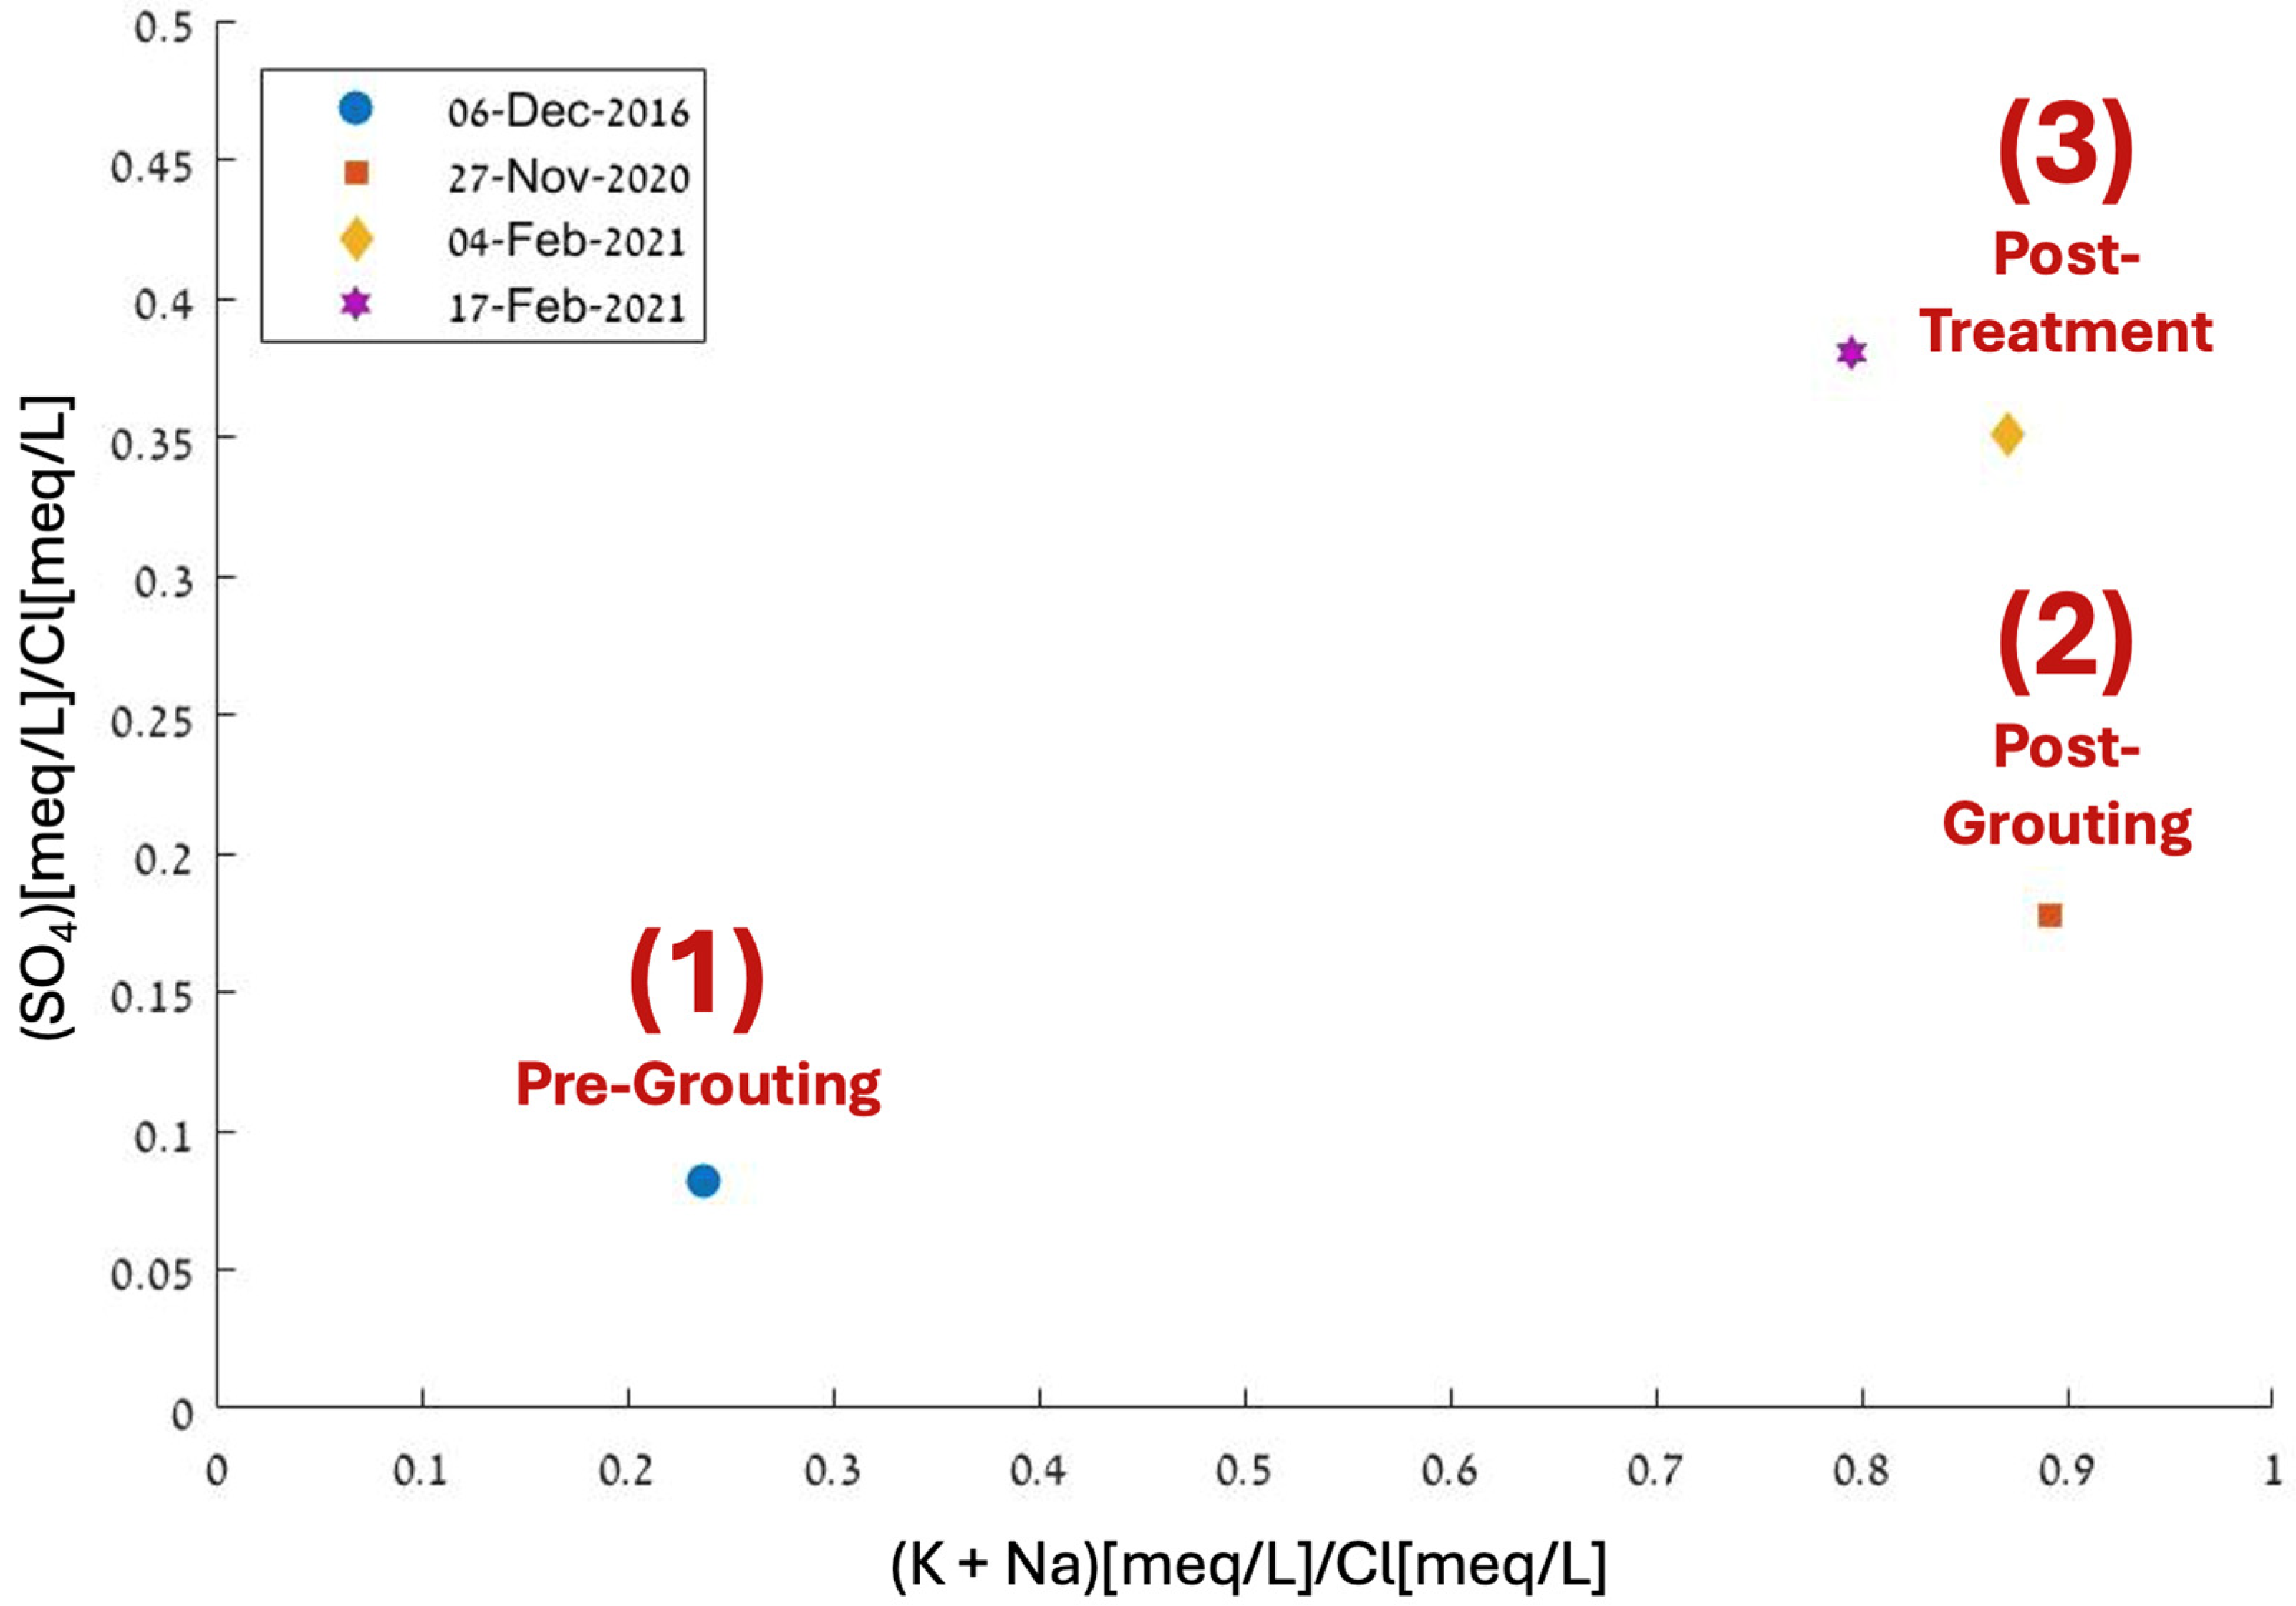
Furthermore, sulfate concentration displayed a dynamic response to grouting and the acidic treatment. Figure 7 demonstrates a slight increase in sulfate concentration as a result of grouting in November 2020. Later, following the introduction of sulfuric acid and the potential for gypsum precipitation, a notable increase in this value was observed after the acid injection.
Lastly, it is worth noting that the aluminum concentration, which may indicate grout leakage, significantly increased compared to measurements taken at the end of 2016, rising from 0.02 mg/L to approximately 0.14–0.4 mg/L in February 2021.

3.2. Impact of Grout on Groundwater

Grout is commonly employed as a sealing material in excavations that intersect groundwater due to its impermeable properties. However, grout leakage can lead to a significant increase in the pH of the surrounding groundwater. This pH rise is often associated with elevated sodium, potassium, and aluminum concentrations, which cannot be attributed to natural interactions with the local rock and regional groundwater. In cases where the groundwater has high hardness values, the precipitation of salts, particularly calcite deposits, may also occur. Several studies have investigated the impact of grout injection into the subsoil on groundwater chemistry. For instance, in a 1995 experiment conducted in Berlin, groundwater samples were collected before and after casting a grout plug at the base of foundations [1]. The experiment revealed a significant increase in pH in the water pumped at the site and a moderate effect on the pH of nearby groundwater. In another study conducted in southern Italy [9], unusually high pH values exceeding 11 and increased potassium, sodium, and aluminum concentrations were observed in an urban water channel in contact with groundwater. This phenomenon was accompanied by the settling of calcite deposits in the channel. Similarly, observations at a nuclear site in Forsmark, Sweden [10], showed extraordinary pH values exceeding 10 in groundwater wells and limestone precipitation in observation wells. These unusual pH values and calcite deposition were partly attributed to the extensive use of grout for constructing the wells and sealing the channels in the area.
Grout’s impact on groundwater, causing higher pH and calcite buildup, is due to its mixture of cement, water, and sand. During the grout hardening process, a highly basic plume is released, raising the pH of the surrounding groundwater [2]. Portland cement, the most common type used, contains four main components: Tricalcium Silicate (C3S), Dicalcium Silicate (C2S), Tricalcium Aluminate (C3A), and Tetracalcium Aluminoferrite (C4AF). These cement components react with water during hydration, resulting in the formation of approximately 40–60% Calcium Silicate Hydrate (CSH), 20–25% Portlandite (Ca(OH)2), 10–20% Hydrated Aluminates, Ferrites, and Sulfates (AFm), 10–20% pore fluids, and 0–5% of NaOH and KOH, which are primarily dissolved in the pore fluids and are strong bases with a high pH. After hardening, CSH is formed, comprising extremely small crystals known as cement gel (a solid with about 28% porosity). A higher water ratio is used than necessary for cement hydration to facilitate cement dilution, resulting in cement pores containing a significant amount of fluid, including the strong bases KOH and NaOH. Groundwater flowing towards the hardened concrete washes dissolves these strong bases and other soluble materials like aluminates [2]. Consequently, a highly basic plume is released into the groundwater from the concrete.
When groundwater contains high concentrations of calcium and magnesium, a precipitation reaction of calcium carbonate and magnesium carbonate occurs. In a basic pH environment, the solubility of these compounds significantly decreases. Indicators of grout leakage primarily include increased concentrations of potassium, sodium, and aluminum, all of which are highly soluble in water [2,9]. A sharp increase in calcium concentration signals the onset of grout degradation [2].

3.3. Common Remediation Solutions

Calcite blockage in wells is a known phenomenon, especially in environments with hard water and high pH levels. The common treatment for local well cleaning and sediment removal is acid injection. The two acids recommended in the literature for treating calcite deposits are hydrochloric acid (HCl) and sulfamic acid (NH2SO3H). Hydrochloric acid is a strong acid and is commonly used [4]. The acid reacts with calcium carbonate to break it down into a soluble calcium chloride salt, CO2 gas, and a water molecule, as described in the following equation:
CaCO3 (s) + 2 HCl (aq) → CaCl2 (aq) + H2O (l) + CO2 (g)
The use of hydrochloric acid requires the coupling of a corrosion inhibitor to protect the iron and steel components of the wells. Additionally, the acid is dangerous to handle, requiring protective gear and stringent safety measures. The other recommended acid, sulfamic acid, reacts with calcite as follows:
CaCO3 (s) + 2 NH2SO3H (aq) → Ca(NH2SO3)2 (aq) + CO2 (g) + H2O (l)
Sulfamic acid is preferred over hydrochloric acid in cases where the well infrastructure is particularly vulnerable to corrosion. It is provided as a powder and is user-friendlier than hydrochloric acid. Typically, it is used in a 20% solution, sometimes combined with a corrosion inhibitor and a wetting agent (a mild detergent) at a concentration of 10% of the acid’s weight. These solutions and their protocols are designed for local well cleaning and do not address changes in the water body’s pH.

3.4. pH Increase and Calcite Precipitation at the Site

To substantiate the connection between the elevated sodium and potassium concentrations and the leakage of NaOH and KOH, several calculations were conducted under the following assumptions: The values measured at the site in December 2016 remained relatively stable until excavation and foundation work were completed. Following grouting and sealing, the water body at the site functions as a closed system without the ingress of external substances. The escalation in sodium and potassium concentrations is a consequence of grout leakage. The concentration of inorganic carbon in the water body remains constant, and the forms within the carbonate system exclusively influence the water’s alkalinity.
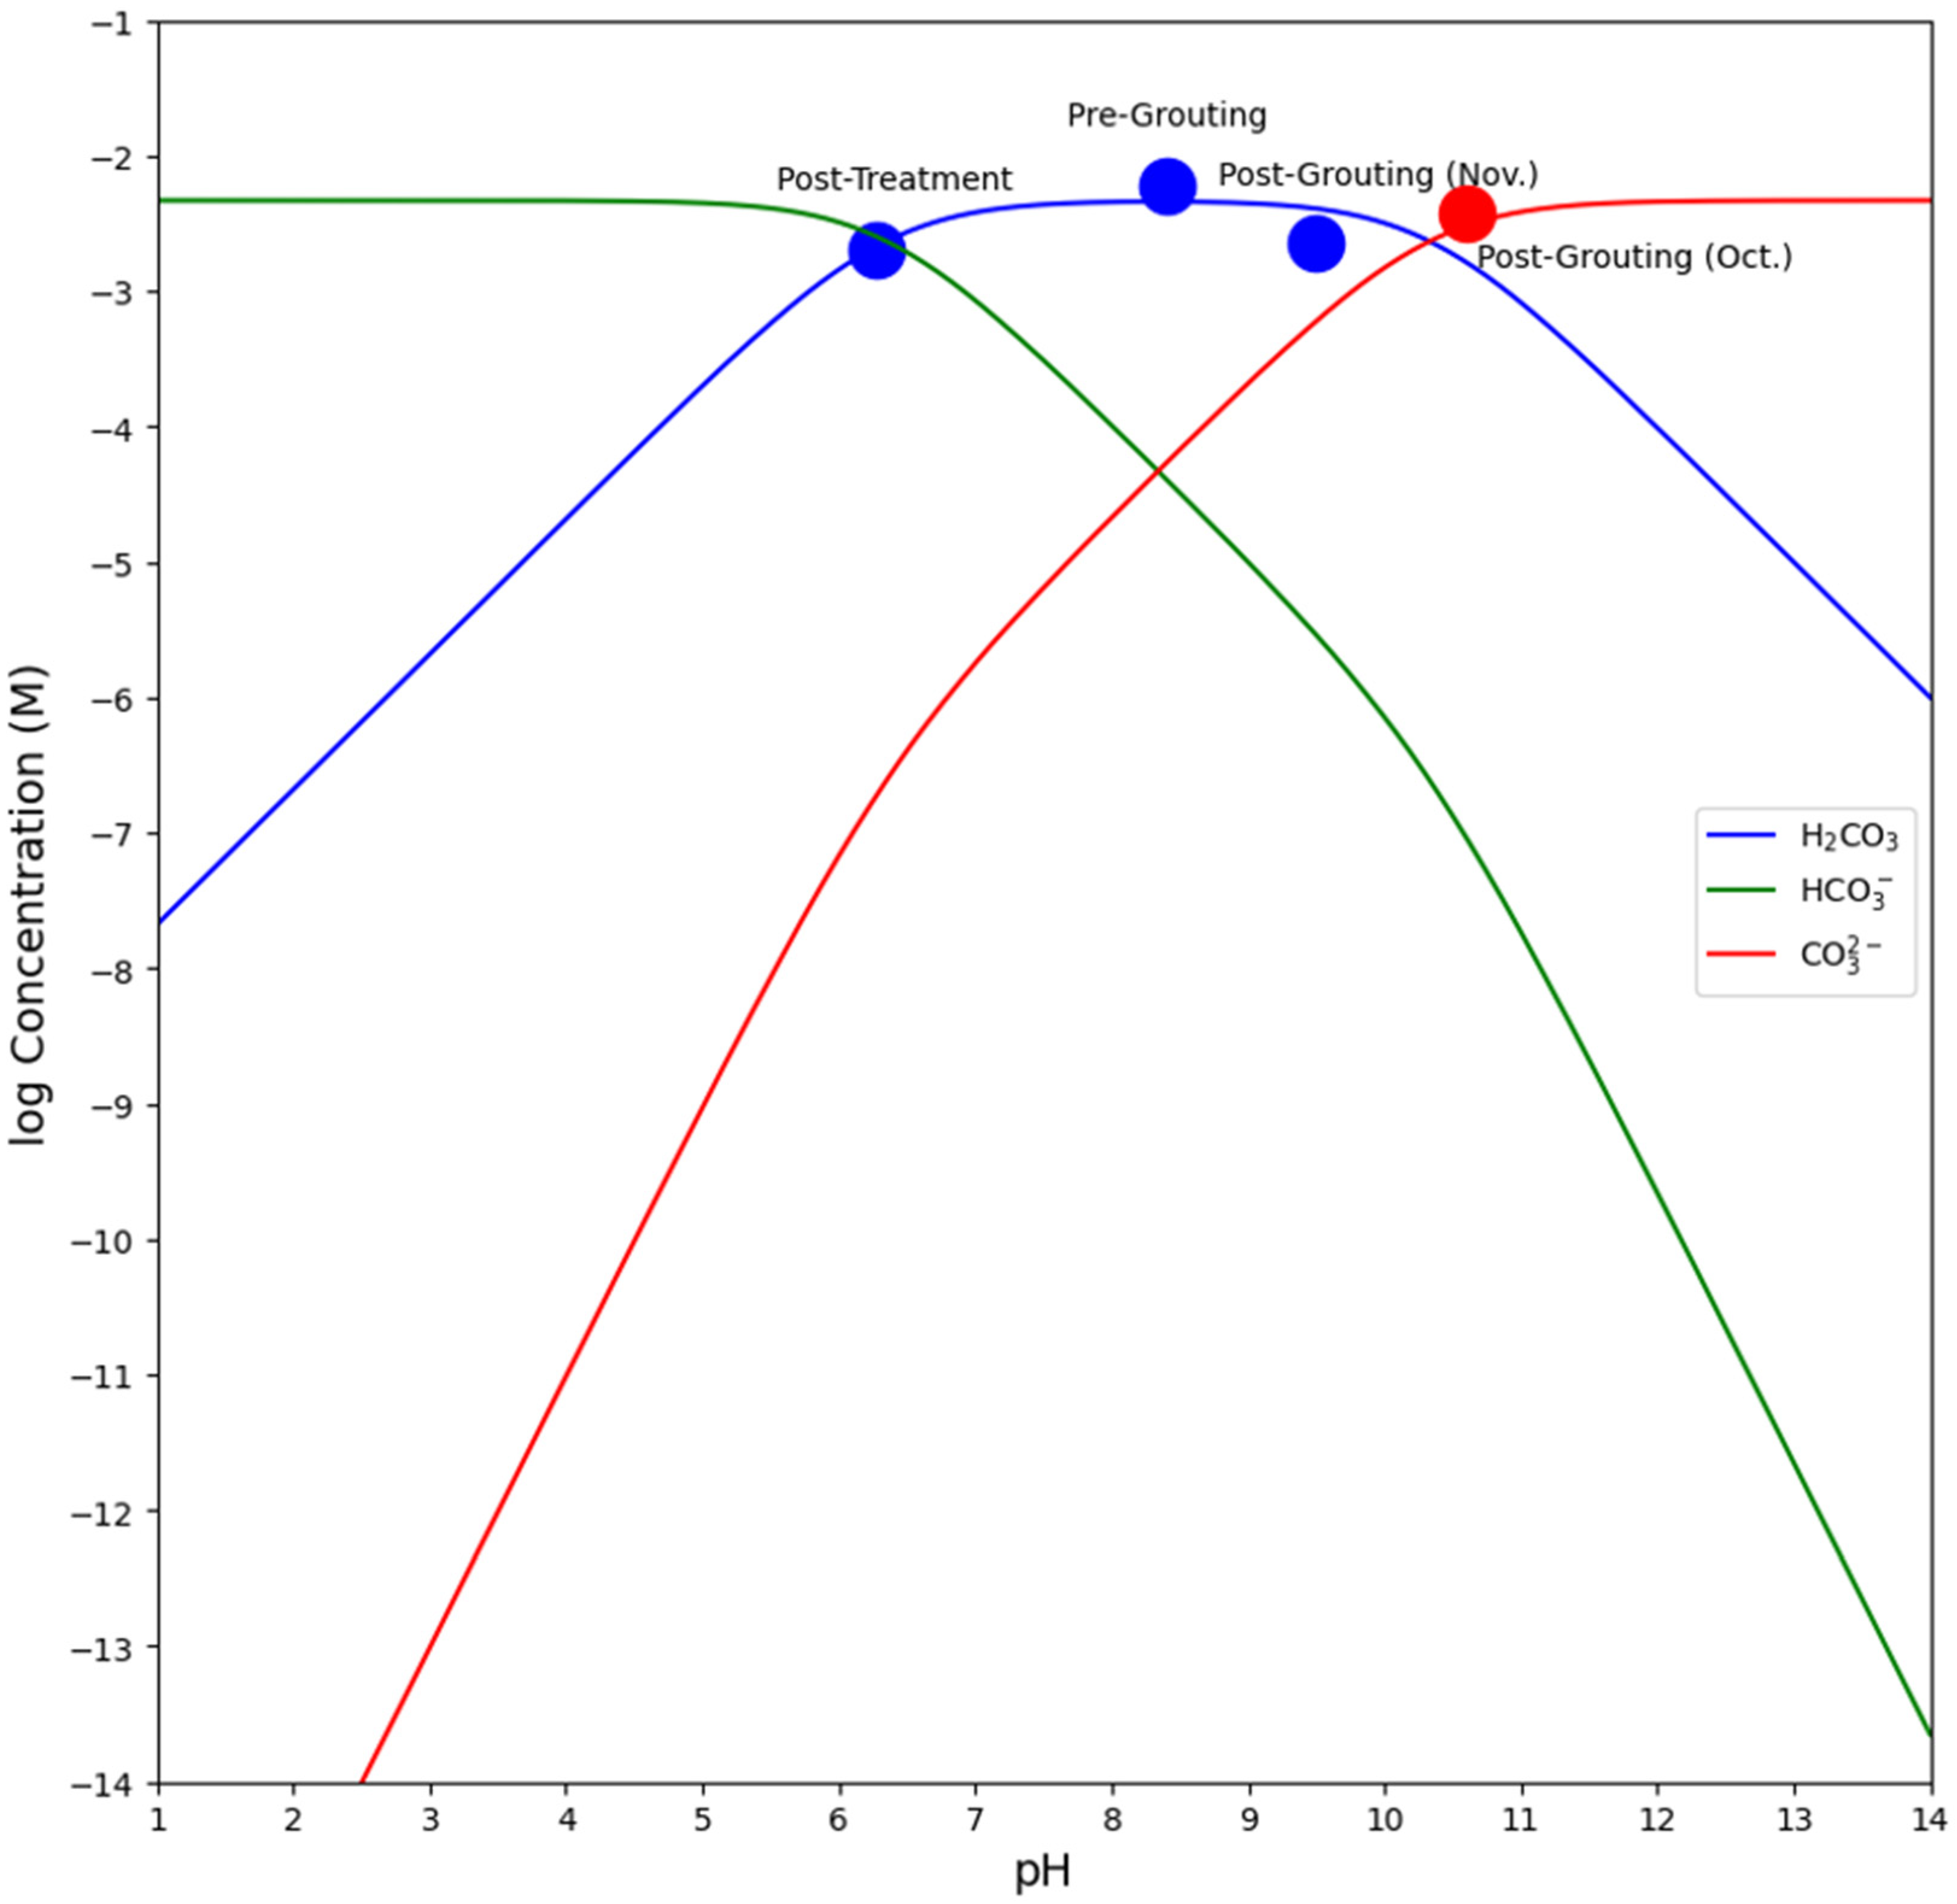
Figure 8 presents a speciation diagram, commonly referred to as a Bjerrum plot, illustrating the evolution of groundwater chemistry at the site. In December 2016, prior to grouting activities, the water exhibited a pH of 8.4, with calcium concentrations approximately 92 mg/L, equivalent to about 2.3 mM. Under these pH conditions, the dominant carbonate species was the bicarbonate ion (HCO3), resulting in an alkalinity equal to twice the calcium concentration:
A l k = 2 C a 2 + = H C O 3
This corresponds to a bicarbonate ion concentration of approximately 4.6 Mm [11]:
C T = H C O 3 + C O 3 2 = 4.6   m M
where CT represents the sum of the inorganic carbon forms in the system.
As grouting commenced, pH levels increased to around 10.6 in October 2020. Consequently, the carbonate system was primarily composed of carbonate ions (CO32−) with a smaller proportion of bicarbonate ions. The equilibrium between these ions is described by the dissociation constant (K2) equation:
K 2 = [ H + ] [ C O 3 2 ] [ H C O 3 ] = 10 10.3
In this state, the concentration of carbonate ions in the system was approximately 3.8 mM, denoted by the red dot in Figure 8. This increase in carbonate ions can be attributed to the rise in pH levels due to the concentration change in sodium and potassium ions. These ions follow stoichiometric ratios identical to hydroxide ions, as represented in reactions (6) and (7):
N a O H + H 2 O = N a + + [ O H ]
K O H + H 2 O = K + + [ O H ]
Measurements conducted between December 2016 and November 2020 revealed an increase in potassium and sodium concentrations of approximately 5.3 mM. This observed increase aligns directionally with the calculated rise of 3.8 mM, indicating a consistent trend despite the quantitative difference. In November, a pH of 9.5 suggested that the bicarbonate ion remained the predominant species in the carbonate system. Subsequent post-treatment measurements in February confirmed the continued predominance of the bicarbonate ion. Two potential factors likely exacerbated the leakage process: firstly, the dilution of cement in a 1:1 ratio, led to excess fluids in the pores containing highly concentrated soluble NaOH and KOH, which were subsequently flushed into the groundwater; secondly, the groundwater flow regime at the site, with eastward groundwater influx inducing westward water flow, exerted pressure on the plug, expediting the release of basic pore fluids toward the water body at the site.
Another important point to emphasize is that calcium concentrations did not change significantly throughout the measurements. Therefore, it can be concluded that the source of calcium is local, from the calcareous rocks and sand, which constitute the main section of the saturated soil at the site. The fact that there is no increase in calcium concentration indicates that there is no contribution of calcium from the cement, and it is not in the advanced stages of degradation. However, the latest measurements showed a moderate increase in calcium concentration, and it may be necessary to conduct further measurements to understand if this is a trend.
The process of calcite scaling in wells can be attributed to three factors: (1) a combination of the high pH values in the groundwater before the start of the work, (2) high hardness values reflected in high calcium concentrations before and after the start of the work, and (3) pumping at high capacities in the lowering process. At high pH values above 10, the dominant form of the carbonate system is the carbonate ion. The carbonate ion reacts with calcium to form calcium carbonate (CaCO3). At high pH values, the solubility of calcium carbonate decreases, leading to calcite precipitation. The groundwater at the start of the pumping was characterized by a high pH of around 11, saturated with calcium and carbonate. Additionally, the pumping at the site had a high capacity of about 75 cubic meters per hour through all the wells, which accelerated the precipitation process.
During pumping, there is a sharp drop in water pressure, especially when the water enters the well through the filter. This process leads to the emission of CO2 into the atmosphere, an increase in carbonate concentration, and accelerated calcite precipitation. In other words, when water is actively pumped out of a well, a significant decrease in water pressure occurs during the dewatering process. This reduction in pressure is particularly pronounced as water moves through the well’s filter, a critical stage where water transitions from the surrounding environment into the well structure itself. This pressure drop has several notable geochemical implications. Firstly, the decrease in pressure facilitates the release of dissolved carbon dioxide from the water. Under pressure, CO2 can be dissolved in groundwater in natural conditions. As the pressure decreases, CO2 gas becomes less soluble, releasing it from the water and eventually emission into the atmosphere. Secondly, the release of CO2 impacts the chemical equilibrium of carbonate species in the water. Specifically, the decrease in dissolved CO2 concentration shifts the equilibrium, leading to an increase in carbonate ions (CO32−). This shift is based on the chemical reactions between CO2, water, and carbonate species, which collectively dictate the forms in which carbon exists in aqueous solutions. Finally, the increase in carbonate concentration directly influences calcite precipitation. Calcite precipitation is more favorable in environments with higher concentrations of carbonate ions. Thus, as the pumping process increases carbonate concentration by reducing CO2 solubility, it inadvertently accelerates the formation and deposition of calcite. Hence, the main precipitation occurred on the pumps and at the bottom of the pipes, where the pressure change was most acute.

4. Site Dewatering System Rehabilitation and Recommendations

Rehabilitation work at the site commenced on 27 January 2021, involving the injection of approximately 2500 kg per week of sulfuric acid, guided by the pH controller in the wells. Subsequently, the measured pH levels decreased to around 6.2–7, and the calcite scaling exhibited a significant reduction or disappearance. It remains unclear whether the injected acid completely neutralized the base released during the cement hardening process and whether a residual basic plume continues to emanate from the cement. The quantity of injected grout contains potentially substantial amounts of the bases KOH and NaOH (up to 5% of the grout mass), some of which have already permeated into the site’s water body and adjacent groundwater. Consequently, it is uncertain how much additional base might be introduced into the system. Furthermore, in the latest measurements (February 2021), carbonate ion concentrations dropped to negligible levels, along with a low concentration of bicarbonate ions, both serving as conjugate bases to carbonic acid and appearing to be neutralized by sulfuric acid. Therefore, the groundwater may currently be sensitive to further acid addition, warranting a localized acid injection solution around the wells with moderate injection rates adjusted according to pH variations.
It is vital to underscore that excessive acid injection, particularly with sulfuric acid, can potentially cause several detrimental effects on the wells and infrastructure. Firstly, sulfuric acid, in the absence of a corrosion inhibitor, can corrode iron components in the system, leading to pipe and pump damage. Secondly, an overly acidic environment may jeopardize the integrity of the cement, as a basic environment is crucial for preventing the decomposition of calcite fractions within the cement (e.g., Portlandite and CSH). Additionally, the acid may dissolve the calcareous rock present at the site. Thirdly, the decomposition of sulfuric acid results in an increase in sulfate concentration, which can react with the calcium in the water and cement, potentially leading to the precipitation of gypsum, as indicated by the following equation:
C a O H + M S O 4 = C a S O 4 + M O H 2
Gypsum precipitation introduces potential challenges, as it can accumulate in cracks, leading to a significant volume increase of up to 120%. Alternatively, gypsum may react with cement materials, resulting in the formation of ettringite crystals, which expand in volume by approximately 200% during crystallization and may induce cement cracking. Consequently, it is advisable to consider replacing sulfuric acid with either hydrochloric acid or sulfamic acid, as recommended in the literature. When working with sulfuric acid, it is crucial to incorporate a corrosion inhibitor and maintain a pH level above 7.
Regarding hydrochloric acid and sulfamic acid utilization, several safety and scientific considerations should be considered. Hydrochloric acid is typically used in a diluted aqueous solution, commonly at a concentration of 10%. This concentration is manageable and safe when handled with appropriate safety measures, including using corrosion inhibitors and antifoam agents to minimize the risk of spillage. For applications requiring acid injection into the well’s bottom, ensuring adequate ventilation is crucial to safeguard against the hazards posed by toxic fumes. It is imperative for personnel involved in the handling of hydrochloric acid to wear protective gear, such as gloves and masks, and to have neutralizing agents like baking soda readily available to address any accidental exposure. Additionally, the storage of hydrochloric acid should be in containers made of materials resistant to corrosion, such as certain plastics specified for scientific use. We emphasize that the concentrations mentioned are based on standard safety and efficacy practices, avoiding using highly concentrated acid forms to mitigate associated risks.
Sulfamic acid, typically provided in powder form, should be prepared as a scientific-grade 20% solution. Like hydrochloric acid, it should be used with scientific-grade corrosion inhibitors and antifoam agents to prevent spillage. Injecting the acid into the well’s bottom is advisable, but it is important to note that while sulfamic acid is generally safe to use, it can pose scientific hazards in concentrated solutions. Therefore, individuals working with sulfamic acid should wear scientific-grade water-resistant gloves and masks and avoid standing near the well during the reaction. Additionally, the scientific use of sulfamic acid typically requires a scientific-grade poison permit, which should be coordinated before procurement.

5. Summary and Conclusions

The accelerated calcite scaling observed at the site is attributed to a combination of factors, including the extensive use of diluted grout, high initial pH values, the presence of water with high hardness due to the calcite-rich environment, and the high flow rates during dewatering operations. To mitigate this issue and prevent calcite scaling while rehabilitating the wells, acid injection is recommended. However, it is important to carefully consider the choice of acid, as sulfuric acid, while effective, may damage the concrete infrastructure. Alternatives like hydrochloric acid or sulfamic acid, with the necessary precautions and poison permits, should be explored.
To proactively prevent similar occurrences, thorough monitoring and measurement of pH values, calcium and magnesium concentrations for water hardness assessment, and examinations of aluminum, sodium, and potassium concentrations to detect potential leakage of basic substances are essential before and after commencing foundation and dewatering works. Monitoring alkalinity through measurements of carbonate and bicarbonate concentrations is also crucial. Elevated pH values above 8 and high water hardness serve as indicators of a site susceptible to sharp pH fluctuations and calcite scaling during pumping, suggesting the use of grout with lower pH or adjusted water/cement ratios. Before initiating pumping activities following foundation works, assessing changes in pH and indicative ion concentrations is critical. Furthermore, conducting dewatering operations at moderate flow rates helps prevent sudden pressure drops, ensuring the integrity of the system.

Author Contributions

Conceptualization, N.Z.D.; methodology, N.Z.D.; investigation, N.Z.D. and Y.T.; writing N.Z.D. and Y.T.; visualization, N.Z.D. and Y.T.; supervision, N.Z.D. All authors have read and agreed to the published version of the manuscript.

Funding

This research received no external funding.

Institutional Review Board Statement

Not applicable.

Informed Consent Statement

Not applicable.

Data Availability Statement

Data are contained within the article.

Acknowledgments

We extend our sincere gratitude to Eng. Eran David, Eng. Dvir Nachmias, Elad Levanon, and Nimrod Scheuer for their invaluable discussions and insightful comments that significantly enhanced the quality of this manuscript.

Conflicts of Interest

The authors declare no conflict of interest. The funders had no role in the study’s design, data collection, analysis, interpretation, manuscript writing, or decision to publish the results. No’am Zach Dvory and Yariv Tsafrir are employees of Etgar A. Engineering company. The paper reflects the views of the scientistsnot the company.

References

  1. Eiswirth, M.; Ohlenbusch, R.; Schnell, K. Impact of Chemical Grout Injection on Urban Groundwater. In Proceedings of the International Symposium Held during IUGG 99, the XXII General Assembly of the International Union of Geodesy and Geophysics, Birmingham, UK, 18–30 July 1999. [Google Scholar]
  2. Gascoyne, M. Influence of Grout and Cement on Groundwater Composition; Possiva: Helsinki, Finland, 2002. [Google Scholar]
  3. Deed, M.E.R.; Preene, M. Managing the Clogging of Groundwater Wells. In Proceedings of the XVI ECSMGE Geotechnical Engineering for Infrastructure and Development, Edinburgh, UK, 13–17 September 2015. [Google Scholar]
  4. MacAdam, J.; Parsons, S.A. Calcium Carbonate Scale Formation and Control. Rev. Environ. Sci. Biotechnol. 2004, 3, 159–169. [Google Scholar] [CrossRef]
  5. Menzri, R.; Ghizellaoui, S. Chronoamperometry Study of the Inhibition of Groundwater Scaling Deposits in Fourchi. Energy Procedia 2012, 18, 1523–1532. [Google Scholar] [CrossRef]
  6. HSI 2018 Annual Water Sources Status Report; Hydrological Service of Israel, Israel Water Authority: Tel-Aviv, Israel, 2018.
  7. Dvory, N.Z.; Elad, M.; Scheuer, N.; Zurieli, A.; Netzer, L.; Lifshitz, Y. Atlas of Geological Cross-Sections and Sub-Basin Maps for the Israeli Coastal Aquifer. 2014. Available online: https://www.researchgate.net/publication/364609385_Atlas_of_Geological_Cross-Sections_and_Sub-Basin_Maps_for_the_Israeli_Coastal_Aquifer (accessed on 1 March 2024).
  8. Hughes, J.D.; Langevin, C.D.; Banta, E.R. Documentation for the MODFLOW 6 Framework; US Geological Survey: Washington, DC, USA, 2017. [Google Scholar]
  9. Vespasiano, G.; Notaro, P.; Cianflone, G. Water-Mortar Interaction in a Tunnel Located in Southern Calabria (Southern Italy). Environ. Eng. Geosci. 2018, 24, 305–315. [Google Scholar] [CrossRef]
  10. Nilsson, A.-C.; Sandberg, B. Elevated pH Values in Groundwater—Observations from SKB Investigations 1976–2014 and Possible Causes. 2017. Available online: https://www.skb.com/publication/2485482/R-16-04.pdf (accessed on 1 March 2024).
  11. Zeebe, R.; Wolf-Gladrow, D. CO2 in Seawater: Equilibrium, Kinetics, Isotopes; Elsevier: Amsterdam, The Netherlands, 2001; ISBN 0-444-50946-1. [Google Scholar]
Figure 1. Location map of the study site over the Pleistocene Coastal Aquifer. This map includes 2018 water level contours as documented by the Hydrological Service of Israel [6]. The contours shaded in maroon indicate the Gush Dan Depression, a result of extensive aquifer exploitation.
Eng 05 00035 g001
Figure 2. Deposition of limescale at the Sumayil North Site, Tel Aviv. (a) Suction pipe section between the well pump and the collector pipe. (b) Water intake opening in the well pump engine. (c) Pipe connection flange. (d) Pipe connection flange to the collector manifold.
Eng 05 00035 g002
Figure 3. A Geological Cross-Section of the Pleistocene Coastal Aquifer across the Gush Dan Metropolis (after [7]). Within a few kilometers of the shoreline, the aquifer comprises four primary sub-aquifers labeled A, B, C, and D. Sub-aquifer A is the most susceptible to pollution, exhibiting rapid changes in water quality. Sub-aquifer B consists of compacted sand and calcareous layers, offering enhanced protection against surface contamination. Sub-aquifer C, characterized by its higher clay content, has reduced permeability, which slows groundwater flow and enhances water storage capabilities. Sub-aquifer D, primarily composed of dense calcareous sandstone, is a vital water storage unit, displaying the most stable water quality due to minimal interaction with the upper layers.
Eng 05 00035 g003
Figure 4. Design overview of diaphragm wall (green rectangles), piles (blue rectangles), jet grouting (crosses mark the jet drill location, and circles mark the engineered jet lateral distribution), and dewatering levels (colored and labeled: −8.07 m, −8.2 m, −8.47 m, −9.3 m, and −12.9 m). Note the elevator shaft enclosed by diaphragm walls (light green rectangles). Black dots indicate pumping wells. Injection wells, situated approximately 45 m northeast, are not depicted. The left-hand section of the project, unoperated during the study period, is not highlighted.
Eng 05 00035 g004
Figure 5. Temporal evolution of pH and ion concentrations (mg/L) at the Sumayil North project site.
Eng 05 00035 g005
Figure 6. Milliequivalent ratios of calcium and magnesium to chlorides compared to milliequivalent ratios of sodium and potassium to chlorides.
Eng 05 00035 g006
Figure 7. Milliequivalent ratios of sulfate to chlorides compared to milliequivalent ratios of sodium and potassium to chlorides.
Eng 05 00035 g007
Figure 8. Carbonate system speciation diagram illustrating variations in species concentrations across pH ranges. Key stages/time points in groundwater geochemical evolution are marked, reflecting changes within a closed CO2 system (CT = 10−2.33).
Eng 05 00035 g008
Table 1. Model layers based on the stratigraphic profile and grouting depths at the construction site.
Depth (masl)Lithology/Grout
+2.0 1 to −7.0Calcareous sand.
−7.0 to −11.0Calcareous sand. The base of this layer is the top of the injection zone northeast of the site.
−11.0 to −17.0Calcareous sand. The base of this layer is the top of the jet plug at the elevator shaft.
−17.0 to −19.0Calcareous sand/jet plug. The base of this layer is the top of the jet plug.
−19.0 to −22.0Calcareous sand/jet plug. This layer’s base is also the base of the jet plug and the diaphragm walls in all the excavation domains.
−22.0 to −32.0Calcareous sandstone. The base of this layer is at the base of the geological unit and marks the base of the injection interval northeast of the site.
−32.0 to −37.0Clay. The base of this layer is at the base of the geological unit.
1 The upper clay layer is not included in the model as the pumping is performed below it.
Table 2. Evolution of pH and ion concentrations (mg/L) at the Sumayil North project site.
Parameter6 December 201615 September 202020 October 202027 November 20204 February 202117 February 2021
pH8.4-10.69.56.36.275
Ca2+92.294-8198108
SO42−54.6154.5984.6153165.75
Cl492.35298.17351.3-322
Na+65.043-166.8161151.75
NO332.7686.4958-61
HCO3--89-67
S2−15.144--5359.25
K+13.88-47.22718.5
Mg2+16.927-14.63122
Br+0.3520.460.921.31.3
Al3+0.02--0.40.1375
Si4+6.33--1413.5
Disclaimer/Publisher’s Note: The statements, opinions and data contained in all publications are solely those of the individual author(s) and contributor(s) and not of MDPI and/or the editor(s). MDPI and/or the editor(s) disclaim responsibility for any injury to people or property resulting from any ideas, methods, instructions or products referred to in the content.

