Article

Contribution of Metastable Oxygen Spectra to Fluctuated Waveform Tails after Breakdown Time in Air under Positive and Negative Impulse Voltages

by
Muhammad Ikhwanus
1,2,* and
Takeshi Morimoto
1
1
Graduate School of Science and Engineering, Kindai University, Osaka 577-8502, Japan
2
Electrical Department, Malikussaleh University, Lhokseumawe 24351, Indonesia
*
Author to whom correspondence should be addressed.
Eng 2024, 5(3), 2264-2279; https://doi.org/10.3390/eng5030117
Submission received: 2 August 2024 / Revised: 24 August 2024 / Accepted: 27 August 2024 / Published: 9 September 2024
(This article belongs to the Section Electrical and Electronic Engineering)

Abstract

:
In this study, we explored the correlation between fluctuated waveform tails under both positive and negative impulse voltages and their corresponding spectral lines during millisecond observations of arc discharge. We examined impulse voltages in ±100, ±125, and ±150 kV across 3, 3.5, and 4 cm gaps using spectroscopic analysis focused on oxygen excitations. Six selected spectra in ±100, ±125, and ±150 kV at 3.5 cm and two negative spectra of −100 kV at 3 and 4 cm were analyzed by identifying spectral lines in the wavelength range of 200–900 nm. The results revealed a correlation between the fluctuated waveform tails and spectral lines in positive voltage discharges, which were almost similar, while in negative voltage discharges, this correlation was found only in −100 kV at 3 and 4 cm. We concluded that during the spark phase for both positive and negative voltage discharges, symmetrical fluctuation in the waveform tails was observed after breakdown time, especially above the voltage level of the recombination phase. This suggested the presence of energetic oxygen excited states in the 200–400 nm range, with higher peak intensity than the O I line at 777.417 nm, observed in most positive impulse voltage discharges and at −100 kV with 3 and 4 cm gaps, contributing to rapid breakdown.

1. Introduction

Under normal conditions, atmospheric air serves as an effective insulator, allowing a charged object or isolated item to gradually lose its charge when surrounded by air. This occurs because the air usually has a limited number of mobile charge carriers, commonly referred to as atmospheric ions. However, situations can arise where a charged object interacts with its grounded surroundings in a way that significantly increases the local concentration of ions. This situation is recognized as an electric breakdown, a localized event happening within an insulating medium like air when it is exposed to a high voltage difference. Breakdown initiates at the point within the insulator where the electric field strength surpasses the local dielectric strength of the material.
A comprehensive study of discharge initiation in air is influenced by voltage and electrode gaps. Understanding the mechanisms behind electrical discharges is crucial for various industrial applications, particularly in high-voltage environments. The research findings are particularly relevant for the design and operation of high-voltage circuit breakers, which are vital for the safe and reliable functioning of electrical power systems. High-voltage circuit breakers need to effectively interrupt the current flow during fault conditions, and their performance is significantly impacted by the characteristics of electrical discharges occurring during switching. By exploring the relationship between voltage, gap distance, and arc duration, this study provides valuable insights that can help optimize circuit breaker designs and enhance their operational reliability. Beyond circuit breakers, the results may also impact other applications such as high-voltage switching devices, contactors, and lightning protection systems.
Numerous researchers have investigated highly non-uniform electric fields to examine corona discharges in both short [1,2,3,4,5] and long gaps [6,7]. Such discharges can be initiated before a full breakdown (spark) occurs within the gap, a topic widely explored in various studies. The ionization zone of the corona discharge is demarcated by the critical ionization field value for atmospheric air, which is typically estimated to be around 25 to 30 kV/cm [8]. Through experimental investigations, researchers have reviewed breakdown characteristics across different electrode geometries or configurations, employing varied types of applied voltages, including Direct Current (DC) and Alternating Current (AC), and examining diverse gap distances [2,3,4]. This has provided insights into breakdown phenomena in air. In laboratory conditions, air discharge breakdown refers to the transition of gas in air from an insulating state to a conductive one, enabling the flow of electric currents. This critical transformation occurs when the applied electric field intensity exceeds a certain threshold, known as the breakdown voltage. Beyond this threshold, air molecules become ionized, forming a conductive pathway for electrical current.
Impulse voltage in air refers to a graphical representation of electrical voltage over time during the electrical discharge process in the air or other gases. Many researchers have conducted experimental investigations to determine how the wavefront/tail time influences the characteristics of impulse breakdown voltage [9,10]. Researchers have also examined the breakdown voltage characteristics of combined air gaps under positive and negative lightning impulses when there are floating conductors in the air gap [11]. Hogg et al. investigated ignition based on the polarity effects on the breakdown of short gaps in a point-to-plane configuration in air. He found that the critical distance is dependent on the HV point electrode radius and gas pressure, with the critical distance decreasing as gas pressure increases [3].
Waveform characteristics, including the tail, influence breakdown time and the presence of metastable atoms, can modify both statistical and formative time lags, which are essential for determining breakdown time. The statistical time lag relates to the initial electron production, while the formative time lag involves ionization and transit time mechanisms. Changes in ionization and electron dynamics due to metastable atoms affect these time lags, thereby influencing breakdown phenomena. Understanding fluctuations in waveform tails during impulse voltage discharge, caused by atomic metastable states, provides valuable insights into breakdown time phenomena. Korolov et al. [12] demonstrated that He/N2 mixtures impact the ionization rate and the associated time lags in the breakdown process. They observed that the sheath collapses for a short time interval during the local sheath collapse and that controlling the Electron Energy Probability Function (EEPF) via Voltage Waveform Tailoring (VWT) can strongly enhance the generation of helium metastable and atomic nitrogen by more than one order of magnitude.
In high-voltage testing, understanding these fluctuations is essential for accurately assessing equipment performance under surge conditions. Fluctuations in the waveform tail can affect the synchronization and output characteristics of impulse voltage generators, impacting the reliability of test results. EEPF and electron heating mechanisms can be altered in environments where oxygen transitions occur. The presence of metastable atoms modifies electron heating within the plasma, impacting the effective electron temperature and, consequently, the waveform tail during discharge. There is significant electron heating in the electronegative core and a highly effective electron temperature that increases with increased applied voltage when operating at 10 mTorr [13].
To study the stochastic mechanism of the spark, numerous works have been conducted by researchers. Systematic experimental research by the Les Renardières Group significantly advanced the understanding of long air gap discharges under impulse voltages. Their experiments demonstrated that spark discharges in air gaps exhibit inherent randomness when subjected to impulse voltages, a critical factor in understanding the initiation and propagation of discharges. The group also explored the transition from streamers to leaders, a key phase in spark discharge development, which is crucial for predicting breakdown behavior in high-voltage applications [14]. In our previous studies [15,16], which focused on breakdown time through spectroscopic analysis, we observed that positive impulse voltages of +100, +125, and +150 kV at a 3.5 cm gap, as well as voltages ranging from +48 to +75 kV in the increments of +6 kV at a 3 cm gap, exhibited similar waveform and spectral trends. Both our previous studies for positive impulse voltages showed identical patterns in the fluctuated tails of their waveforms. Spectral analysis suggests that these fluctuations at positive impulse voltage discharges correspond to metastable oxygen distributions. Further, to investigate the cause of these fluctuated waveform tails after breakdown time in most positive impulses, we need to validate them with obtained spectra from negative impulse voltage discharges. Understanding the behavior of electrical discharges, particularly in laboratory settings and practical applications, requires a thorough analysis of voltage or current waveforms through spectroscopic analysis. The shape and characteristics of these waveforms play a crucial role in determining the behavior of air discharges, influencing factors such as breakdown voltage, the intensity of spectral emissions, and the formation of particles within plasma channels. Despite their importance, the specifics of voltage breakdown waveform tail characteristics remain largely unexplored. By studying waveform tail fluctuations after breakdown time, engineers can better predict and mitigate their effects on breakdown time phenomena, enhancing the safety and reliability of high-voltage equipment.
In this study, we examined the fluctuations observed in the spark phase, focusing on the fluctuated waveform tails of impulse voltages to clarify the characteristics of the underlying accelerated breakdown processes in the air due to metastable oxygen distribution. This investigation involved detailed spectroscopic observations to elaborate on the physical phenomena at play. We applied impulse voltages of different polarities at ±100, ±125, and ±150 kV across 3 cm and 3.5 cm gaps and −100, −125, and −150 kV at 4 cm gaps to investigate the trends of fluctuated waveform tails corresponding to their spectral lines. The resulting spectra were analyzed focusing on specific atomic line (oxygen) distributions in the air within a channel discharge to understand better the differences in fluctuated waveform tails between positive and negative voltage discharges. This exploration aimed to describe the spectral phenomena manifesting during electrical discharges in air, where various processes such as oxygen atom excitation and neutralization may occur in fluctuated waveform tails. Through spectroscopic emissions, we gained insights into the physical properties of impulse voltage discharges considering the fluctuated waveform tails. The study considered the effects of fluctuated waveform tails on the breakdown times associated with metastable oxygen distribution in both impulse voltages. The transition of metastable oxygens was analyzed through their distributions on impacting the breakdown times by observing spectra during arc discharge.
By analyzing the emission spectrum of arc discharges corresponding to the waveform tails of impulse voltages, we can identify specific atomic species present and understand the processes occurring within the air. Our study aimed to uncover the physical mechanisms underlying the fluctuated waveform tails associated with their spectral lines during breakdown or spark channels in the spark phase. We closely examined the relationship between fluctuated waveform tails in positive and negative impulse voltage trends. These signals were investigated through the dominant oxygen atomic spectral lines of discharges in the 200–900 nm wavelength range, comparing the 200–400 nm range as excited atoms to the O I line at 777.417 nm as a neutral atom in the spark phase. In the next section, the experimental platform is described, along with the method used to determine the fluctuated waveform tails. Section 3 presents the results, starting with the breakdown voltages corresponding to their spectral lines, followed by the identification of spectra and oxygen distribution. In Section 4, both positive and negative voltages are analyzed in relation to their oxygen distributions, the fluctuated waveform tails, and breakdown time. Finally, Section 5 presents the conclusions.

2. Materials and Methods

Figure 1 shows our experimental approach utilized high impulse voltage discharges in both positive and negative configurations, employing a Marx Generator as the source for DC positive and negative impulse voltages with a voltage divider resistor of HV divider 1:4000. We conducted tests with voltages of ±100, ±125, and ±150 kV across gap distances of 3 and 3.5 cm, as well as −100, −125, and −150 kV at 4 cm between two tungsten electrodes in a horizontal point-plane configuration inside a Faraday cage under Standard Temperature and Pressure (STP) conditions of 20 °C (293 K) and 101.3 kPa. The point geometry has a sharp edge (tip diameter) with a diameter of approximately 1 mm, base diameter of 20 mm, and height of 50 mm. In this setup, the point electrode was subjected to either a positive or negative voltage while the plane electrode was grounded. Capturing impulse voltage signals, a Texio DCS-1054B high-speed oscilloscope, Texio Technology Corporation, Yokohama, Japan, was utilized with a sample rate of 1 GSa/s and a bandwidth of 50 MHz to record the arc voltage discharge signals. Additionally, we employed a Flame-S Ocean-optics spectrometer, Ocean Insight, Orlando, FL, USA, positioned 1.5 m away in the middle between two electrodes with Ocean View software version 2.0.8 equipped to store the datalogger to establish a correlation between the impulse voltage signal waveform and its spectral lines. This spectrometer is capable of detecting wavelengths ranging from 190 to 1100 nm with an optical resolution of 1.33 nm and a slit width of 25 µm. The scan rate was set at 400 Hz (equivalent to 2.5 ms), allowing us to thoroughly explore the optical emission spectrum in an integration time of 70 ms. In this study, we focused on analyzing the spectral lines within the wavelength range of 200–900 nm, corresponding to the breakdown spectra of positive and negative impulse voltage discharges. To minimize background radiation, a dark room was used during the capture of the spectra. Additionally, before applying the deconvolution method to fit the spectral lines, the analyzed spectra were first corrected by subtracting the background radiation captured prior to the spark event. The observation period was 1 s with an integration time of 70 ms.
Reference [16] explores the rapid breakdown times associated with the spectra of ±100, ±125, and ±150 kV impulse voltages at 3.5 cm gaps. We used these previous data for comparison spectra at ±100, ±125, and ±150 kV at 3 cm with other negatives of −100, −125, and −150 kV at 4 cm. These voltages were examined by classifying them based on the similarity of fluctuated waveform tails of impulse voltages. Spectral data in the 200–900 nm range, characterized by similar fluctuated waveform tails of impulse voltage discharges, were analyzed by separating overlapping spectral lines from the peak spectra of oxygen in the air using the deconvolution method. The deconvolution analysis was performed with Origin 2018 SR1 b9.5.1.195 software, examining the spectral lines of oxygen to assess breakdown time data concerning the applied voltage. This analysis also considers nitrogen, argon, hydrogen, and tungsten (used as the electrode material) using curve fitting techniques of a Gaussian distribution profile. The NIST database [17] is used as a reference for accurately identifying the individual atoms corresponding to each spectral peak fitted result. Presented as part of the spectral results for the 200–400 nm and 400–900 nm ranges, these findings are to explore the correlation with impulse voltage discharge characteristics. This involves observing the fluctuated waveform tails in positive and negative impulse voltage discharges and their spectral lines. This study focuses on the correlation between the similar fluctuated waveform tails of positive and negative impulse voltage discharges and the spectral lines of oxygen atomic transitions during the breakdown discharge. A marked black circle for positive and negative discharges in fluctuated waveform tails was used to analyze their respective spectral lines, as shown in Figure 2. Detailed investigation results are described in Section 3.

3. Results

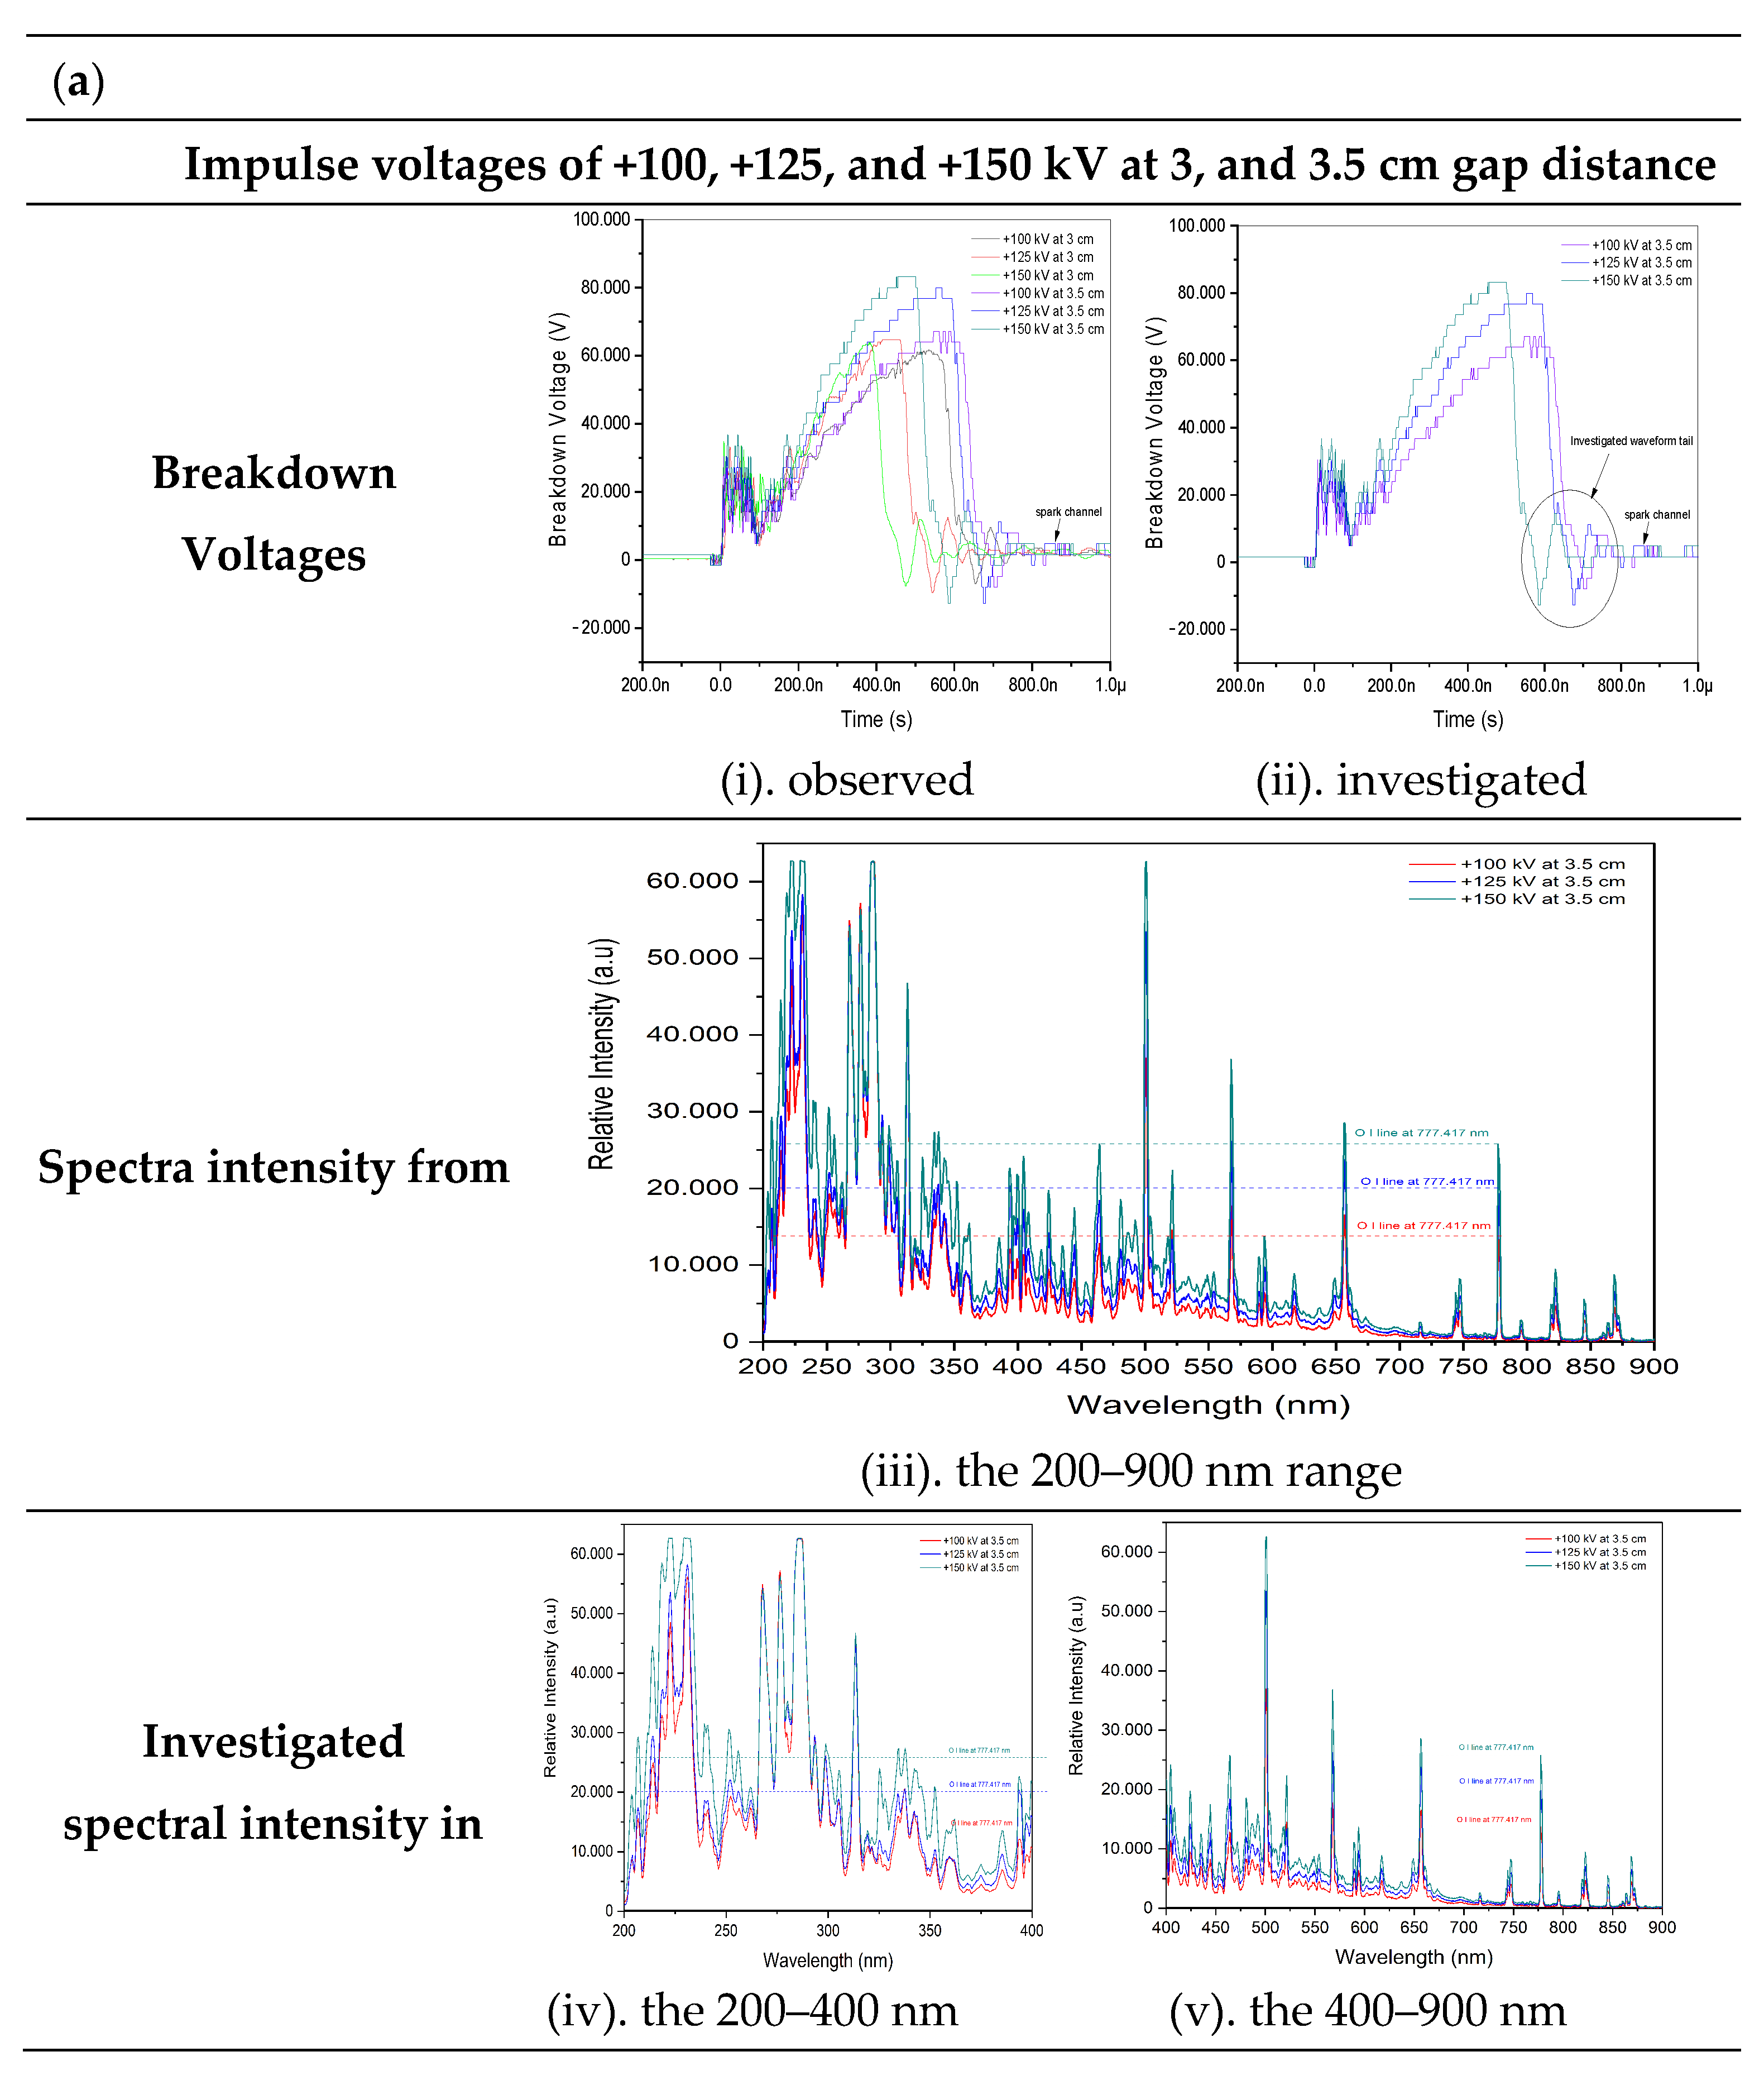
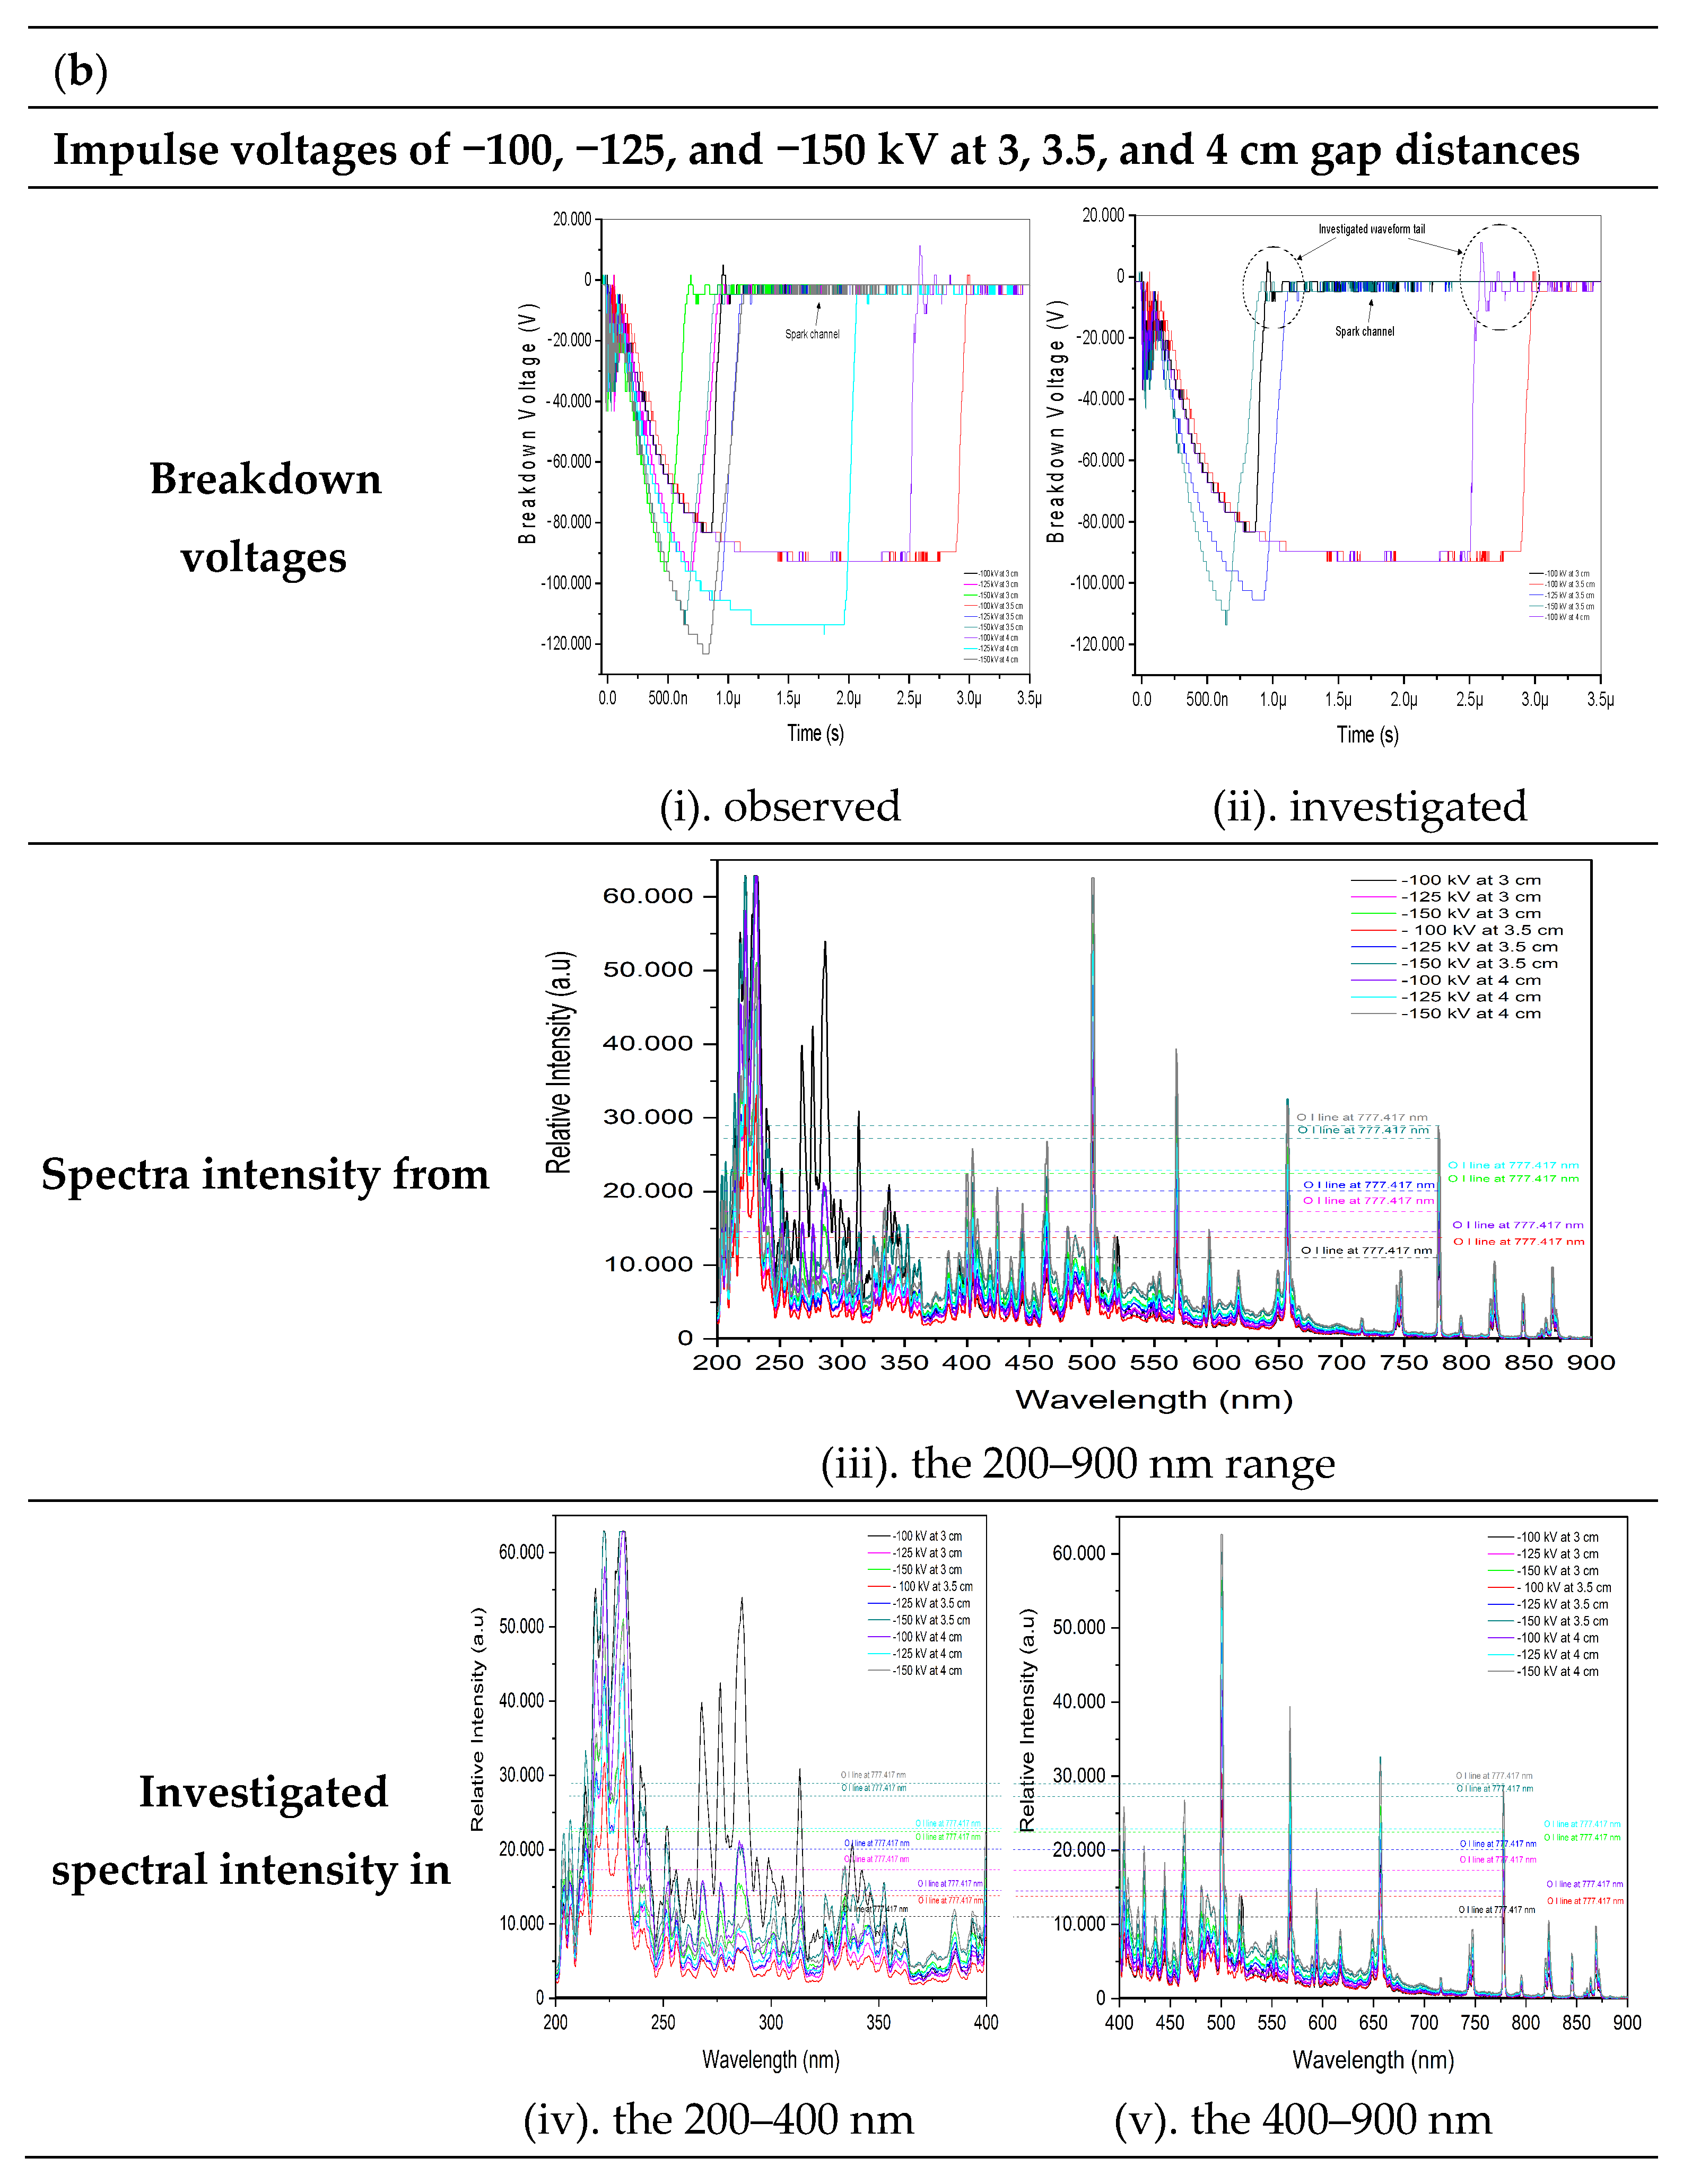
3.1. Breakdown Voltages and Spectra

The recorded signals of both positive and negative impulse voltages at ±100, ±125, and ±150 kV across gap distances of 3 and 3.5 cm, as well as −100, −125, and −150 kV at 4 cm, are presented in Figure 2 for further analysis. The spectral line data in reference [16] provide detailed experimental data for discharges at ±100, ±125, and ±150 kV across a gap distance of 3.5 cm, which were used as references. A consistent trend is observed in the trailing edges of both positive and negative impulse voltage discharges, particularly focusing on the fluctuated waveform tails, marked by a black circle, followed by their spark channels, as illustrated in Figure 2. In identifying the waveform tails, a transparent solid circle has been overlaid on investigated positive and negative impulse voltage discharges, facilitating the recognition of waveform tail trends, as shown in Figure 2(a(ii),b(ii)).
In Figure 2(a(i)), six positive impulse voltages at +100, +125, and +150 kV across 3 cm and 3.5 cm gap distances demonstrate similar trends in their fluctuated waveform tails after breakdown time. In Figure 2(a(ii)), the voltages in +100, +125, and +150 kV at a 3.5 cm gap are specifically selected as reference points for analyzing positive impulse voltages. The full spectra in the 200–900 nm wavelength range are highlighted for most positive impulse voltages, with the spectra in the 200–400 nm and 400–900 nm ranges represented by dashed, colored lines, as shown in Figure 2(a(iii–v)), respectively. The waveform tails at +100, +125, and +150 kV at a gap distance of 3.5 cm serve as spectral references for positive voltages, with dashed, colored lines indicating the O I line at the 777.417 nm peak level, shown in Figure 2(a(iii)). Meanwhile, Figure 2(b(i)) through Figure 2(b(v)) illustrate the patterns of negative impulse voltages and spectra, using dashed, colored lines similar to those in Figure 2a. These figures highlight the comparable trends in waveform behavior across both positive and negative voltage applications. Three fluctuated waveform tails at −100, −125, and −150 kV with a 3.5 cm gap serve as reference spectra for negative voltages. This study also examines two negative impulse voltages, specifically −100 kV at 3 cm and 4 cm gaps, chosen for their similar trends to those of positive impulse voltages. Figure 2(b(ii)) highlights five waveform tails marked by black circles. Figure 2(b(iv,v)) divide the spectrum into two segments: the 200–400 nm band, representing the ionized state, and the 400–900 nm band, focusing on the O I line at 777.417 nm, respectively. Our analysis emphasizes the spectral lines within the 200–400 nm range, particularly those above the dashed line marking the O I line at 777.417 nm. By comparing the spectra in Figure 2(a(iv,v)) with those in Figure 2(b(iv,v)), we aim to identify differences between the positive and negative spectral references, with a focus on the impact of oxygen contributions above the O I line, as highlighted by the dashed, colored lines, discussed in Section 4.
Interestingly, most spectral lines in positive impulse voltages exhibited similar trends in the 200–900 nm bands compared to negative impulse voltages as the applied voltage increased. The waveform tails demonstrate consistent fluctuating characteristics after breakdown time in positive impulse voltages, as shown in Figure 2(a(i)). In contrast, negative impulse voltages of −100, −125, and −150 kV display unpredictable fluctuations in the waveform tails at 3, 3.5, and 4 cm gap distances. However, the −100 kV impulse at 3 and 4 cm separation distances displays an increasing fluctuation pattern similar to the positive breakdown voltages illustrated in Figure 2(b(ii)) by the black circles. Additionally, differences in the spectra compared to other negative spectra are visible in the 200–400 range. Eight spectra at ±100, ±125, and ±150 kV across a 3.5 cm gap distance and a −100 kV across 3 and 4 cm gaps were selected for analysis through spectroscopy in Section 3.2.

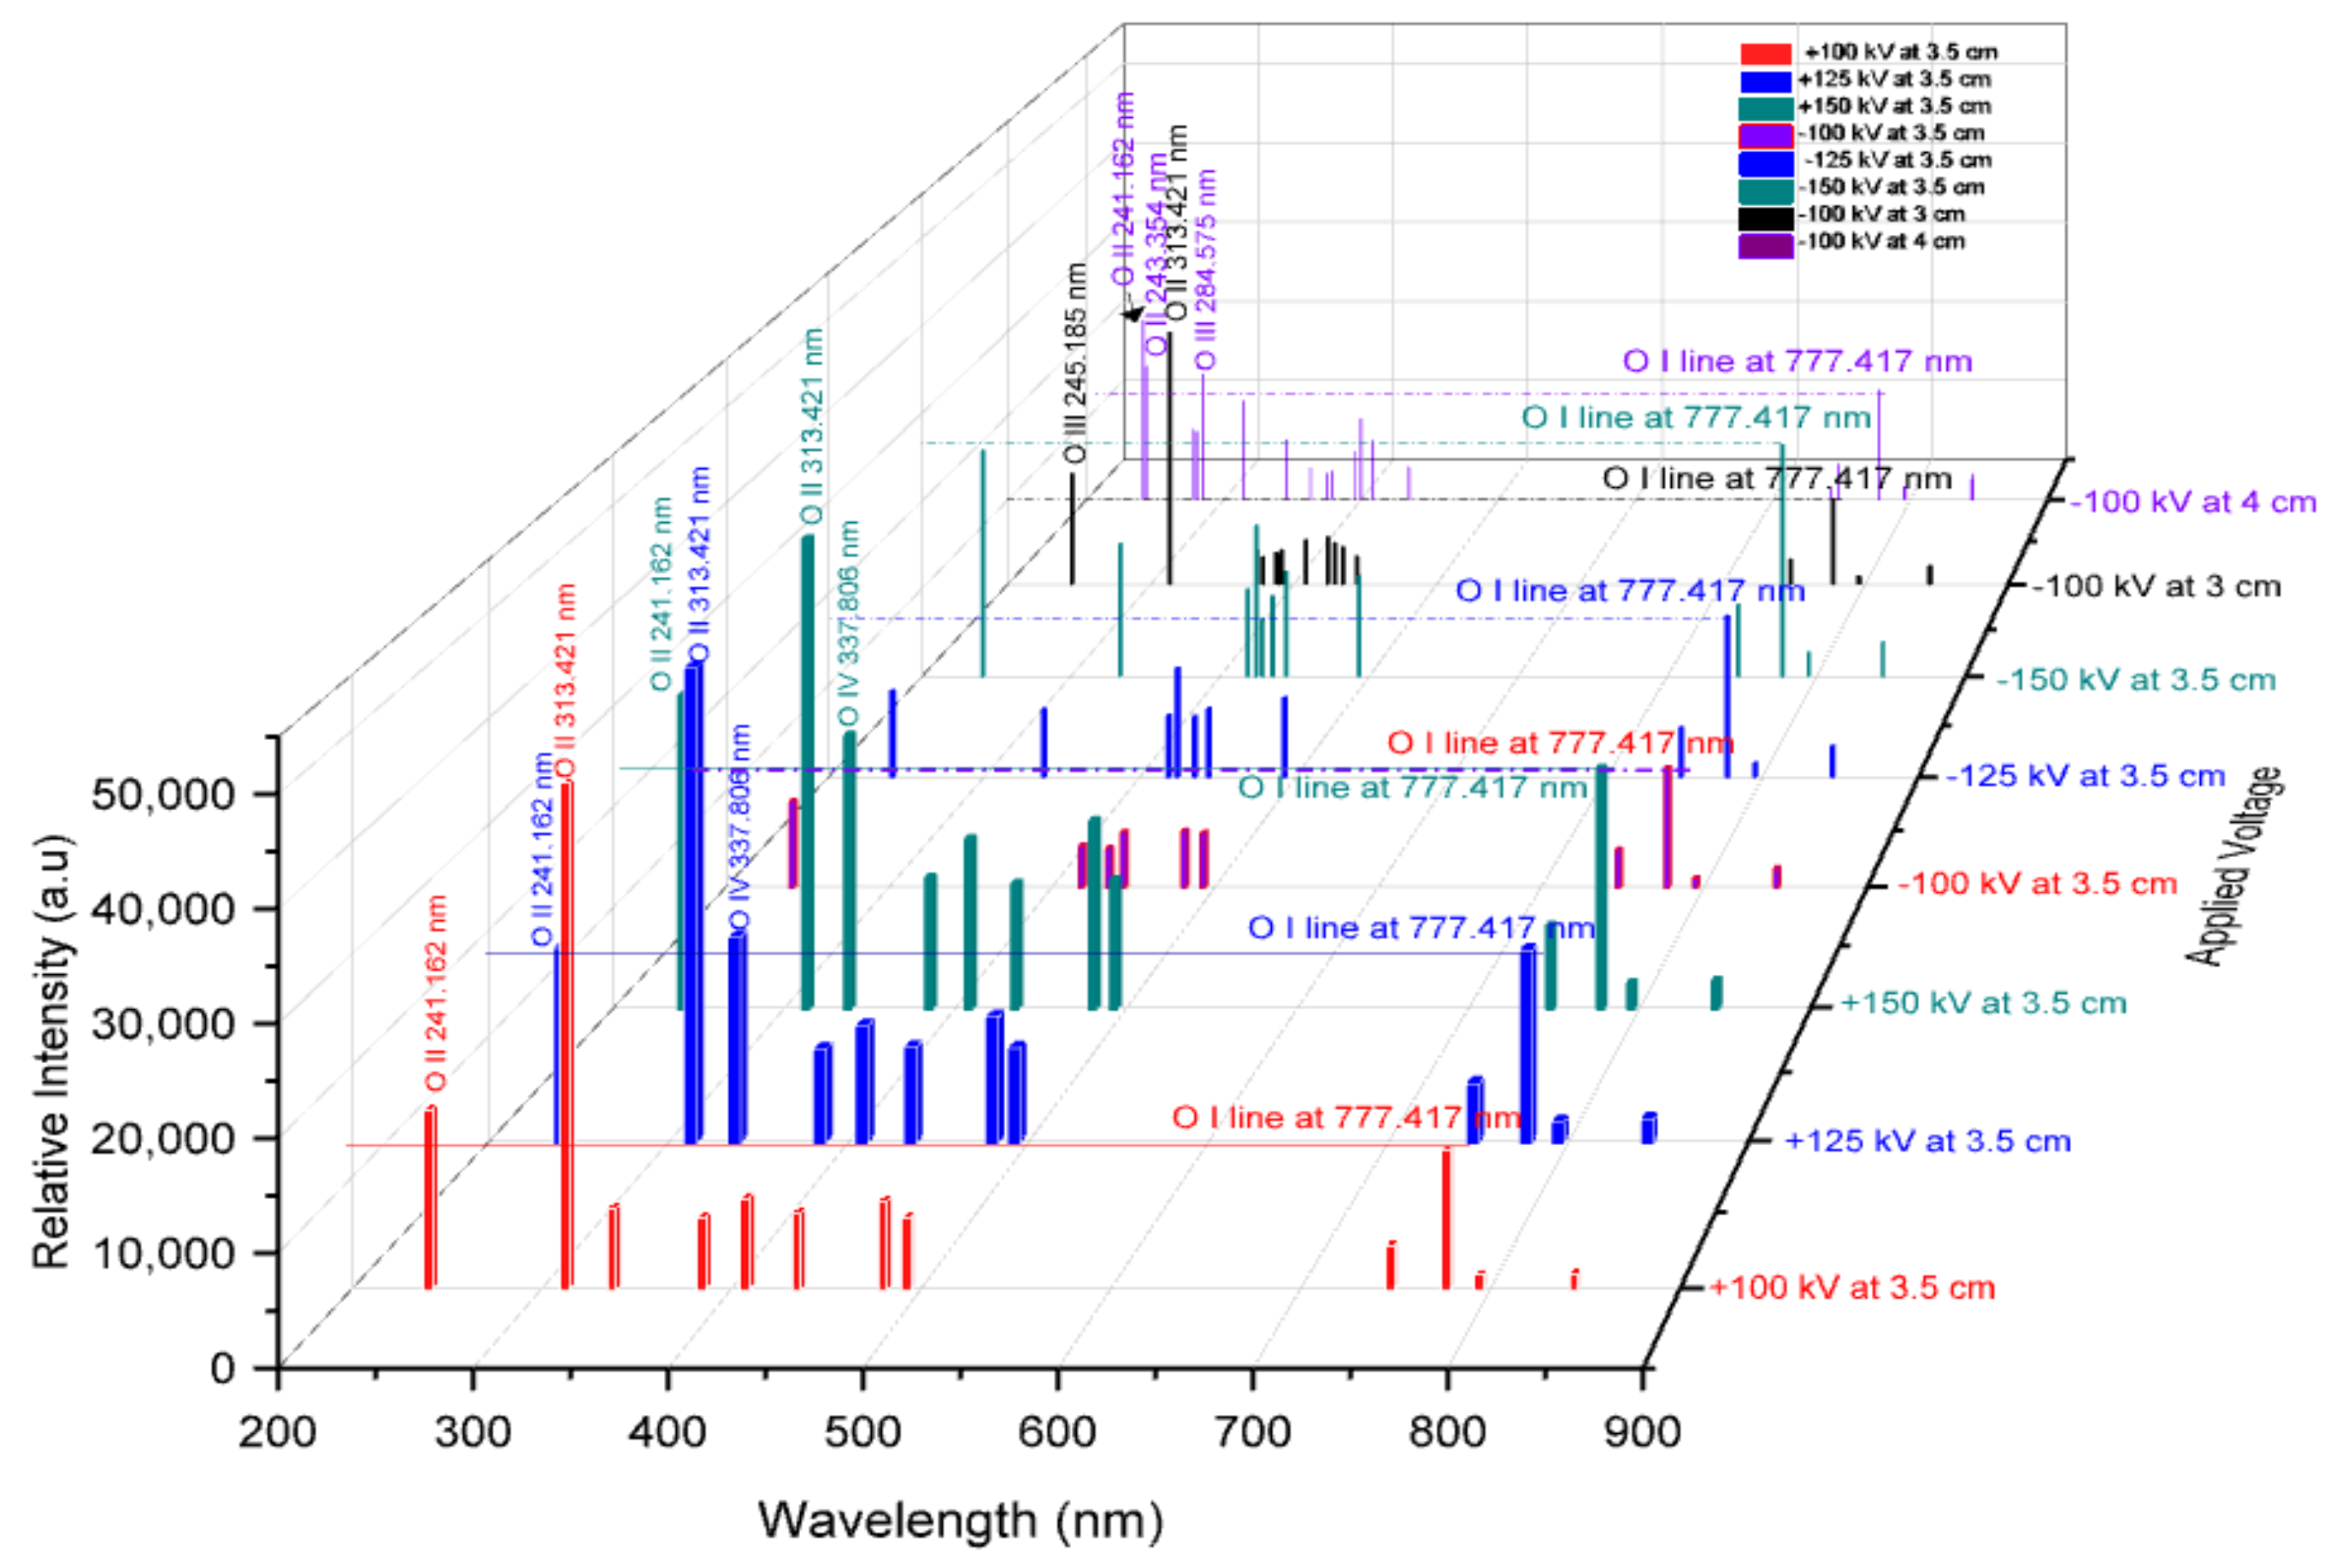
3.2. Spectral Line Identifications and Oxygen Distributions

To analyze the spectral results shown in Figure 2, we used Gaussian distribution methods to determine the fitting curves. The detailed atomic spectral line discharges of ±100, ±125, and ±150 kV at a 3.5 cm gap and −100 kV at 3 and 4 cm gaps are provided in Table 1. Reference [16] shows experimental results for these voltages across a 3.5 cm gap, with detailed values added in Table 1. We compared the oxygen distribution results in negative impulse voltage discharges in −100 kV at 3 and 4 cm with positive voltages in +100, +125, and +150 kV at 3.5 cm due to their similar fluctuating trends. Our previous results at a 3.5 cm gap, performed using curve fitting to identify individual lines from 200 to 900 nm during millisecond observations, revealed that the O II line at 313.421 nm consistently had the highest peak intensity in positive impulse voltage discharges compared to other atomic lines. The spectral analysis with +100 kV highlighted O II lines at 241.162, and 313.421 nm had higher intensities than O I at 777.417 nm. Also, at +125, and +150 kV, the O IV line at 337.806 nm was observed. We concluded that the higher intensities of spectral lines in the 200–400 nm range, compared to O I at 777.417 nm, contributed to faster breakdown times. This suggests that the quick breakdown time may be associated with stronger and more intense emissions in the 200–400 nm ranges, as shown in Table 1. This can be explained by the fact that a shorter breakdown time leads to increased ionization, which results in more emission lines from ionized species, typically occurring in the 200–400 nm wavelength ranges, as investigated in our previous research [16]. In contrast, for negative voltages of −100, −125, and −150 kV at the same gap distance, the intensities of spectral lines did not exceed those of O I at 777.417 nm.
Figure 3 illustrates the oxygen distribution in ±100, ±125, and ±150 kV across a 3.5 cm gap, as well as spectral lines at −100 kV with 3 cm and 4 cm gaps. The increasing intensities of O II at 241.162 nm and 243.354 nm, along with O III at 284.575 nm, are highlighted by dashed lines compared to the O I line at 777.417 nm at the 4 cm gap. Additionally, O III at 245.185 nm and O II at 313.421 nm at the 3 cm gap are highlighted by solid lines for +100, +125, and +150 kV. The results show that the oxygen distribution at −100 kV with 3 cm and 4 cm gaps behaves similarly to positive impulse voltages of +100, +125, and +150 kV at a 3.5 cm gap. This similarity is highlighted in the colored peak oxygen excitations, whereas no peak intensity is observed for −100, −125, and −150 kV above the O I line at 777.417 nm, as depicted in Figure 3. Therefore, the voltage in −100 kV with 3 cm and 4 cm gaps is explored further in this study. The waveform tails correlated to oxygen distributions are discussed in Section 4.1, fluctuated waveform tail identification is discussed in Section 4.2, and the influences of fluctuated waveform tails on rapid breakdown time are discussed in Section 4.3, corresponding to their spectral lines.

4. Discussion

4.1. Waveform Tails and Oxygen Distributions

When a rising pulse is applied across a gap, it is crucial to consider the limited time available for initiating breakdown [18]. This process can be divided into distinct time intervals, each contributing to the formation of gas breakdown channels. Initially, the static breakdown voltage is the minimum voltage required to initiate breakdown or electrical discharge in a non-conductive material or insulator under a static (unchanging) electric field. Once the applied voltage exceeds this static breakdown voltage, the material can no longer withstand the electric field, resulting in current flow and electric breakdown. In the case of triggered spark gaps, t0 corresponds to the moment of activating the trigger mechanism. Next is the statistical delay time, ts, which signifies the interval until an electron capable of initiating an avalanche is present. Notably, the statistical time lag is commonly negligible, as the trigger mechanism supplies the initial electrons required for triggered spark gaps [19]. Additionally, ta denotes the time for avalanche buildup until the critical charge density is attained, and tarc represents the time necessary for establishing a low-resistance arc bridging the gap. The overall switching time or time lag, td, can generally be divided into two distinct constituents: the statistical time, ts, and the avalanche buildup time, ta. Thus, td = ts + ta.
The study by Horst et al. [20] involved a 2 mm gap between two points and analyzed nitrogen plasma emission following a 25 ns voltage drop. They identified three phases of plasma behavior: ignition, spark, and recombination. Their research showed that N2(CB), the second positive system (SPS), the N2(BA), the first positive system (FPS), and the N 2 + (BX), the first negative system (FNS) was visible in the ignition phase, a mixture of ionized and neutral atoms was predominant during the spark phase, and the neutral atoms were primarily characterized in the recombination phase. Based on the observed spectra over milliseconds, both excited (ionized) and neutral atoms were dominant in our experiments, where the transition of ionized oxygen to neutral oxygen signifies breakdown. Our findings align with those of Horst et al., who highlighted the dominance of specific spectra during the spark phase, with both ionized and neutral atoms being notably present. We considered Hu et al.’s photographic observations [6], which showed that the spark channel appears after the breakdown voltage as the spark phase. Consequently, we segmented the voltage waveforms into two phases: the ignition phase, highlighted in a light green box, and the spark phase, which includes both the breakdown and the spark channel, highlighted in a white box, as shown in Figure 4. The spectral lines in the spark phase can manifest at any point as gap conductivity increases. Interestingly, in both the spark and recombination phases in Horst’s experiments, neutral atoms exhibited stronger peak intensities than ionized atoms.
In our observations, we specifically focused on fluctuated waveform tails after the breakdown time of the spark phase, denoted as tarc following the spark channel (in spark phase), as illustrated in Figure 4a for positive impulse voltage and Figure 4b for negative impulse voltage. The experiments conducted under these conditions can provide valuable insights into the mechanisms governing excitation processes during the spark phase, particularly concerning both positive and negative impulse voltages. This is illustrated with +100 kV at 3.5 cm gap distances in Figure 4a and −100 kV at 3 cm gap in Figure 4b. The four oxygen state distributions of O I, O II, O III, and O IV in −100 kV at 3 cm gaps as well as the five oxygen state distributions of O I, O II, O III, O IV, and O V in −100 kV at 4 cm gaps are highlighted in the right frame box.
Consequently, the results shown in Figure 4 indicate that the delay time (to + ta) corresponds to the ignition phase, followed by the tarc time and the development of the spark channel during the spark phase. The fluctuated waveform tails, which appear after breakdown and tarc, eventually reach zero voltage. The recombination phase following the spark phase is not depicted in Figure 4, as the spectra only capture the spark spectra, represented by ionized and neutral atoms, that exist during the spark phase. During the ignition phase, an ionization starts to form electron avalanches between the electrodes. If this conductivity channel becomes sufficiently high, a collapse in voltage occurs, followed by a significant surge in current indicated by the flowing of more electrons inside the channel discharge, shown as light emission. This transition is the beginning of the spark phase. Figure 4 illustrates that excited oxygen species, such as O II, O III, O IV, and O V, as well as O I, are associated with spark processes and can occur anywhere along the range of the spark phase, including both breakdown and the spark channel, as observed in the experiments by Horst and Hu. O I, in particular, is identified as a recombination process. Interestingly, our results show that most impulse voltages exhibit fluctuated waveform tails after breakdown time, marked by the higher peak intensity of ionized oxygen compared to neutral oxygen atoms. We suspect that these excited oxygen species contribute to the fluctuated waveform tails. Therefore, we conducted additional experiments to validate our findings by observing the fluctuated waveform tails under negative impulse voltages.
In Figure 3, various excited oxygen species are generated during the spark phase in millisecond observations, which may contribute to the fluctuated waveform tails. Focusing on oxygen excitations at the 200–400 nm ranges reveals that O II at 313.421 nm displays the highest intensity among other oxygen atoms in +100, +125, and +150 kV. The observation of two higher-intensity spectral lines, O II at 241.162 nm and O IV at 337.806 nm, suggests that the electron transitions in O IV did not result in greater photon emissions even though O IV’s energy levels are higher. This can be attributed to electron density, the selection rules governing allowed transitions, or other quantum mechanical properties influencing emission intensities. In contrast, more intense oxygen excitations are observed at −100 kV with 3 and 4 cm gaps than at positive impulse voltages at 3.5 cm, as shown in Figure 3, with detailed values in Table 1. The higher intensities were observed in O III at 245.185 nm, O II at 313.421, in −100 kV at 3 cm as well as O II at 241.162, and 243.354 nm, along with O III at 284.575 nm in −100 kV at 4 cm. These species in the 200–400 nm wavelength range maintain electron collisions inside the channel to prevent the attachment process similar to what is observed in positive applied voltages in +100, +125, and +150 kV at 3.5 cm. These spectral lines across positive impulse voltages, in +100, +125, and +150 kV at 3.5 cm as well as −100 kV at 3 and 4 cm, enable oxygen atoms to transition their electrons from an excited to a neutral state encompassing both de-excitation and recombination processes. It can be concluded that the similarity in spectral lines, among +100, +125, and +150 kV at 3.5 cm as well as −100 kV at 3 and 4 cm, is due to the higher peak intensity of oxygen distributions in the 200–400 nm range compared to O I at 777.417 nm. The trends in −100 kV at 3 and 4 cm are consistent across most positive impulse voltages, as discussed in previous studies [16]. Section 4.2 addresses these spectral lines in the context of waveform tail recognition.

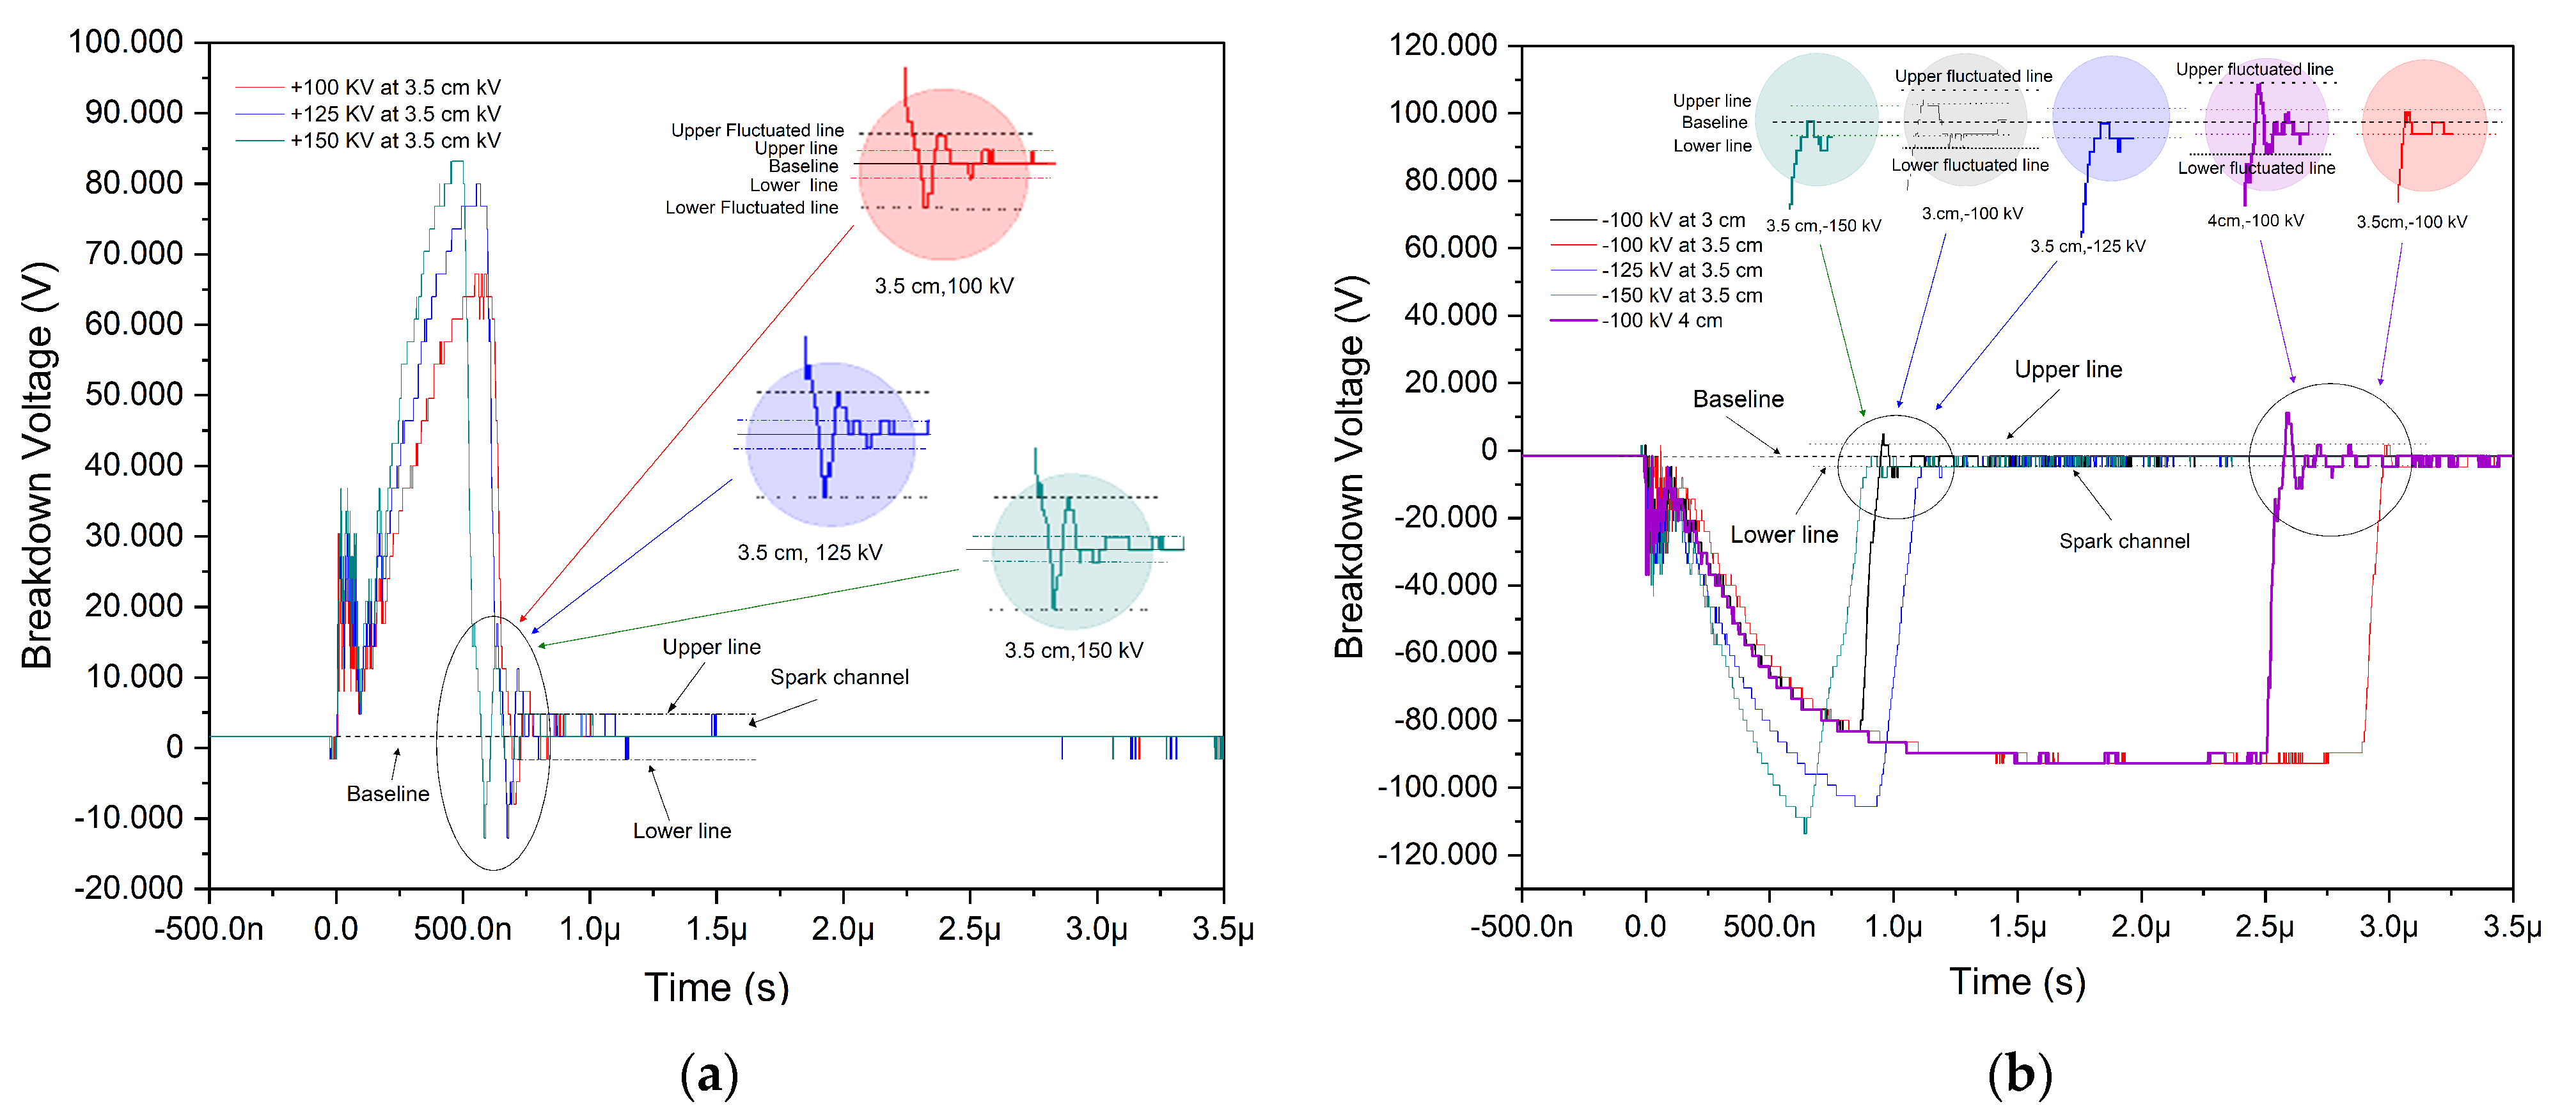
4.2. Fluctuated Waveform Tail Identifications

In the context of the current-voltage characteristic of an air arc discharge, the phenomenon where the breakdown voltage nearly approaches zero under conditions of maximal current flow marks a phase where the discharge has become highly conductive. Typically, in an air arc discharge, the breakdown voltage is the minimum voltage required to initiate the discharge process primarily through the atom ionizations such as oxygen between two electrodes. Once the discharge pathway is established, the electrical resistance across this arc significantly decreases, enabling the flow of substantial current with only a minor reduction in voltage. The arc’s initiation reduces the voltage needed to sustain it well below the initial breakdown voltage. This reduction is due to the ionized gas between the electrodes creating a path that facilitates joule heating, further reducing resistance. Consequently, the arc can conduct considerable current at a reduced voltage drop because of the abundance of free electrons and ions within it. This conductive path ensures efficient electrical current flow, while the surrounding air retains much higher resistance compared to the conductive channel of the arc. The arc channel’s low resistance results in a minimal voltage drop across it, which can be nearly negligible in practical scenarios, especially when considering the voltage output from the power supply. The high current through the arc generates substantial heat and light, which are the features of the highly conductive phase in an air arc discharge.
The fluctuations in the voltage waveform tails during the spark phase, as depicted in Figure 5a,b with colored circles for each applied voltage, are observed to exceed the upper and lower lines in positive discharge. Figure 5a illustrates a similar symmetrical fluctuating trend in the waveform tails. These symmetrical fluctuations are signified by the waveform tails exceeding the boundaries of the upper and lower lines, indicated by dashed lines for each impulse voltage during the spark phase, exceeding the recombination process (spark channel). In contrast, Figure 5b displays fluctuated waveform tails at −100 kV at 3 and 4 cm in negative discharges compared to other negative voltages, indicated by colored circles exceeding the upper and lower line boundaries. This fluctuation in the waveform tails after breakdown time indicates a slight increase in the electric field (applied voltage per gap length). The increase is associated with a higher spectral intensity of the oxygen excited state in the 200–400 nm range for +100, +125, and +150 kV at 3.5 cm gaps as well as for −100 kV at 3 and 4 cm gaps compared to O I at 777.417 nm, as discussed in Section 4.1. There appears to be a correlation between the fluctuated waveform tails after breakdown time and the distribution of the oxygen lines. These fluctuated waveform tails are investigated to determine whether they contribute to the acceleration of breakdown time, as observed in our previous study, which is further discussed in Section 4.3.

4.3. Correlation of Waveform Tails and Spectral Lines with Breakdown Time

In Figure 5, the spectral lines of O I for both positive and negative voltages, represented by the upper and lower lines, illustrate the relaxation of oxygen atoms as they return to a stable or neutral state in the spark phase. We examine how metastable oxygen atoms recombine into neutral atoms and their impact on rapid breakdown by comparing the ionized oxygens with neutral oxygen in the spark phase, as we mentioned in Section 4.1. At a 3.5 cm gap, fluctuated waveforms after breakdown above upper and lower lines are observed for positive impulse voltages of +100, +125, and +150 kV; in contrast, they are absent for negative impulse voltages of −100, −125, and −150 kV except for the −100 kV voltage at 3 and 4 cm. Table 2 shows that as the applied voltage increases for both positive and negative voltages at gap distances of 3, 3.5, and 4 cm, the breakdown time exhibits dynamic trends except for +100, +125, and +150 kV at 3.5 cm, which show linear trends. Theoretically, the increasing applied voltages lead to a significant reduction in the time needed for free electrons and ions to initiate the discharge channel as accelerated electrons due to the increasing electric field (applied voltage per gap distance) facilitate the process. Breakdown occurs more quickly in positive impulses of +100, +125, and +150 kV at 3.5 cm than in negative impulse voltages. In contrast, +100, +125, and +150 kV at 3 cm do not show a linear trend with increasing voltage, as detailed in Table 2, which is discussed in the next study. The rapid development of the conductive channel is crucial for bridging the gap between the electrodes in air discharge. A higher applied voltage results in an increased electric field that accelerates electrons to bridge the gaps, which impedes the attachment process. Conversely, the investigated breakdown times of the spark phase, indicated by the grey box in Table 2, show linear trends for +100, +125, and +150 kV at a 3.5 cm page as the applied voltage increases. This behavior is attributed to the distribution of excited oxygen, as discussed in Section 4.1. In contrast, the breakdown times for −100, −125, and -150 kV exhibit dynamic trends at a 3.5 cm gap as well as −100 kV at 3 and 4 cm, which do not follow the same pattern.
However, negative voltages generally result in slower breakdown speeds than positive voltages. Interestingly, in −100 kV at 3, and 4 cm, the breakdown times are 83 ns and 95 ns, respectively. These times are faster than those observed at +100 kV, where the breakdown times are 105 ns and 101 ns for gap distances of 3 cm and 3.5 cm, respectively. These indicated that the channel conductivity was maintained by producing more electrons through ionization releasing Joule heating, as evidenced by the higher ionization of oxygen in higher excited states (O III, O IV, and O V) observed in the 200–400 nm wavelength range at −100 kV with 3 cm and 4 cm gaps as discussed in reference [15]. Additionally, excited oxygen in the 200–400 nm ranges, with the dominance of a higher excited state than neutral oxygen OI at 777.417 nm, may contribute to the conductivity of the arc channel leading to rapid discharge in both positive and negative voltages, as discussed in reference [16].
Comparing Figure 5 with Table 2, during the spark phase for both positive and negative voltages, rapid breakdown times are indicated by the presence of symmetrical fluctuated waveform tails after breakdown time at +100, +125, and +150 kV with a 3.5 cm gap, as well as at −100 kV with 3 and 4 cm gaps, highlighted by the colored circles for each applied voltage in Figure 5. The rapid breakdown times listed in Table 2 correlate to the fluctuated waveform tails observed at these voltage levels in Figure 5. Spectral analysis reveals that these waveform tails are associated with intense ionization processes, particularly in the 200–400 nm range, which exhibits higher peak intensities than the O I line at 777.417 nm. This ionization generates new seed electrons through high-energy kinetic collisions, releasing Joule heating to maintain the channel depending on their decay time, resulting in a breakdown at approximately 27 ns. The contribution of excited oxygen, marked by slight voltage fluctuations within the waveform tails after breakdown time exceeding the upper and lower line limits, produces energetic photons with higher peak intensities than neutral oxygen at 777.417 nm. These photons accelerate electrons, thereby reducing the breakdown time as a critical step in bridging the electrode gap, as presented in our previous study [16]. Comparative examinations of the results presented in Figure 3, Figure 4 and Figure 5 lead to the conclusion that, during the spark phase, oxygen atoms experience an excitation process involving O II, O III, O IV, and O V. In the recombination phase, atoms transition to relaxation processes involving O I. This excitation process involves electrons falling from an upper to a lower state, known as de-excitation, whereas the recombination process returns free electrons from an excited state to a neutral state. The impact of these processes involving oxygen’s excited and neutral states results in the emission of energetic photons within the air discharge channel. Specifically, during the spark phase, the initiation of rapid discharge is marked by spectral lines such as O II at 241.162 nm, O II at 313.421 nm, and O IV at 337.896 nm for impulse voltages at a 3.5 cm distance of +100, +125, and +150 kV, as discussed in our previous study. At impulse voltages of −100 kV at 3 cm, O III at 245.285 nm, and O II at 313.421 nm, as well as O II at 241.162 nm, O II at 243.354 nm, and O III at 284.575 nm at −100 kV at 4 cm observed higher peak intensities in these spectral lines than O I at 777.417 nm. These are marked by fluctuations in the waveform tails exceeding the spark channel boundary (upper and lower line levels). This observation underscores that the exceeding fluctuations of the waveform tails after breakdown time above the spark channel level during the spark phase are denoted by higher peak intensities at a 3.5 cm gap distance of +100, +125, and +150 kV, as well as −100 kV at 4 cm, compared to O I. These energetic photons collide with and accelerate electrons, creating a more conductive channel by releasing Joule heating that rapidly connects to the plane electrode. In the next study, we investigate how −100 kV at 3 and 4 cm can contribute to the rapid breakdown compared with other positive voltages.

5. Conclusions

During the spark phase, spanning voltages of ±100, ±125, and ±150 kV at 3 cm and 3.5 cm as well as −100, −125, and −150 kV at 4 cm gap distances, we examined the fluctuated waveform tails by observing oxygen transitions in excited states over millisecond durations within the wavelength range of 200–900 nm. The interplay between these two specific atoms, corresponding to their excited and neutral states, played a pivotal role during the breakdown. Our findings are summarized as follows:
  • We observed no fluctuation in the waveform tails after breakdown time exceeding upper and lower lines in the case of −100, −125, and −150 kV at 3.5 cm, as well as −125, and −150 kV across 3 cm and 4 cm because no oxygen excited states were observed with higher intensities compared to the neutral oxygen O I line at 777.417 nm. In contrast, in +100, +125, and +150 kV at 3.5 cm, along with −100 kV at 3 cm and 4 cm, we examined symmetrical fluctuated waveform tails after breakdown exceeding upper and lower lines (spark channel) due to more intense oxygen excitation with higher peak intensities within the wavelength range of 200–400 nm during the spark phase compared to neutral oxygen at 777.417 nm, as discussed in Section 4.2. These emissions, spectral lines with higher peak intensity in the 200–400 nm ranges than OI at 777.417 nm, are highlighted as fluctuated waveform tails surpassing the spark channel level during the spark phase, as discussed in Section 4.1.
  • Examining the fluctuations in the spark phase of the waveform tails for both positive and negative impulse voltage discharges, we identified small fluctuations that exceed the spark channel after breakdown time for both voltage types. These fluctuations contribute to rapid breakdown times in +100, +125, and +150 kV at 3.5 cm as well as −100 kV at 3 cm and 4 cm with 101, 96, 73, 83, and 95 ns, respectively, as discussed in Section 4.3. These fluctuations were attributed to energetic photon emissions, indicated by higher peak intensities in excited states compared to neutral states, which facilitate the acceleration of electrons towards the ground plane resulting in rapid breakdown time.
  • A correlation has been identified between the symmetrical fluctuated waveform tails and the spectral lines of oxygen excitation in the 200–400 nm range for both positive and negative impulse voltages. The fluctuated waveform tails after breakdown time, which reflect a higher peak intensity of oxygen distributions in the 200–400 nm wavelength range than the O I line at 777.417 nm, significantly influence the dynamics of the electrical discharge contributing to a quicker breakdown process in both positive and negative impulse voltages.

Author Contributions

Conceptualization, M.I.; methodology, M.I.; validation, M.I. and T.M.; formal analysis, M.I and T.M.; investigation, M.I.; writing, M.I.; writing—review and editing, M.I. and T.M.; supervision, T.M. All authors have read and agreed to the published version of the manuscript.

Funding

This research received no external funding.

Data Availability Statement

The original contributions presented in the study are included in the article, further inquiries can be directed to the corresponding author.

Acknowledgments

This project received partial support and sponsorship from ADB AKSI Malikussaleh University. Kindai University’s Remote Sensing Laboratory members for their technical support, and Senku Tanaka, Kindai University, for his invaluable assistance in setting up equipment and facilitating discussions.

Conflicts of Interest

The authors declare no conflicts of interest.

References

  1. Sigmond, R.S.; Goldman, M. Streamer to Spark Transition in Short Point to Plane Gaps. In Gaseous Dielectrics III, Pergamon, Proceedings of the Third International Symposium on Gaseous Dielectrics, Knoxville, TN, USA, 7–11 March 1982; Elsevier: Amsterdam, The Netherlands, 2013; pp. 53–59. [Google Scholar]
  2. Machala, Z.; Janda, M.; Niklova, A.; Martisovits, V. Time-resolved emission spectroscopy and imaging of transient spark in atmospheric air. In Proceedings of the 6th International Workshop on Microplasmas, Paris, France, 3–6 April 2011. [Google Scholar]
  3. Hogg, M.G.; Timoshkin, I.V.; Mcgregor, S.J.; Wilson, M.P.; Given, M.J. Polarity effects on breakdown of short gaps in a point-plane topology in air. IEEE Trans. Dielectr. Electr. Insul. 2015, 22, 1815–1822. [Google Scholar] [CrossRef]
  4. Zhou, Z.; Kyritsakis, A.; Wang, Z.; Li, Y.; Geng, Y.; Djurabekova, F. Direct observation of vacuum arc evolution with nanosecond resolution. Sci. Rep. 2019, 9, 7814. [Google Scholar]
  5. Forestier, B.; Houard, A.; Revel, I.; Durand, M.; Andre, Y.B.; Prade, B.; Jarnac, A.; Carbonnel, J.; Nevé, M.; Miscault, J.; et al. Triggering, guiding and deviation of long air spark discharges with femtosecond laser filament. AIP Adv. 2012, 2, 012151. [Google Scholar] [CrossRef]
  6. Hu, Y.; Lin, Y.; An, Y.Z.; Wen, X.; Li, H.; Su, M.; Yang, M.; Yin, K. Laboratory study on negative spark inception direction and breakdown characteristics in rod–rod air gaps. Electr. Power Syst. Res. 2021, 201, 107498. [Google Scholar] [CrossRef]
  7. Gallimberti, I.; Bacchiega, G.; Bondoiu-Clergerie, A.; Lalande, P. Fundamental processes in long air gap discharges. Comptes Rendus Phys. 2002, 3, 1335–1359. [Google Scholar] [CrossRef]
  8. Raizer, Y.P. Breakdown of Gases in Fields of Various Frequency Ranges. In Gas Discharge Physics; Springer: Berlin/Heidelberg, Germany, 1991; pp. 128–144, Chapter 7. [Google Scholar]
  9. Sun, P.; Sima, W.; Yang, M.; Lan, X.; Wu, J. Study on voltage-number characteristics of transformer insulation under transformer invading non-standard lightning impulses. IEEE Trans. Dielectr. Electr. Insul. 2015, 22, 3582–3591. [Google Scholar] [CrossRef]
  10. Sima, W.; Sun, P.; Yang, M.; Wu, J.; Hua, J. Impact of time parameters of lightning impulse on the breakdown characteristics of oil-paper insulation. High Volt. 2016, 1, 18–24. [Google Scholar] [CrossRef]
  11. Wu, S.; Wang, L.; Gao, J.; Xie, C.; Liu, L.; Wang, T.; Li, E. Breakdown characteristics of combined air gaps under lightning impulse. AIP Adv. 2022, 12, 035024. [Google Scholar] [CrossRef]
  12. Korolov, I.; Donkó, Z.; Hübner, G.; Bischoff, L.; Hartmann, P.; Gans, T.; Liu, Y.; Mussenbrock, T.; Schulze, J. Control of electron dynamics, radical and metastable species generation in atmospheric pressure RF plasma jets by Voltage Waveform Tailoring. Plasma Sources Sci. Technol. 2019, 28, 094001. [Google Scholar] [CrossRef]
  13. Gudmundsson, J.T.; Snorrason, D.I. On electron heating in a low pressure capacitively coupled oxygen discharge. J. Appl. Phys. 2017, 122, 193302. [Google Scholar] [CrossRef]
  14. Waters, R.T. Positive discharges in long air gaps at Les Renardières. Electra Cigre 1977, 53, 31–132. [Google Scholar]
  15. Ikhwanus, M.; Morimoto, T. Breakdown Time Phenomena: Analyzing the Conductive Channel of Positive Impulse Voltage Discharges under Standard Temperature and Pressure Air Conditions. Energies 2024, 17, 4222. [Google Scholar] [CrossRef]
  16. Ikhwanus, M.; Morimoto, T. Rapid Breakdown Time in Positive Impulse Voltages through Spectroscopy Analysis. Energies 2024, 17, 705. [Google Scholar] [CrossRef]
  17. NIST Atomic Spectra Database Lines Form. Available online: https://physics.nist.gov/PhysRefData/ASD/lines_form.html (accessed on 24 June 2024).
  18. Hansjoachim, B. Pulsed Power Systems Principles and Applications; Springer: Berlin/Heidelberg, Germany, 2006; pp. 17–18. [Google Scholar]
  19. Janet, L.; Pralhad, R. Foundations of Pulsed Power Technology; John Wiley & Sons, Inc.: Hoboken, NJ, USA, 2017; pp. 158–162. [Google Scholar]
  20. Van der Horst, R.M.; Verreycken, T.; van Veldhuizen, E.M.; Bruggeman, P.J. Time-resolved optical emission spectroscopy of nanosecond pulsed discharges in atmospheric-pressure N2 and N2/H2O mixtures. J. Phys. D App. Phys. 2012, 45, 345201. [Google Scholar] [CrossRef]
Figure 1. Experimental platform.
Eng 05 00117 g001
Figure 2. Impulse breakdown voltages in the 200–400 nm, and 400–900 nm spectra. (a) Positive impulse voltages of ±100, ±125, and ±150 kV at 3, and 3.5 cm gap distances; (b) Negative impulse voltages with additional spectra of −100, −125, and −150 kV at 4 cm.
Eng 05 00117 g002aEng 05 00117 g002b
Figure 3. Various oxygen distributions in positive and negative voltages at 3, 3.5, and 4 cm gaps.
Eng 05 00117 g003
Figure 4. to = static breakdown time, ta = build-up time for the avalanche, tarc = start arc discharge time; in spark phase with oxygen distributions. (a) +100 kV at 3.5 cm; (b) −100 kV at 3 cm.
Eng 05 00117 g004
Figure 5. The symmetrical fluctuated waveform tails. (a) Positive impulse voltage; (b) negative impulse voltage.
Eng 05 00117 g005
Table 1. Spectral line intensities of positive and negative impulse voltages.
IonsWavelength
(nm)
Intensity (a.u) in the Applied Voltage of
+100 kV+125 kV+150 kV−100 kV−125 kV−150 kV−100 kV−100 kV
Gap Distances at 3.5 cm,3 cm, and4 cm
O II241.16216,23718,63031,2459072949025,825-22,235
O II243.354-------16,493
O III245.18513,291-
O V278.101-------8661
O I280.558-------8411
O III284.575-------15,471
O II313.42145,45745,04146,765---30,015-
O II313.834-------12,236
O III333.241-----15,193--
O IV337.806743019,56127,246-----
O IV338.552----7471---
O II345.31-------7452
O IV363.134-------3931
O IV374.664------4080-
O II374.888-------3236
O IV378.738------33353521
O II382.154--------
O II385.2386617903013,130-----
O III387.676------3888-
O III389.176------3715-
O II391.929------4159-
O II394.935-------5970
O I399.795-------9908
O III408.426834011,20016,956-----
O II408.465------5365-
O II408.659-------7332
O II418.545---441068129991--
O III423.948------5757-
O II424.477----11,88817,258--
O II428.412-----6658--
O II428.882------4952-
O II434.742-------3995
O II434.943------4493-
OII435.359---416166379219--
O II435.4187022919612,524-----
O II444.352---5851752811,9573357-
O III473.254--------
O III480.978808812,05018,772-----
O IV481.315---5978----
O III493.1236548912012,8675797872711,511--
O V742.236-------1470
O I747.724---397954658258--
O II747.890------3138-
O I747.908408157788312----4455
O I777.41712,63118,35623,92912,47717,56326,41310,28713,510
O I795.08014402112262210281569283411201649
O III796.332------10051492
O I844.67615112406286820223368398621072477
O III845.642------22563139
Table 2. The breakdown time (t3−t2) of positive and negative impulse voltage discharges.
Applied VoltageGap Distance (cm)
3.03.54.0
100 kV(6.349 − 5.299) × 10−7 = 1.05 ×10−7 = 105 ns(6.887 − 5.877) × 10−7 = 1.01 × 10−7 = 101 ns-
125 kV(5.179 − 4.489) × 10−7 = 0.69 ×10−7 = 69 ns(6.662 − 5.703) × 10−7 = 0.96× 10−7 = 96 ns-
150 kV(4.539 − 3.769) × 10−7 = 0.77 ×10−7 = 77 ns(5.699 − 4.969) × 10−7 = 0.73 × 10−7 = 73 ns-
−100 kV(9.488 − 8.658) × 10−7 = 0.83 × 10−7 = 83 ns(29.930 − 27.715) × 10−7 = 2.215 × 10−7 = 221 ns(25.70 − 24.75) × 10−7 = 0.95 × 10−7 = 95 ns
−125 kV(8.87 − 6.46) × 10−7 = 2.41 × 10−7 = 241 ns(11.555 − 9.435) × 10−7 = 2.12 × 10−7 = 212 ns(20.63 − 17.88) × 10−7 = 2.75 × 10−7 = 275 ns
−150 kV(6.67 − 4.95) × 10−7 = 1.72 × 10−7 = 172 ns(9.142 − 6.432) × 10−7 = 2.71 × 10−7 = 271 ns(12.78 − 8.5) × 10−7 = 4.28 ×10−7 = 428 ns
Disclaimer/Publisher’s Note: The statements, opinions and data contained in all publications are solely those of the individual author(s) and contributor(s) and not of MDPI and/or the editor(s). MDPI and/or the editor(s) disclaim responsibility for any injury to people or property resulting from any ideas, methods, instructions or products referred to in the content.

