Article

Computational Analysis of Blended Winglet Designs to Reduce the Wake Turbulence on the Airbus A380 Wingtip

by
Joseph Ciano Pinto
1,
Siva Marimuthu
1,*,
Parvathy Rajendran
2,
Manikandan Natarajan
3 and
Rajadurai Murugesan
4
1
Department of Engineering, University of Staffordshire, Stoke-on-Trent ST4 2DE, UK
2
School of Aerospace Engineering, University Sains Malaysia, Nibong Tebal, Seberang Perai 14300, Malaysia
3
Department of Mechanical Engineering, Mohan Babu University, Tirupati 517102, India
4
Department of Aeronautical Engineering, Nitte Meenakshi Institute of Technology, Bengaluru 560064, India
*
Author to whom correspondence should be addressed.
Submission received: 20 February 2025 / Revised: 24 March 2025 / Accepted: 26 March 2025 / Published: 29 March 2025

Abstract

:
The aviation sector faces a significant challenge in balancing the rising demand for air travel with the need to reduce its environmental impact. Because air travel accounts for approximately 2.5% of global carbon emissions, there is a need to find sustainable solutions to reduce its environmental impact. Improving aerodynamic performance is a crucial area for reducing fuel consumption and emissions. Nowadays, more focus is given to commercial aviation, which contributes to global aviation emissions. The A380 is the largest passenger aircraft in the world at the moment. It was observed in real life that the wake turbulence from the A380 led to a sudden loss of the Challenger aircraft’s control and a rapid descent of more than 10,000 feet. This Challenger incident is a wake-up call to address the A380’s wake turbulence. Hence, this research focuses on designing and analysing blended winglets for the Airbus A380 to reduce wake turbulence. With the use of modern computational fluid dynamics tools, the current A380 winglets’ performance was evaluated to identify the level of lift, drag and wake vortex patterns. To address these challenges, the performance of newly designed blended winglets with different cant angles, i.e., 0, 15, 45 and 80, was analysed computationally using the K-ω SST turbulent model in the software ANSYS Fluent 2024 R1. It resulted in a decrease in the wake vortex size accompanied by a 1.724% decrease in drag. This research project evidenced that addressing the wake turbulence issue on a large aircraft could improve aerodynamic performance and thus contribute towards sustainable aviation.

1. Introduction

The aviation industry, a cornerstone of modern global transportation, faces the significant challenge of balancing the rising demands of air travel with efforts to minimise its environmental impact. For example, the United Kingdom’s Department for Transport aims to reduce aviation emissions to 19.3 metric tons of carbon dioxide by 2050 [1]. The aviation industry contributes to about 2.5% of global carbon emissions [2]. The COVID-19 pandemic caused a brief drop in air travel, but the demand is predicted to rebound by 2030, highlighting the need for sustainable aviation solutions. Improving aerodynamic performance is essential to reducing fuel consumption and carbon emissions. The efficiency of an aircraft is greatly impacted by optimising lift and drag forces, especially with the help of winglets which can on average cut fuel consumption by 4–6% [3]. Lift is the force necessary to counteract an aircraft’s weight; it is influenced by the wing shape and airspeed [4]. Drag is the resistance an aircraft experiences while in motion. Anderson [5] explained that there are two main types of drag. They are (i) induced drag, which is caused by the generation of lift, and (ii) parasitic drag, which is caused by the shape and form of the aircraft. Apart from the negative lift vector, the induced drag generation is also influenced by the shape and size of the wing. The formula for the induced drag coefficient ( C D i ) is [6]
C D i = C L 2 π A R e
where CL is the lift coefficient, AR is the aspect ratio, e is the efficiency factor and π is equal to 3.14. Fundamentally, lift generation is dependent on the formation of a pressure difference between the upper and lower surfaces of the wing [7]. Due to this pressure difference, the region near the tip of the wing experiences a flow of high-pressure air from beneath the wing moving to a low-pressure region above, resulting in the formation of wingtip vortices which contribute to induced drag. Wingtip vortices are the swirling air motion that trails behind the wing. When viewed from behind, these vortices rotate counterclockwise around the right wingtip and clockwise around the left wingtip. When these vortices combine, it generates a downward airflow known as downwash, which reduces the lift and increases drag [8]. Figure 1a,b illustrate this phenomenon.
The larger and stronger the vortices and their associated downwash, the greater the impact of induced drag. Kroo [11] states that induced drag from wingtip vortices can account for 30–40% of the total drag on an airliner during the cruise phase of flight. During take-off and landing, the wingtip’s vortices decay rapidly near the ground due to the ground effect, which limits vortex formation, as the ground acts as a barrier [12]. In addition to increasing the induced drag and impacting the efficiency of an aircraft, these vortices can pose a risk to other aircraft, potentially causing wake turbulence that can lead to an unexpected loss of control and altitude of another aircraft flying behind or in its flight path [13]. On 7 January 2017, the Challenger 604 encountered severe wake turbulence from an A380 (shown in Figure 2), causing a rapid uncontrolled descent of more than 10,000 feet. The crew managed to regain control and performed an emergency landing [14].
Due to its significant vortices, the A380 received a special “Super” classification, as listed in Table 1, to mitigate wake turbulence incidents. Many standards and procedures are established to safeguard other aircraft when operating near the A380. For departing aircraft taking off behind the Airbus A380, it is recommended that a heavy category aircraft maintain at least 2 min of separation and medium/light category aircraft maintain at least 3 min of separation. For arriving aircraft landing behind the Airbus A380, it is recommended that a medium category aircraft maintain at least 3 min of separation and light category aircraft maintain at least 4 min of separation.
Figure 3 shows the hazards of wake turbulence, emphasising the importance of analysing wingtip geometry to minimise vortex formation and reduce induced drag. Reducing the induced drag can be achieved by increasing the aspect ratio, which is the ratio of the wingspan to the average chord length. Extending the wingspan creates a slender wing shape that reduces the induced drag by minimising lift at the wingtips, resulting in smaller vortices [17], as depicted in Figure 4a. However, longer wings can cause structural issues, reduce measurability and limit airport gate compatibility. Guzelbely [18] suggested altering the taper ratio where the chord length decreases from the root to tip, as shown in Figure 4b, and reducing airflow towards the wingtip and diminishing vortices. However, tapering optimises lift distribution and can introduce structural challenges [19]. Based on the observations noted in previous research [20,21,22,23,24,25], it was concluded that sharkskin-inspired surfaces would not be suitable for induced drag reductions.
Controlling the induced drag generated at the wingtips is crucial for enhancing efficiency. To minimise induced drag, the most common solution is the addition of winglets. These devices are fixed at the wingtips to obstruct the circulation of high-pressure air from below the wing to the lower-pressure area above it. Winglets also introduce secondary vortices that disrupt the primary vortices. During the 1980s, the Boeing Company produced canted winglets on the Boeing 747-400 to increase the load-carrying capacity and range of the aircraft. A cant angle is defined as the angle between the vertical axis and the winglet. However, winglets may not perform optimally in all phases of flight. Guerrero et al. noted that winglets can generate parasitic drag (in their Onera M6 wing with a 3.06 angle of attack analysed at 0.8 Mach using the K-omega turbulence model), so their viability depends on whether the reduction in induced drag outweighs the increase in parasitic drag [28]. Figure 5 depicts the performance of two hypothetical wings with and without winglets. During the climb phase, winglets reduce overall drag for the same lift coefficient, justifying their use. However, during cruise, the reduction in lift-induced drag is lower than the additional increase in parasitic drag.
Newman [29] performed both computational (using a steady state and implicit solver with a laminar flow model at 0.3 Mach) and experimental (using a wind tunnel) analyses to find the effects of varying winglet cant angles on aerodynamic values and suggested that different winglet cant angles can lead to varying outcomes. Their findings indicated that a 30-degree winglet performed best during take-off and cruise with the lowest drag, while a 0-degree winglet is more suitable for descent due to higher drag values. Winglets can also be easily retrofitted to existing aircraft and are therefore a more viable solution. Richard’s work at the NASA Langley Research Centre demonstrated that winglets could reduce induced drag by up to 20% and improve the lift/drag ratio by 6–9% [30]. This improvement translates to better fuel efficiency, longer range and enhanced overall aircraft performance. Blended winglets are an advanced form of winglet technology. Unlike traditional winglets, which are typically angular and resemble a fold at the wingtip, blended winglets feature a smooth curved transition from the wing to the upward extension. This design minimises interference drag, which occurs when two lifting surfaces intersect, leading to a more efficient airflow around the wingtip. These winglets not only reduce fuel consumption by 4–6% but also decrease carbon dioxide emissions by up to 6% and nitrogen oxide emissions by 8%. Additionally, they improve take-off performance, particularly at high altitudes or high-temperature airports. Hence, in this study, a blended winglet with the optimal cant angle was designed and investigated to minimise the wingtip vortices, reduce induced drag and improve the efficiency of the Airbus A380. A new modified blended winglet at four different cant angles was evaluated to test the impacts of the wake vortex size. Unlike other studies, this study mainly focuses on the issues of wake turbulence for large aircraft.

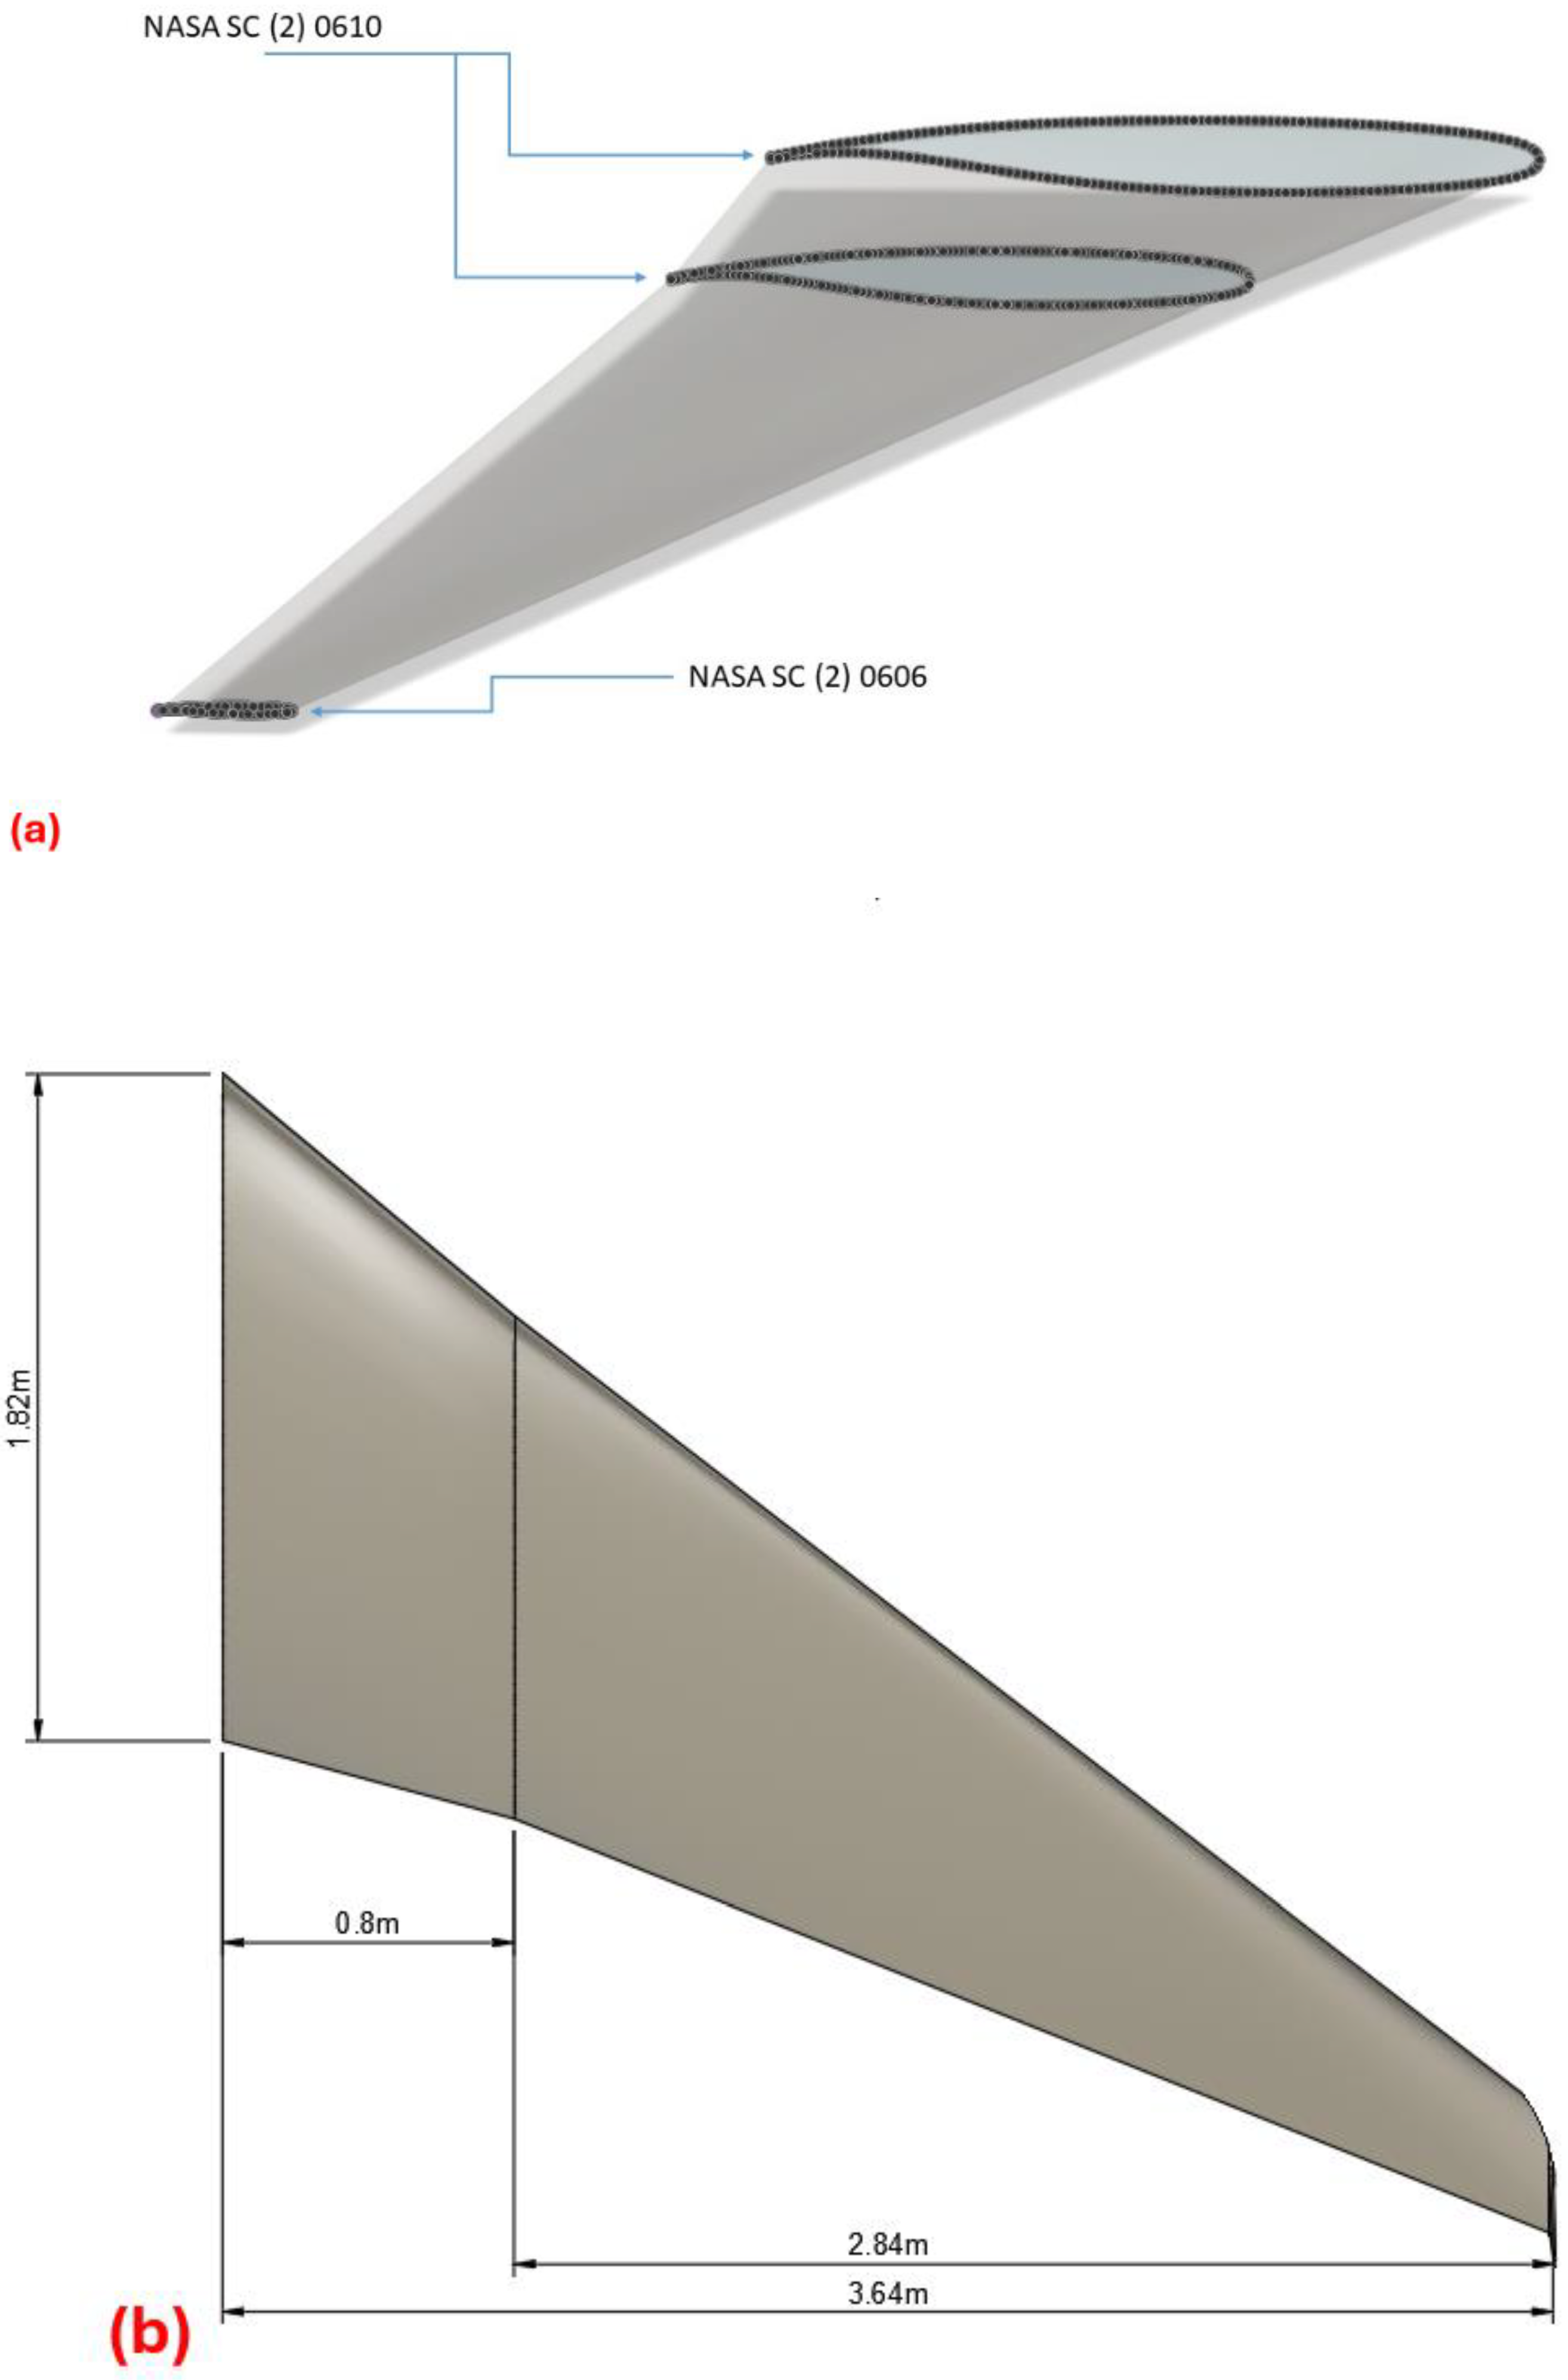
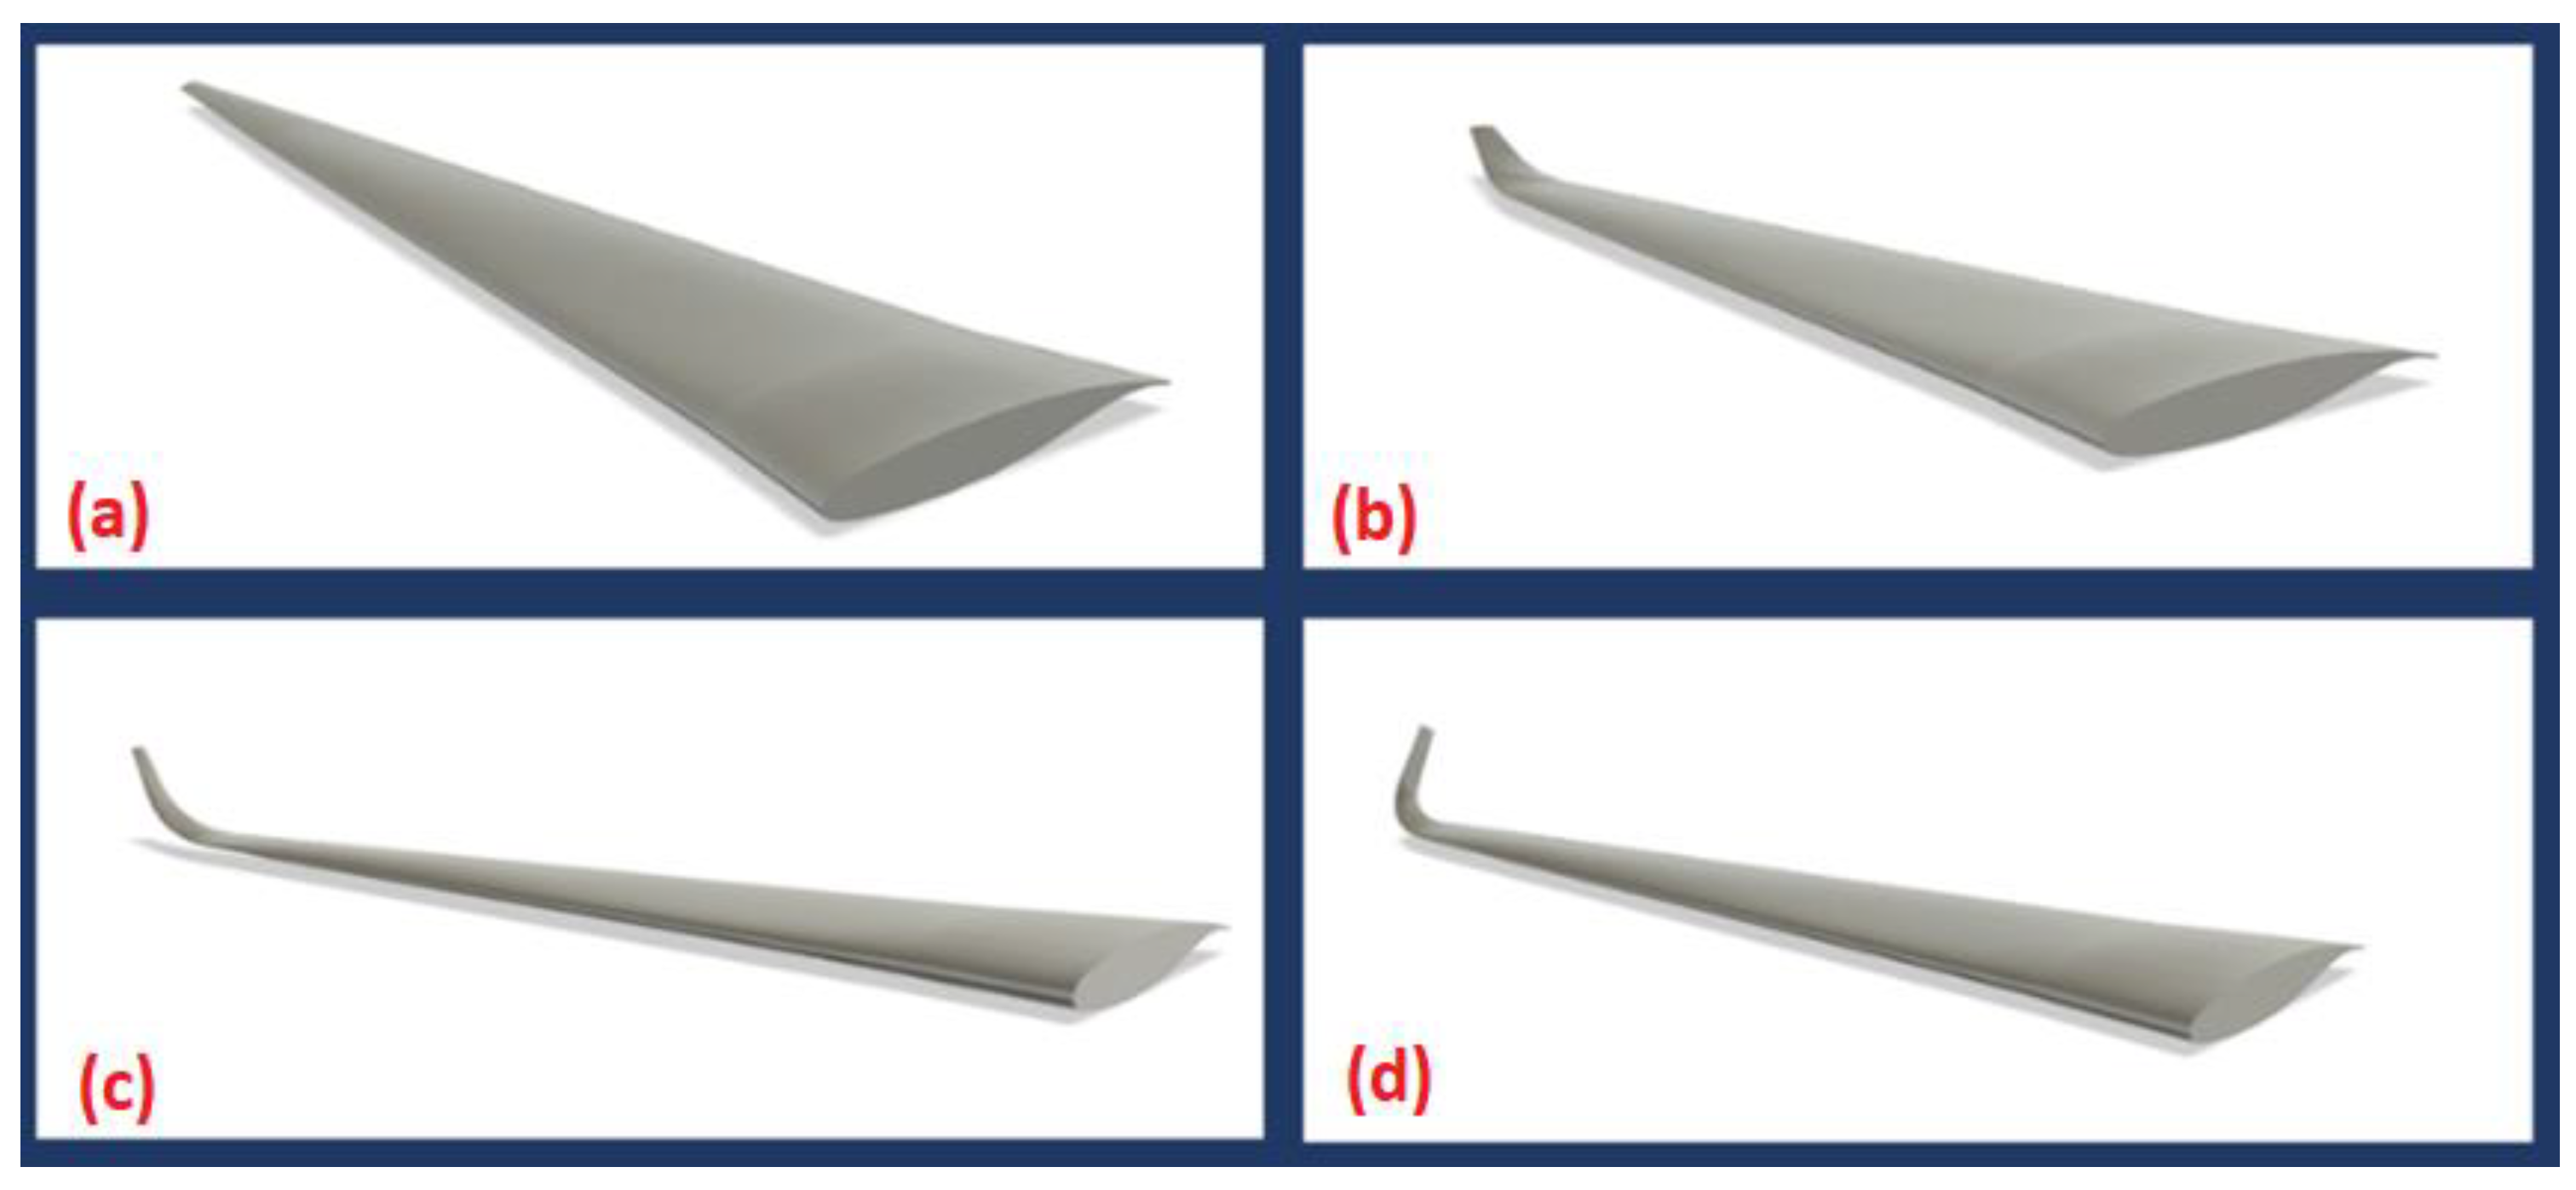
2. Computational Design

The Airbus A380 wing design incorporates three distinct aerofoils [31]. The NASA SC (2) 0610 aerofoil is used for both the root and middle sections, while the NASA SC (2) 0606 is used at the wingtip. These aerofoils are shown in Figure 6a. This aligns with the characteristics of the supercritical wing used on the A380. The supercritical aerofoil designs are optimised to delay the onset of wave drag at transonic speeds [32]. Unlike traditional aerofoils, supercritical designs feature a flattened upper surface and a heavily cambered aft section as well as a large leading-edge radius. These characteristics significantly reduce shock-induced boundary layer separation and produce smaller or weaker shock waves positioned further aft on the wing. This results in a more efficient wing that allows for lower wing sweep and thickness without increasing wave drag. The coordinates of aerofoils were obtained from aerofoiltools.com and then imported into Fusion 360.
The three-dimensional computational model of the A380 wing was developed based on technical drawings from Airbus [33]. These drawings provided the foundation for both the wing and wingtip fence design. The wing measures 36.42 m with a chord length of 18.23 m. The primary aerofoil, with a chord length of 18.25 m, was placed at the origin and the second aerofoil, with a chord length of 13.74 m, was positioned at 7.98 m from the first, and they were connected using the loft command. This process was repeated for the third aerofoil, which has a chord length of 3.8 m, positioned 28.38 m from the middle aerofoil, and another loft command was used to connect them, which is shown in Figure 6b. Both ends of the wing were sealed with the patch command to convert the surface into a solid body. Finally, the wingtip fence was created using an extrude operation based on a sketch of the wingtip fence. Due to limitations in computational power and time, the original A380 wing model was scaled down to 1:10 proportions. This scaling resulted in a model measuring 3.64 m long with a chord length of 1.82 m, as shown in Figure 7. This scaled-down model significantly reduced the computational domain required for analysis, allowing for the use of a denser mesh. A denser mesh enables more accurate simulations of the flow over the wing and wingtips, providing precise results while minimizing computational resources and time. The blended wing and winglet models were constructed similarly to the primary wing model. Figure 8 depicts the A380 wing model with different cant angle configurations (0, 15, 45 and 80 degrees) of the blended winglet. The lengths and cant angles of the designs are listed in Table 2.

3. Computational Simulations

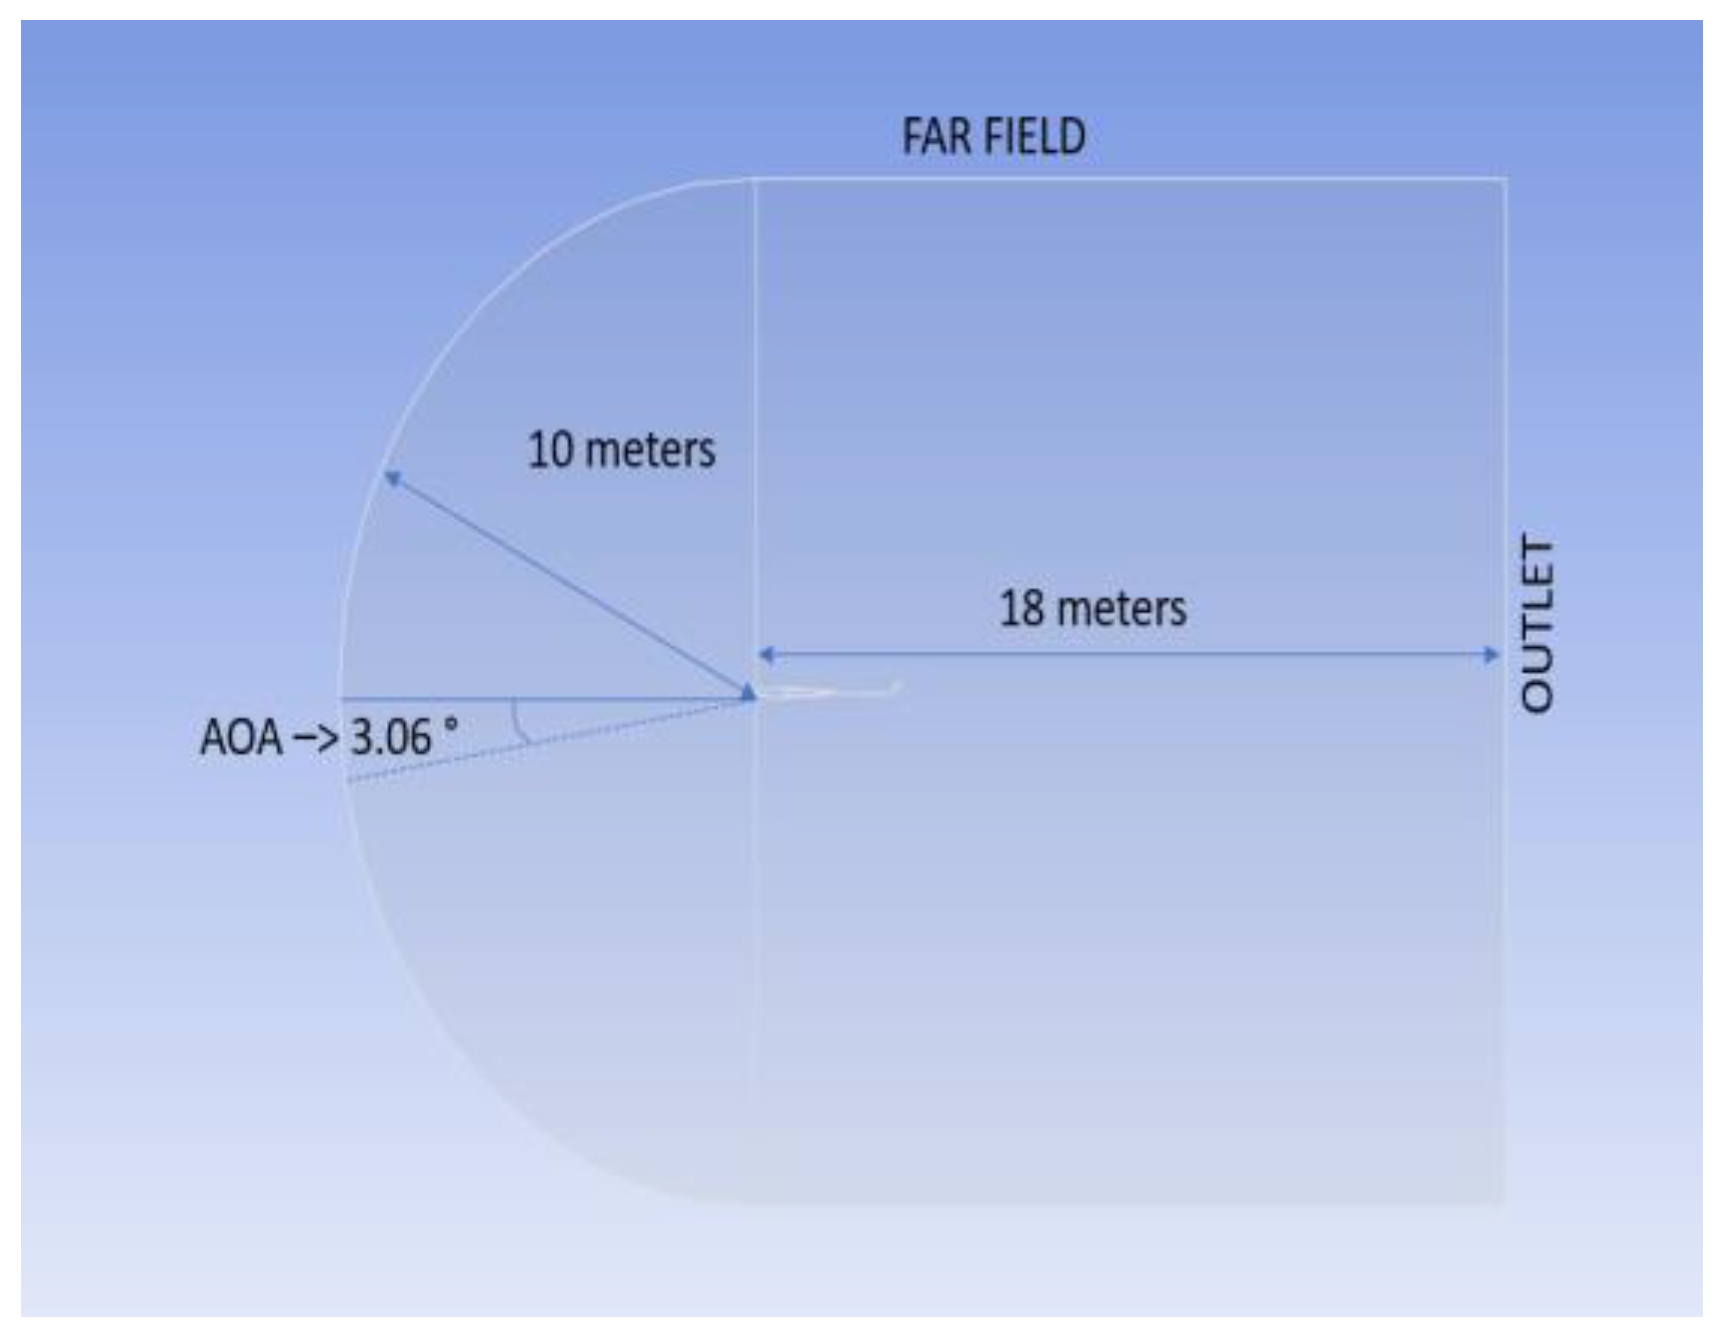
3.1. Computational Domain

The wing model was imported into the Ansys Design Modeler 2024 R1, where a C-type computational domain was created, as shown in Figure 9. This boundary extends 10 m in front of the wing and 18 m behind it. A C-grid domain creates a high-density region in crucial areas along the wing’s top and lower surfaces, where flow perturbations are most significant. This configuration excels at resolving the wake region behind the wing, accurately simulating vortex generation [34]. The concentrated grid distribution enhances the accuracy of predicting pressure distribution and shock location, especially in transonic flows. A body of influence was added near the wing to improve mesh refinement in that region, resulting in better simulation outcomes. The entire domain was converted to a fluid domain, setting up the simulation to model fluid flow around the wing. The wing model itself was subtracted from the domain using a Boolean command, effectively creating a void in the fluid domain where the wing model is positioned. This ensures an accurate representation of the airflow interaction with the wing.

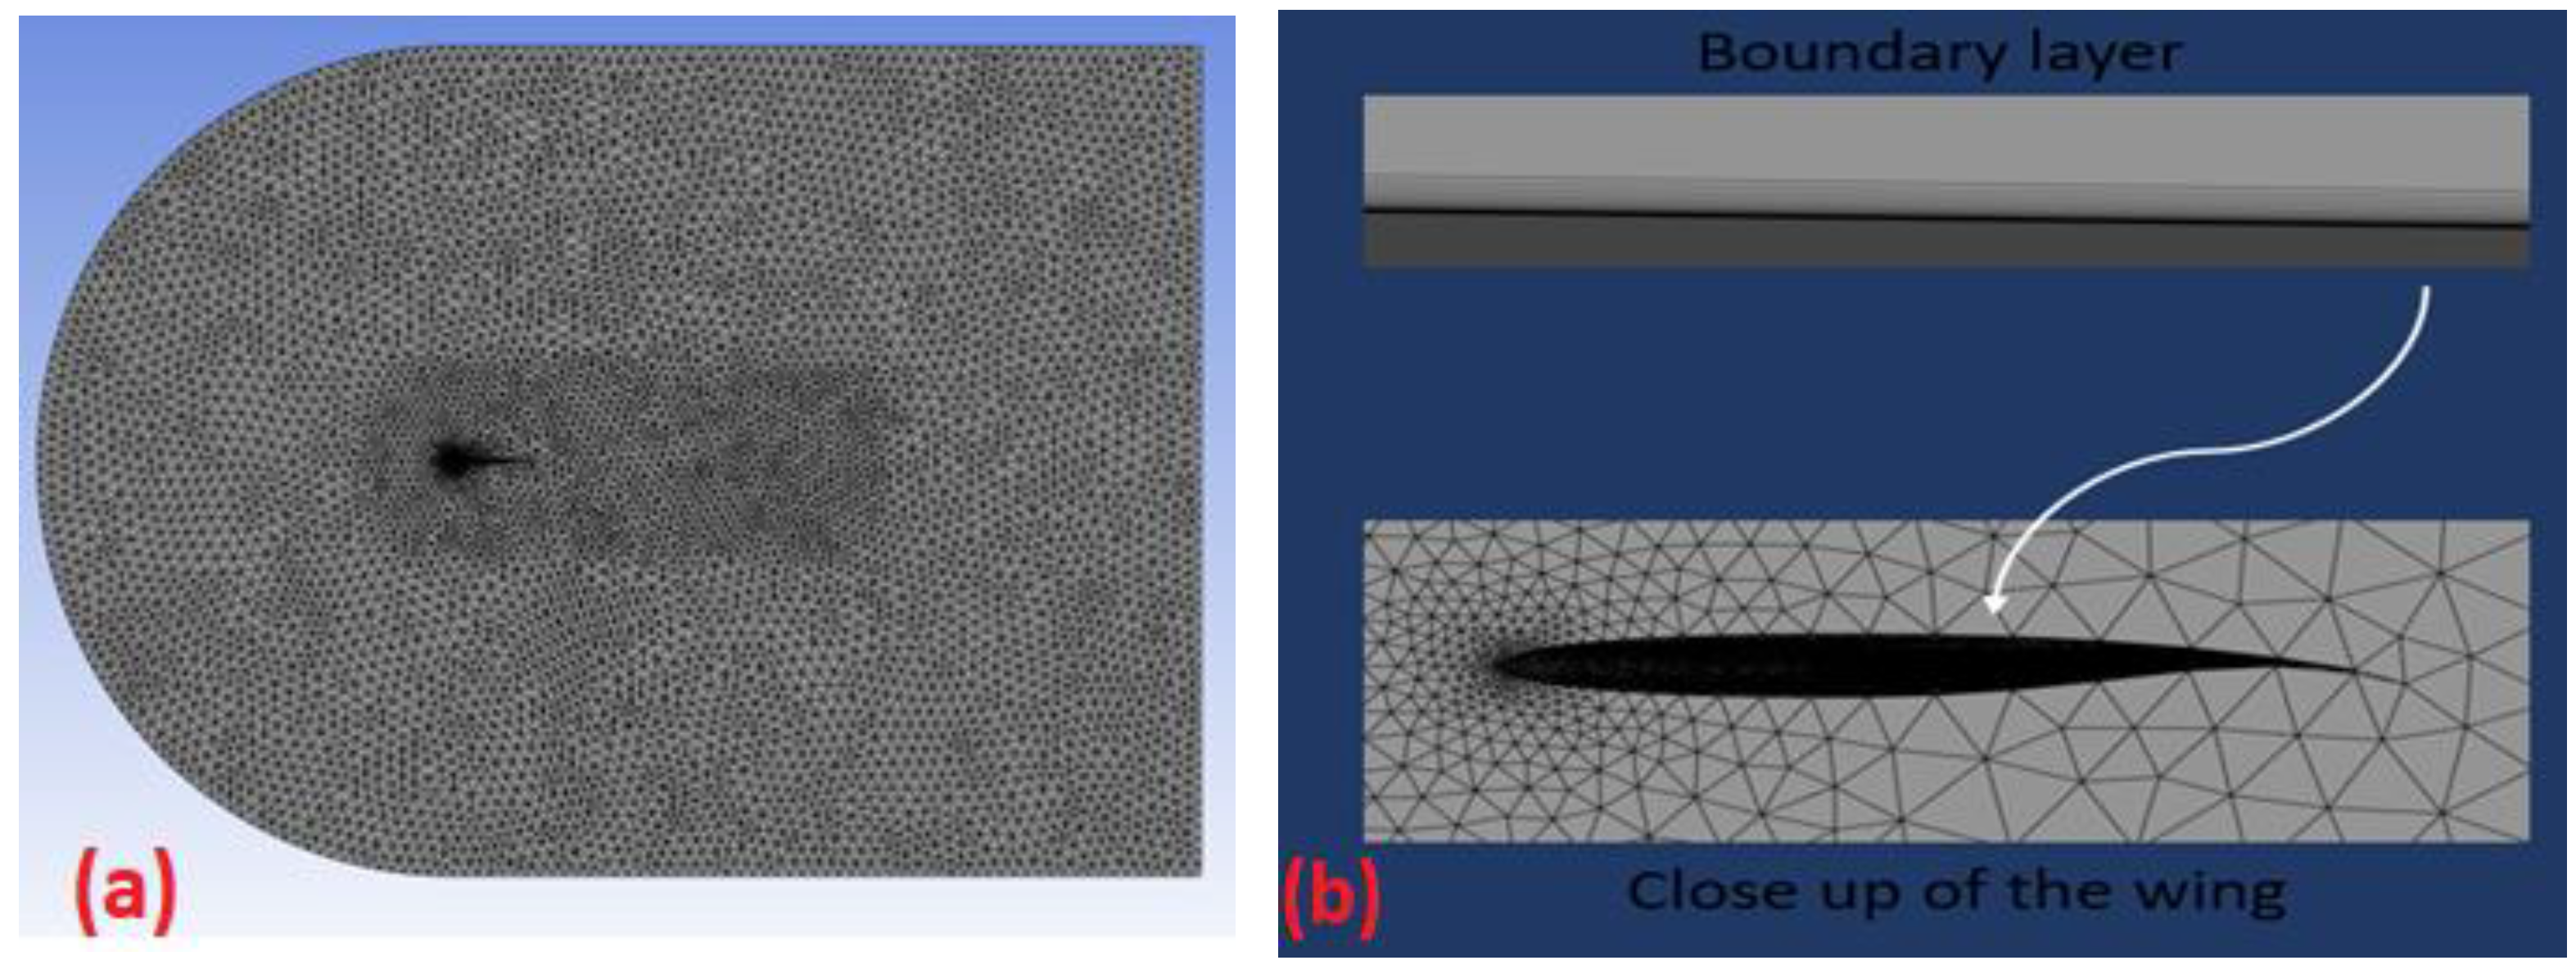
3.2. Computational Mesh

In Ansys Meshing, the primary element size was set to 0.2 m and body sizing was applied to the body of influence with an element size of 0.15 m to refine the mesh in areas near the wing, where capturing flow characteristics is critical. To accurately capture the wing’s surface geometry, face meshing was employed. Furthermore, an inflation layer was added to the mesh. The first layer height was set to match the wall y-plus value, ensuring proper resolution of the boundary layer. In this case, the first layer height was set at 5.1 × 10⁻⁶ m, calculated to achieve a wall y-plus value of one [35]. The bulk of the mesh consists of tetrahedral cells, and they offer flexibility and precision, especially in complex geometries [36]. The mesh obtained has an average skewness of 0.24 and an average orthogonal quality of 0.75, indicating good mesh quality. Skewness measures how closely the mesh elements match ideal geometric shapes, with lower values indicating less distortion [37]. An inflation layer was used on the wing to add the first layer thickness to achieve a y-plus value of 1. The orthogonal quality evaluates how perpendicular adjacent mesh elements are, with higher values indicating better alignment. Overall, these metrics suggest that the mesh is of good quality. Figure 10 displays the complete mesh along with a close-up of the boundary layer.

3.3. Computational Analysis

The Navier–Stokes equations are fundamental for understanding turbulent flows. However, solving these equations for practical engineering applications is often impractical, even with advanced supercomputers [38]. Reynolds-averaged Navier–Stokes equations are a simplified form of the Navier–Stokes equations and are often used in engineering simulations. They function by taking the average of turbulent fluctuations across time [39]. The K-ω SST turbulence model was selected because it is widely used in engineering applications and is particularly good at predicting the rates at which free shear flows spread, which is an important feature of turbulent flow simulations. Additionally, this model performs exceptionally well in predicting turbulent flows close to the boundary, which is essential for accurately modelling flow separations, recirculation zones and boundary layer phenomena [40,41]. The K-ω SST model is a versatile model that can handle a wide range of flow regimes, including detached and attached flows, transitional states and complex geometries. These characteristics make it especially suitable for studying wake turbulence. The final mesh has 2.9 million elements. A density-based solver is used, as it is suitable for compressible flows [42]. A steady-state solver that is not time-dependent is utilised, since it requires less computational time. The properties of air are estimated using the ideal gas option for the density and the Sunderland model is used for the viscosity model. In terms of boundary conditions, the simulation is carried out at an altitude of 13,000 m, which is typical for the Airbus A380 [43]. A 3.06-degree angle of attack is used at a speed of Mach 0.85. A pressure far-field condition is utilised at the intake with an operating pressure of 16,491 Pa and a temperature of 216.7 K. The explicit solver is used to improve computing performance. The Reynolds number [44] is calculated using the formula
ρ v L μ = 9820372
where ρ = the density of the fluid, v = the velocity of the fluid, L = the linear dimension and μ = the dynamic viscosity of the fluid. The fluid flow is identified as turbulent. The study involved five independent simulations of the Airbus A380 original wing with a wingtip fence configuration, as well as four different simulations of the A380 wing with blended winglets at different cant angles (0, 15, 45 and 80 degrees). Cruise flight conditions were assumed.

4. Result Analysis and Discussion

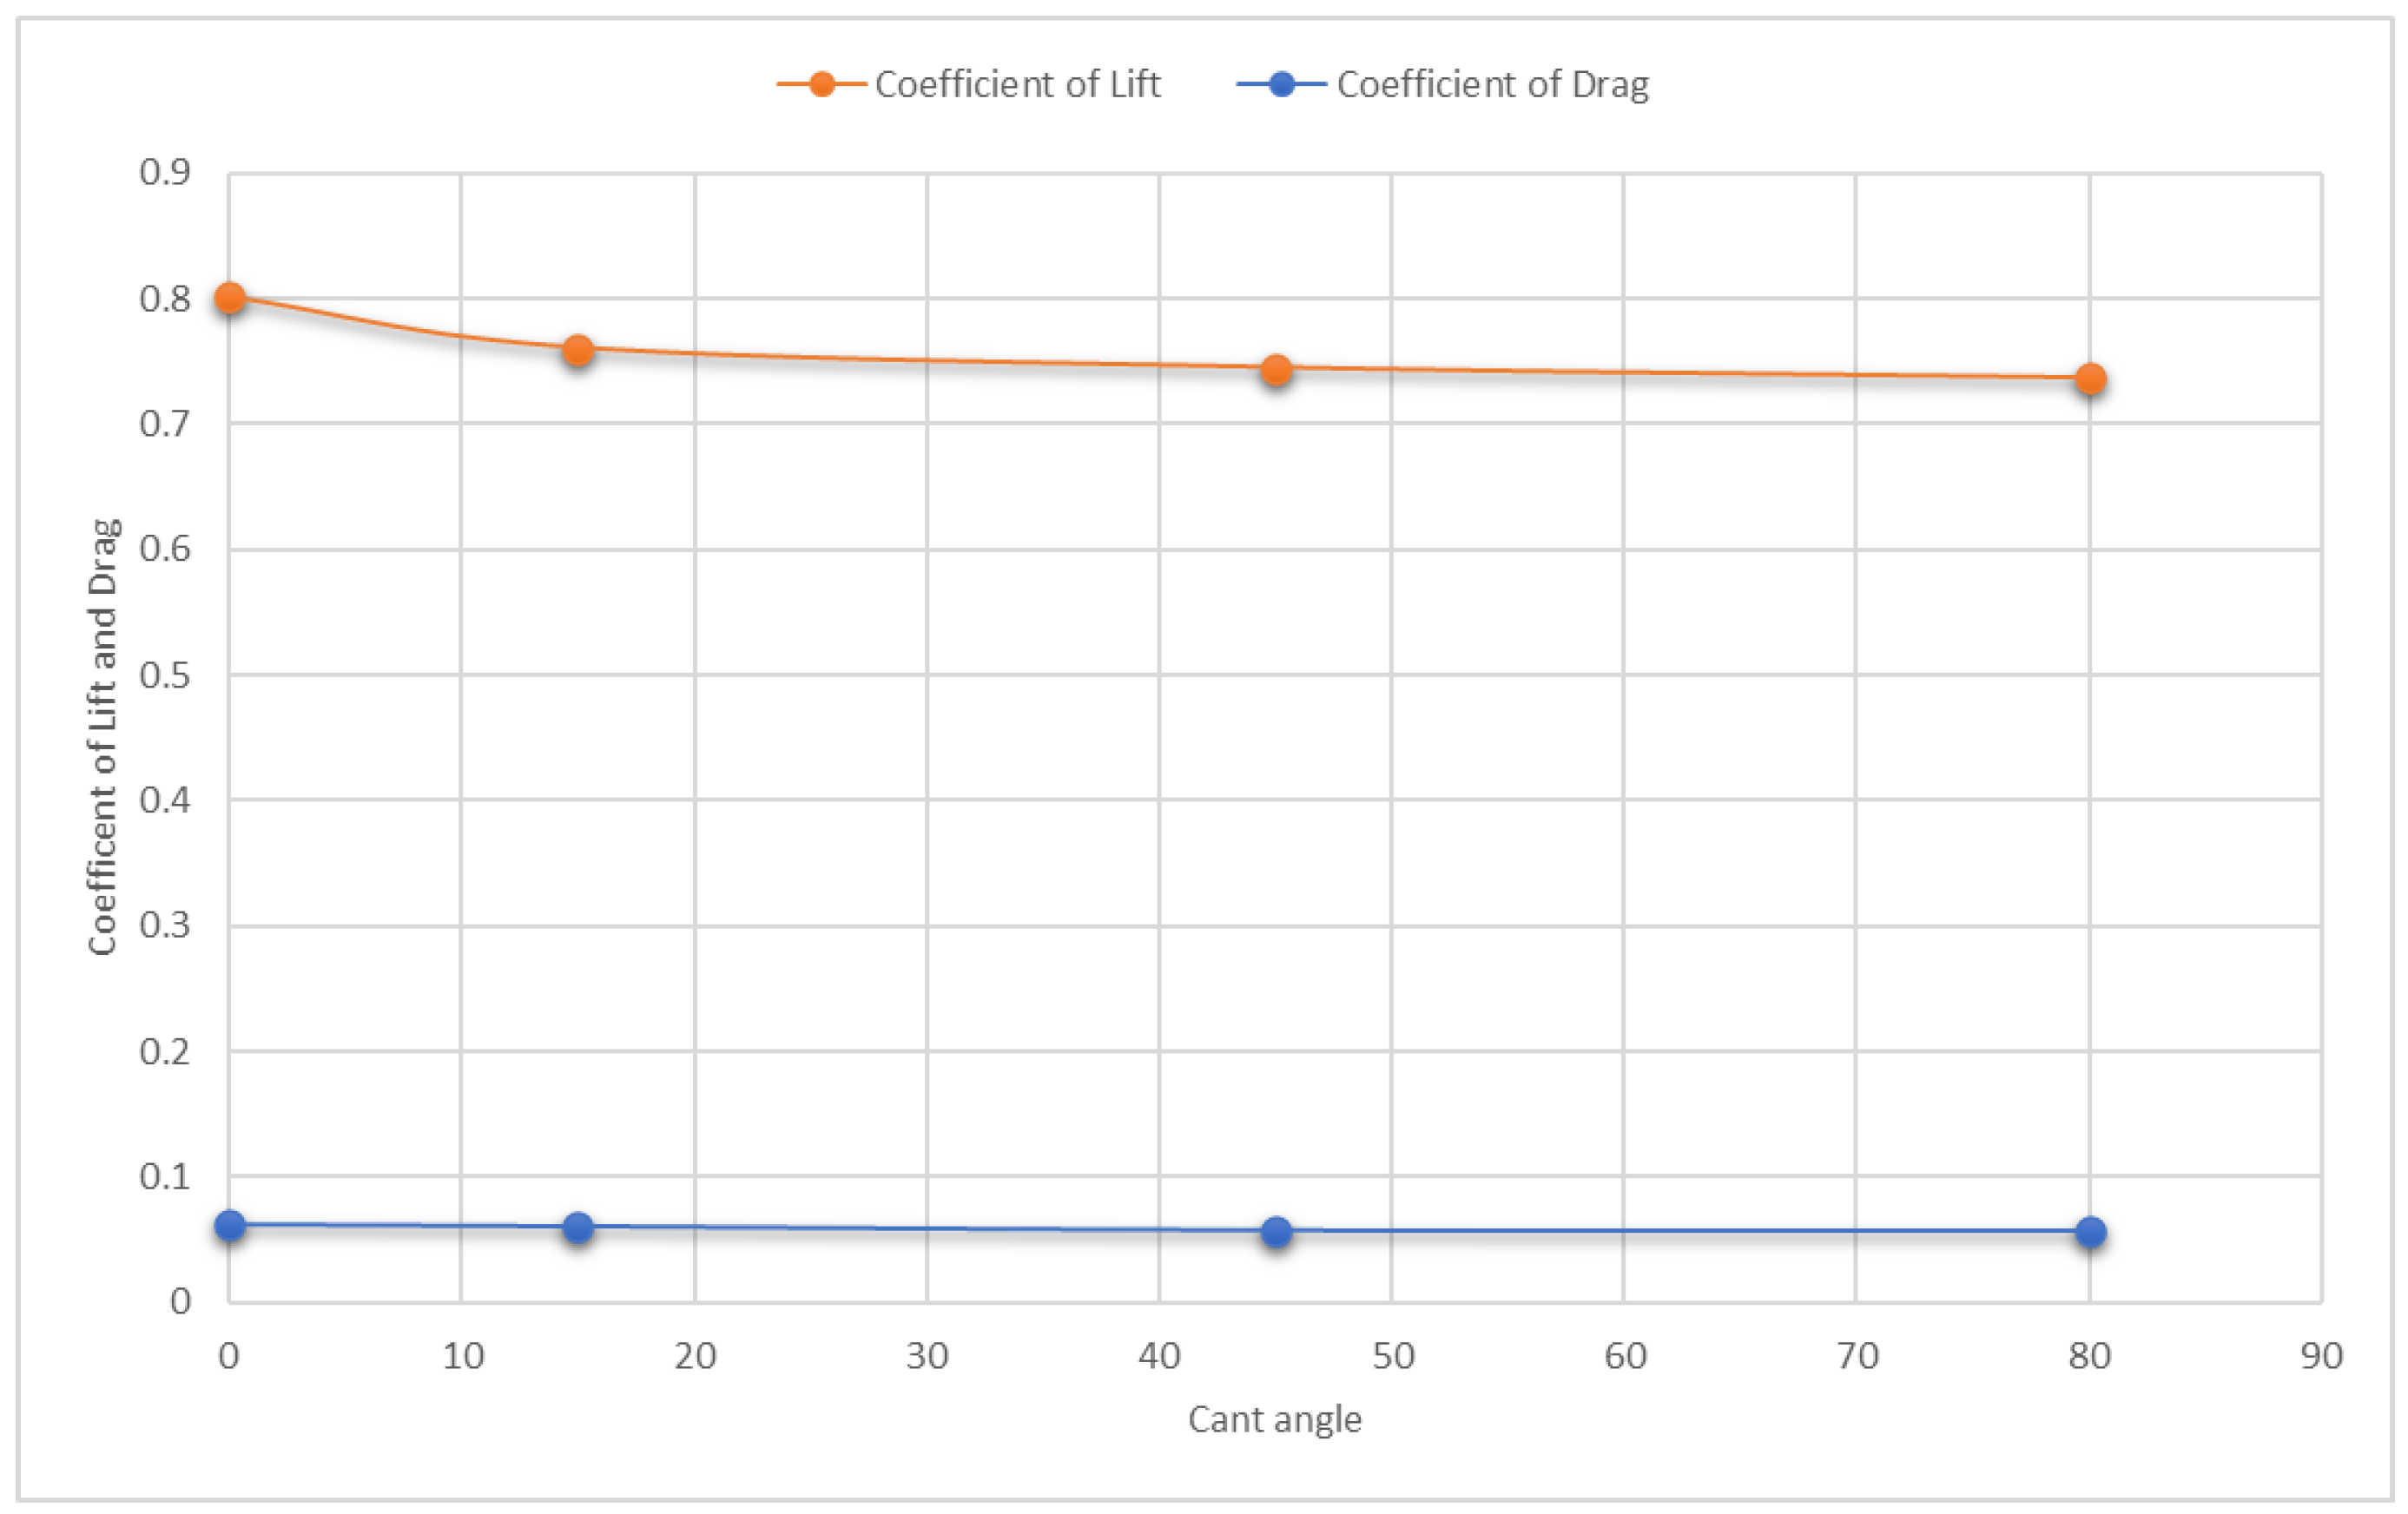
4.1. Lift Coefficient

Table 3 clearly lists all of the lift coefficients obtained at the end of the analysis of the original wingtip fence and blended winglet models at different cant angles. When rounding off to 0.8, the lift values look a bit similar to one another. As expected, the wing with a blended winglet (especially at a zero-degree cant angle) performed much better than the original A380 wing with a wingtip fence.

4.2. Drag Coefficient

Table 4 clearly lists all of the drag coefficients obtained at the end of the analysis of the original wingtip fence and blended winglet models at different cant angles. When rounding off to 0.6, the lift values look a bit similar to one another. As expected, the wing with a blended winglet (especially at an 80-degree cant angle) performed much better than the original A380 wing with a wingtip fence.

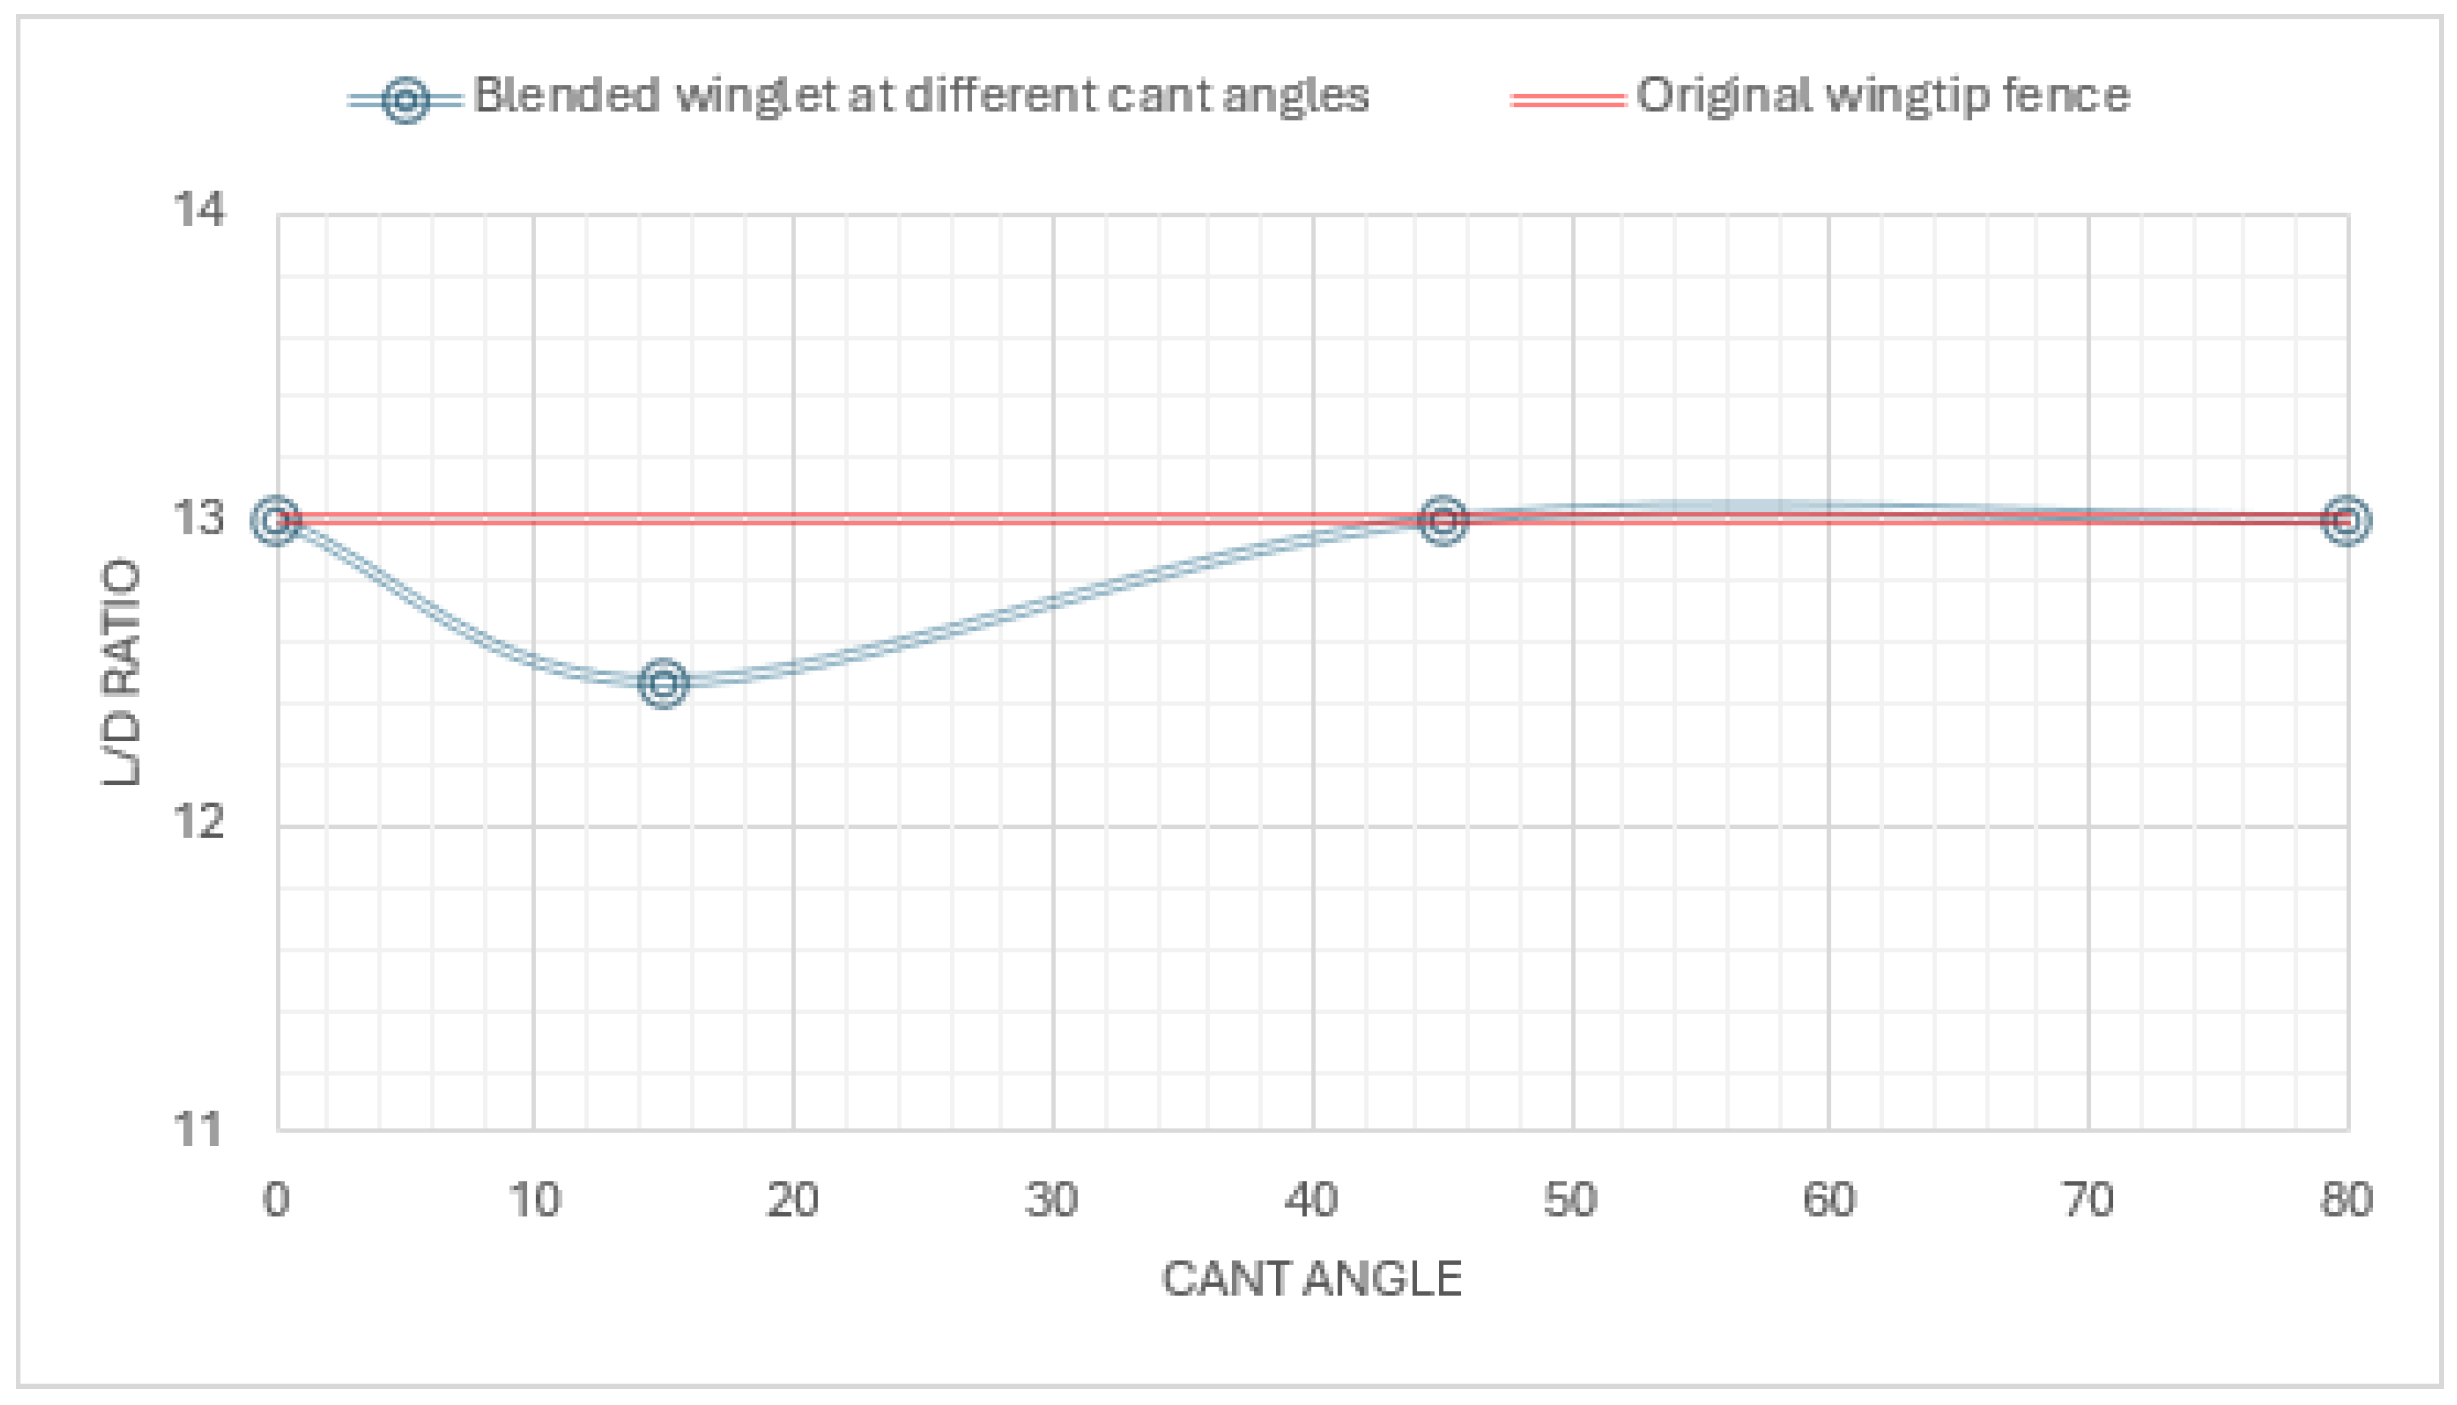
4.3. Lift to Drag Ratio

The lift-to-drag (L/D) ratio is an important metric in aerodynamics that indicates how efficiently an aircraft generates lift relative to drag. A higher L/D ratio signifies better efficiency, allowing the aircraft to fly further and carry more payload while consuming less fuel. This research revealed a lift-to-drag ratio of 13 for the original A380 wing with a wingtip fence configuration. Figure 11 shows the similar ratios calculated from the A380 wing with blended winglet configurations at 0-, 45- and 80-degree cant angles. This implies that the aerodynamic efficiency of the A380 has been preserved by the modified designs.

4.4. Alternative Wingtip for A380

Figure 12 illustrates that the wing with a blended winglet and zero-degree cant angle increases the coefficients of lift and drag to 3.886% and 8.621%, respectively. At a fifteen-degree cant angle, the drag increases by 5.172% with no significant change in the coefficient of lift. At forty-five degrees, the coefficient of drag remains constant. At eighty degrees, the coefficient of lift decreased by 4.533% with no major variation in the coefficient of drag. This research proves that changing the cant angle has an impact on aerodynamic forces, i.e., lift could be increased by up to 3.89% and drag could be reduced by up to 1.724% and the lift-to-drag ratio can be stabilised at 13. Overall, the changes in aerodynamic performance remain relatively consistent across different cant angles (especially at 15 and 45 degrees). Hence, these blended winglet designs can be used as an alternative for a wingtip fence on A380 aircraft.

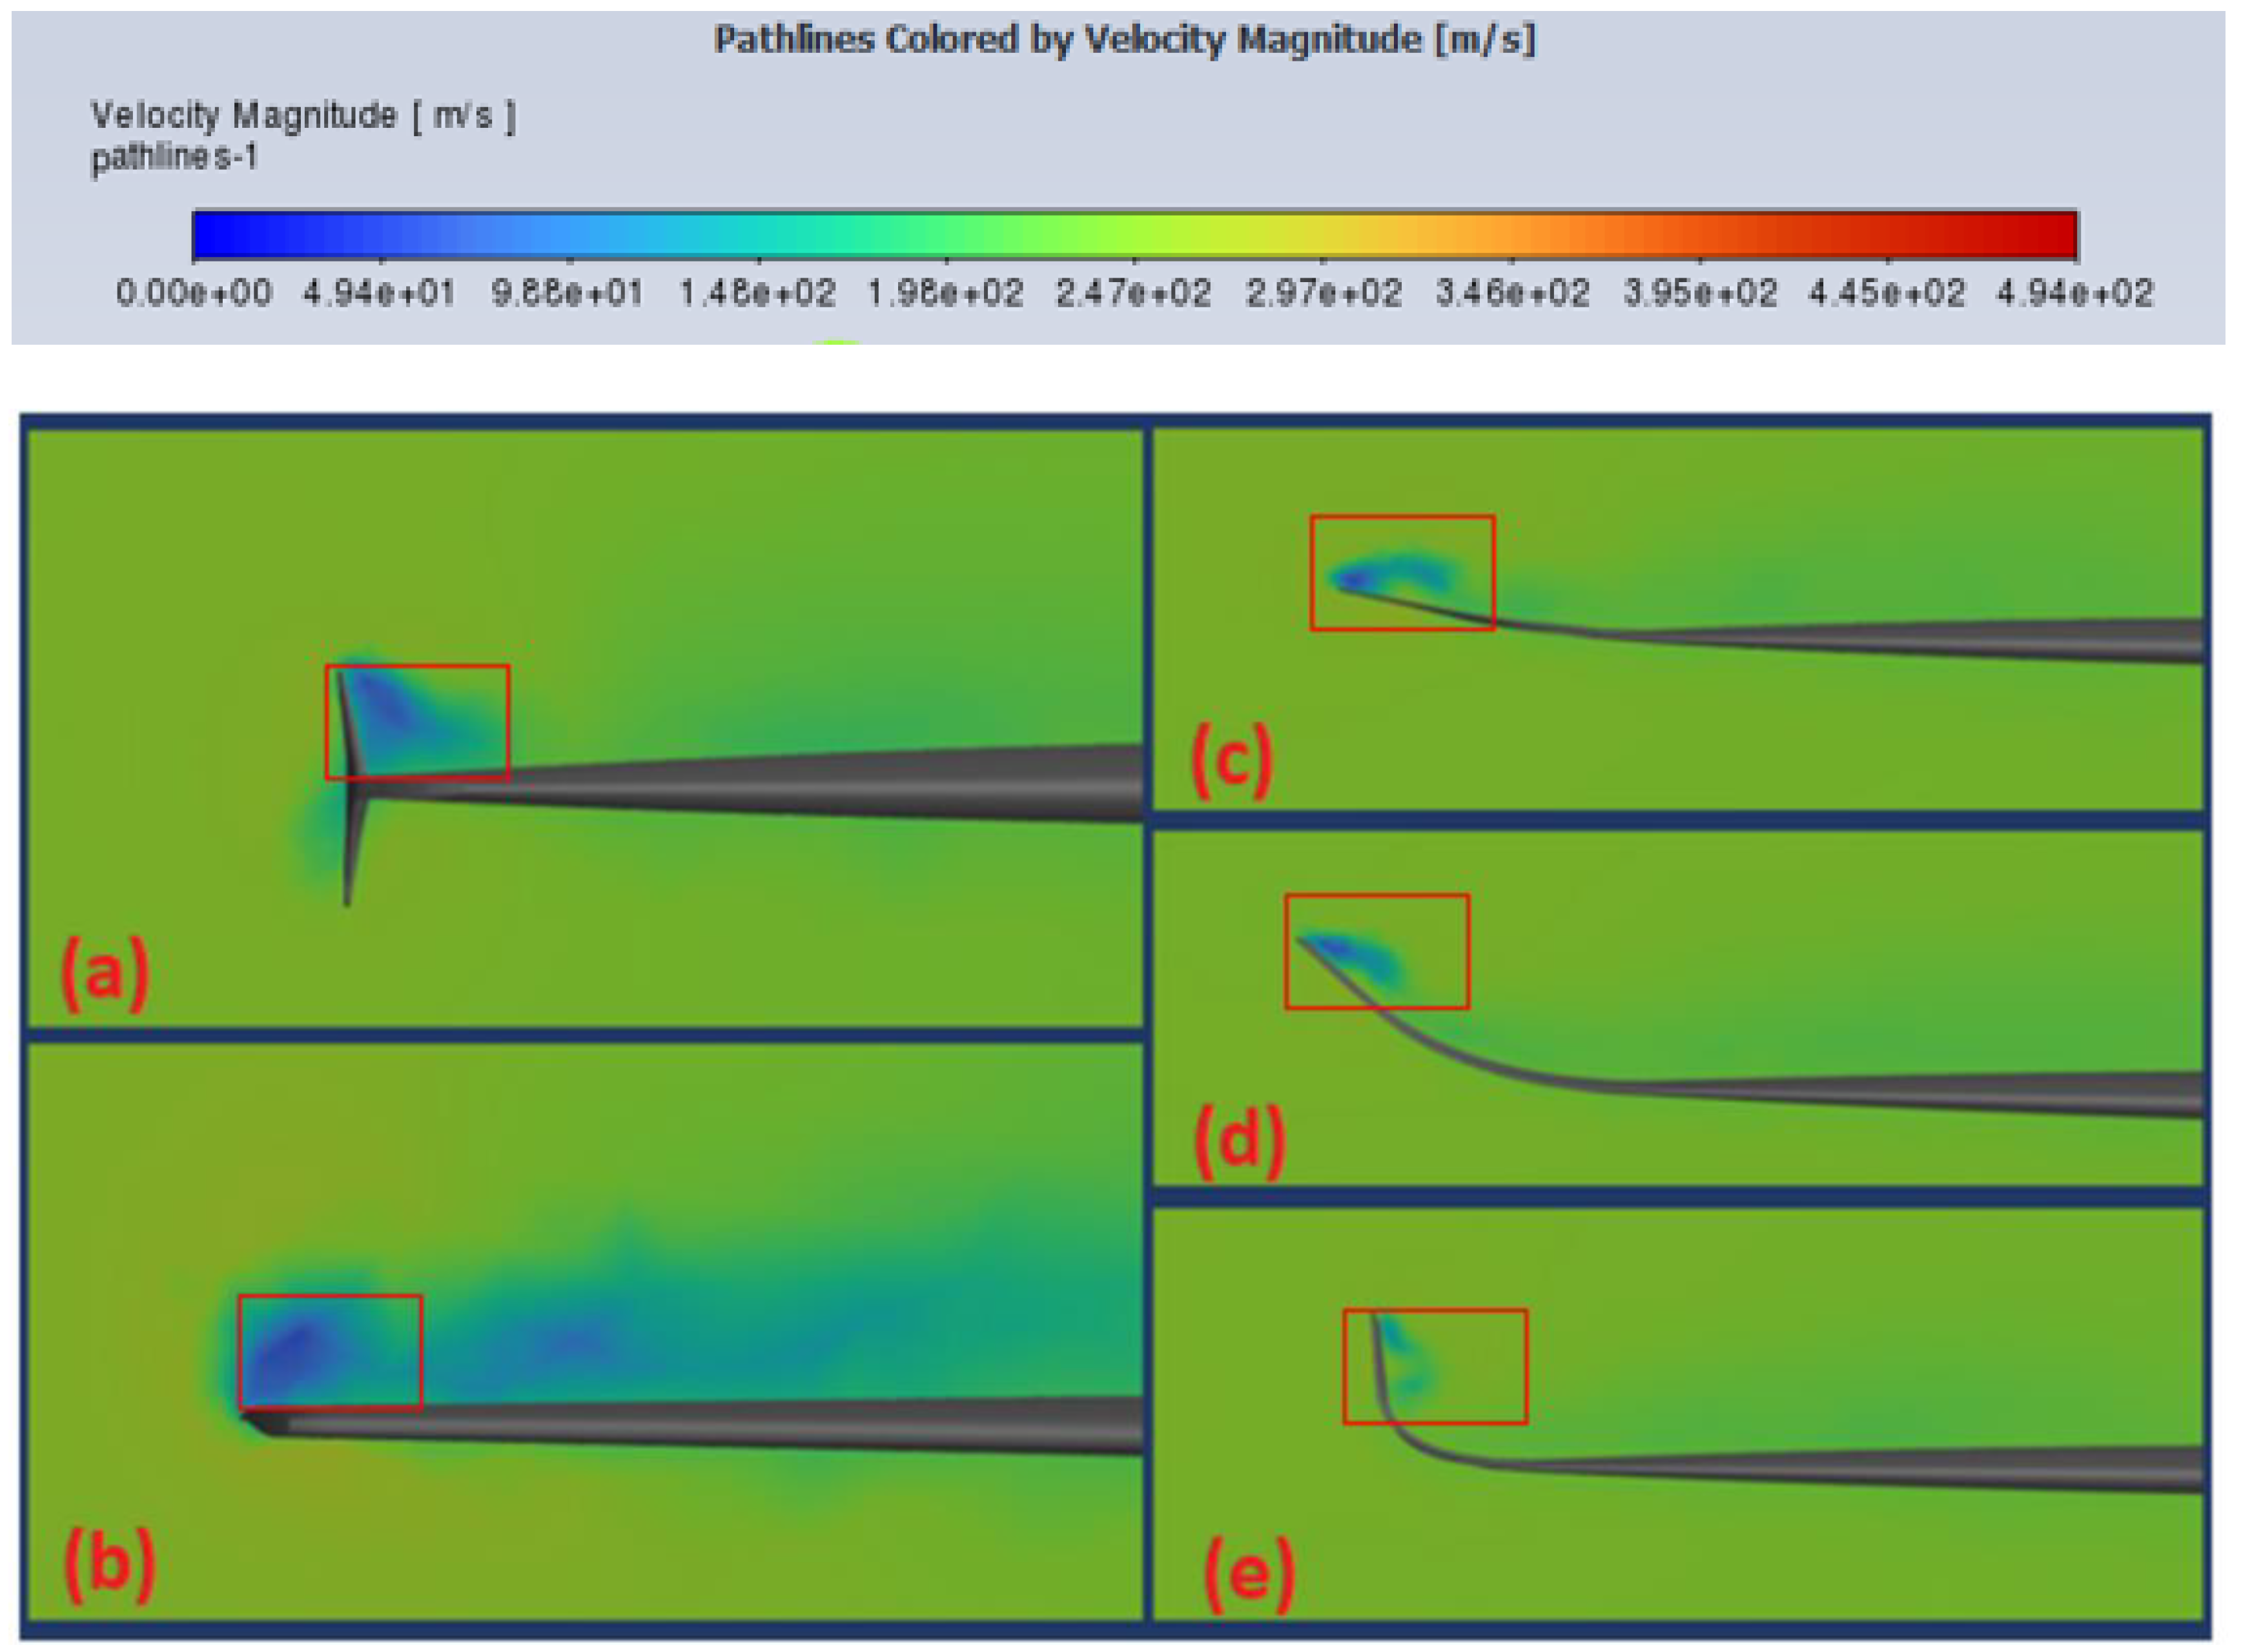
4.5. Wingtip Vortex Elevation

Figure 13 shows that at a zero-degree cant angle, turbulence is significant over the wing’s midsection and trailing sections. Increasing the cant angle to 15 and 45 degrees reduced the turbulence at the wingtip by moving the vortex to a height above the wing surface. At 80 degrees, the vortex is lifted further away from the main wing surface area and there is reduced induced drag generation, which is reflected in the total drag coefficient obtained. The blended winglets with cant angles of 15 and 45 degrees indicate a notable decrease in the size of the wingtip vortex when compared to the original wingtip fence and 0-degree cant angle designs. The vortex size is the smallest at an 80-degree cant angle.

4.6. Downstream Wake Reduction

Figure 14 shows that the wing models with wingtip fence and 0-degree cant angle configurations exhibit large downstream vortices, characterised by a broad area of green contour lines signifying disruption in the airflow and regions of slower-moving air. When the cant angle was increased to 15 and 45 degrees, the length of these slow-moving disruptive fluids was reduced. At 80 degrees, the downstream wake was minimised. This suggests that the turbulent airflow (wake formation) is significantly weakened at higher cant angles.

4.7. Discussion

Figure 13 and Figure 14 clearly show that the size of the wingtip vortex was reduced from a larger level, as shown in Figure 13a and Figure 14a, to a much smaller level, as shown in Figure 13c–e and Figure 14c–e. This was due to the addition of winglets, which lifted the vortices from the wingtip to a height further away from the main wing surface. This reduced the influence of wingtip vortices on the main wing surface and hence resulted in improved aerodynamic values. Moreover, the size of the disturbance was reduced by using winglets at different cant angles. In terms of lift, the wing with a winglet at a zero-degree cant angle performed well. In terms of drag, the wing with a winglet at an 80-degree cant angle performed well.

5. Validation

5.1. Method Validation

A validation study based on Guerrero’s [45] research was conducted to assess the computational method used. Guerrero’s research explored the efficiency of blended winglets in reducing induced drag and vortex formation. The ONERA M6 wing’s simplicity has made it a standard validation case for computational fluid dynamics in external flows. To verify simulation methods, a three-dimensional model of the ONERA wing was created, replicating specified dimensions. The computational domain size and mesh were accurately reproduced with 4.5 million elements due to computational constraints. A Fluent setup was replicated, and results were closely matched to Guerrero’s research, as shown in Table 5. This process validated the methodology for simulating the A380 wing effectively.

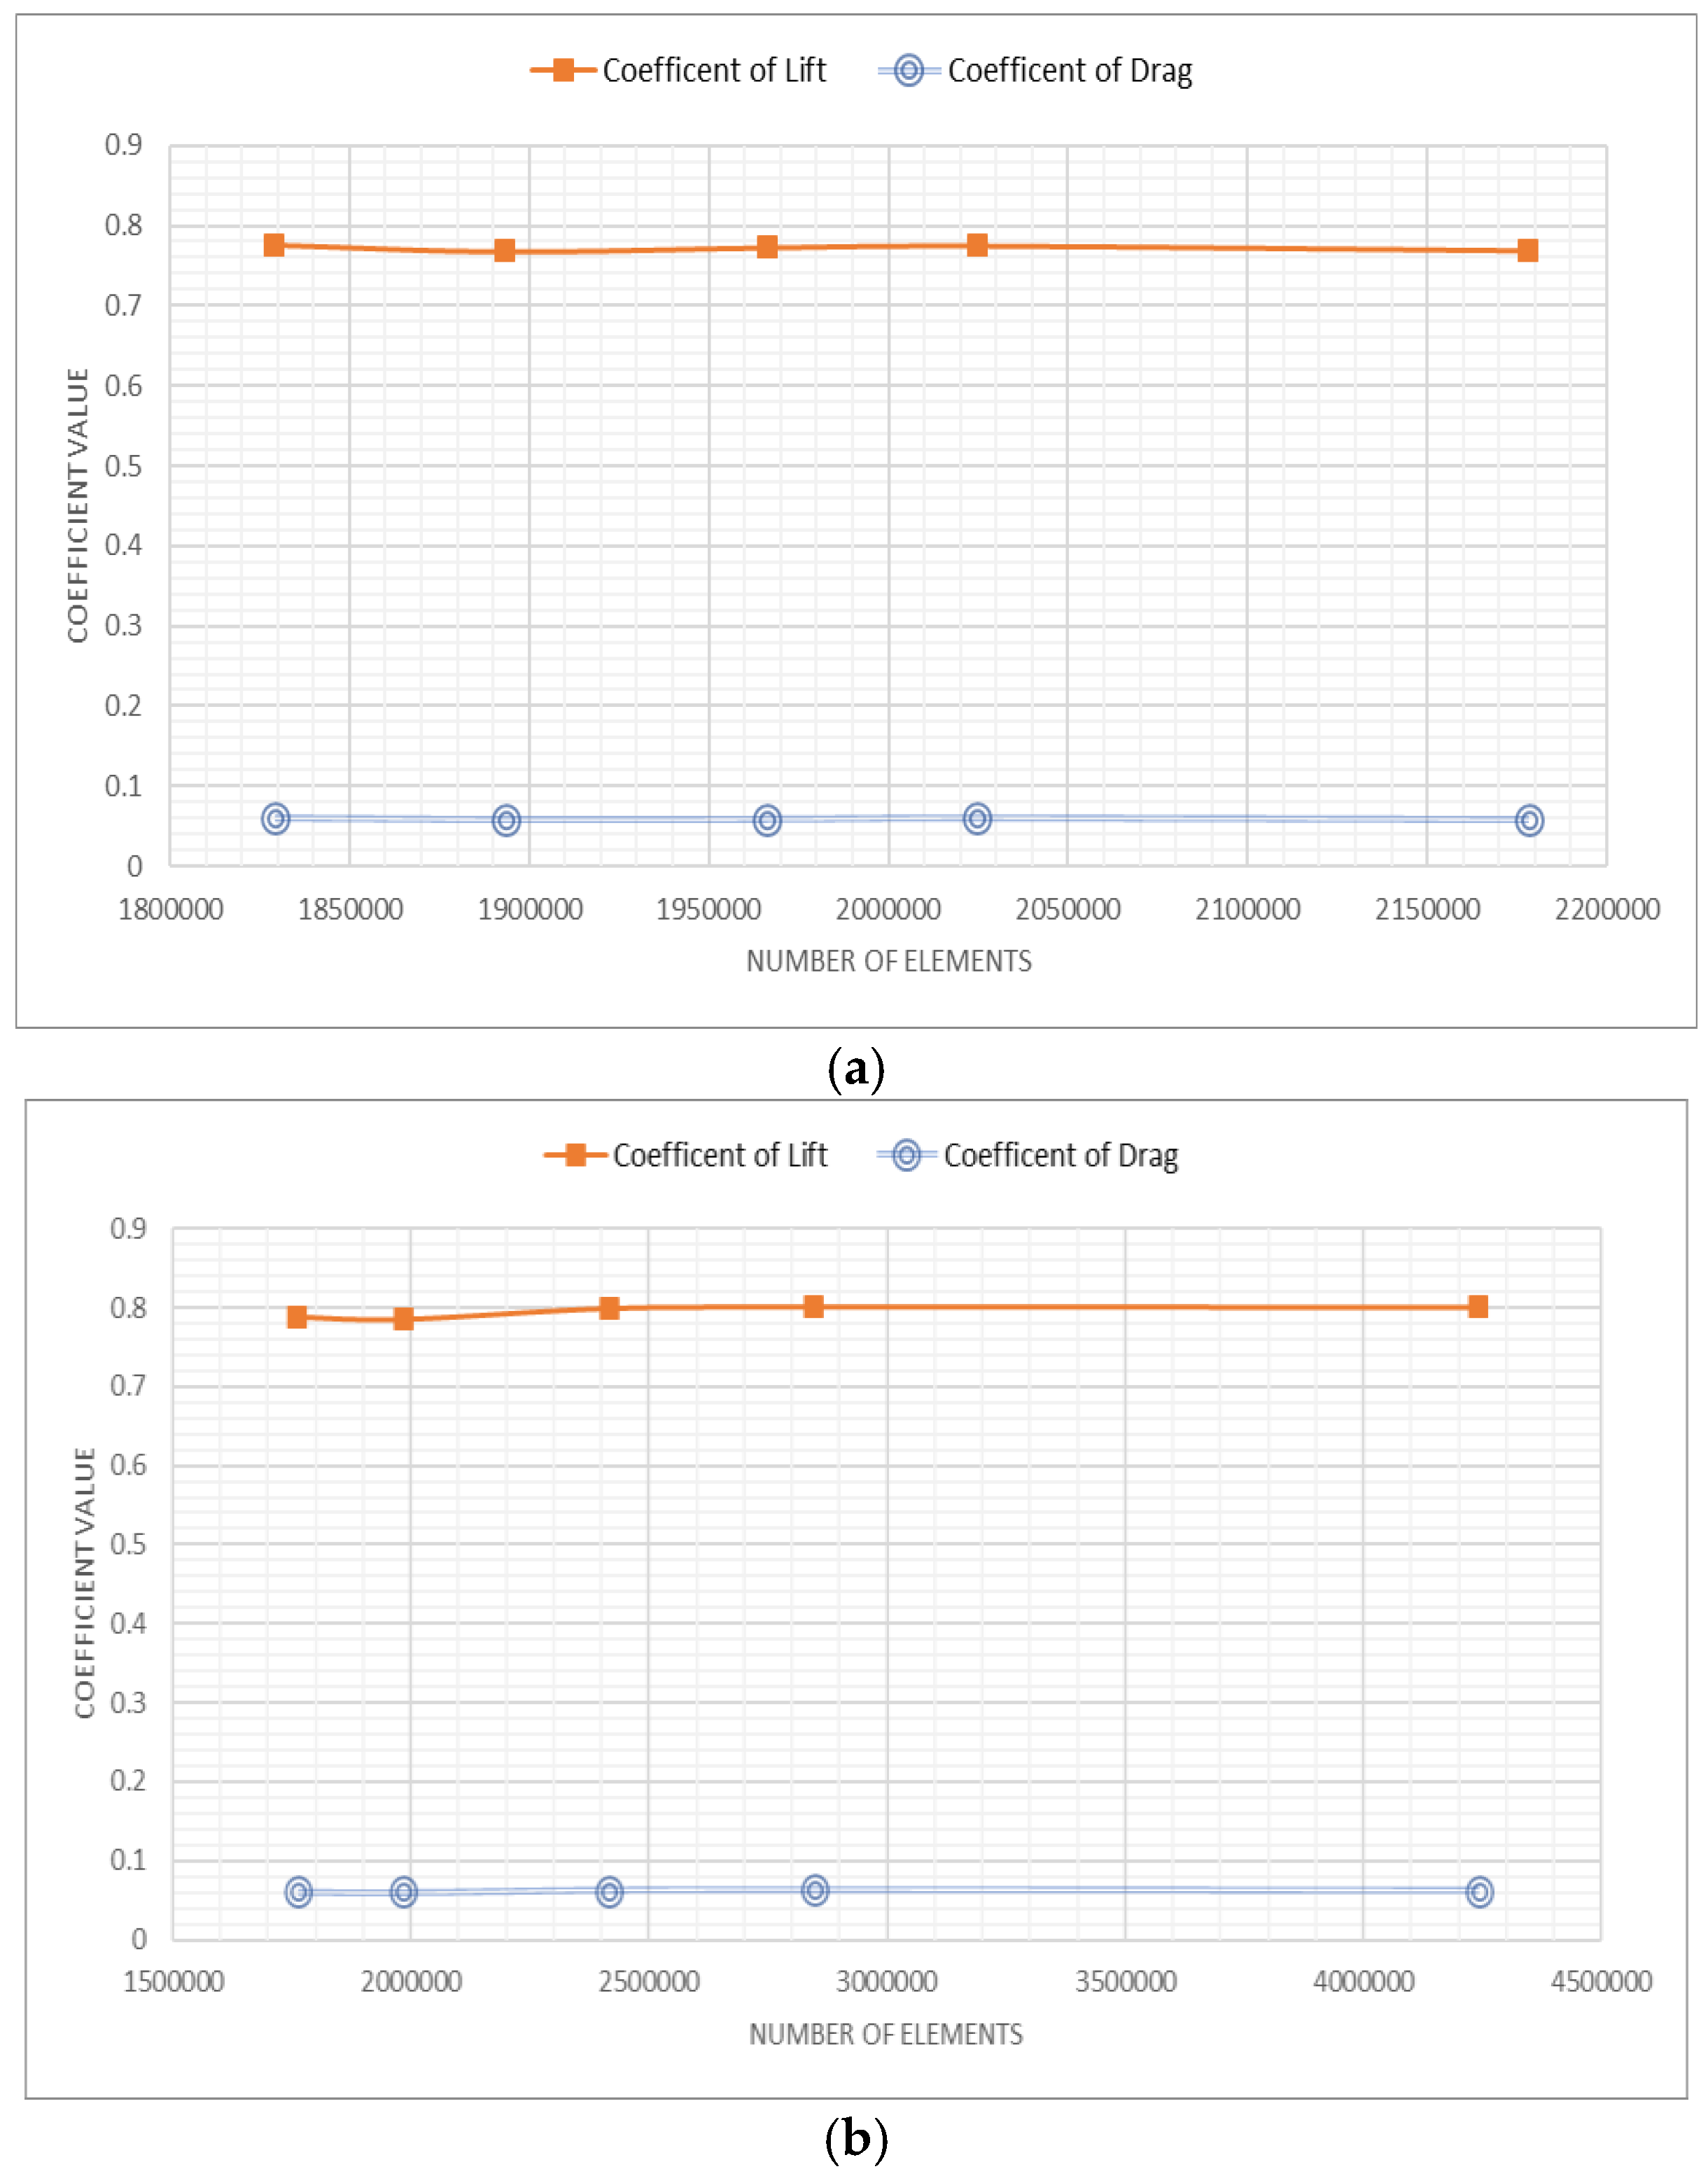
5.2. Mesh Validation

Performing a mesh convergence analysis, also known as a grid dependency study, is crucial for understanding the impact of cell size on the simulation error. As the cell size decreases, spatial discretisation errors also decrease [46]. Achieving mesh independence indicates that additional refinement in the mesh has minimal influence on the simulation outcomes. This process is vital to achieve stable and reliable simulation results. Two separate mesh convergence studies were conducted. Figure 15a shows the mesh-independent studies of the A380 wing with a wingtip fence that were conducted using five different meshes ranging from 1.8 to 2.2 million elements. All of these simulations were evaluated at a 3.06-degree angle of attack. Similarly, a mesh-independent study was conducted for the A380 wing with blended winglet configuration at a zero-degree cant angle using five different meshes ranging from 1.7 to 4 million elements. The results stabilised after 2.7 million elements and are depicted in Figure 15b.

6. Conclusions

The new blended winglet designs with different cant angles demonstrated that they could possibly replace the wingtip fence on the A380 wing after further experimental investigations. The blended winglets can increase the coefficient of lift by 3.886% at a zero-degree cant angle. When the cant angle increased, the size of the vortex was reduced. The 80-degree cant angle generated the smallest vortex in comparison to the original wingtip fence. The blended winglets have the potential to maintain the overall lift-to-drag ratio at the same level as that of the A380’s current wing. With the ability to modify the cant angle, the blended winglet model can optimise aerodynamic performance across different flight conditions, potentially reducing fuel consumption and increasing operational flexibility. The main aim of this research was to reduce the downstream wake turbulence that the A380 creates, particularly to prevent incidents like that which the Challenger encountered and to reduce fuel consumption. This was achieved at many cant angles, especially 80 degrees, which weakened the downstream wake and reduced drag. In future, a detailed analysis needs to be performed on these winglets under many conditions such as different angles of attack, speed, flight phase, and so on, for a clearer understanding of their benefits.

Author Contributions

Methodology, J.C.P. and S.M.; Software, J.C.P.; Validation, J.C.P.; Investigation, M.N.; Resources, R.M.; Data curation, P.R.; Writing—original draft, J.C.P.; Writing—review & editing, S.M., P.R., M.N. and R.M.; Supervision, S.M. All authors have read and agreed to the published version of the manuscript.

Funding

This research received no external funding.

Institutional Review Board Statement

Not applicable.

Informed Consent Statement

Not applicable.

Data Availability Statement

The original contributions presented in this study are included in the article. Further inquiries can be directed to the corresponding author.

Conflicts of Interest

The authors declare no conflict of interest.

References

  1. Department for Transport. Jet Zero Strategy, Jet Zero Strategy Delivering Net Zero Aviation by 2050. 2022. Available online: https://assets.publishing.service.gov.uk/media/62e931d48fa8f5033896888a/jet-zero-strategy.pdf (accessed on 23 August 2024).
  2. Kim, H.; Teter, J. International Energy Agency. Available online: https://www.iea.org/energy-system/transport/aviation (accessed on 26 March 2024).
  3. Price, D. The Impact of Winglets on Fuel Consumption and Aircraft Emissions, Cirium Aviation Analytics. 2022. Available online: https://www.cirium.com/thoughtcloud/impact-winglets-on-fuel-consumption-and-aircraft-emissions/ (accessed on 23 August 2024).
  4. Benson, T. What Is Lift? NASA: Washington, DC, USA, 2021. Available online: https://www.grc.nasa.gov/www/k-12/VirtualAero/BottleRocket/airplane/lift1.html (accessed on 23 August 2024).
  5. Anderson, J.D. Fundamentals of Aerodynamics, 6th ed.; McGraw-Hill Publishing Co.: New York, NY, USA, 2017. [Google Scholar]
  6. Houghton, E.L.; Carpenter, P.W.; Collicott, S.H.; Valentine, D.T. Aerodynamics for Engineering Students; Butterworth-Heinemann: Kidlington, UK, 2017. [Google Scholar]
  7. Narayan, G.; John, B. Effect of winglets induced tip vortex structure on the performance of subsonic wings. Aerosp. Sci. Technol. 2016, 58, 328–340. [Google Scholar] [CrossRef]
  8. Hrúz, M.; Pecho, P.; Bugaj, M.; Rostáš, J. Investigation of vortex structure behavior induced by different drag reduction devices in the near field. Transp. Res. Procedia 2022, 65, 318–328. [Google Scholar] [CrossRef]
  9. Pilot Institute, Induced Drag. 2023. Available online: https://pilotinstitute.com/induced-drag-explained/ (accessed on 23 August 2024).
  10. Maaz, A. The Dangers of Wake Turbulence and How It’s Managed by Pilots. 2022. Available online: https://simpleflying.com/the-dangers-of-wake-turbulence-and-how-its-managed-by-pilots/ (accessed on 23 August 2024).
  11. Kroo, I. Drag due to lift: Concepts for prediction and reduction. Annu. Rev. Fluid Mech. 2001, 33, 587–617. [Google Scholar]
  12. Abramowski, T. Numerical investigation of an airfoil in ground proximity. J. Theor. Appl. Mech. 2007, 45, 425–436. [Google Scholar]
  13. Breitsamter, C. Wake vortex characteristics of transport aircraft. Prog. Aerosp. Sci. 2011, 47, 89–134. [Google Scholar] [CrossRef]
  14. Regional Aviation Safety Group—Middle East, Wake Turbulence Separation in RVSM Airspace; International Civil Aviation Organization: Manama, Bahrain, 2017.
  15. Airbus, A380. Available online: https://www.airbus.com/en/products-services/commercial-aircraft/passenger-aircraft/a380 (accessed on 29 August 2024).
  16. SKYBRARY: ICAO, Wake Turbulence Category. Available online: https://skybrary.aero/articles/icao-wake-turbulence-category (accessed on 2 April 2024).
  17. Benson, T. L/D Ratio, NASA. Available online: https://www.grc.nasa.gov/www/k-12/VirtualAero/BottleRocket/airplane/ldrat.html#:~:text=Lift%20and%20drag%20are%20aerodynamic,aerodynamic%20efficiency%20of%20the%20airplane (accessed on 25 April 2024).
  18. Guzelbey, I.H.; Eraslan, Y.; Doğru, M.H. Effects of taper ratio on aircraft wing aerodynamic parameters: A comperative study. Eur. Mech. Sci. 2019, 3, 18–23. [Google Scholar] [CrossRef]
  19. Free Online Course Materials, Wing Taper Considerations, Massachusetts Institute of Technology. Available online: https://ocw.mit.edu/courses/16-01-unified-engineering-i-ii-iii-iv-fall-2005-spring-2006/67bd719047babb2159b4d6460250d66d_spl8a.pdf (accessed on 24 April 2024).
  20. Marimuthu, S.; Chinnathambi, D. Computational analysis of biomimetic butterfly valve. Bioinspired Biomim. Nanobiomater. 2020, 9, 223–232. [Google Scholar] [CrossRef]
  21. Marimuthu, S.; Chinnathambi, D. Computational analysis to enhance the compressible flow over an aerofoil surface. Aircr. Eng. Aerosp. Technol. 2021, 93, 925–934. [Google Scholar]
  22. Marimuthu, S.; Al-Rabeei, S.; Boha, H.A. Three-dimensional analysis of biomimetic aerofoil in transonic flow. Biomimetics 2022, 7, 20. [Google Scholar] [CrossRef] [PubMed]
  23. Marimuthu, S.; Natarajan, M.; Ramesh, R.; Murugesan, R. Hollow three-dimensional model for fuel reduction in aviation industry. Int. J. Interact. Des. Manuf. 2022. [Google Scholar] [CrossRef]
  24. Marimuthu, S.; Murugan, M.A.; Sivasathya, U.; Dharmalingham, S. Biomimetic in turbulence reduction-recent developments. J. Appl. Sci. Res. 2015, 11, 123–134. [Google Scholar]
  25. Selvanose, S.M.; Marimuthu, S.; Awan, A.W.; Daniel, K. NACA 2412 drag reduction using V-shaped riblets. Eng 2024, 5, 944–957. [Google Scholar] [CrossRef]
  26. Boldmethod, B. How Does Aspect Ratio Affect Your Wing? Online Flight Training Courses and CFI Tools 2022. Available online: https://www.boldmethod.com/learn-to-fly/aircraft-systems/how-does-aspect-ratio-affect-aircraft-wings/ (accessed on 23 August 2024).
  27. Leishman, J.G. Wing Shapes & Nomenclature, Introduction to Aerospace Flight Vehicles 2023. Available online: https://eaglepubs.erau.edu/introductiontoaerospaceflightvehicles/chapter/wing-shapes-and-nomenclature/ (accessed on 23 August 2024).
  28. Guerrero, J.; Sanguineti, M.; Wittkowski, K. CFD study of the impact of variable cant angle winglets on total drag reduction. Aerospace 2018, 5, 126. [Google Scholar] [CrossRef]
  29. Newman, D.M. Lift & Drag Effects of a Variable-Angle Winglet System. Bachelor’s Thesis, University of Vermont, Burlington, VT, USA, 2020. [Google Scholar]
  30. NASA. Winglets Save Billions of Dollars in Fuel Costs. Available online: https://spinoff.nasa.gov/Spinoff2010/t_5.html (accessed on 23 August 2024).
  31. Ghaith, F.A.; Haque, M.F. Elastodynamic Modeling and Simulation of the Airbus A380 Wing. In Proceedings of the 26th Conference on Mechanical Vibration and Noise, Buffalo, NY, USA, 17–20 August 2014; Volume 8. [Google Scholar]
  32. NASA, Supercritical Airfoils, A Matrix of Family-Related Airfoils. Available online: https://ntrs.nasa.gov/api/citations/19900007394/downloads/19900007394.pdf (accessed on 28 April 2024).
  33. Airbus Aircraft, Autocad 3-View Aircraft Drawings. Available online: https://aircraft.airbus.com/en/customer-care/fleet-wide-care/airport-operations-and-aircraft-characteristics/autocad-3-view-aircraft-drawings (accessed on 23 April 2024).
  34. Lutton, M.J. Comparison of C- and O-Grid Generation Methods Using a NACA 0012 Airfoil, Defense Technical Information Center. 1989. Available online: https://apps.dtic.mil/sti/citations/ADA216375 (accessed on 11 April 2024).
  35. Sijal, A. Understanding Y+ for CFD Simulations. 2019. Available online: https://www.linkedin.com/pulse/understanding-y-cfd-simulation-sijal-ahmed (accessed on 23 August 2024).
  36. Cadence, Hexahedral Mesh vs. Tetrahedral: Comparing high-Quality Meshing, 2022. Available online: https://resources.system-analysis.cadence.com/blog/msa2022-hexahedral-mesh-vs-tetrahedral-comparing-high-quality-meshing (accessed on 23 August 2024).
  37. Fatchurrohman, N.; Chia, S.T. Performance of hybrid nano-micro reinforced MG metal matrix composites brake calliper: Simulation approach. IOP Conf. Ser. Mater. Sci. Eng. 2017, 257, 012060. [Google Scholar] [CrossRef]
  38. Hall, N. Navier-Stokes Equations; NASA: Washington, DC, USA, 2021. Available online: https://www.grc.nasa.gov/www/k-12/airplane/nseqs.html (accessed on 9 April 2024).
  39. Andersson, B.; Andersson, R.; Hakansson, L. Computational Fluid Dynamics for Engineers; Cambridge University Press: Cambridge, UK, 2012. [Google Scholar]
  40. Wilcox, D.C. Turbulence Modelling for CFD; DCW Industries: La Canada, CA, USA, 2006. [Google Scholar]
  41. Goyal, S.G. Selection of Turbulence Model for Analysis of Airfoil Wing using CFD. Int. Res. J. Eng. Technol. 2021, 8, 2608. [Google Scholar]
  42. Kamaraj, A. Pressure Based vs. Density Based Solver. 2018. Available online: https://www.linkedin.com/pulse/pressure-based-vs-density-solver-aravinth-kamaraj/ (accessed on 6 April 2024).
  43. The Emirates A380 Fleet, Our Fleet: The Emirates Experience, Emirates United Kingdom, The Emirates A380. Available online: https://www.emirates.com/uk/english/experience/our-fleet/a380/ (accessed on 6 April 2024).
  44. Reynolds Number; NASA: Washington, DC, USA. Available online: https://www.grc.nasa.gov/www/k-12/airplane/reynolds.html (accessed on 7 January 2024).
  45. Guerrero, J.E.; Sanguineti, M.; Wittkowski, K. Variable cant angle winglets for improvement of aircraft flight performance. Meccanica 2020, 55, 1917–1947. [Google Scholar] [CrossRef]
  46. Gasparini, R. Mesh Sensitivity Study for CFD Projects: Knowledge Base, SimScale. 2022. Available online: https://www.simscale.com/knowledge-base/mesh-sensitivity-cfd/#:~:text=A%20mesh%20sensitivity%20study%20(also,solution%20changes%20with%20each%20mesh (accessed on 22 April 2024).
Figure 1. (a) Induced drag [9] and (b) wingtip vortex [10].
Eng 06 00068 g001aEng 06 00068 g001b
Figure 2. The Airbus A380 [15].
Eng 06 00068 g002
Figure 3. Hazards of wake turbulence including upwash and downwash [13].
Eng 06 00068 g003
Figure 4. (a) Wingtip vortices at different aspect ratios of wing [26] and (b) wing taper [27].
Eng 06 00068 g004
Figure 5. Lift and drag coefficients of wings with and without winglets [28].
Eng 06 00068 g005
Figure 6. A380 wing (a) aerofoils and (b) dimensions.
Eng 06 00068 g006
Figure 7. A380 wing model with wingtip fence.
Eng 06 00068 g007
Figure 8. The A380 wing models with blended winglets at different cant angles: (a) 0 degrees, (b) 15 degrees, (c) 45 degrees and (d) 80 degrees.
Eng 06 00068 g008
Figure 9. Computational domain.
Eng 06 00068 g009
Figure 10. (a) Full design mesh and (b) boundary layer mesh.
Eng 06 00068 g010
Figure 11. Lift-to-drag ratio vs. cant angle.
Eng 06 00068 g011
Figure 12. Plot showing coefficient of lift and drag vs. cant angle.
Eng 06 00068 g012
Figure 13. Wingtip vortex observations: (a) wingtip fence, (b) 0 degrees, (c) 15 degrees, (d) 45 degrees and (e) 80 degrees.
Eng 06 00068 g013
Figure 14. Downstream wake: (a) wingtip fence, (b) 0 degrees, (c) 15 degrees, (d) 45 degrees and (e) 80 degrees.
Eng 06 00068 g014
Figure 15. Mesh-independent studies of A380: (a) wingtip fence and (b) blended winglet at zero-degree cant angle.
Eng 06 00068 g015
Table 1. ICAO wake turbulence classification [16].
ClassMaximum Take-Off Weight (Kilograms)Name of the Aircraft
J (Super)560,000Airbus A380
H (Heavy)≥136,000Boeing 747-8
M (Medium)<136,000
>7000
Airbus A320
L (Light)≤7000Embraer Phenom 100
Table 2. Dimensions of wing and winglets.
Wing/WingletCant Angle (Degree)Length (m)
Wing (1:10 ratio) N/A3.637
Winglet 100.5455
Winglet 2150.4561
Winglet 3450.3954
Winglet 4800.2013
Table 3. Lift coefficient results.
Cant AngleLift CoefficientChange in Lift (%)
00.8023.886
150.761−1.425
450.745−3.497
800.737−4.533
Wingtip Fence (A380 Wing)0.772-
Table 4. Drag coefficient results.
Cant AngleDrag CoefficientChange in Drag (%)
00.0638.621
150.0615.172
450.0580.000
800.057−1.724
Wingtip Fence (A380 Wing)0.058-
Table 5. Method validation.
Model Lift CoefficientDrag Coefficient
Guerrero’s ONERA wing0.26080.01863
Redesigned ONERA wing0.26470.01805
Disclaimer/Publisher’s Note: The statements, opinions and data contained in all publications are solely those of the individual author(s) and contributor(s) and not of MDPI and/or the editor(s). MDPI and/or the editor(s) disclaim responsibility for any injury to people or property resulting from any ideas, methods, instructions or products referred to in the content.

