Article

SCC Susceptibility of Polystyrene/TiO2 Nanocomposite-Coated Thin-Sheet Aluminum Alloy 2024—T3 in 3.5% NaCl

Department of Mechanical Engineering, University of Alaska Fairbanks, Fairbanks, AK 99775, USA
*
Author to whom correspondence should be addressed.
Submission received: 17 March 2025 / Revised: 10 April 2025 / Accepted: 17 April 2025 / Published: 21 April 2025
(This article belongs to the Section Materials Engineering)

Abstract

:
The effectiveness of polystyrene (PS)/TiO2 nanocomposite coatings in reducing stress–corrosion cracking (SCC) susceptibility of aluminum alloy 2024-T3 (AA2024-T3) was evaluated using an accelerated stress–corrosion test. Polystyrene (PS)-based coatings incorporating TiO2 nanoparticles with three different aspect ratios (ARs) were compared to a bare polystyrene coating. A compact tension (CT) specimen (5 mm thick) was coated for testing in a synergistic stress–corrosion environment. A slow constant displacement rate of 1.25 nm/s was applied in the load-line direction of the specimen to gradually open the crack mouth, while the crack tip was periodically dosed with a 3.5 wt.% NaCl solution. Load-displacement data were recorded and analyzed to calculate the J-integral, according to Standard ASTM E1820, for each coated specimen tested under laboratory-controlled SCC conditions. The fracture toughness, stress intensity, and six other SCC susceptibility indices were further developed to compare the performance of each coating in enhancing SCC resistance. The results revealed a strong dependence of SCC resistance on the nanoparticle aspect ratio, with the nanocomposite coating featuring an AR of 1 performing the best. The SCC behavior was reflected in the fractography of the fractured halves of a specimen, where cleavage was observed during the very slow, stable cracking stage, and dimples formed as a result of fast, unstable cracking toward the end of testing. These findings highlight the potential of tailored nanocomposite coatings to enhance the durability of aerospace-grade aluminum alloys.

1. Introduction

The 2xxx series aluminum alloys have a high strength-to-weight ratio, making them ideal structural materials for the aerospace industry. Their satisfactory strength is attributed to precipitation hardening [1], a process in which copper-rich intermetallic particles, such as the θ-phase (Al2Cu) and S-phase (Al2CuMg), form within the aluminum matrix, thereby straining the heterogeneous microstructure. These secondary phases strengthen the alloy by impeding dislocation movement, thus increasing resistance to deformation.
However, these intermetallic particles are electrochemically reactive in chloride environments, leading to localized pitting [2] and intergranular corrosion [3,4]. The severity of corrosion is exacerbated when the material is simultaneously subjected to mechanical stress. Under mechanical stress in an aggressive chloride medium, the high-strength aluminum alloy 2024 (AA2024) becomes susceptible to stress–corrosion cracking (SCC) [5]. The SCC mechanisms in AA2024 involve the dissolution and dealloying of the S-phase (Al2CuMg) [6,7], followed by granular attack on the copper-depleted matrix [3] due to galvanic coupling [8].
Corrosion, an electrochemical process, requires a conductive path—typically provided by an electrolyte—to facilitate the movement of electrons and ions between the anode and cathode. Coatings are the most common and cost-effective corrosion inhibitors, as they restrict the transport of ions and electrons. In aluminum alloys, although a naturally passivated oxide layer provides some protection, it remains thin, brittle, and porous [9]. To enhance corrosion resistance, this oxide layer can be chemically converted into more stable compounds using inorganic metallic materials, such as hexavalent chromium (Cr(VI)), a widely used treatment [10]. However, due to environmental and health concerns, the use of Cr(VI)-based anodization has been increasingly restricted and banned in certain jurisdictions [11].
The search for cost-effective Cr(VI)-free coatings has led to various alternative coating techniques. Polymer-based coatings have emerged as an environmentally friendly solution. Compared to chemical conversion processes, organic coatings offer a relatively simple and economical option, primarily involving the application of polymers, epoxy, or resins onto the metal surface. Although electrochemically inert, organic coatings tend to become brittle and porous after curing. The presence of cracks and pores adversely promotes the diffusion of electrolytes to the substrate metal and creates a medium for electrochemical reactions [12]. The issue of porosity can be mitigated by incorporating nanoparticle fillers to create a composite organic coating.
Research into organic nanocomposite coatings has opened a new avenue for corrosion mitigation. Various nanoparticles, including SiO2, Al2O3, Cr2O3, Fe2O3, ZnO, TiO2, and clay, have been investigated in conjunction with different polymers [13]. Among these, Titania (TiO2) nanoparticles are the most extensively studied as filler materials for composite coatings. The base matrices explored with TiO2 include polyaniline (PANI)-TiO2 in H2PO4 baths [14], polydimethylsiloxane (PDMS)-TiO2 via sol-gel processes [15] or through curing agent mixing [16], polypyrrole (PPy)-TiO2 [17], and highly loaded TiO2 in polystyrene achieved through capillary infiltration [18].
One of the most significant areas of research in coated alloys is the anti-corrosion performance of coatings. The corrosion properties of various coatings have been exclusively characterized, including organic nanocomposite coatings [19,20,21], conducting polymers [21], and rare-earth-based coatings [22]. Research has shown that the corrosion rate correlates linearly with the reduction in peel strength at the adhesion interface where a resin bonds to acid-treated aluminum [23]. This finding suggests that improved corrosion resistance is contingent upon strong adhesion between the coating and the alloy substrate. It is postulated that coatings with covalent or ionic bonds outperform those relying on hydrogen bonds or Van der Waals forces in resisting corrosion; however, the bonding mechanisms can be complex and vary from one coating/substrate system to another [24]. Generally, surface modification techniques, such as anodization [25] or plasma treatment [26,27], can enhance adhesion by introducing hydroxyl groups on the aluminum surface, thereby facilitating covalent bonding with polymer functional groups [26,27]. Adhesion can also be improved by promoting mechanical interlocking at the adhering interface. For instance, surface treatment through acid anodization creates a surface rich in microfibrous structures that enhance mechanical interlocking with the coating material [28]. Recently, PS/TiO2 nanocomposite coating with ultra-high TiO2 loading (42% vol) has demonstrated promising corrosion resistance for AA2024-T3 in chloride environments [18].
While most research on composite coatings emphasizes synthesis and anti-corrosion properties, their performance under simultaneous corrosion and mechanical stress is critical yet barely addressed. In many applications, the coated alloys are exposed to both aggressive environments and mechanical loading, raising concerns about the susceptibility to SCC, where localized dissolution accelerates material failure under loading. There is significantly less discussion regarding the interaction between corrosion and mechanical stress, which can lead to accelerated damage from localized dissolution within the material until failure occurs. This study evaluated the PS/TiO2 composite coating’s effectiveness in mitigating SCC susceptibility in AA2024-T3. The evaluation employed the slow strain-rate test (SSRT) method to assess coated specimens in a saline environment while subjected to controlled loading at a constant strain rate. This standard laboratory-based accelerated testing mimics the combined environmental and loading conditions encountered in practice. Results were analyzed using the J-integral fracture mechanics approach outlined in ASTM E1820 [29], ensuring a quantitative assessment and consistent comparison of coating performance.

2. Materials and Methods

2.1. Specimen

The specimens were fabricated from wrought AA2024-T3 cold-rolled aluminum sheets, each 5 mm thick, bought from Kaiser Aluminum (Franklin, TN, USA). The chemical composition is detailed in Table 1. The aluminum sheets were machined into Chevron notch CT specimens, adhering to the required machining tolerances specified by the ASTM E1820 Standard [29]. Figure 1 illustrates the machining dimensions, where W is the ligament size, set to 10 mm for this study. The dimension of 5 mm is referred to as the specimen’s ungrooved thickness (B) for calculating fracture toughness (see Appendix). The machined crack mouth opening measures 1.60 mm, while the initial crack length a 0 is 4.50 mm (as-machined). The red arrows indicate the load-line axis. To facilitate the mounting of a custom-made clip gauge (see Section 2.3), the specimen features an extended front-face dimension of 0.465 W, measured from the load line, as shown in Figure 1. The Chevron notch was cut using a specially ground 90° slitting saw. Specimens were extracted in the transverse–longitudinal (T-L) orientation, meaning the fracture plane aligns with the maximum grain flow direction of the forged alloy. No side grooving was made, as depicted in Figure 1.

2.2. Coating

The PS/TiO2 nanocomposites solution was prepared by dispersing TiO2 nanoparticles in a polystyrene solution dissolved in acetone. The TiO2 nanoparticles were synthesized using the sol-gel method [30]. Three different aspect ratios of TiO2 nanoparticle—AR = 1, AR = 2, and AR = 4—along with an unloaded polystyrene solution were evaluated for their resistance to SCC. The bare PS coating served as a baseline to quantify the influence of the TiO2 nanoparticles. Table 2 lists the composition of each coating mixture and the corresponding nanoparticle size distribution. Additional baseline tests were conducted on uncoated specimens in an “in-air” condition without the application of a corrosion solution. For clarity, the designations “AR = 1”, “AR = 2”, and “AR = 4” will henceforth be simplified to “AR1”, “AR2”, and “AR4”, respectively.

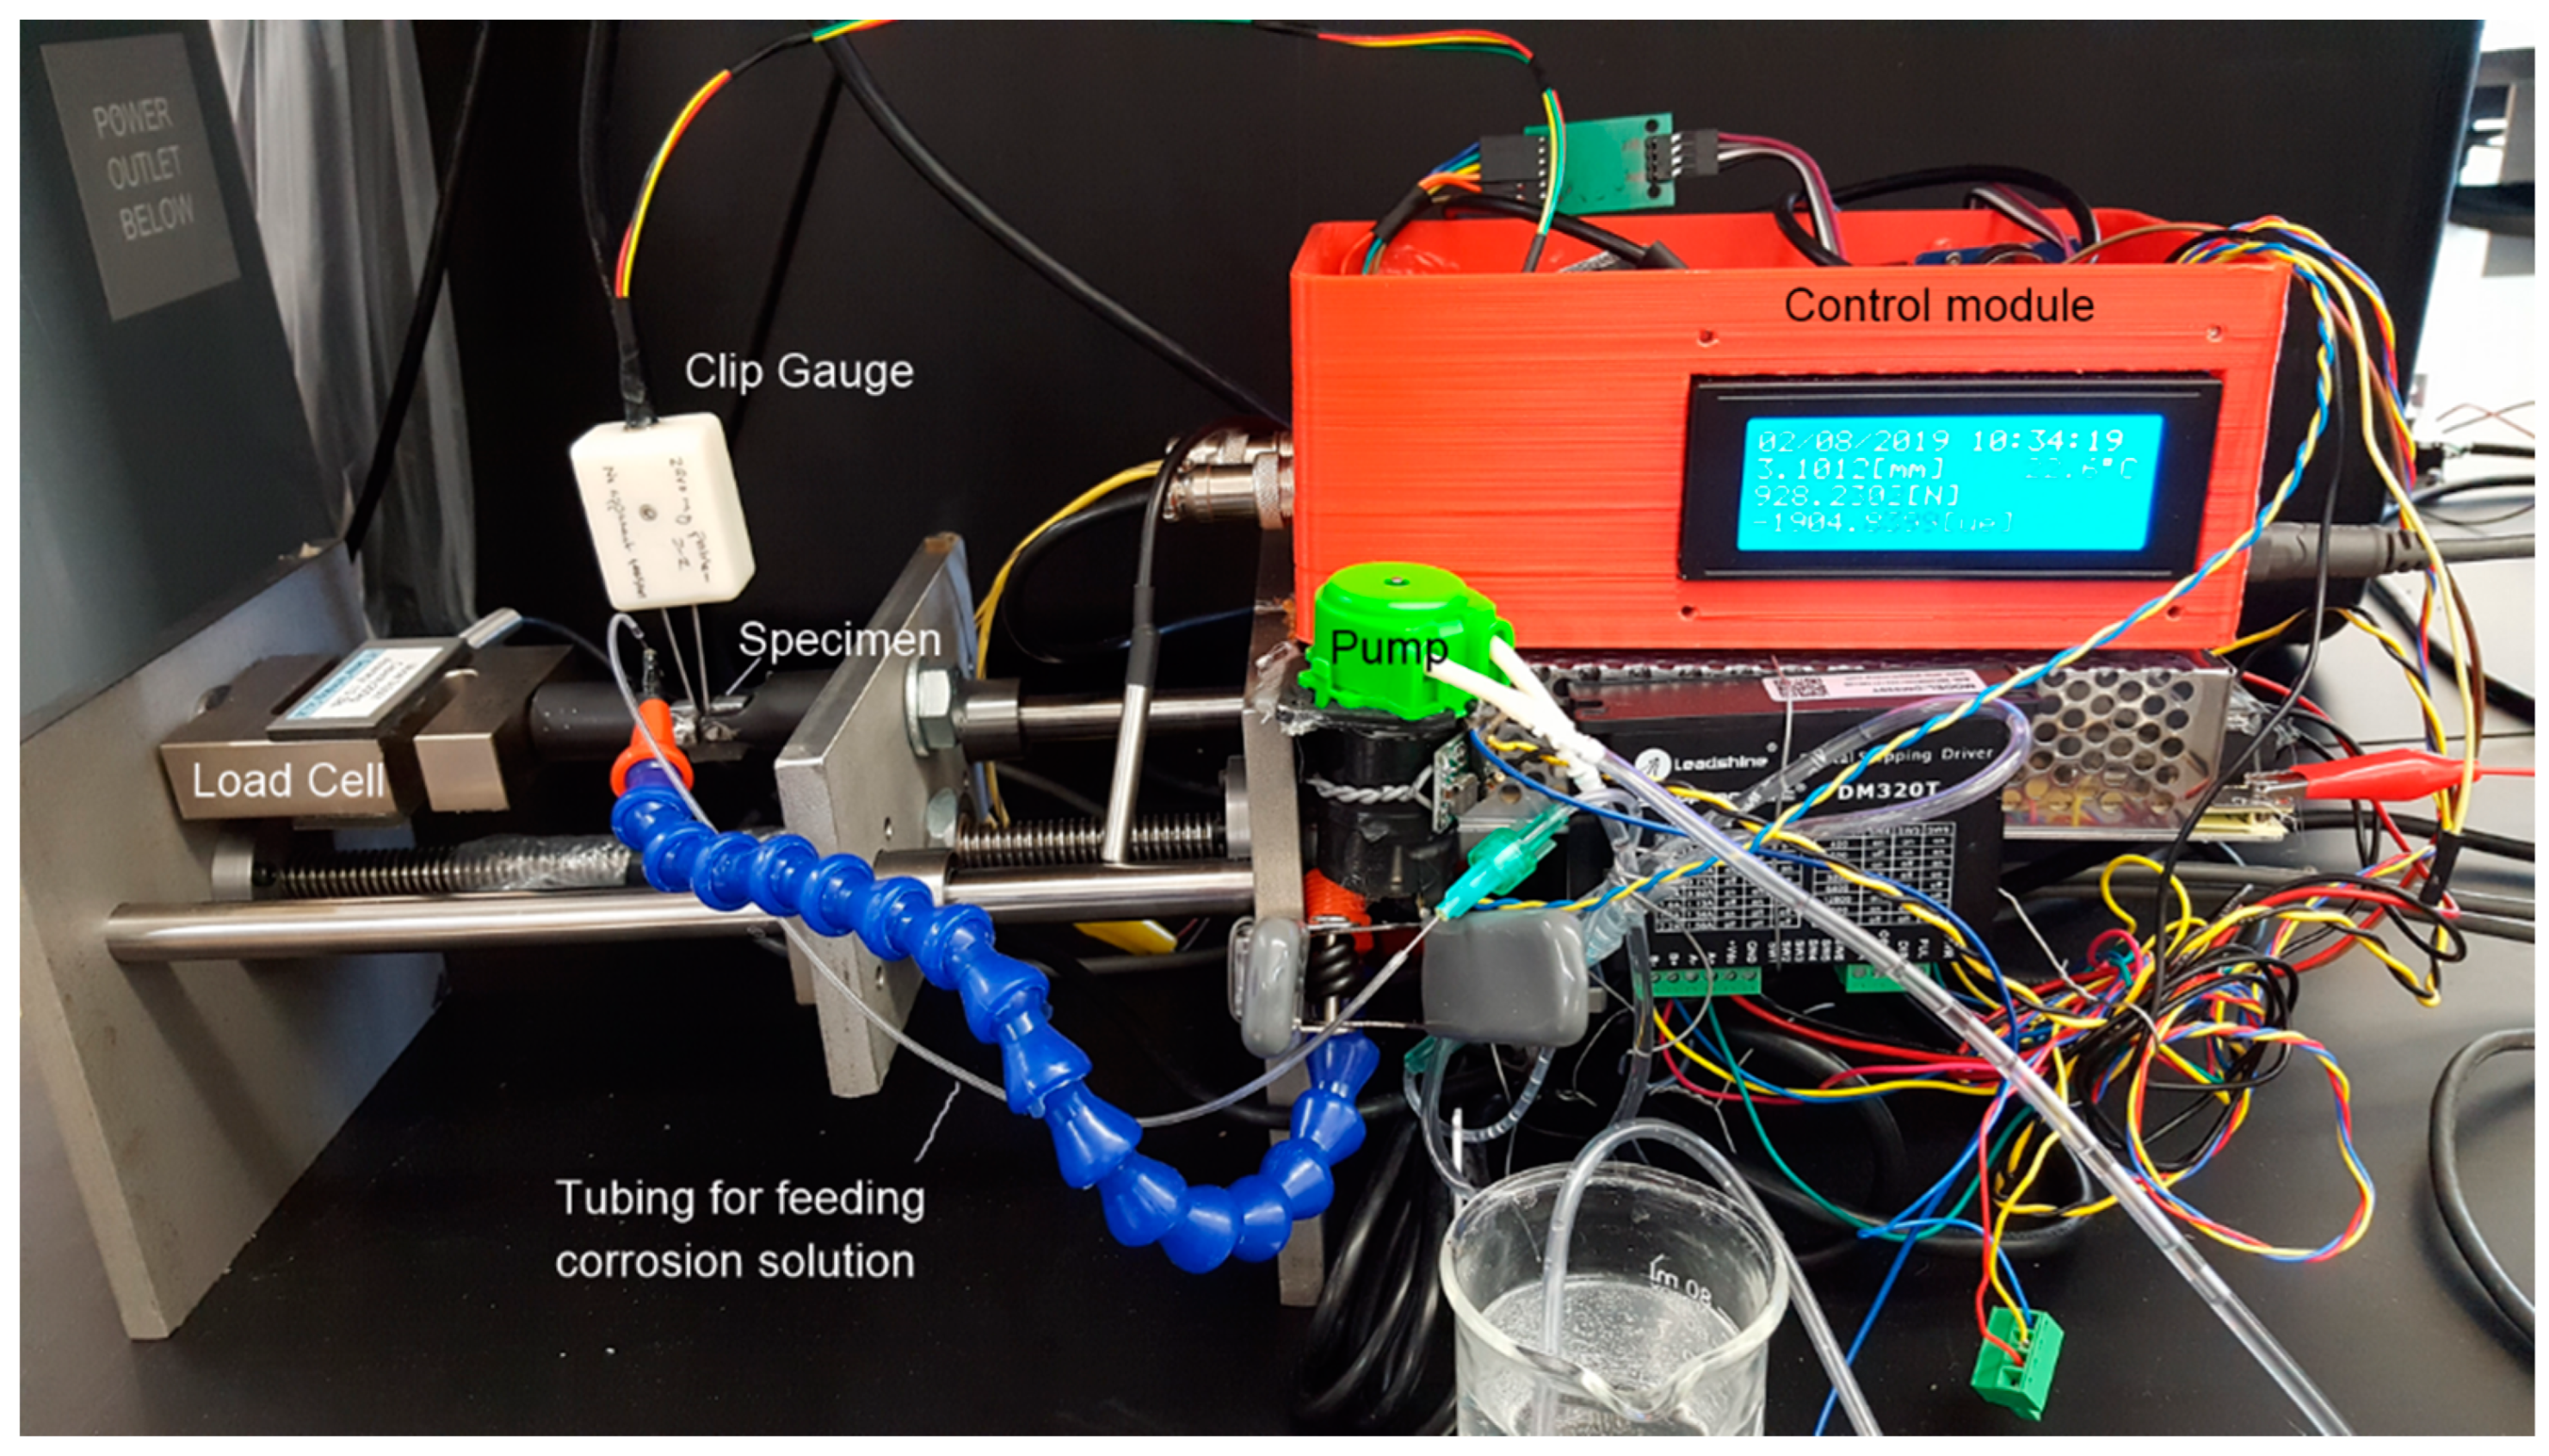
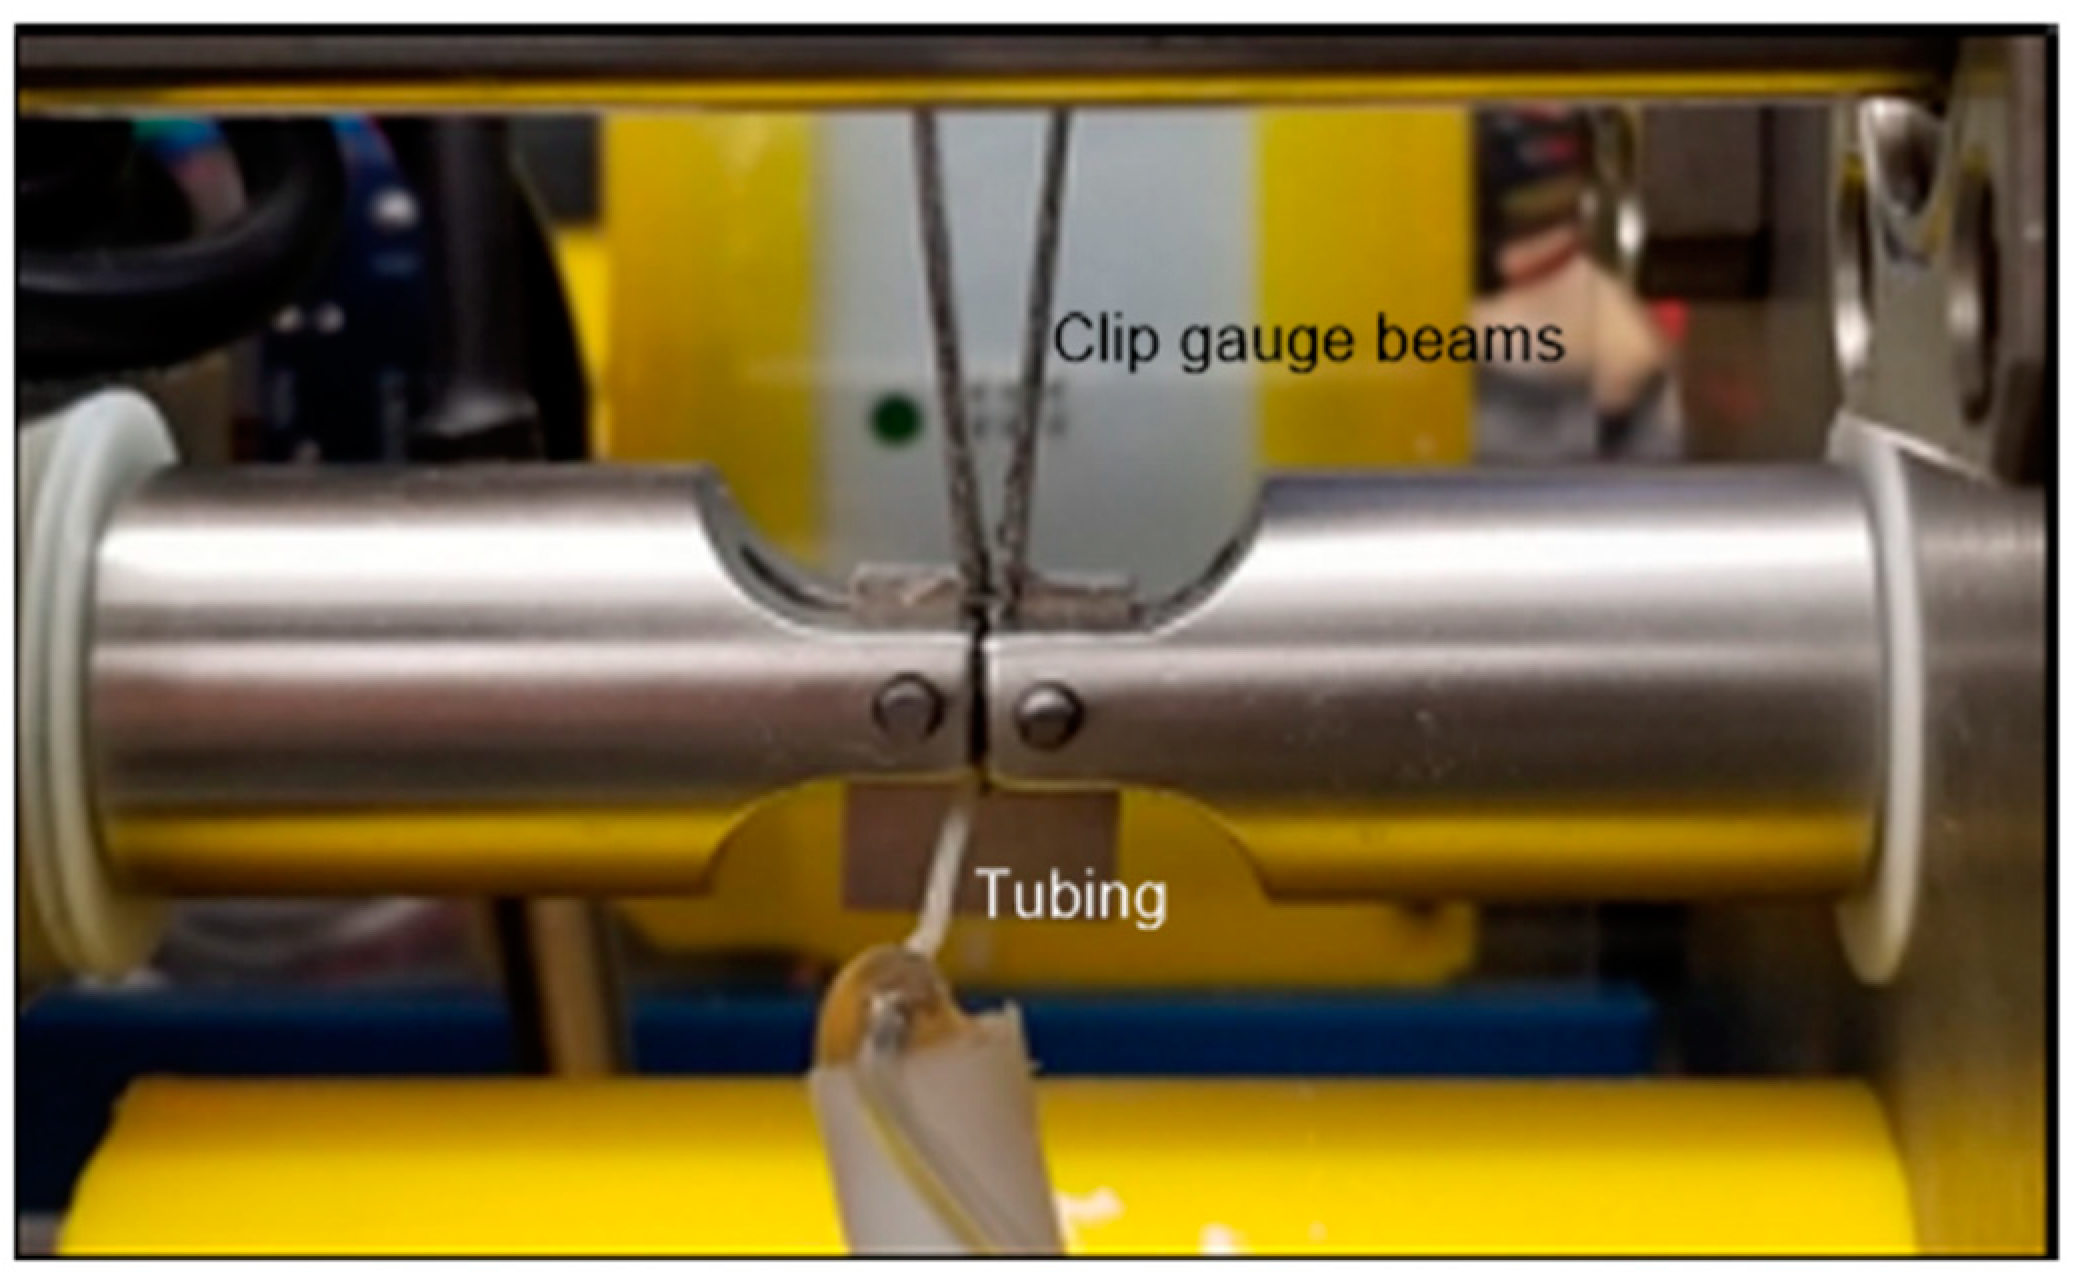
2.3. Instrument for SCC Testing

The specimens were tested using a custom-instrumented, in-house tensile test rig equipped with motor displacement control, as shown in Figure 2. Displacement control was achieved with an Arduino Mega 2560, which pulsed a NEMA-17 stepper motor (Stepperonline, New York, NY, USA) connected to a 100:1 gear reduction gearbox. The step size capability of the stepper motor was further refined using a Leadshine DM320T digital stepping driver (McMaster-Carr, Los Angeles, CA, USA), which reduced one complete revolution of the input motor shaft from 200 discrete steps by a factor of 64, rendering 12,800 microsteps per revolution of the input shaft to the gearbox. The output shaft of the gearbox was coupled to a ½-10 ACME thread lead screw, leading to an added reduction in linear displacement per motor step. Overall, these serially connected mechanical parts render a theoretical linear displacement of 2 nm per step of the motor at the traveling nut on the lead screw connected to the moving crosshead. This parameter characterizes the resolution of the physical displacement for the crosshead, to which a mounting clevis for pulling the CT specimen is attached. Such a resolution facilitates slow displacement rates for SCC testing. Throughout this study, the displacement rate employed was 1.25 × 10⁻⁹ m/s.
Custom-made clip gauges were used to measure changes in the crack mouth opening displacement (CMOD). Each clip gauge consists of two steel beams clamped at one end. The two beams are separated by 8 mm at their free end, referred to as the travel length. A 350-ohm foil strain gauge (Omega Engineering, Michigan City, IN, USA) was attached near the clamped root on each side of each beam. A total of four strain gauges were used, connected in a full-bridge configuration, to measure the displacement at the clip end. All clip gauges were calibrated prior to use. The crack mouth opening will increase from its initial value of 1.6 mm (as machined) once cracking of the specimen begins at the sharp edge formed behind the Chevron notch tip.
Instead of using a corrosion chamber for SCC testing, the corrosion solution was delivered directly to the machined notch tip of the specimen via controlled-rate dosing. A 24 V DC peristaltic pump, positioned near the stepper motor (see Figure 2), delivered the solution from a reservoir. The solution was pumped at a constant rate through Tygon tubing to wet the notch tip, with the flow rate meticulously adjusted to ensure adequate wetting while allowing sufficient time for evaporation.
The applied force was measured using a 3.5 kN S-type load cell (refer to Figure 2).
An Arduino Mega 2560 microcontroller (Sparkfun Electronics, Niwot, CO, USA) managed both the stepper motor and the feeding rate of the corrosion solution. A 32 GB micro SD memory card was used to record data collected from the load cell, clip gauge, and temperature sensor during the test. Upon the completion of each test, the data from the micro SD memory card was transferred to a computer for further analysis.
Figure 3 shows a close-up view of the CT specimen secured by 316-stainless-steel clevises and tungsten carbide pins. The mounted specimen was then engaged with corrosion solution tubing and a clip gauge.

2.4. Testing Procedure

The specimens were tested in their as-machined condition without taking the fatigue pre-cracking step recommended in ASTM E1820. The implications of this deviation are discussed in the Section 4.
The testing process started with the application of a coating to the specimens. The coating solution was sonicated for a minimum of 10 min prior to use. A total of two doses, each consisting of 5 µL of the coating solution, were applied to the Chevron notch tip using a pipette, but at different stages. The first dose was applied before mounting the specimen in the test rig while in an unstressed state. The coating was allowed to be set under ambient conditions for 15 min, facilitating the evaporation of acetone and leaving only the PS/TiO2 nanocomposite on the coated surface. The coating typically dried within a few minutes; however, the added time ensured complete evaporation of the acetone.
Next, the clip gauge was positioned at the crack mouth of the coated specimen. Since the SCC characterization was limited to a specific area around the Chevron notch tip, a thin layer of petroleum jelly was applied to the non-specific region, which includes the contact area between the clip gauge, the CT specimen arms, loading pins, and clevises, to prevent the saline solution from wicking into the non-specific region. This will reduce any galvanic effects that could occur undesirably in this region.
The specimen was then mounted in the test rig clevises using loading pins. To prevent any unintentional preloading, the assembly was gently wiggled before calibrating the load cell and clip gauge to zero. The specimen was then pre-loaded to a measured force of 1800 N, at which the stiffness of the specimen is within the upper limit of linear elasticity. At this stage, a second 5 µL dose of the coating solution was applied to the Chevron notch tip to fill any potential cracks in the initial coating caused by the 1800 N preloading. The coating was allowed to be set for 15 min. The Tygon tubing was then positioned onto the Chevron notch tip, as shown in Figure 3.
Testing was conducted in an open-air environment, with small doses of a 3.5 wt.% NaCl solution applied at the 30 min intervals. At this stage, the specimen was subjected to loading and corrosion exposure, rendering a laboratory-controlled SCC condition. At the constant displacement rate of 1.25 × 10⁹ m/s, the tests typically lasted several days before achieving the anticipated result of rapid, unstable crack propagation at the crack mouth opening. Once this stage was achieved, the specimen was either loosely pinned to the clevis or fractured into halves at the Chevron notch tip. The conclusion of a test was marked by dismounting the specimen and manually tearing it into two halves (if it had not already fractured) to expose the fracture surface. The specimen halves were then removed from the test rig and sonicated in deionized (DI) water for 20 min to remove salt crystal buildup, then air-dried before being cleaned in a nitric acid solution for 10 min. The cleaned specimens were stored for later fractographic analysis.
Testing was performed repeatedly over 6 specimens for each type of coating. The number of successful repetitions is 3–5, depending on the lifetime of the tungsten carbide pins, which were occasionally broken or yielded unexpectedly during a test; thus, those tests were not counted. Upon completion of a test, the historical data of the load-line load ( P ) and CMOD ( V ) had been recorded for further analysis.

3. Results

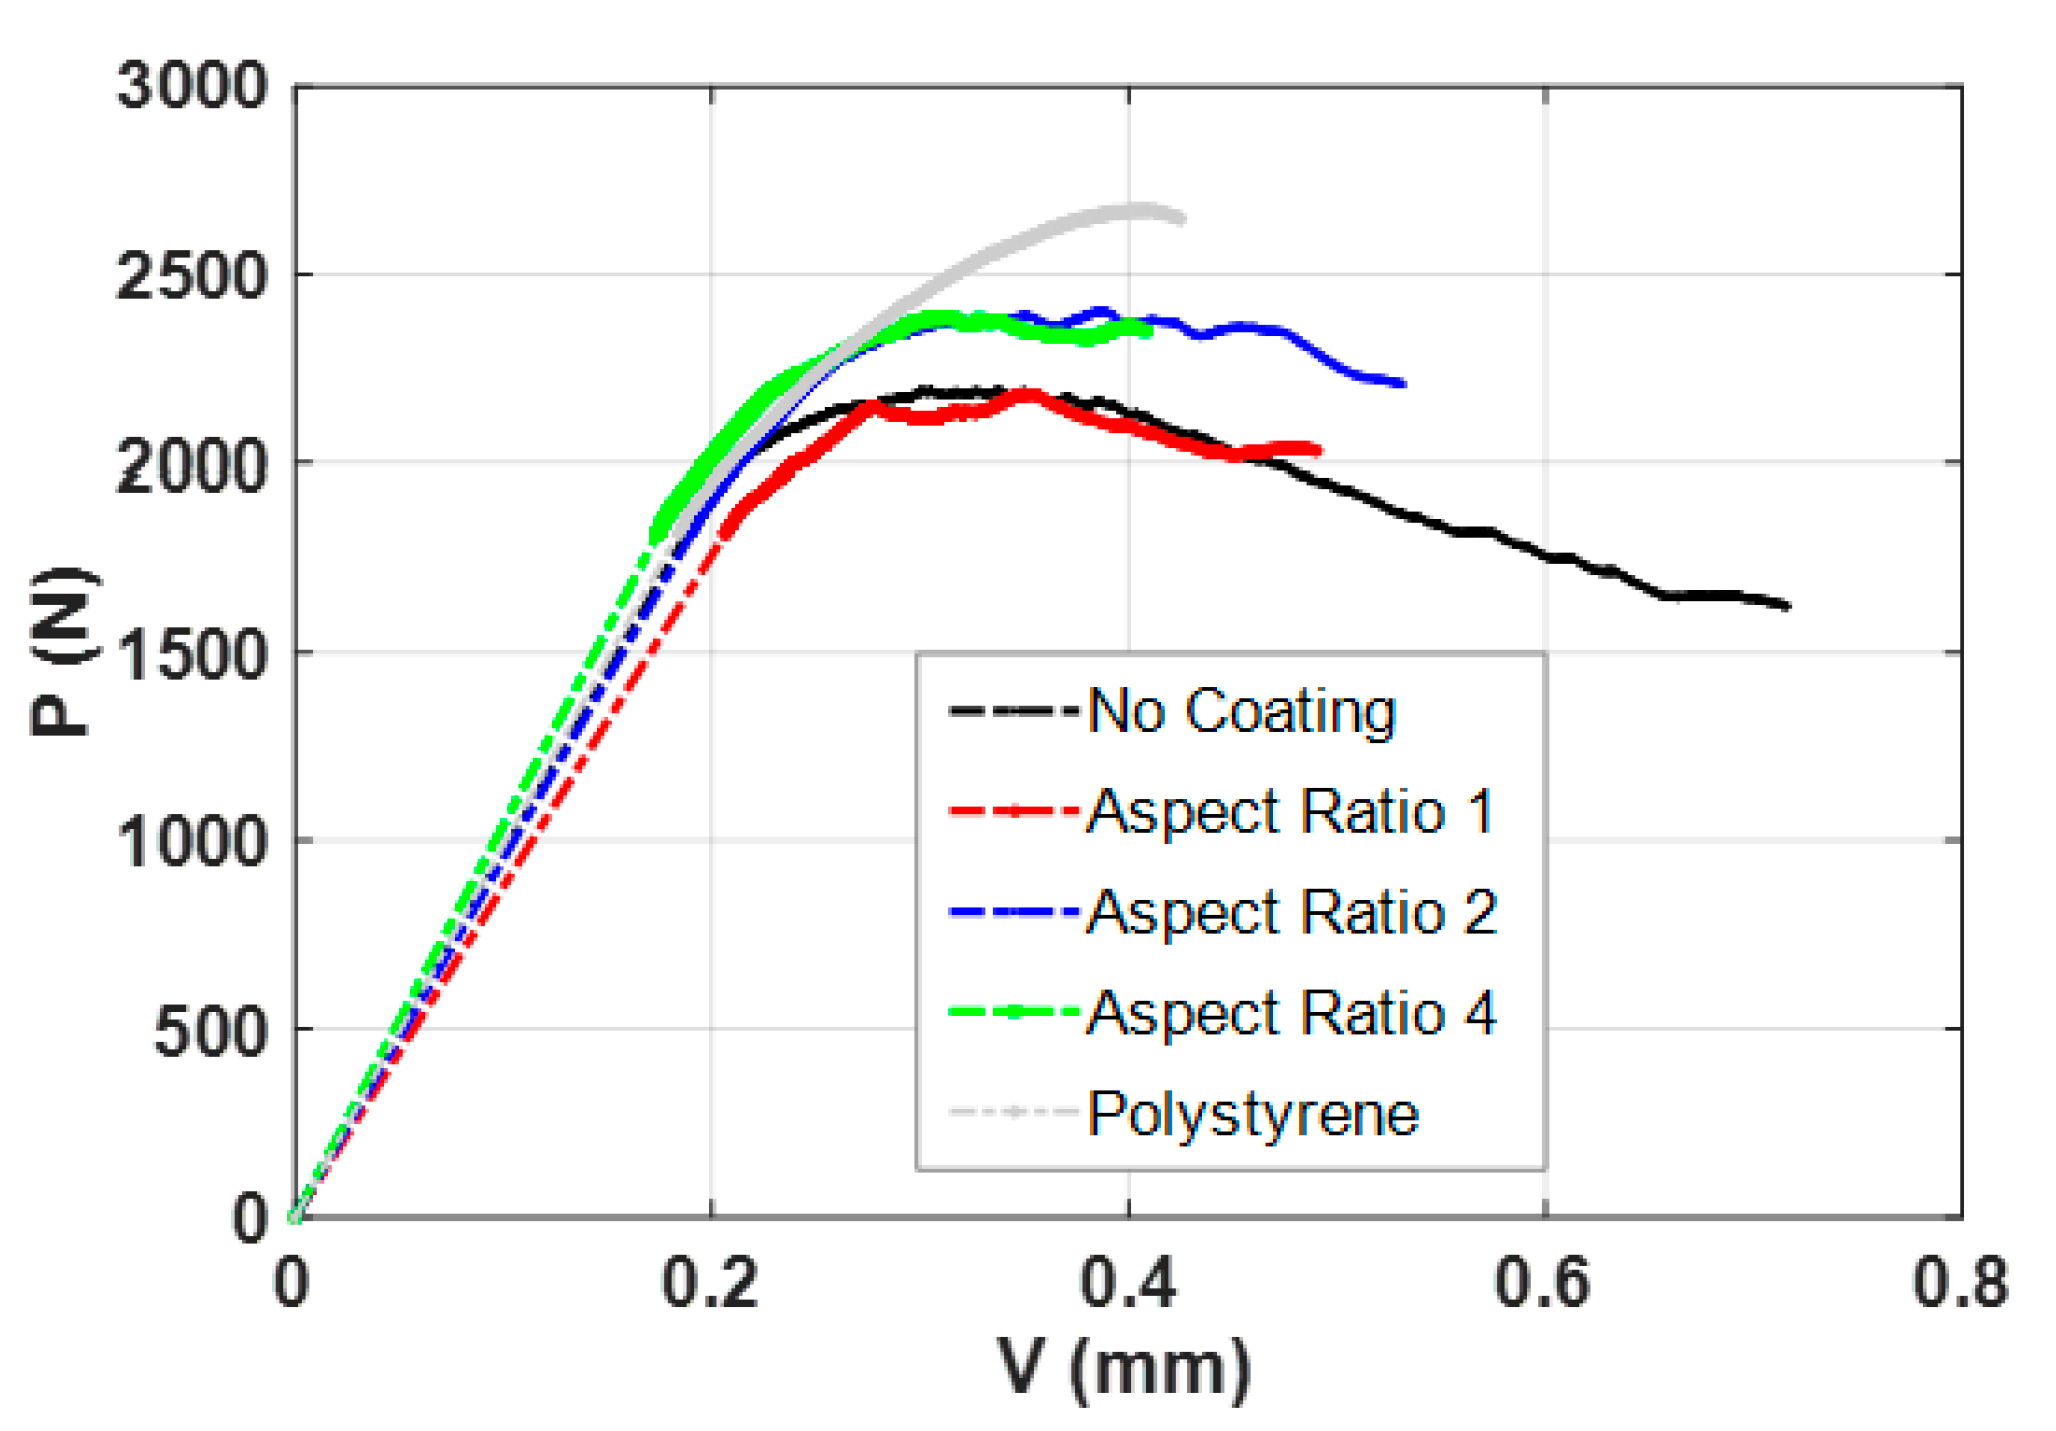
3.1. Mechanical Strength and Ductility

Figure 4 shows a typical distribution of the recorded data ( P ,   V ) . The peak load, denoted as P max , was found from each set of the data for the individual specimen test. This value marks the onset when the specimen’s structural integrity is lost to unstable cracking. Similarly, V max denotes the corresponding value of V at P max . The larger the peak load and the associated V max , the stronger the specimen’s ability to sustain the load with enhanced ductility, thereby delaying catastrophic failure. Figure 5 compares the averaged value of P max and the associated CMOD for each coating type, along with one standard deviation bar. The results show that the specimens coated with PS/TiO2 AR1 or polystyrene exhibited similar P max and V max values, outperforming other coating types for better resistance to SCC.

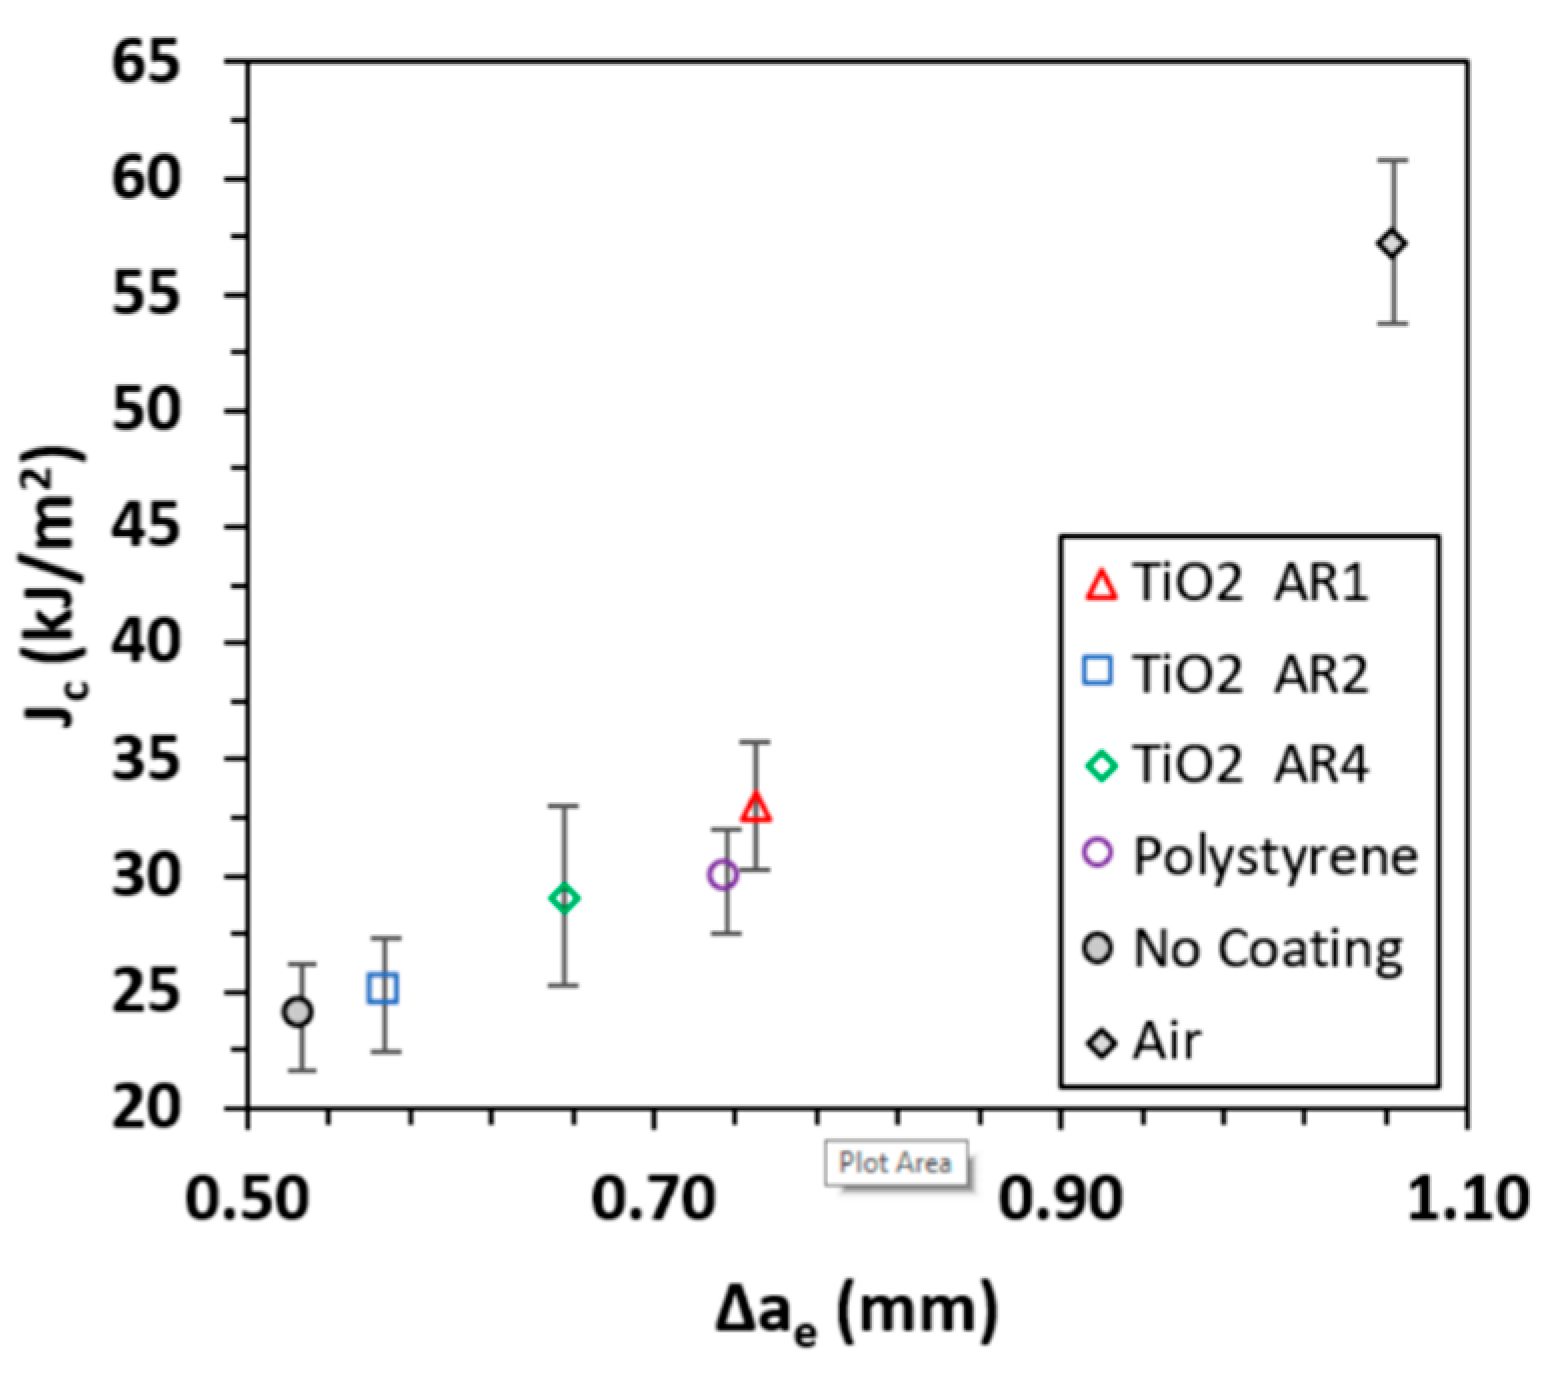
3.2. Critical J-Integral and Critical Fracture Toughness

The J -integral stands for the strain energy release per unit area of the newly formed crack surface. The J -integral calculated at P max is defined as the critical J -integral ( J c ). When J exceeds this threshold, unstable cracking begins. The J c value can be determined using the Basic Method in the ASTM E1820 Standard (see the Appendix A).
Ideally, a CT specimen will remain intact during loading up to P max , meaning the crack length associated with P max , defined as a m , would correspond to the as-machined crack length a 0 . However, stable cracking was observed during loading prior to reaching P max in all SCC tests conducted in this study. As a result, the crack length a m is larger than a 0 . The crack extension ( a e = a m a 0 ) at P max can show a specimen’s structural integrity under loading to P max . A larger a e suggests better mechanical integrity of the specimen prior to the onset of unstable cracking.
Figure 6 shows the averaged values of J c for each coated condition, plotted against a e . The “Air” data point corresponds to the uncoated specimens tested in air at the same displacement rate of the SSRT without introducing the corrosion solution. Compared to the uncoated tested in air, all specimens exposed to the synergistic corrosion and stress showed reduced resistance to stable cracking, as evidenced by the smaller J c values. Additionally, these specimens were more prone to unstable cracking, as indicated by their smaller a e values. Among the tested coatings, the specimen coated with TiO2 AR1 showed the highest toughness.
The Incremental J -integral Method outlined in ASTM E1820 evaluates J values throughout the progression of crack growth, which differs from the Basic J-integral Method that calculates the energy release rate at a single stage. This incremental method calculates the J-integral progressively up to the loading stage at P max , to yield the standard fracture toughness and stress intensity factor with better estimates than the Basic Method [29]. This method relies on the recorded data of ( P i , V i ) to infer the crack length a i , for the progressive calculations of the J ( i ) values and the associated stress intensity K J ( i ) . The calculation procedure [29] is summarized in the Appendix. The J-integral J Ru and stress intensity ( K JRu ) are defined as the values of J ( i ) and K J ( i ) associated with P max . The results are compared in Figure 7, which exhibits a similar trend to Figure 6 but with a larger magnitude.

3.3. Characterization of Cracking in SCC

The influence of coating on cracking is analyzed by comparing the relationship between the cracking rate da / dt and the stress-intensity factor K J ( i ) . The results shown in Figure 8 exhibit two distinct regimes regardless of the coating, providing insights into Phases I and II of the SCC development [31]:
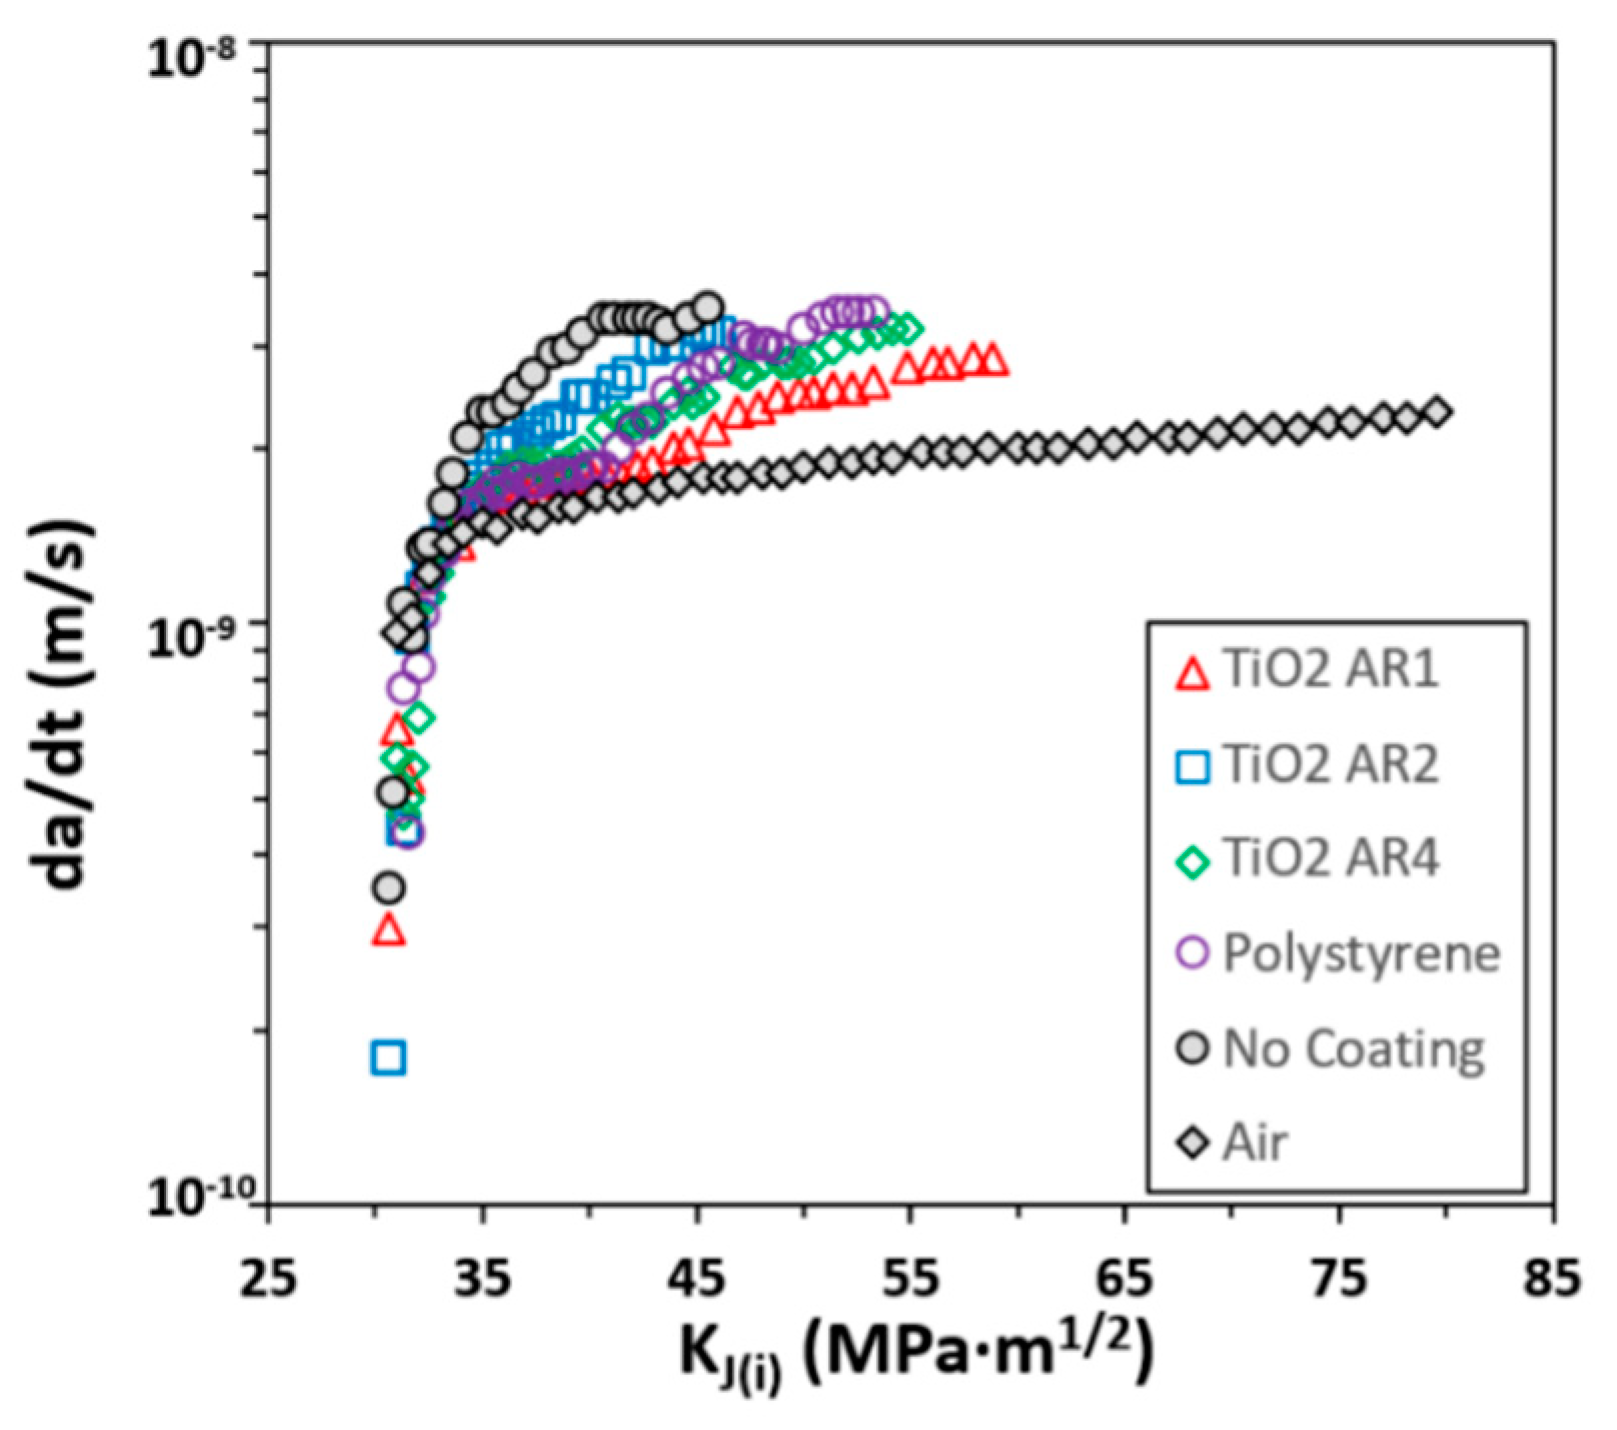
  • Crack initiation (Phase I): This phase corresponds to the regime in Figure 8, where the data points are vertically distributed, and the cracking rate is below 10−9 m/s. In this phase, cracking occurs in a presumptively intact specimen only when the stress intensity ( K J ( i ) ) is over a critical threshold, which is about 30–32 MPa·m1/2 among the different coatings. The crack growth rate is extremely slow (~10−10 m/s), showing minimal or nearly stagnant crack propagation. However, the cracking rate increases significantly, though still insignificant, as K J ( i ) rises to 35 MPa·m1/2. The PS/TiO2 AR2-coated specimens exhibited the smallest value of the critical threshold of K J ( i ) , meaning the least resistance to crack initiation.
  • Stable cracking (Phase II): This phase occurs between the stress intensity of 35–55 MPa·m1/2, where the cracking rate stabilizes with a less gradual increase over K J ( i ) in Figure 8. The plateau-like trend in the cracking rate indicates that the crack propagation is proportional to time, implying stable cracking. The variation among different coatings indicates their different influences on crack resistance in this regime. A steeper rise in da / dt in this phase means a quicker transition to unstable fracture. The graph of the PS/TiO2 AR1-coated specimen exhibits the least slope in da / dt vs. K J ( i ) , showing the most effective in delaying crack growth. A transition from nearly stagnant cracking (Phase I) to stable crack growth (Phase II) suggests a SCC behavior [5].
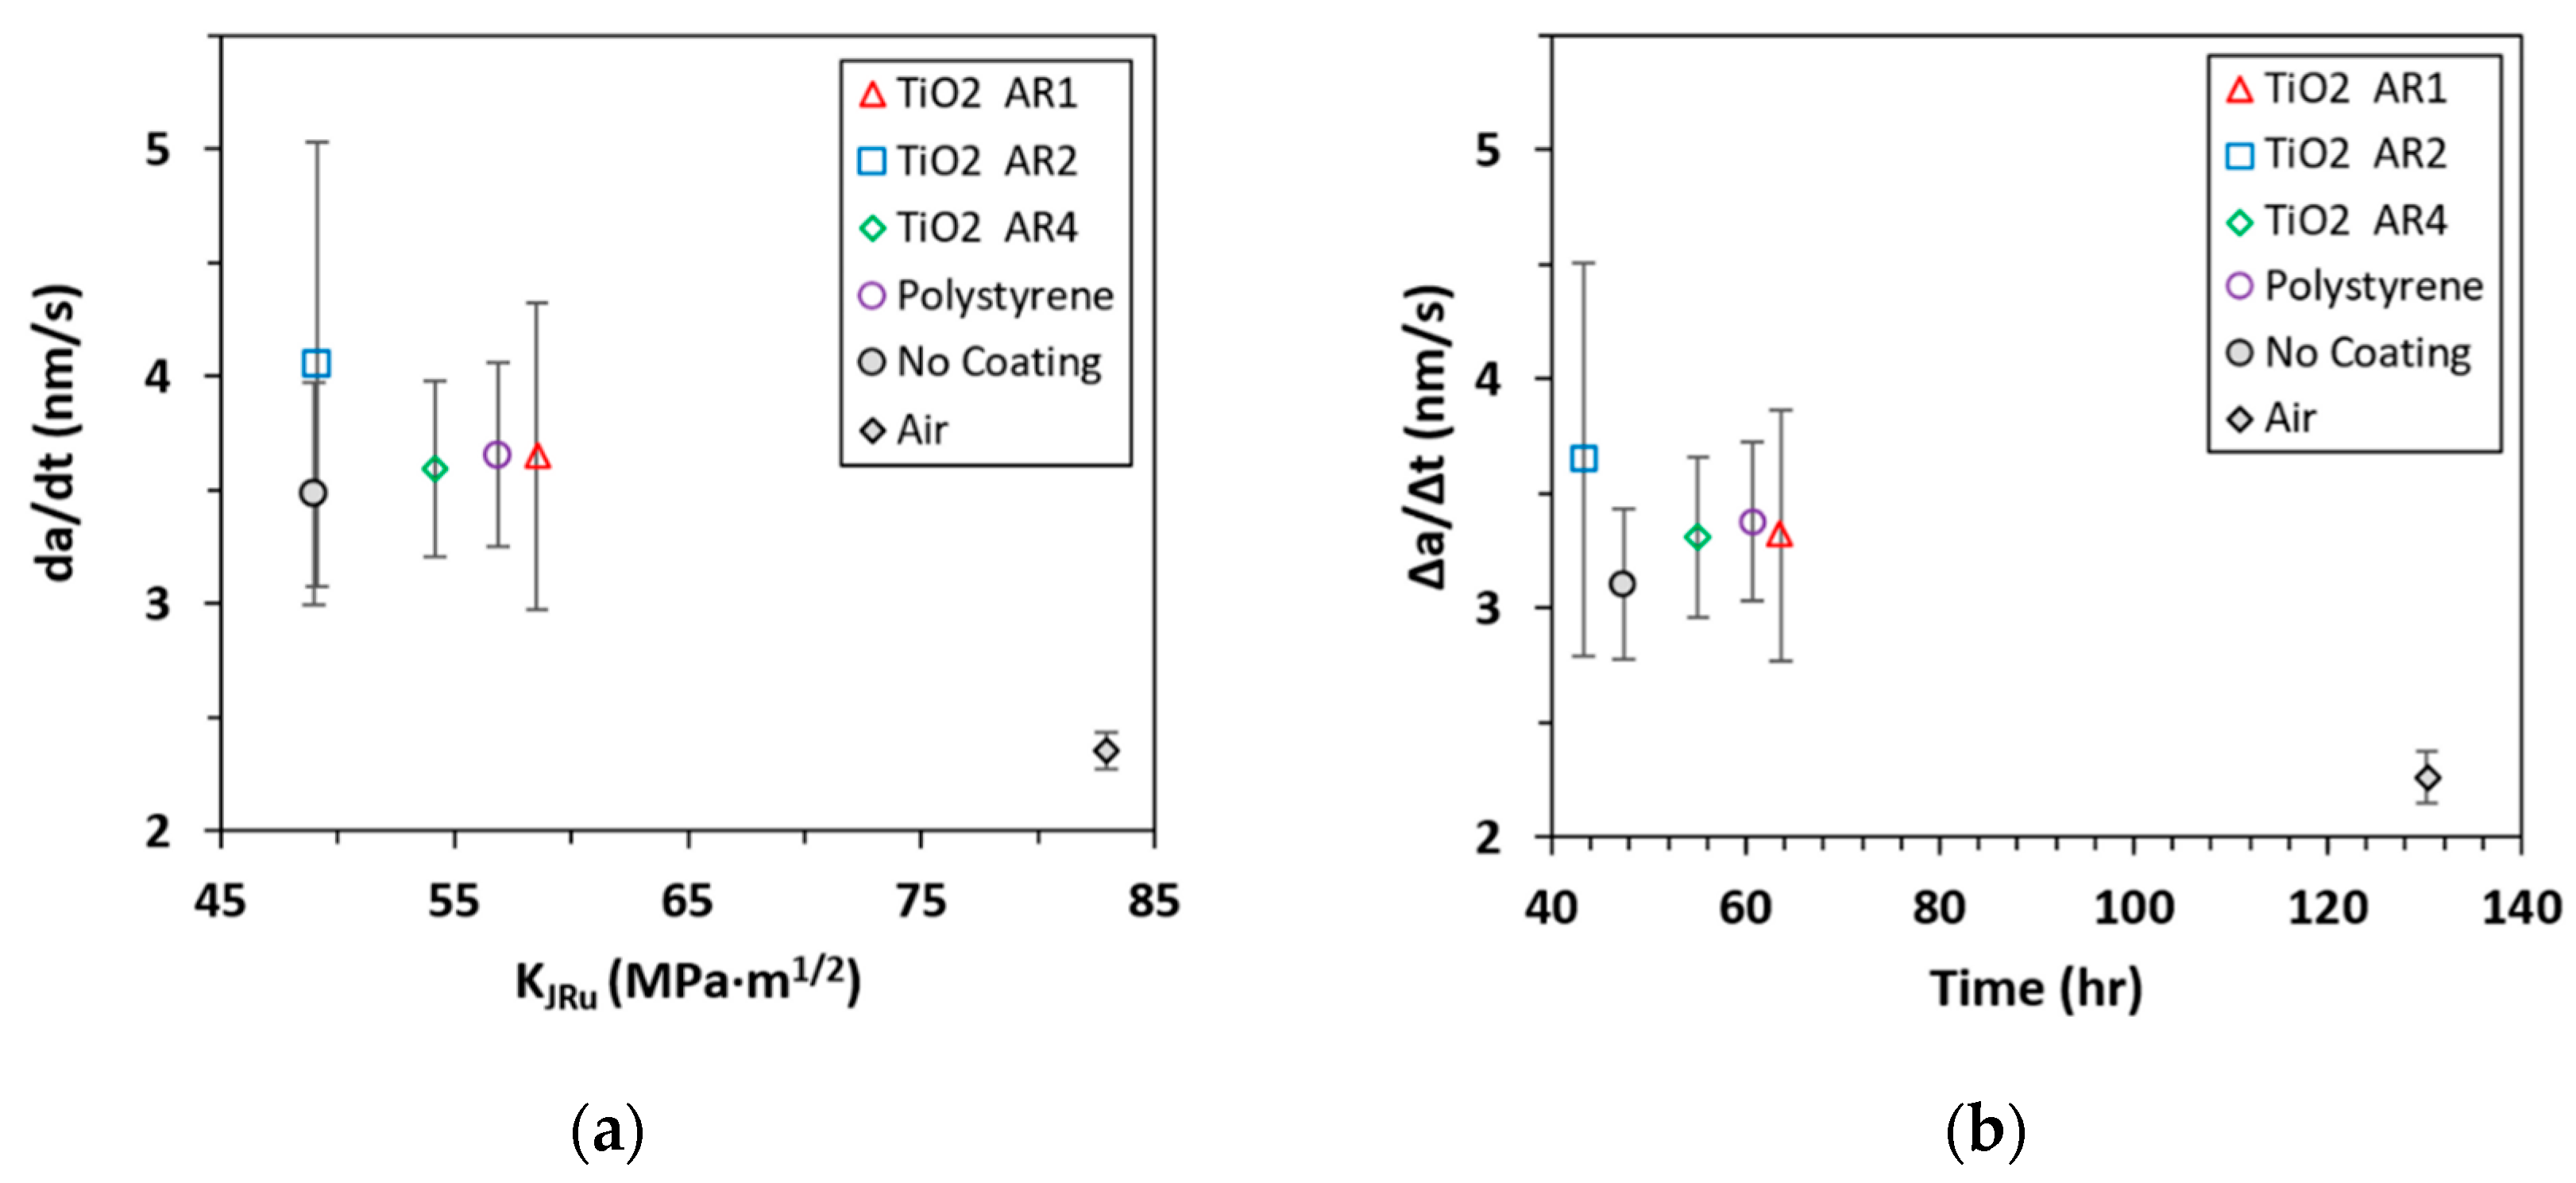
  • The largest K J ( i ) value in Phase II marks the onset of cracking instability. As K J ( i ) increases over 55–60 MPa·m1/2, cracking becomes unstable and rapidly progresses toward rupture. The instantaneous cracking rate d a e / dt at the onset of cracking instability was calculated and plotted against K JRu in Figure 9a. It shows that the magnitudes of d a e / dt for all the coatings are statistically close, but the PS/TiO2 AR1-coated has the largest stress intensity (about 58 MPa·m1/2), meaning it is the most resistant to cracking instability. The average cracking rate Δ a e / Δ t , which was calculated from the change in the crack length and the total time-to-reach- P max , was plotted against the total time in Figure 9b. This shows that the PS/TiO2 AR1-coated has the longest deferral of unstable cracking [5].
The graph in Figure 8 highlights the importance of protective coatings in reducing SCC in susceptible materials. As a baseline for comparison, the uncoated specimen tested in air exhibited the lowest cracking rate, showing minimal SCC. In contrast, the uncoated specimen tested in the corrosive environment exhibited the strongest extent of SCC. PS/TiO2 and polystyrene coatings mitigated SCC (by delaying crack propagation), but the effectiveness varied. Figure 9 shows that the TiO2 AR1 coating enabled the largest K JRu and the longest time reaching P max , indicating its superiority among the other coatings tested in fracture toughness and deferring the onset of unstable cracking.
A cracked PS/TiO2-coated CT specimen is shown in Figure 10. Figure 10a shows the crack extension when the specimen was loaded to P max . Figure 10b,c show the specimen halves after SSRT testing, both before and after the removal of crystalized salt from the fracture surfaces. The salt-stained reddish Chevron-notched tip in Figure 10a,b show the area under localized stress and saline concentration during testing. The light-gray stained area in Figure 10a exhibits a less oxidized surface, as it was exposed to the corrosion solution dripping from the tip during testing, in contrast to the dark-gray area that was not in contact with the NaCl solution.
The distinct textures observed in Figure 10c were detailed with the scanning electron microscopy (SEM) images shown in Figure 11. The selected quadrants A, B, and C were progressively zoomed in to show a cleavage-like texture near the machined edge and irregular dimples near the crack front (toward the left of the fractography). Cleavage occurs due to low-energy, intergranular, or transgranular fracture along the crystallographic planes, which is a brittle fracture behavior, whereas dimples form by microvoid nucleation, growth, and coalescence, which are characteristic of ductile fracture [32]. As the coating layer was broken gradually by stable cracking, the SCC correspondingly became stronger, leading to fast, unstable cracking. The transgranular cleavage has a more directional, slim shape aligning with the direction of cracking, indicating SCC susceptibility [33,34]. This brittle failure mode was observed in all our coated specimens. On the other hand, the dimples shown at the far end of the Chevron tip are irregular and isotropic. This ductile failure mode is typically associated with the ending phase of testing, during which the specimen was nearly torn into halves, and the cracking was nearly arrested.

3.4. SCC Indecies

Table 3 lists the averaged values and one standard deviation of the recorded data P max ,   V max and Δ t (time-to-reach- P max , an index to time-to-failure) for each type of specimen tested. This table also includes other performance indicators derived from the measured data: time-to-reach- P max ( Δ t ), the maximum crack length ( a max ), the total change in crack extension ( a e =   a max   a 0 ), averaged cracking rate over Δ t ( a e / Δ t ), instantaneous cracking rate when the load reached P max   ( d a e / dt ), “Stiffness” (the stiffness of the specimen, determined as the slope of the load vs. CMOD curve), the J -integral calculated at P max per the Basic Method ( J c ), the J -integral calculated at P max per the recursive Equation (A9) ( J Ru ), and the stress intensity factor associated with J Ru , calculated per Equation (A11) ( K JRu ). The value of P max implies the load-bearing capacity (i.e., mechanical strength). The J- and K-values are related to the fracture toughness.
An SCC index for a performance indicator I is defined by its percentage change from a selected reference value of the indicator:
SCC index = I SCC I REF I REF × 100 ,  
where I SCC is a performance indicator from Table 3 and I REF is the reference value of the indicator. Table 4 presents the SCC susceptibility indices for different coatings in six indicators selected from Table 3 relative to a reference.
The SCC indices in the “R” row in Table 4 quantify the influence of the saline solution on the uncoated specimens. They were calculated for the uncoated specimens, with I SCC selected from those tested in NaCl solution and I REF from those tested in air. These indices in the “R” row show that the uncoated specimens tested in NaCl exhibited significant degradation, with reductions in load-bearing capacity, fracture toughness, and time-to-failure. The most severe effect was observed in time-to-reach- P max ( Δ t ), which dropped by 63.6%, suggesting accelerated crack propagation in uncoated specimens in the saline condition. Furthermore, the fracture toughness ( J c ) and stress intensity factor ( K JRu ) decreased by 35.4% and 40.9%, respectively, indicating a great loss in structural integrity. The significant increase in the crack extension ( a e ) highlights the aggressive crack growth in the uncoated specimens.
The SCC indices listed in the remaining rows in Table 4 (labeled with 1~4) indicate the extent to which a coating can reduce the SCC susceptibility compared to uncoated coating. The I REF was selected from the uncoated specimens tested in 3.5% NaCl. The application of the PS/TiO2 AR1 coatings greatly improved SCC resistance. PS/TiO2 AR1 demonstrated the best performance among all the coatings, leading to an increase in mechanical strength ( P max , +4.6%), fracture toughness ( J c , +17.5%), and stress intensity factor ( K JRu , +19.5%). The crack extension ( a e ) was much lower than the uncoated, implying a significant reduction in the SCC-induced crack growth. The PS/TiO2 AR4 coating provided moderate SCC resistance, while the PS/TiO2 AR2 coating showed mixed results. The pure PS mitigated SCC but was not as effective as TiO2-embedded coatings.

4. Discussion

The J-integral-based analysis assumes that the strain energy release is attributed to cracking, with any other energy contributions from plastic deformation away from the crack tip and/or tearing considered negligible. This assumption is critical for the validity of fracture toughness and stress intensity estimates. The J-integral calculation procedure from ASTM E1820 Standard [29] was applied to determine the fracture toughness and stress intensity values, resulting in illustrations like Figure 8 and Figure 9a. This procedure is valid in the stable cracking regime. In this regime, the strain energy release is presumptively attributed to the fracture at the cracking tip, around which the plastic deformation is localized, and the crack front behaves more brittle-like, as evidenced by the cleavage texture in Figure 11. However, the validity of the procedure will become weaker in the unstable cracking regime, as the energy released from fracture is not only limited to the crack tip but also attributed to bulk yielding and tearing. Therefore, the calculated J value becomes over-estimated because of the additional energy accounted for. In the context of the J-integral-based analysis, SSRT facilitates a more gradual cracking process, thereby reducing notch sensitivity effects. In this study, specimens with as-machined Chevron notches were directly subjected to SSRT without fatigue pre-cracking, as suggested in ASTM E1820. While this induces a blunter crack tip, potentially resulting in an overestimated fracture toughness, the very slow loading in SSRT allows sufficient time for localized plasticity and stress redistribution around the notch tip. The initial blunt notch can, thus, progressively sharpen during the early stage of crack development, promoting a more valid estimation of fracture toughness. Consequently, the fracture toughness estimates obtained in the as-machined condition from SSRT are expected to be more representative of the actual material toughness than from tested at faster loading rates.
One unique feature of this work is the use of a dosing mechanism to produce a local corrosion environment that is greatly confined around the crack tip. It allows for the preservation of the fractographic and historical information on the cracked surfaces during long testing while confining the stress–corrosion effect to the notch tip region. As seen in Figure 10 and Figure 11, the bulk of the specimen did not suffer severe degradation from corrosion. Nevertheless, the salt crystals formed on the cracked surface were dissolved back into the solution once the surface was wetted through subsequent dosing of the corrosion solution.
The fracture surface of the specimen shown in Figure 11 displays two distinct regions. The cleavage-like texture predominates in the area near the machined Chevron notch, where the crack was initiated and slowly developed under the influence of synergistic stress–corrosion interaction. This relatively slow process (Phase I in Figure 8) provided a sufficient amount of time for NaCl to react with AA2024-T3 at the crack tip. The fractography of this region exhibits a texture which is consistent with the brittle failure mode of AA2024. As cracking transitioned into Phase II depicted in Figure 8, the crack growth rate accelerated, leaving less time for the electrochemical reaction to affect the newly cracked area. The accelerating rate of crack growth gradually phases out the influence of corrosion in SCC, transitioning to a mechanical stress-dominated cracking mechanism. This transition is evident by the increasingly rounded cleavage, departing from the directional slim shape displayed in quadrant B of Figure 11. The second region begins where the fracture surface exhibits dimples, a ductile failure mode that is associated with mechanical tearing. In this region, the thickness and ductility of the material exert a stronger influence on crack growth. This is evidenced by the crack tunneling toward the back face of the specimen, as seen in Figure 10. The crack growth in this region occurred rapidly, thus being dominated by mechanical stress rather than corrosion.
A specimen with a larger value for both J and KJ at P max , together with a longer time-to-reach- P m a x , indicates a lower severity of SCC. Consequently, a coated specimen capable of sustaining a greater extension of stable cracking (transitioning from Phase I to Phase II, as illustrated in Figure 8) demonstrates enhanced toughness in fracture resistance.
In the SSRT condition, stress is progressively applied and exceeds the yielding limit of the material, creating local plastic deformation around the machined notch as the loading increases. During the loading up to cracking instability, coatings as a corrosion barrier limit the ingress of corrosive agents into the crack tip and, thus, effectively delay the onset of SCC. The PS/TiO2 composite coating has been shown to enhance corrosion resistance compared to bare PS coatings [18]. Our study further suggests that the aspect ratio of the nanoparticles influences the susceptibility indices for stress corrosion cracking. The specimens coated with PS/TiO2 AR2 exhibited poor performance, similar to that of the uncoated specimens, in reducing SCC susceptibility. In contrast, the PS/TiO2 AR1 and PS coatings demonstrated the best performance. The effect of the nanoparticles’ aspect ratio on the corrosion properties of the coatings can be elucidated by the packing density of the nanoparticles within the PS matrix [35] and the associated failure mechanisms [36].

5. Conclusions

This study experimentally evaluated the performance of polystyrene/TiO2 nanocomposite coatings in reducing the susceptibility of AA 2024-T3 to SCC. An accelerated SCC condition was implemented to test CT specimens under a slow, constant displacement rate in a controlled saline environment. Load-CMOD data were recorded and analyzed for each coated specimen to determine performance indicators, including mechanical strength, time-to-reach-failure, crack extension, fracture toughness, and stress intensity. Six SCC susceptibility indices were developed based on these indicators to compare the effectiveness of each coating in reducing SCC susceptibility. Our findings indicate that the aspect ratio of the Titania nanoparticles significantly influences resistance to SCC. PS/TiO2 AR1 is the most effective strategy for mitigating SCC due to its ability to enhance load-bearing capacity, fracture toughness, and stress intensity while reducing crack extension. This coating should be the primary choice for applications exposed to chloride environments. PS/TiO2 AR4 is a strong alternative, offering significant SCC resistance, albeit slightly lower than AR1. The occurrence of SCC was captured and illustrated in the fractography of a halved specimen, where distinct cleavage and dimples are present. The SCC failure in the tested specimens was attributed to very slow, stable cracking associated with a brittle-dominated fracture, which then transitioned to ductile-dominated accelerated cracking failure.

Author Contributions

Conceptualization, C.-f.C.; methodology, C.-f.C.; validation, C.-f.C., B.B. and J.H.IV; formal analysis, B.B.; investigation, C.-f.C. and B.B.; resources, C.-f.C.; data curation, C.-f.C. and B.B.; nanoparticle sample preparation: J.Z.; writing—original draft preparation, B.B.; writing—review and editing, C.-f.C.; visualization, C.-f.C. and B.B.; supervision, C.-f.C.; project administration, C.-f.C.; funding acquisition, C.-f.C. All authors have read and agreed to the published version of the manuscript.

Funding

This research was funded by NASA EPSCoR Program Cooperative Agreement Notice (CAN), grant number NNX16AT46A.

Informed Consent Statement

Not applicable.

Data Availability Statement

The original contributions presented in the study are included in the article, further inquiries can be directed to the corresponding author.

Acknowledgments

The authors thank Joe Michalski for machining CT specimens and test rig components. The SEM was performed at the Advanced Instrumentation Laboratory (AIL), University of Alaska Fairbanks.

Conflicts of Interest

The funders had no role in the design of the study; in the collection, analyses, or interpretation of data; in the writing of the manuscript; or in the decision to publish the results.

Appendix A. The Basic J-Integral Method

The Basic Method in ASTM E1820 Standard [29] lays out a procedure for determining fracture toughness using the J -integral approach. The J -integral for a deformed CT specimen associated with a data point ( P , V ) can be determined by
J = J e l + J p l 1 + 2 7 Δ a b 0 ,
where J el and J pl are the elastic and plastic parts of the strain energy. Firstly, the elastic strain energy for plane stress in which the testing condition dominated is
J e l = K 2 E ,
where E is the modulus of elasticity of the specimen, and K is the stress-intensity factor (fracture toughness) of the CT specimen tested:
K = P B W   f a W ,
in which B and W are the thickness and uncracked ligament side of the CT specimen (referring to Figure 1), P is the load, a is the crack length associated with P . The term f ( a / W ) is a dimensionless function that was curve-fitted per the types of specimens. For the CT specimens, ASTM E1820 adopts the following form:
f a W = 2 + a W 0.886 + 4.64 a W 13.32 a W 2 + 14.72 a W 3 5.6 a W 4 1 a W 3 2   ,
The modulus of elasticity E was determined from the recorded ( P , V ) data using the 95% secant method. Secondly, the plastic portion of the J -integral in Equation (A1) is
J p l = η p l A p l B   b o ,
where b o W a o is the unfractured ligament of the specimen, a 0 = 4.5 mm is the initial crack length as-machined (see Figure 1), η p l   2 + 0.522 b o / W is a geometry factor, and A p l is the plastic area under the P vs. V curve up to the point associated with P m a x . J p l is scaled as given in Equation (1) per the basic test method in ASTM E1820, in which Δ a is the crack extension:
Δ a = a a 0 ,
The crack length a / W was inferred using the load-line compliance of the specimen per the curve-fitted formula given by Saxena and Hudak [37]:
a W = 1.0002 4.0632   U + 11.242   U 2 106.04   U 3 + 464.33   U 4 650.68   U 5 ,
where U is a dimensionless empirical parameter determined by
U = 1 1 + E B V P
in which V is the load–line displacement converted from the measured CMOD.
The critical J -integral ( J c ) is associated with the onset of unstable cracking that occurs at P m a x . To calculate J c , it first calculates the crack length (a) by introducing P m a x and V m a x from the recorded data to Equations (A7) and (A8), and then go through the remaining equations.

Appendix B. The Incremental J-Integral Method

This method is summarized from ASTM E1820 Standard [29]. The incremental J i is calculated recursively with i = 1 from the beginning of a test:
J i = K i 2 E + J p l i ,
where K i is calculated by using a = a i in Equation (A3), where a i is the associated crack length with the magnitude of loading P i recorded in loading. The incremented J p l i is
J p l i = J p l i 1 + η p l i 1 b i 1 A p l i A p l i 1 B N 1 γ i 1 a i a i 1 b i 1 ,
where
η p l ( i 1 ) 2.0 + 0.522 b ( i 1 ) W ,
b ( i ) W a i ,    
A p l i = A p l i 1 + P i + P i 1 V p l i V p l i 1 2 ,    
V p l ( i ) V ( i ) P ( i ) C L L ( i ) ,    
γ ( i 1 ) 1.0 + 0.76 b ( i 1 ) W ,    
in which the quantity A p l i A p l i 1 is the incremented plastic area under the force versus load–line CMOD curve. V p l ( i ) is the plastic part of the load–line CMOD. The experimental compliance ( C L L ( i ) ) is determined by the slope of the V vs. P curve. The value of J i associated with the maximum load ( P m a x ) is defined as the fracture toughness at fracture instability (i.e., critical fracture toughness, J R u ). The critical stress intensity K J R u is associated with J R u , as calculated by
K J R u = E J R u ,    

References

  1. ASM Handbook Series, Volume 04—Heat Treating. In 63 Heat Treating of Aluminum Alloys; ASM International Handbook Committee: Materials Park, OH, USA, 1991; pp. 841–879.
  2. Guillaumin, V.; Mankowski, G. Localized Corrosion of 2024 T351 Aluminium Alloy in Chloride Media. Corros. Sci. 1998, 41, 421–438. [Google Scholar] [CrossRef]
  3. Zhang, W.; Frankel, G.S. Transitions between Pitting and Intergranular Corrosion in AA2024. Electrochim. Acta 2003, 48, 1193–1210. [Google Scholar] [CrossRef]
  4. Zhang, X.; Zhou, X.; Hashimoto, T.; Liu, B. Localized Corrosion in AA2024-T351 Aluminium Alloy: Transition from Intergranular Corrosion to Crystallographic Pitting. Mater. Charact. 2017, 130, 230–236. [Google Scholar] [CrossRef]
  5. Bobby Kannan, M.; Bala Srinivasan, P. Stress Corrosion Cracking (SCC) of Aluminium Alloys. In Stress Corrosion Cracking: Theory and Practice; Raja, V.S., Shoji, T., Eds.; Elsevier: Cambridge, UK, 2011; pp. 307–340. [Google Scholar]
  6. Buchheit, R.G.; Grant, R.P.; Hlava, P.F.; Mckenzie, B.; Zender, G.L. Local Dissolution Phenomena Associated with S Phase (Al2CuMg) Particles in Aluminum Alloy 2024-T3. J. Electrochem. Soc. 1997, 144, 2621. [Google Scholar] [CrossRef]
  7. de Bonfils-Lahovary, M.L.; Laffont, L.; Blanc, C. Characterization of Intergranular Corrosion Defects in a 2024 T351 Aluminium Alloy. Corros. Sci. 2017, 119, 60–67. [Google Scholar] [CrossRef]
  8. Jorcin, J.-B.; Blanc, C.; Pébère, N.; Tribollet, B.; Vivier, V. Galvanic Coupling Between Pure Copper and Pure Aluminum. J. Electrochem. Soc. 2008, 155, C46. [Google Scholar] [CrossRef]
  9. Guo, T.; Qiao, L.; Pang, X.; Volinsky, A.A. Brittle Film-Induced Cracking of Ductile Substrates. Acta Mater. 2015, 99, 273–280. [Google Scholar] [CrossRef]
  10. Becker, M. Chromate-Free Chemical Conversion Coatings for Aluminum Alloys. Corros. Rev. 2019, 37, 321–342. [Google Scholar] [CrossRef]
  11. Eichinger, E.; Osborne, J.; Van Cleave, T. Hexavalent Chromium Elimination: An Aerospace Industry Progress Report. Met. Finish. 1997, 95, 36–41. [Google Scholar] [CrossRef]
  12. de Wit, J.H.W.; van der Weijde, D.H.; Ferrari, G. Organic Coatings. In Corrosion Mechanisms in Theory and Practice, 3rd ed.; CRC Press: Boca Raton, FL, USA, 2011; pp. 863–906. ISBN 9781420094633. [Google Scholar]
  13. Ramezanzadeh, B.; Niroumandrad, S.; Ahmadi, A.; Mahdavian, M.; Moghadam, M.H.M. Enhancement of Barrier and Corrosion Protection Performance of an Epoxy Coating through Wet Transfer of Amino Functionalized Graphene Oxide. Corros. Sci. 2016, 103, 283–304. [Google Scholar] [CrossRef]
  14. Wang, P. Aggregation of TiO2 Nanoparticles in Aqueous Media: Effects of PH, Ferric Ion and Humic Acid. Int. J. Environ. Sci. Nat. Res. 2017, 1, 157–162. [Google Scholar] [CrossRef]
  15. Kapridaki, C.; Maravelaki-Kalaitzaki, P. TiO2-SiO2-PDMS Nano-Composite Hydrophobic Coating with Self-Cleaning Properties for Marble Protection. Prog. Org. Coat. 2013, 76, 400–410. [Google Scholar] [CrossRef]
  16. Cui, X.; Zhu, G.; Pan, Y.; Shao, Q.; Zhao, C.; Dong, M.; Zhang, Y.; Guo, Z. Polydimethylsiloxane-Titania Nanocomposite Coating: Fabrication and Corrosion Resistance. Polymer 2018, 138, 203–210. [Google Scholar] [CrossRef]
  17. Nahrawy, A.M.E.; Haroun, A.A.; Hammad, A.B.A.; Diab, M.A.; Kamel, S. Uniformly Embedded Cellulose/Polypyrrole-TiO2 Composite in Sol-Gel Sodium Silicate Nanoparticles: Structural and Dielectric Properties. Silicon 2019, 11, 1063–1070. [Google Scholar] [CrossRef]
  18. Zhang, J.; Zhang, L. Polystyrene/TiO2 Nanocomposite Coatings To Inhibit Corrosion of Aluminum Alloy 2024-T3. ACS Appl. Nano Mater. 2019, 2, 6368–6377. [Google Scholar] [CrossRef]
  19. Doğru Mert, B. Corrosion Protection of Aluminum by Electrochemically Synthesized Composite Organic Coating. Corros. Sci. 2016, 103, 88–94. [Google Scholar] [CrossRef]
  20. Gonzalez, E.; Solis, R.; Muñoz, L. Sol-Gel Films: Corrosion Protection Coating for Aluminium Alloy. In Sol-Gel Method; Vejar, N., Ed.; IntechOpen: Rijeka, Croatia, 2019; pp. 75–96. ISBN 978-1-78985-334-6. [Google Scholar]
  21. Deshpande, P.P.; Jadhav, N.G.; Gelling, V.J.; Sazou, D. Conducting Polymers for Corrosion Protection: A Review. J. Coat. Technol. Res. 2014, 11, 473–494. [Google Scholar] [CrossRef]
  22. Saji, V.S. Review of Rare-Earth-Based Conversion Coatings for Magnesium and Its Alloys. J. Mater. Res. Technol. 2019, 8, 5012–5035. [Google Scholar] [CrossRef]
  23. Abrahami, S.T.; de Kok, J.M.M.; Gudla, V.C.; Ambat, R.; Terryn, H.; Mol, J.M.C. Interface Strength and Degradation of Adhesively Bonded Porous Aluminum Oxides. Npj Mater. Degrad. 2017, 1, 8. [Google Scholar] [CrossRef]
  24. Pletincx, S.; Fockaert, L.L.I.; Mol, J.M.C.; Hauffman, T.; Terryn, H. Probing the Formation and Degradation of Chemical Interactions from Model Molecule/Metal Oxide to Buried Polymer/Metal Oxide Interfaces. Npj Mater. Degrad. 2019, 3, 23. [Google Scholar] [CrossRef]
  25. Djozan, D.; Ebrahimi, B.; Mahkam, M.; Farajzadeh, M.A. Evaluation of a New Method for Chemical Coating of Aluminum Wire with Molecularly Imprinted Polymer Layer. Application for the Fabrication of Triazines Selective Solid-Phase Microextraction Fiber. Anal. Chim. Acta 2010, 674, 40–48. [Google Scholar] [CrossRef] [PubMed]
  26. Mui, T.S.M.; Silva, L.L.G.; Prysiazhnyi, V.; Kostov, K.G. Surface Modification of Aluminium Alloys by Atmospheric Pressure Plasma Treatments for Enhancement of Their Adhesion Properties. Surf. Coat. Technol. 2017, 312, 32–36. [Google Scholar] [CrossRef]
  27. Abrahami, S.T.; Hauffman, T.; de Kok, J.M.M.; Mol, J.M.C.; Terryn, H. Effect of Anodic Aluminum Oxide Chemistry on Adhesive Bonding of Epoxy. J. Phys. Chem. C 2016, 120, 19670–19677. [Google Scholar] [CrossRef]
  28. Venables, J.D.; McNamara, D.K.; Chen, J.M.; Sun, T.S.; Hopping, R.L. Oxide Morphologies on Aluminum Prepared for Adhesive Bonding. Appl. Surf. Sci. 1979, 3, 88–98. [Google Scholar] [CrossRef]
  29. ASTM Standard E1820-18; Standard Test Method for Measurement of Fracture Toughness. ASTM International: West Conshohocken, PA, USA, 2018; pp. 1–55. [CrossRef]
  30. Sugimoto, T.; Zhou, X.; Muramatsu, A. Synthesis of Uniform Anatase TiO2 Nanoparticles by Gel–Sol Method: 3. Formation Process and Size Control. J. Colloid Interface Sci. 2003, 259, 43–52. [Google Scholar] [CrossRef] [PubMed]
  31. Rao, A.C.; Vasu, V.; Govindaraju, M.; Srinadh, K.V. Stress Corrosion Cracking Behaviour of 7xxx Aluminum Alloys: A Literature Review. Trans. Nonferrous Met. Soc. China 2016, 26, 1447–1471. [Google Scholar] [CrossRef]
  32. Pineau, A.; Benzerga, A.A.; Pardoen, T. Failure of Metals I: Brittle and Ductile Fracture. Acta Mater. 2016, 107, 424–483. [Google Scholar] [CrossRef]
  33. Braun, R. Transgranular Environment-Induced Cracking of 7050 Aluminium Alloy under Cyclic Loading Conditions at Low Frequencies. Int. J. Fatigue 2008, 30, 1827–1837. [Google Scholar] [CrossRef]
  34. Wanhill, R.; Byrnes, R.; Smith, C. Stress Corrosion Cracking (SCC) in Aerospace Vehicles. In Stress Corrosion Cracking Theory and Practice; Raja, V.S., Shoji, T., Eds.; Woodhead Publishing Limited: Cambridge, UK, 2008; pp. 608–650. [Google Scholar]
  35. Wouterse, A.; Williams, S.R.; Philipse, A.P. Effect of Particle Shape on the Density and Microstructure of Random Packings. J. Phys. Condens. Matter 2007, 19, 406215. [Google Scholar] [CrossRef]
  36. Chen, C.; Baart, B.V.; Zhang, J.; Zhang, L. Polystyrene/TiO2 Nanocomposite Coating for Strength and Toughness Enhancement of Aluminum Alloy 2024-T3 in Accelerated Stress Corrosion Cracking. Prog. Org. Coat. 2021, 161, 106458. [Google Scholar] [CrossRef]
  37. Saxena, A.; Hudak, S.J. Review and Extension of Compliance Information for Common Crack Growth Specimens. Int. J. Fract. 1978, 14, 453–468. [Google Scholar] [CrossRef]
Figure 1. Dimensions of the CT specimens for machining (units in mm).
Eng 06 00083 g001
Figure 2. In-house tensile test rig instrumented for specimen testing.
Eng 06 00083 g002
Figure 3. Close-up view of CT specimen mounting.
Eng 06 00083 g003
Figure 4. Typical load (P) vs. CMOD (V) for coated and uncoated specimens.
Eng 06 00083 g004
Figure 5. Comparison of the maximum load ( P max vs. the associated CMOD value ( V max ) for each type of specimen.
Eng 06 00083 g005
Figure 6. Averaged J c (kJ/m2) vs. the change in the effective crack length a e (mm) with one standard deviation bar.
Eng 06 00083 g006
Figure 7. Averaged values of J Ru (kJ/m2) vs. the change in the effective crack length a e (mm) with one standard deviation bar.
Eng 06 00083 g007
Figure 8. Cracking rate vs. stress intensity factor K J ( i ) .
Eng 06 00083 g008
Figure 9. (a) Instantaneous cracking rate at P max vs. equivalent stress intensity K JRu . (b) Average cracking rate at P max vs. time-to-reach- P max .
Eng 06 00083 g009
Figure 10. A cracked PS/TiO2-coated CT specimen: (a) crack extension. Specimen halves: (b) before and (c) after cleaning the crystallized salt from the fractured surfaces.
Eng 06 00083 g010
Figure 11. SEM images on one-half of the halves of the CT specimen from Figure 10. Quadrant A shows a global view of the SCC-induced cracking progressing from right to left. Quadrant B shows the transition from transgranular cleavage to ductile dimples. Quadrant C highlights the cleavage fracture with a magnified view of the machined tip.
Eng 06 00083 g011
Table 1. Chemical composition of AA2024 (wt. %) according to Kaiser Aluminum.
Others
AlCrCuFeMgMnNiPbSiSnTiZnEachTotal
restmax 0.13.8–4.9max 0.51.2–1.80.3–0.90.050.05max 0.50.05max 0.15max 0.25max 0.05max 0.15
Table 2. Weight percentage composition and particle size distribution of TiO2 nanoparticles in the tested coatings.
CoatingComposition (wt. %)Size Distribution (nm)
PSTiO2AcetoneMinor AxisMajor Axis
PS15085--
PS/TiO2 AR = 112.94.382.823 ± 329 ± 4
PS/TiO2 AR = 212.94.382.829 ± 462 ± 10
PS/TiO2 AR = 412.94.382.832 ± 6122 ± 6
Table 3. Average (Avg) and one standard deviation (1σ) of the performance indicators obtained under different environmental and coating conditions.
EnvironmentAir3.5% wt. NaCl3.5% wt. NaCl3.5% wt. NaCl3.5% wt. NaCl3.5% wt. NaCl
CoatingNoneNonePS/TiO2 AR = 1PS/TiO2 AR = 2PS/TiO2 AR = 4PS
P max  (N)Avg2813.62153.22252.82115.02210.32239.8
1σ6.668.4115.944.546.859.0
V max  (mm)Avg0.4050.2320.2800.2290.2560.271
1σ0.0380.0180.0170.0120.0180.020
Δ t  (h)Avg130.247.463.643.355.160.6
1σ7.06.910.01.46.78.2
  a max  (mm)Avg5.665.125.405.145.265.35
1σ0.160.150.160.140.130.10
a e  (mm)Avg1.060.530.750.570.660.74
1σ0.110.080.090.130.100.11
a e / Δ t  (nm/s)Avg2.263.103.323.653.313.38
1σ0.110.330.550.860.350.35
d a e / dt  (nm/s)Avg2.353.493.654.063.593.65
1σ0.080.490.670.980.390.41
Stiffness (kN/mm)Avg9.839.949.9710.7410.369.37
1σ0.441.140.650.820.370.70
J c  (kJ/m2)Avg57.2523.9333.0224.8829.1229.77
1σ3.472.272.762.453.882.25
J Ru  (kJ/m2)Avg94.5432.9747.0133.0940.3544.38
1σ14.823.994.813.565.725.79
K JRu  (MPa·m1/2)Avg82.9149.0058.5349.1054.1856.84
1σ6.393.023.012.693.893.71
Table 4. SCC susceptibility indices—percentage (%) change of a measured parameter from its baseline value.
SCC index (%)
I REF I SCC P max V max Δ t J c K JRu a e
Uncoated, tested in airTested in 3.5% wt. NaClRUncoated−23.5−42.6−63.6−35.4−40.9−50.4
Uncoated, tested in 3.5% wt. NaCl1PS/TiO2 AR14.620.334.317.519.542.2
2PS/TiO2 AR2−1.8−1.3−8.52.00.27.8
3PS/TiO2 AR42.710.116.310.210.624.4
4PS4.016.628.011.616.039.6
Disclaimer/Publisher’s Note: The statements, opinions and data contained in all publications are solely those of the individual author(s) and contributor(s) and not of MDPI and/or the editor(s). MDPI and/or the editor(s) disclaim responsibility for any injury to people or property resulting from any ideas, methods, instructions or products referred to in the content.

