


Polluted Rivers—A Case Study in Porto, Portugal

1
ISEP/P.PORTO, School of Engineering, Polytechnic of Porto, Rua Dr. António Bernardino de Almeida 431, 4249-015 Porto, Portugal
2
CIETI, School of Engineering, Polytechnic of Porto, Rua Dr. António Bernardino de Almeida 431, 4249-015 Porto, Portugal
3
ALiCE—Associate Laboratory in Chemical Engineering, Faculty of Engineering, University of Porto, Rua Dr. Roberto Frias, 4200-465 Porto, Portugal
4
LEPABE—Laboratory for Process Engineering, Environment, Biotechnology and Energy, Faculty of Engineering, University of Porto, Rua Dr. Roberto Frias, 4200-465 Porto, Portugal
5
REQUIMTE/LAQV, School of Engineering, Polytechnic of Porto, Rua Dr. António Bernardino de Almeida 431, 4249-015 Porto, Portugal
*
Author to whom correspondence should be addressed.
Ecologies 2024, 5(2), 188-197; https://doi.org/10.3390/ecologies5020012
Submission received: 22 February 2024
/
Revised: 30 March 2024
/
Accepted: 5 April 2024
/
Published: 6 April 2024
(This article belongs to the Topic Marine Ecology, Environmental Stress and Management)
Abstract
:River contamination by microorganisms, or another chemical source, poses a serious threat to both the environment and public health. Taking immediate and appropriate actions is essential to mitigate the contamination and prevent further spread. As such, regular monitoring of these pollution agents is essential to act in time and control its minor extension. However, there is a lack of commitment to this emergent concern and respective actions around the world. This work aims to study the contamination of a Portuguese river (Tinto River) within Porto city (a highly populated urban area) regarding the total aerobic microorganisms, coliforms, and Enterococcus (as colony-forming units (CFUs) using specific solid culture media) and total organic matter (TOC). Different locations were considered along the Tinto River course (i.e., 14 locations within 11 km) and samples were collected on distinct days throughout September 2022. The overall results showed microbial contamination of aerobic microorganisms (up to 2 × 10⁵ CFU/100 mL), total coliforms (up to 7 × 10⁴ CFU/100 mL), Escherichia coli (up to 9 × 10³ CFU/100 mL), and Enterococcus (up to 8 × 10³ CFU/100 mL). The results also surpassed the maximum recommended values (MRVs) described in Portuguese decree-law no. 236/98 for irrigation waters. Moreover, TOC was found in a range of 4.54 mg/L to 57.2 mg/L. This work highlights the dangerous microbial contamination and higher amount of organic matter than would be expected for a surface water resource.
1. Introduction
Over the years, water contamination has emerged as a growing concern due to the presence of pollutants such as chemicals, heavy metals, microorganisms, and nutrients in several water bodies (e.g., lakes, rivers, streams, and groundwater) [1]. However, maintaining water quality is essential to ensure the safety of water resources for human and ecosystem use, particularly in rivers, which serve as an important source of water [1]. Moreover, poor water quality can also lead to waterborne diseases, such as cholera, typhoid, and dysentery, which can have a significant impact on human health, particularly for vulnerable populations [2]. This river pollution can be caused by natural processes, such as erosion or sedimentation; however, with this harshness, it is mainly the result of human activities, such as agriculture, industry, and domestic wastewater disposal [3]. These serious threats from human activities have an impact on common sources, including the use of pesticides, fertilizers, and other pollutants that enter water bodies through runoff, or industrial and domestic discharge into water bodies [4]. Nevertheless, these activities can also promote the presence and growth of unwanted microorganisms, causing additional contamination of rivers [5]. Microbial contamination of water can occur due to the presence of pathogenic microorganisms, including bacteria, viruses, and protozoa [1,5]. On one hand, to reduce the risk of the microbial contamination of rivers, it is important to properly treat and dispose of sewage and other wastewater, as well as to implement measures to prevent agricultural and industrial runoff from contaminating water sources. On the other hand, water quality monitoring and control helps to protect the environment by identifying pollution sources and tracking changes in river quality over time and in specific regions [6,7]. Additionally, regular testing and monitoring can be used to inform management decisions aimed at protecting water resources [8]. Also, high river water quality is often required by regulatory agencies to ensure that industries, municipalities, and other entities are complying with environmental regulations. As such, monitoring data can be used to enforce regulations, identify areas of non-compliance, and take corrective action as needed [9].
In Portugal, as a developed country, water contamination is a concern, particularly in rivers. The Portuguese government, with European funding, has taken steps to address water contamination, including the implementation of regulations that reduce the pollution from industrial and agricultural activities, and investment in wastewater treatment infrastructure. However, more work is needed to ensure that Portugal’s rivers are clean and safe for human health and ecosystems [10].
This work explores the findings of a case study carried out on Tinto River, analyzing the root of possible microbial contamination from the upstream to the downstream region. The hydrographic sub-basin of the Tinto River, a right-bank tributary of the Douro River, with an approximate area of 23 km2, belongs entirely to the Porto District. It falls within the region of the Porto Metropolitan Area, spanning across the municipalities of Valongo (river source), Maia, Gondomar, and Porto (river mouth) [11]. Moreover, in 2019, the release of effluents from two wastewater treatment plants into the Tinto River was stopped. Therefore, this river comes into contact with densely populated areas, industrial processes, and wastewater treatment facilities within Porto city, being a relevant scenario for analyzing contamination profiles.
2. Materials and Methods
2.1. Study Area of Tinto River and Affluents
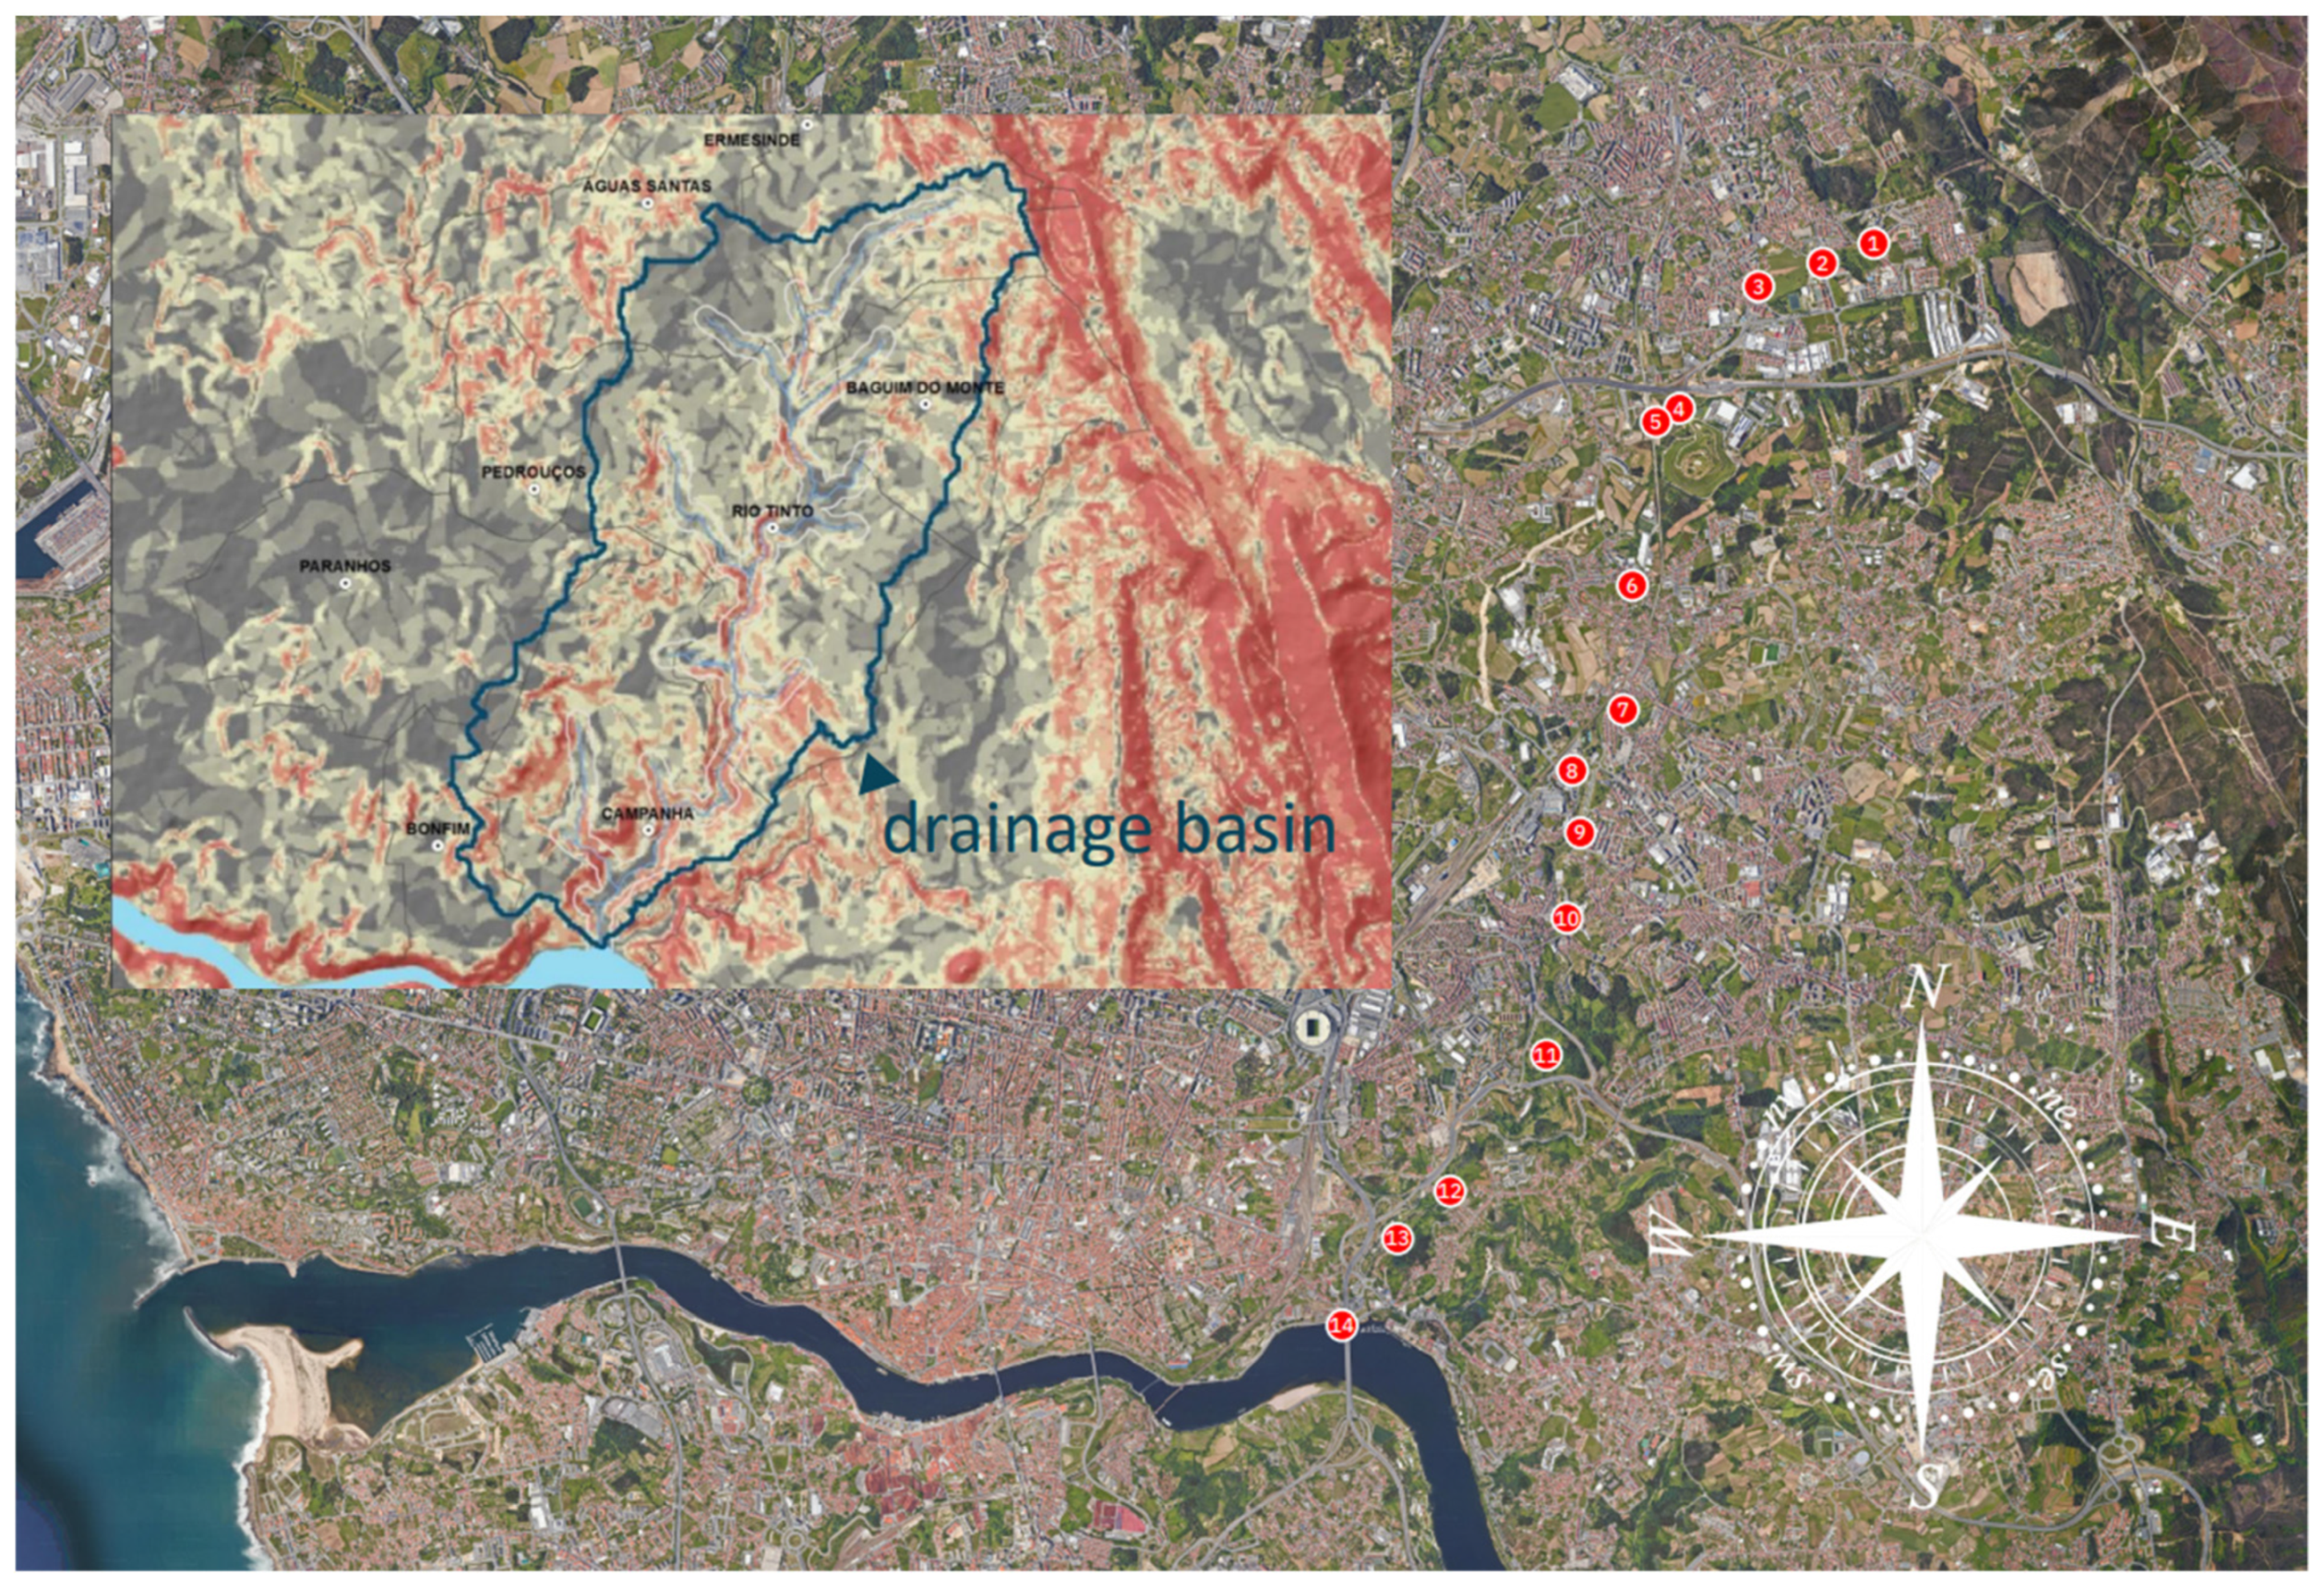
The samples were collected (at least two samples in duplicate) around 8:00 and 10:00 AM (UCT + 1) on certain days throughout September 2022, using sterile flasks as described in Standard Methods [12]. Different points were selected to represent the entire length of Tinto River, with the respective drainage basin [13], and two of its creeks (14 locations within 11 km), as presented in Table 1 and Figure 1. The selection of these specific points is elucidated in Appendix A. The September range temperature was 15–25 °C with an average precipitation of 66 mm (data from the Climate Change Knowledge Portal, 2023 [14]).
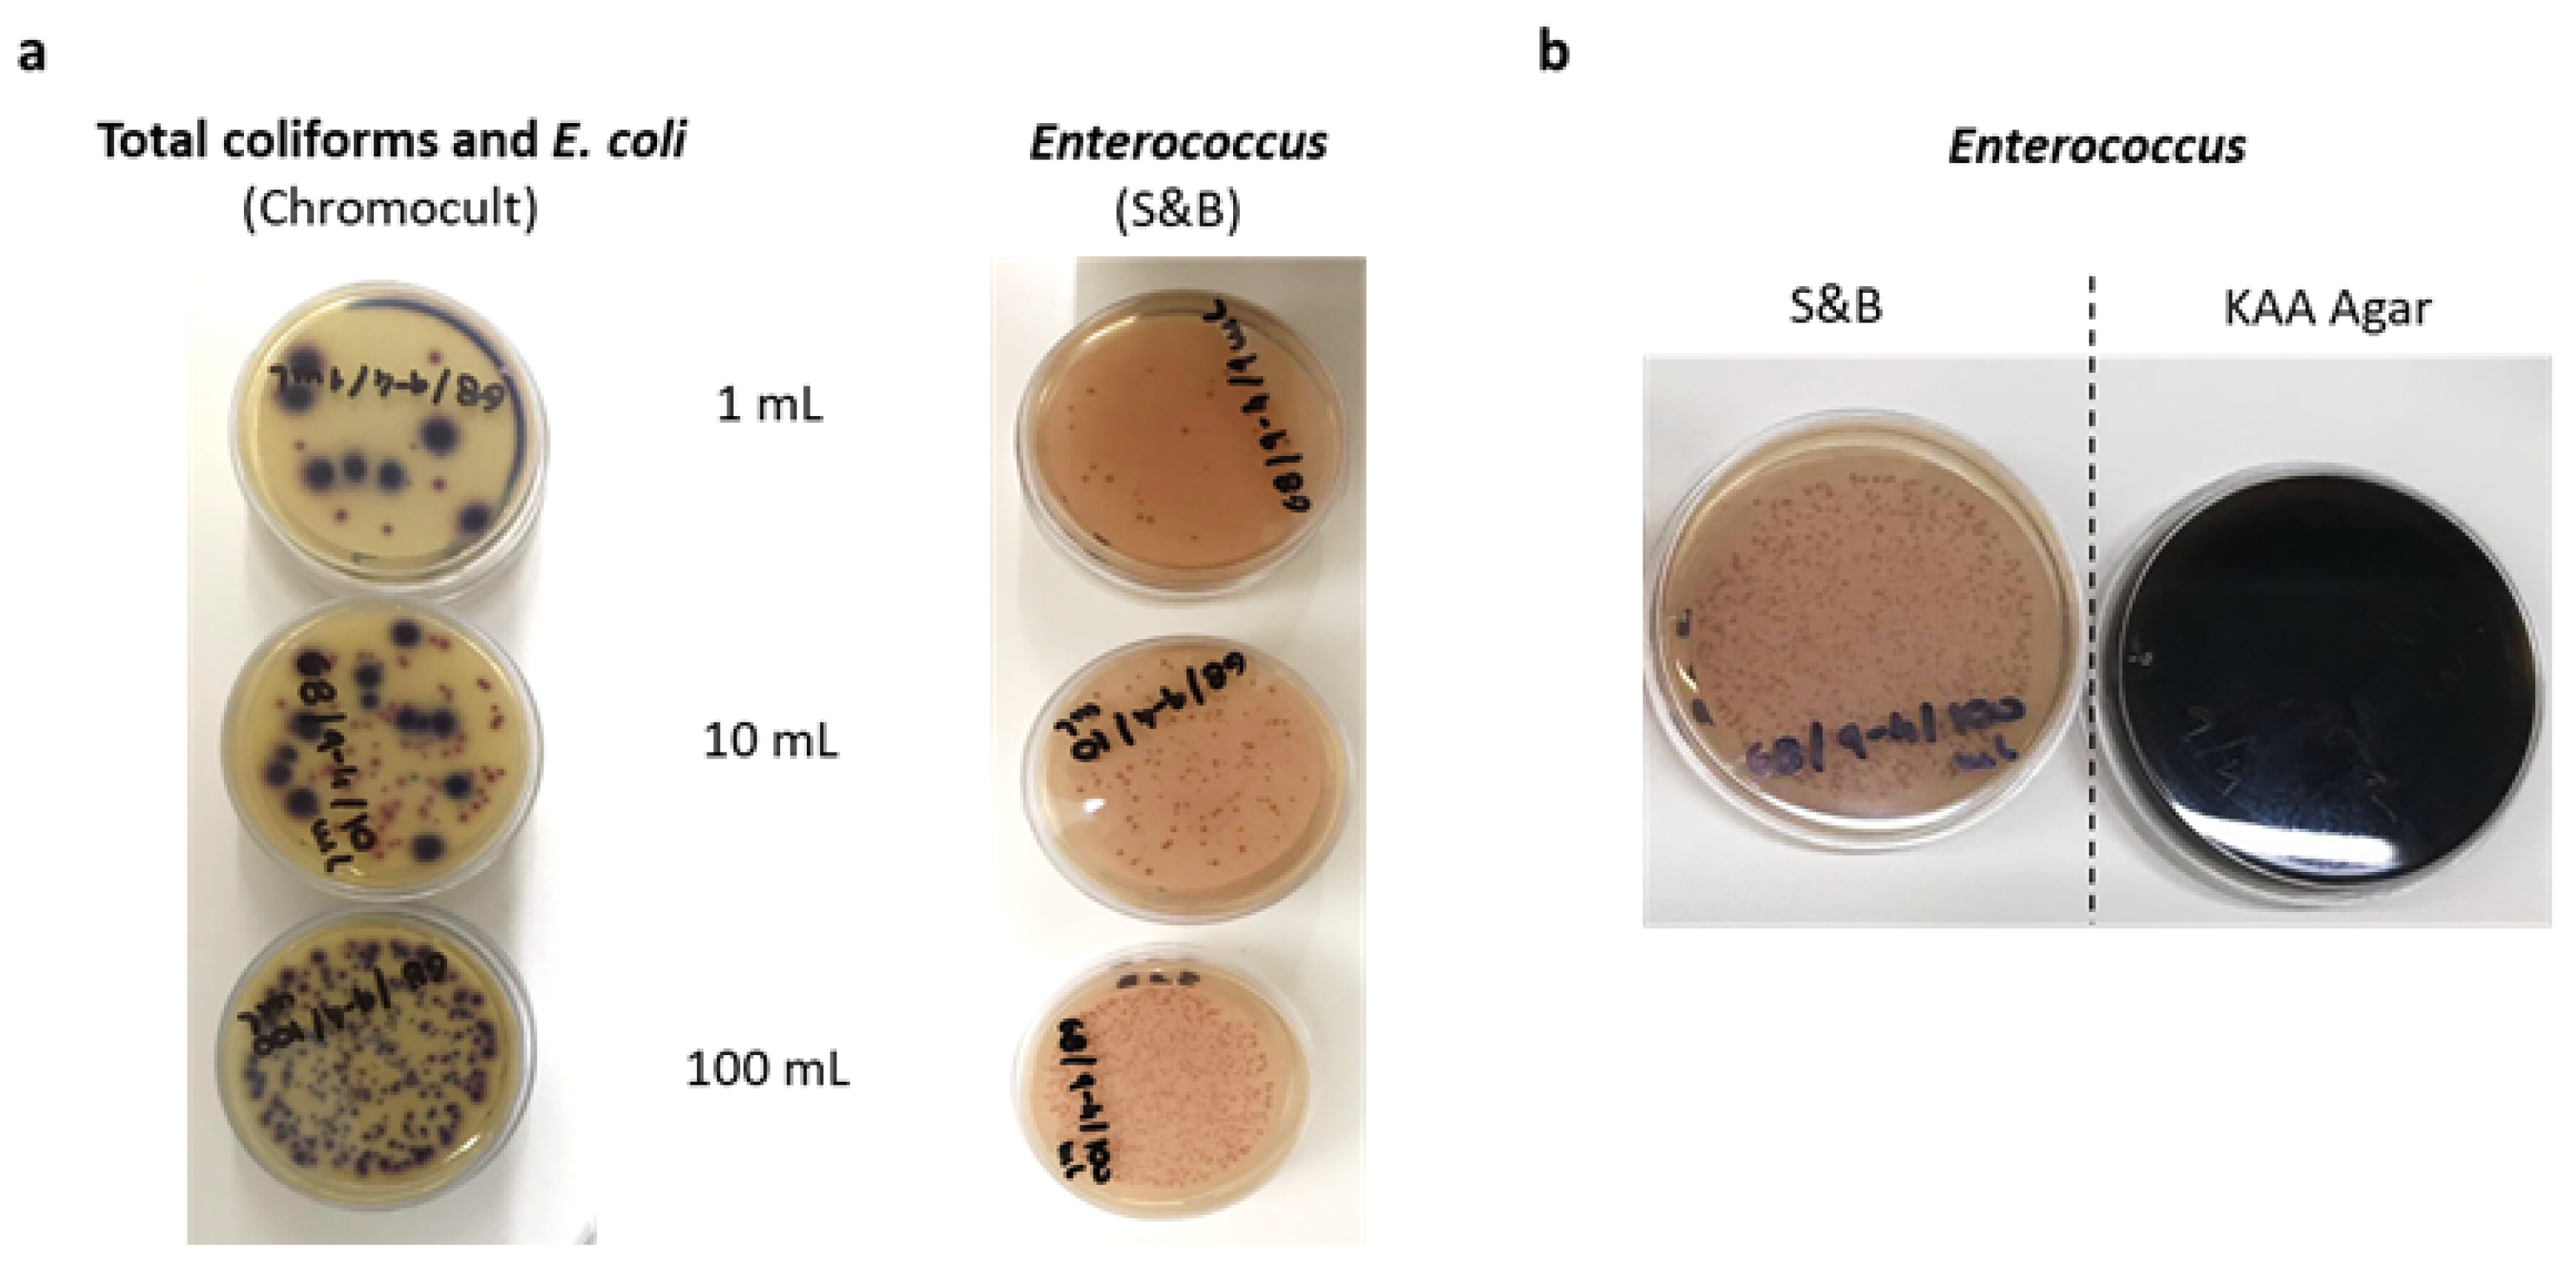
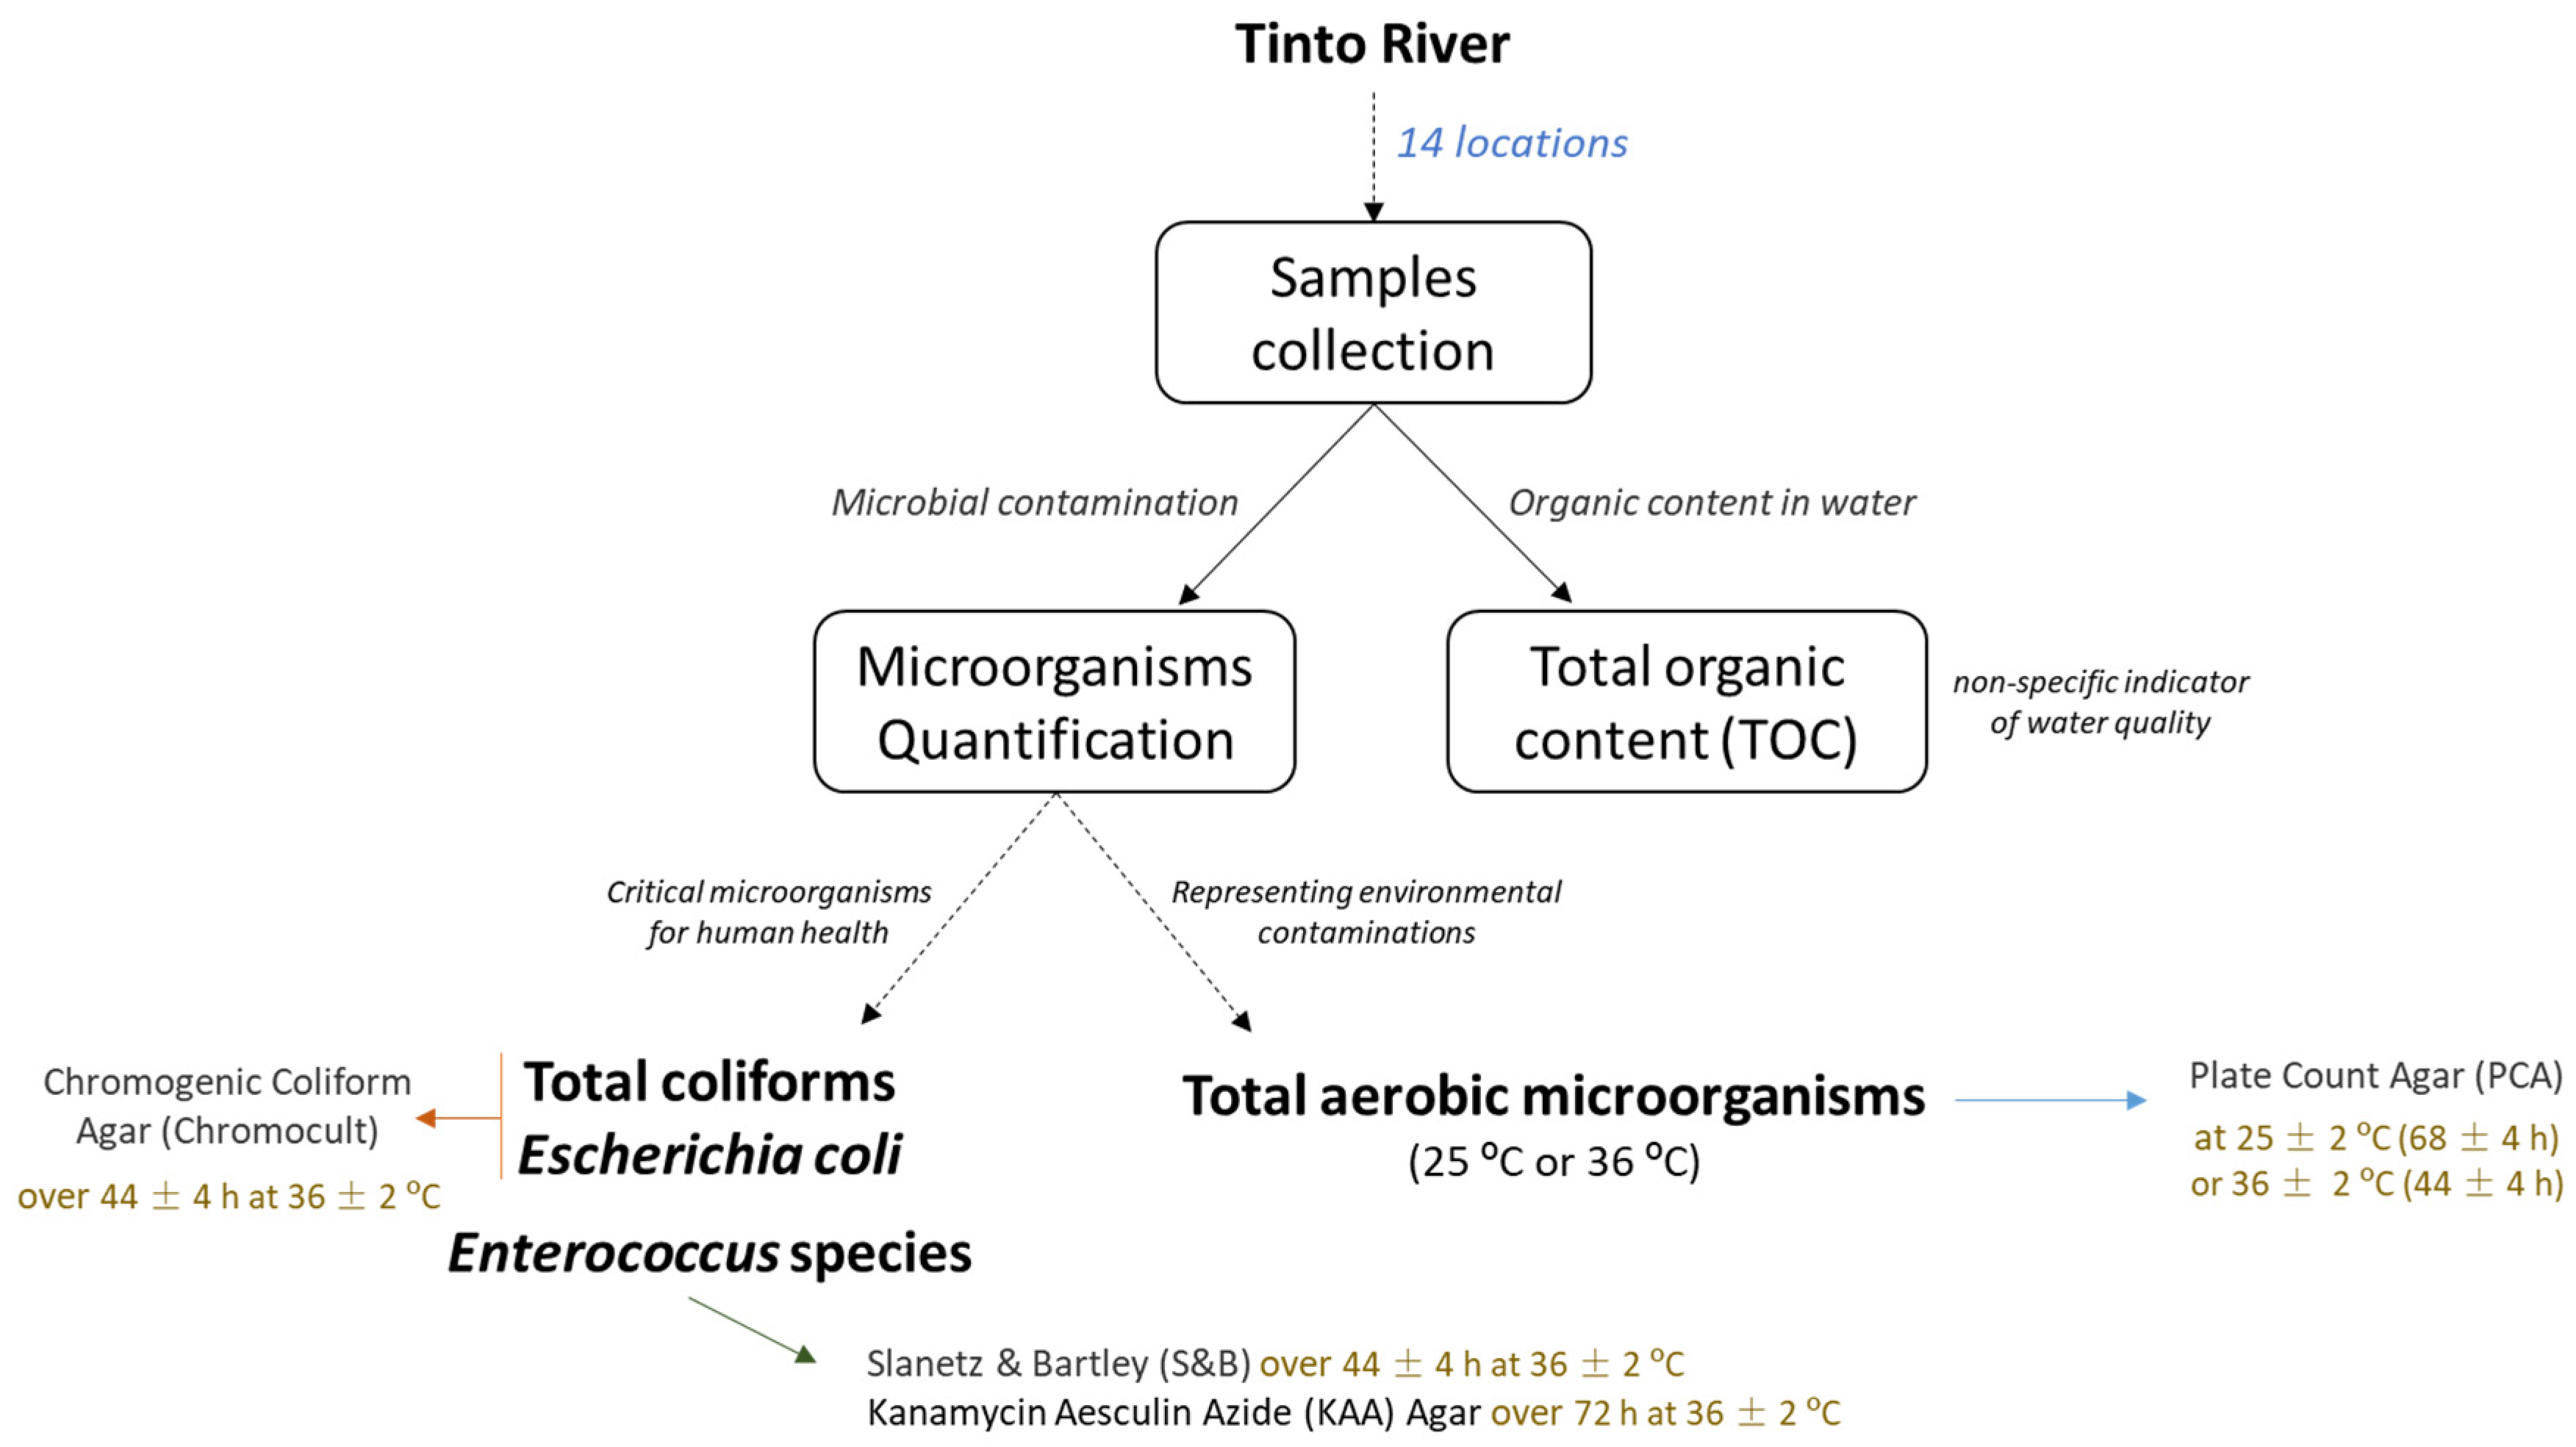
The critical and specific microorganisms that can have an impact on human health selected to study in this work were total coliforms (fecal and atypical), Escherichia coli (fecal coliforms), and Enterococcus species (Figure A1). For total coliforms and E. coli, the solid culture medium Chromogenic Coliform Agar (Chromocult) was used and the incubation was over 44 ± 4 h at 36 ± 2 °C (Figure 2) [12]. In the case of the Enterococcus species, Slanetz & Bartley (S&B) solid culture medium was used to quantify the CFU (Figure 2a,b), incubated over 44 ± 4 h at 36 ± 2 °C; and Kanamycin Aesculin Azide (KAA) Agar was used to confirm their presence (as a confirmation test), incubated over 72 h at 36 ± 2 °C (Figure 2b) [12]. On the other hand, the total aerobic microorganisms, representing environmental contamination, were evaluated using Plate Count Agar (PCA) incubated at 25 ± 2 °C (68 ± 4 h) or 36 ± 2 °C (44 ± 4 h) [12].
The procedure used for microorganism quantification was the standard plate count, under sterile conditions, which estimates the number of viable bacteria (known as colonies), considering the term colony-forming units (CFUs) [12]. Then, the membrane filter method was selected and completed as described in Standard Methods [12]. For this method, different volumes were previously tested (1, 10, or 100 mL) to study the appropriate dilution of each sample, suitable for the count of CFUs.
2.2. Total Organic Carbon (TOC) Determination
The total organic carbon (TOC) was quantified in samples (Figure A1) after filtration using a SHIMADZU TOC-V CSN (Shimadzu Corporation, Kyoto, Japan) with a high-temperature combustion method, as described in Standard Methods [12]. The detection of contaminants in water bodies is significantly reliant on TOC. Assessing organic molecule levels in water holds immense importance due to their potential environmental, human health, and manufacturing process implications [12]. Samples were measured and diluted when necessary.
2.3. Reproducibility of the Results and Statistical Analysis
All studies were repeated, independently, at least two times with duplicates (n ≥ 4). Statistical analysis was performed by one-way ANOVA, followed by the Tukey–Kramer multiple comparison method. p values < 0.05 were considered statistically significant.
3. Results and Discussion
A Case Study of the Tinto River
Water quality monitoring is crucial for safeguarding public health, preserving the environment, and fostering economic development [9]. Moreover, in cases where pollution is a known issue, the restoration of water bodies becomes imperative to restore the natural flow of aquatic ecosystems [15]. As such, a regular analysis of river water quality regarding microbial contamination is extremely important and crucial in maintaining vigorous ecosystems. Among these parameters, specific microbial presence and organic matter can indicate water contamination.
In this study, Tinto River was evaluated in terms of water contamination by microorganisms, from upstream to downstream. Tinto River is a relevant water body since it is located in the Douro Hydrographic Region (RH3) within Porto city, integrating the typology of “Small Rivers of the North” [11]. As such, several location points were selected to represent a full extension of the river, considering possible contamination entrances and samples collected on different days (Table 1 and Figure 1). Then, the total aerobic microorganisms, total coliforms, E. coli, and Enterococcus were quantified using the standard plate count method, accounting for the CFUs in each plate with specific solid culture media. For instance, Figure 2 illustrates the plates obtained after incubation at specific conditions. In Chromocult (Figure 2a—left panel), CFUs with a salmon-red color represent the total coliforms, since they can hydrolyze the substratum Salmon™-β-D-GAL (responsible for the CFU color) in the solid culture medium [16]. On the other hand, CFUs with a violet color represent the E. coli CFU, since E. coli can hydrolyze both substrata Salmon™-β-D-GAL and X-β-D-glucuronide (responsible for the CFU blue color), presenting a mixed color of violet (Figure 2a—left panel) [16]. In S&B (Figure 2a—right panel and b), Enterococcus species can hydrolyze the substratum triphenyl tetrazolium chloride (TTC), responsible for the pink color on CFUs [17]. In KAA Agar (Figure 2b), a selective medium for Enterococcus due to kanamycin and azide, aesculin and iron (as ferric citrate) are the substrata responsible for the black color in the medium, since bacteria hydrolyzed aesculin to aesculetin and in the presence of iron, a black precipitate is formed [18]. The results regarding the microorganisms’ evaluation in CFUs are presented in Figure 3. Overall, after analyzing the results, it is possible to see that all the samples had aerobic microorganisms at 25 °C (representative of environmental contamination) and 36 °C (representative of warm-blooded animals’ contamination), with magnitudes ranging from 3 × 10² CFU/100 mL (Sample D1) to 2 × 10⁵ CFU/100 mL (Samples E15 and E16), respectively (Figure 3). Moreover, in general, the similarity between the counts of total aerobic microorganisms at 36 °C and those at 25 °C suggests a predominance of microorganisms originating from warm-blooded animal contamination.
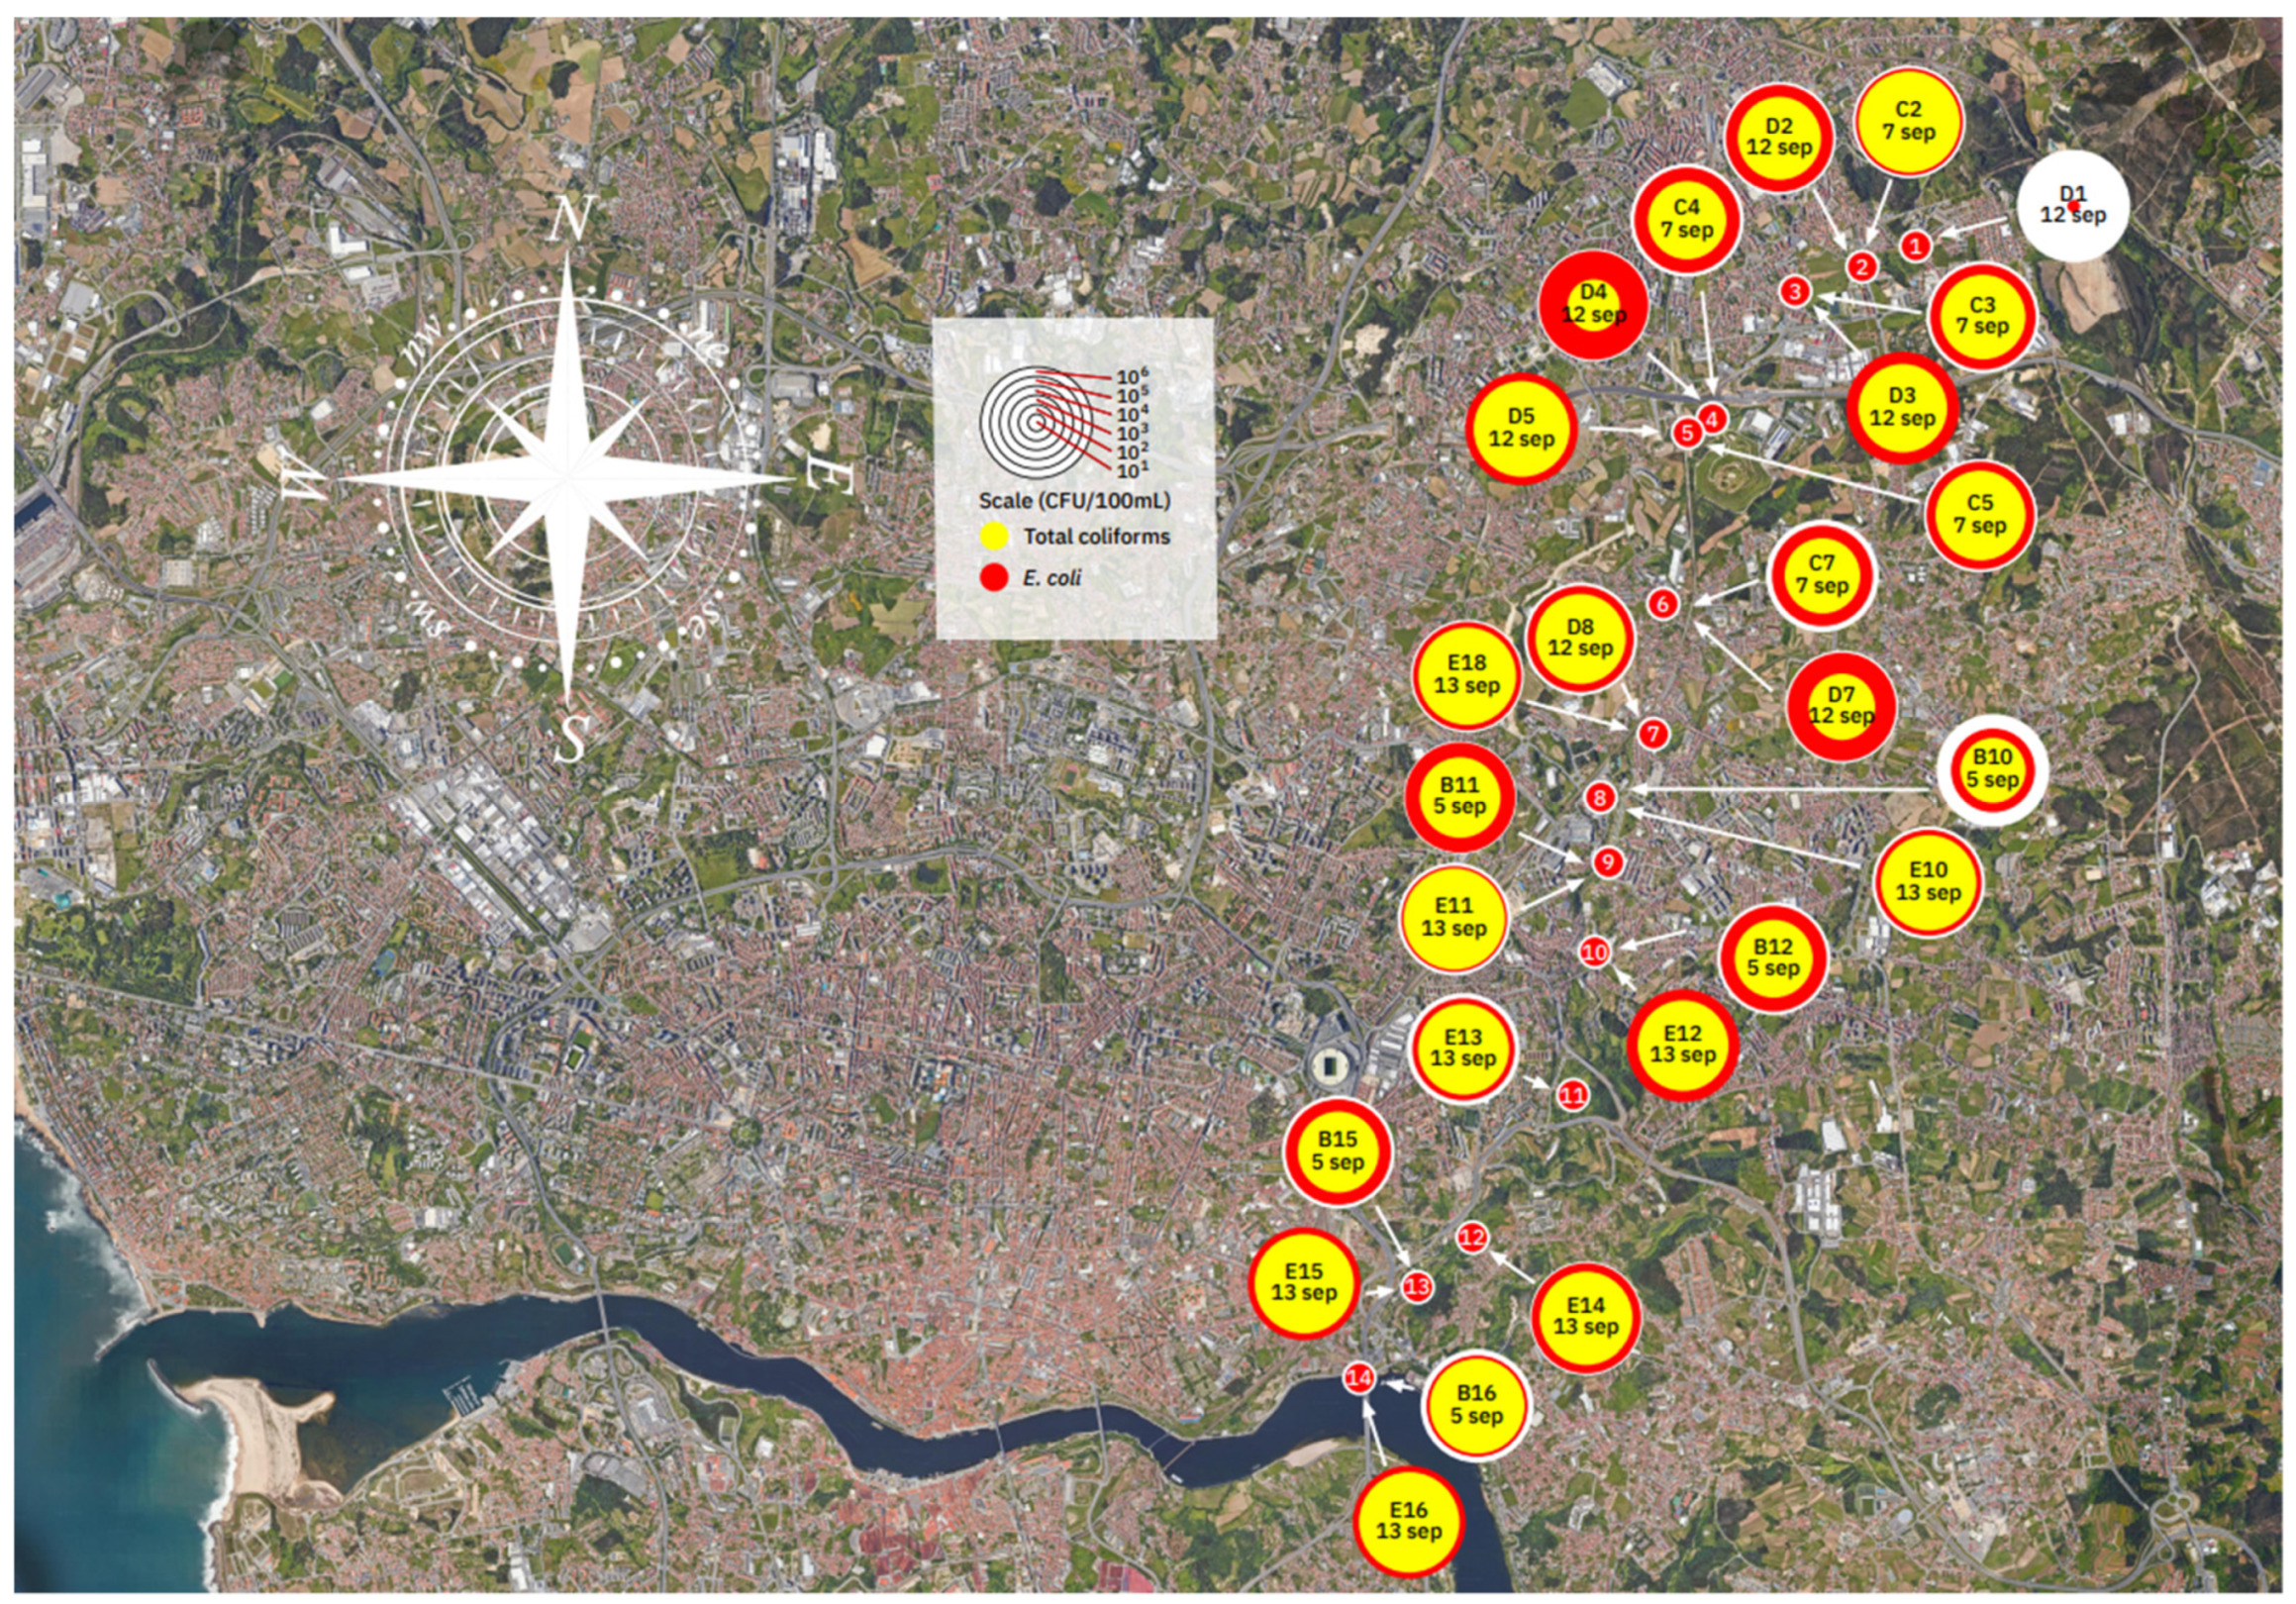
On the other hand, regarding the total coliforms, all the samples had these microorganisms, although at different orders of magnitude (Figure 3). The obtained magnitudes ranged from 4 CFU/100 mL to 7 × 10⁴ CFU/100 mL. On the other hand, E. coli was not detected in Sample D5, and Samples D5 and E14 led with ≈9 × 10³ CFU/100 mL (Figure 3). Overall, comparing the results of total coliforms and E. coli, it is possible to conclude that E. coli is the main bacterium among total coliforms in the analyzed samples. To properly understand the distribution of total coliforms and E. coli along the Tinto River course, Figure 4 shows a relative scale based on the decimal logarithm of CFU/100 mL, through which it is possible to compare the proportions of both of these microorganisms among the chosen points of the Tinto River. In several studies on river pollution, to the author’s knowledge, the main microorganisms analyzed to understand contamination patterns include total coliforms and E. coli [19,20,21]. Similarly, in various countries, rivers also linked to urban areas had exhibited total coliform levels (CFU/100 mL) within a range of 3.95 × 10²–5.15 × 10⁴ in Ecuador [19], 4.60 × 10²–2.40 × 10⁴ in Brazil [22], 3.80 × 10²–1.18 × 10⁴ in Poland [20] and 105–109 in Mozambique [21], among others. On the other side, E. coli levels (CFU/100 mL) were reported in ranges of 1.17 × 10²–9.18 × 10⁴ in Ecuador [19], 4.20 × 10²–2.40 × 10⁴ in Brazil [22], 2.20 × 10³–3.08 × 10⁷ in Mexico [23], 1.58 × 10²–2.98 × 10⁴ in Poland [20] and 105–107 in Mozambique [21], among others.
Regarding the Enterococcus species (Figure 3), Samples A1 and D1 did not display these microorganisms, while Sample C5 presented the maximum value obtained (≈8 × 10³ CFU/100 mL). In Portugal, the decree-law no. 236/98, 1 August, establishes criteria and objectives regarding water quality and protection [24]. Moreover, it is attributed to a classification of treatments to be performed considering the maximum recommended values (MRVs) for surface waters intended for water for human consumption [24]. For instance, considering several parameters (including the studied microorganisms), the treatments can be divided into the following categories: (i) A1—physical and disinfection; (ii) A2—physicochemical and disinfection; and (iii) A3—physical, chemical tuning and disinfection. Considering the presented results (Figure 3), the samples fit in class A3 and three of them (D5, E15, and E16) surpassed the MRVs considered in this class for the total coliforms. Considering the fecal coliforms, the samples also fit in class A3 and E11 surpassed the MRV. On the contrary, for Enterococcus, the samples fit the A2 class (12 of 28 samples) and A3 class (14 of 28 samples). Taking into account the water criteria for irrigation, the MRV for total coliforms was 100 CFU/mL. Overall, for the conditions under which the Tinto River was found on the days of sampling, based only on this parameter, the water was not even recommended for agricultural practice.
On the other side, TOC is a parameter that allows us to estimate the amount of organic content in water and is a non-specific indicator of water quality [25]. The results obtained for TOC are presented in Figure 3. It is possible to observe that Sample B2 was the sample with a lower content of TOC (4.5 ± 1.2 mg/L), contrary to Sample D4 with a higher content of TOC (57.2 ± 4.1 mg/L). TOC in water sources may be used to define the water quality and can range from <0.1 to 25 mg/L in drinking water to >300 mg/L in wastewater [12]. Among all the analyzed samples, four locations had a TOC above 25 mg/L (“Presas de Sá”—location 3, “Lipor Watermill”—location 4, “Granja Creek”—location 5 and “Lourinha”—location 7). As such, considering only this parameter, Tinto River water in different locations can only be used for irrigation. Compared with other studies in several rivers that only quantified the chemical oxygen demand (COD, mg O2/L), a small part of the total organic content, the organic matter in Tinto River was notably lower in comparison to various countries. In fact, the values were approximately as high as 6.92 × 10² in Ecuador [19], 9.32 × 10³ in Brazil [22], 1.84 × 10³ in Mexico [23] or over 75 in Mozambique [21].
Considering the selected locations and the global results obtained (Figure 3), it is not possible to pinpoint a specific contamination profile along the Tinto River. However, a significant contamination disparity is evident between the Tinto River source and the other studied locations. In fact, the contamination levels are notably higher compared to the source (p < 0.05). Additionally, one location yielded an intriguing result. Location 5 (“Granja Creek”) exhibited high levels of E. coli (p < 0.05) and as previously mentioned, occasional visual inspections suggest that this stream is contaminated with domestic sewage.
The overall results obtained in this work highlight critical microbial contamination and a higher amount of organic matter than would be expected for a surface water resource. These results expose possible locations of industrial discharges or non-authorized discharges. Moreover, considering the findings of the current study, microbial contamination was similar when compared with other rivers around the world, as described above. On the contrary, the organic levels found in this work were lower in comparison with other rivers around the world, as described above. This may be due to the smaller urban population area within the Tinto River when compared with the other larger river locations within higher population areas [26]. Nevertheless, it is also important to reinforce that these results were found through samples collected in a shorter period of time, which cannot define a pattern. As such, regular analysis of the Tinto River (from upstream to downstream) with more replicates and on different days is recommended, considering the weather conditions and seasons. Also, further studies are required to reveal how to reduce the risk of river contamination in the several locations studied in this work. This approach will shed on light a suitable recovery process and/or contamination control that will allow the Tinto River to become clean again.
4. Conclusions
In 2019, a project to stop the release of effluents from two wastewater treatment plants into the Tinto River was finalized. This was a major step towards restoring the ecological status of the river. However, this study shows that it is still a long road ahead for that to happen. In fact, through the analysis of different locations along the Tinto River course, it was possible to observe microbial contamination (namely total coliforms, E. coli, and Enterococcus). Also, specific locations showed higher levels of contamination and organic matter, which can reveal possible points of industrial discharges or non-authorized discharges. Understanding the impact of these contaminations may help in developing conservation programs and policies to prevent the disturbance of the Tinto River. However, it can be a challenging and a complex process that requires a multi-faceted approach, since it is necessary to (i) identify the pollution source; (ii) reduce pollution, which can be achieved by implementing new processes, upgrading existing infrastructure, or implementing best management practices for agriculture and industries; (iii) remove the known pollutants, using for instance sedimentation or bioremediation; (iv) restore natural habitats, planting native vegetation, restoring wetlands, and/or creating fish habitats; and (v) monitor and maintain the quality of the water through ongoing river water quality monitoring, and continued efforts to reduce pollution. Overall, restoring rivers in urban environments is a complex task that requires a profound change from policymakers. Nevertheless, conservation of water resources and ecosystems is imperative to maintain a healthy balance in the environment, starting with river pollution concerns and their control.
Author Contributions
All authors contributed to the study’s conception and design. Material preparation and data collection were performed by P.L. Data analysis was performed by C.A.S., P.S. and A.J.D. The manuscript was written and edited by C.A.S. Also, P.S., C.A.S. and A.J.D. commented on the manuscript. All authors have read and agreed to the published version of the manuscript.
Funding
This work was supported by multi-year funding provided by the European Union (FEDER funds through Compete) and National Funds (FCT/MCTES) through Project UID/QUI/50006/2019 and UIDB/04730/2020. Patricia Lemos gratefully acknowledges the funding provided through the Research Initiation Grant (BII) obtained from National Funds (FCT/MCTES) CIETI_BII_VcC_2022.
Institutional Review Board Statement
Not applicable.
Informed Consent Statement
Not applicable.
Data Availability Statement
Data are contained within the article.
Conflicts of Interest
The authors have no relevant financial or non-financial interests to disclose.
Appendix A
Sampling Point Description and Methodology Flow Chart
Location 1—“River Source”, the place where the river water reaches the surface. At this location, the water is tapped and most of it is led to a public washing tank. After passing through the tank, the water is directed to the sewage line. Only a part of the freshwater is led to a natural riverbed. The underground part of the river is located on urbanized land. Diffuse pollution can lead to microbiological contamination of the river.
Location 2—“Prio Gas Station”. Before reaching this sampling point, the narrow riverbed passes in between houses and through an area with some vegetation. The sampling point is next to a gas station. In this location, the river flow is very low and, consequently, diffuse pollution or problems in the sewerage network could result in microbial contamination.
Location 3—“Presas de Sá”. To reach this place, the river runs through a kiwi farm and passes under two roads.
Location 4—“Lipor Watermill”. This sampling point is located on the Tinto River before receiving the waters of the Granja Creek, coming from the Maia municipality. The river once again passes under a road and a motorway.
Location 5—“Granja Creek”, just before the confluence with the Tinto River. It is sometimes possible to verify, by simple visual inspection, that this stream is contaminated with domestic sewage.
Location 6—“Caneiro”, the beginning of the area of Rio Tinto city with the highest population density. Between locations 5 and 6, the Tinto River passes by a solid waste landfill, which is sealed, through a wooded area, an agricultural area, and a small industrial area. Several small creeks join the Tinto River before this sampling point.
Location 7—“Lourinha”, the beginning of Tinto River tubing. This site is in the center of Rio Tinto city, near the cemetery and the main church of Rio Tinto city.
Location 8—“Castanheira Creek”, which is the most important tributary of the Tinto River. The water was collected in the dam that exists in the Rio Tinto Urban City Park. The waters of this stream generally have a crystalline appearance. The dam has ducks. Castanheira Creek passes through urban and agricultural land.
Location 9—“Vitória Watermill”. The samples were collected before the Vitória Watermill weir. The river flows freely. In this place, the waters from Castanheira Creek and Tinto River are already mixed.
Location 10—“Baixa da Ponte”. The sampling point is located next to a small industrial area.
Location 11—“Pego Negro”, a small location in Campanhã in Porto city. Before this site, the river passes through the neighborhood of the Rio Tinto city wastewater treatment plants, which does not discharge its treated effluent into the Tinto River. This is the entry point to the Porto Oriental Park.
Location 12—“Azevedo de Campanhã”, the site after the Porto Oriental Park central area.
Location 13—“Freixo”. This place is located in Porto Oriental Park, before the Freixo wastewater treatment plants. Its discharge point is also in the Douro River estuary. The park surroundings are urbanized.
Location 14—“Mouth of the Tinto River”, where the water collected is a mixture of the water from the Tinto River and the water from the Douro River estuary.
Figure A1.
Flow chart representing the methodology used in this work.

References
- UNEP. Freshwater Strategy 2017–2021; The United Nations Environment Programme: Nairobi, Kenya, 2017. [Google Scholar]
- NIEHS. Water-Related Illnesses. Available online: https://www.niehs.nih.gov/research/programs/climatechange/health_impacts/waterborne_diseases/index.cfm (accessed on 25 April 2023).
- Akhtar, N.; Ishak, M.I.S.; Bhawani, S.A.; Umar, K. Various natural and anthropogenic factors responsible for water quality degradation: A review. Water 2021, 13, 2660. [Google Scholar] [CrossRef]
- Burri, N.M.; Weatherl, R.; Moeck, C.; Schirmer, M. A review of threats to groundwater quality in the anthropocene. Sci. Total Environ. 2019, 684, 136–154. [Google Scholar] [CrossRef] [PubMed]
- Ahmed, W.; Hamilton, K.; Toze, S.; Cook, S.; Page, D. A review on microbial contaminants in stormwater runoff and outfalls: Potential health risks and mitigation strategies. Sci. Total Environ. 2019, 692, 1304–1321. [Google Scholar] [CrossRef] [PubMed]
- Pharaoh, E.; Diamond, M.; Ormerod, S.J.; Rutt, G.; Vaughan, I.P. Evidence of biological recovery from gross pollution in English and Welsh rivers over three decades. Sci. Total Environ. 2023, 878, 163107. [Google Scholar] [CrossRef] [PubMed]
- Amoatey, P.; Baawain, M.S. Effects of pollution on freshwater aquatic organisms. Water Environ. Res. 2019, 91, 1272–1287. [Google Scholar] [CrossRef] [PubMed]
- Longe, E.O.; Omole, D.O. Analysis of pollution status of River Illo, Ota, Nigeria. Environmentalist 2008, 28, 451–457. [Google Scholar] [CrossRef]
- EPA. An Introduction to Water Quality Monitoring. Available online: https://archive.epa.gov/water/archive/web/html/monintr.html (accessed on 21 May 2023).
- OECD. Portugal’s National Recovery and Resilience Plan. 2022. Available online: https://commission.europa.eu/business-economy-euro/economic-recovery/recovery-and-resilience-facility/country-pages/portugals-recovery-and-resilience-plan_en (accessed on 10 April 2023).
- Lipor. Rio Tinto Recovery Project. 2015. Available online: https://www.lipor.pt/en/innovate/financed-projects/river-tinto-restoration-project/ (accessed on 20 May 2023).
- Rice, E.W.; Baird, R.B.; Eaton, A.D. Standard Methods for the Examination of Water and Wastewater, 23rd ed.; American Public Health Association: Washington, DC, USA; American Water Works Association: Denver, CO, USA; Water Environment Federation: Alexandria, VA, USA, 2017. [Google Scholar]
- Fernandes, D.T. A Paisagem Ribeirinha em Contexto Urbano—Um Modelo de Planeamento e Gobernação para a Bacia Hidrográfica do Rio Tinto. Ph.D. Thesis, Faculdade de Ciências da Universidade do Porto, Porto, Portugal, 2020. [Google Scholar]
- Climate Change Knowledge Portal. Available online: https://climateknowledgeportal.worldbank.org/country/portugal/climate-data-historical (accessed on 23 October 2023).
- Li, P.; Li, D.; Sun, X.; Chu, Z.; Xia, T.; Zheng, B. Application of ecological restoration technologies for the improvement of biodiversity and ecosystem in the river. Water 2022, 14, 1402. [Google Scholar] [CrossRef]
- Merck. Chromocult® Coliform Agar. 1995. Available online: https://www.merckmillipore.com/PT/en/product/Chromocult-Coliform-Agar,MM_NF-C164546?ReferrerURL=https%3A%2F%2Fwww.google.com%2F (accessed on 25 April 2023).
- Slanetz, L.W.; Bartley, C.H. Number of enterococci in water, sewage, and feces determined by the membrane filter technique with an improved medium. J. Bacteriol. 1957, 74, 591–595. [Google Scholar] [CrossRef]
- ThermoFisher. Dehydrated Culture Media—Kanamycin Aesculin Azide Agar Base; ThermoFisher Inc.: Waltham, MA, USA, 1998. [Google Scholar]
- Borja-Serrano, P.; Ochoa-Herrera, V.; Maurice, L.; Morales, G.; Quilumbaqui, C.; Tejera, E.; Machado, A. Determination of the microbial and chemical loads in rivers from the Quito capital province of Ecuador (Pichincha)—A preliminary analysis of microbial and chemical quality of the main rivers. Int. J. Environ. Res. Public Health 2020, 17, 5048. [Google Scholar] [CrossRef] [PubMed]
- Lenart-Boroń, A.; Wolanin, A.; Jelonkiewicz, E.; Żelazny, M. The effect of anthropogenic pressure shown by microbiological and chemical water quality indicators on the main rivers of Podhale, southern Poland. Environ. Sci. Pollut. Res. 2017, 24, 12938–12948. [Google Scholar] [CrossRef]
- Nhantumbo, C.; Cangi Vaz, N.; Rodrigues, M.; Manuel, C.; Rapulua, S.; Langa, J.; Nhantumbo, H.; Joaquim, D.; Dosse, M.; Sumbana, J.; et al. Assessment of Microbial Contamination in the Infulene River Basin, Mozambique. Water 2023, 15, 219. [Google Scholar] [CrossRef]
- Carvalho, C.D.F.; Stapelfeldt, F. Qualidade das águas do ribeirão Ubá-MG. Rev. Esc. Minas 2004, 57, 165–172. [Google Scholar] [CrossRef]
- Sandoval Villasana, A.M.; Pulido-Flores, G.; Monks, S.; Gordillo Martinez, A.J.; Villegas Villareal, E.C. Physicochemical, microbiological and toxicological evaluation of the environmental degradation of the Atoyac river, Mexico. Interciencia 2009, 37, 880–887. [Google Scholar]
- Decreto-Lei No. 236/98, Diário da República No. 176/1998, 1998. Available online: https://dre.pt/application/conteudo/430457 (accessed on 20 October 2022).
- Shetty, A.; Goyal, A. Total organic carbon analysis in water—A review of current methods. Mater. Today Proc. 2022, 65, 3881–3886. [Google Scholar] [CrossRef]
- Fekete, B.M. State of the World’s Water Resources. In Climate Vulnerability—Understanding and Addressing Threats to Essential Resources; Elias, S.A., Ed.; Elsevier Inc.: Amsterdam, The Netherlands, 2013; Volume 5, pp. 11–23. [Google Scholar] [CrossRef]
Figure 1.
Designated places along the Tinto River course to collect samples (Appendix A), with the respective drainage basin of the Tinto River using culture media and microorganism quantification.
Figure 1.
Designated places along the Tinto River course to collect samples (Appendix A), with the respective drainage basin of the Tinto River using culture media and microorganism quantification.

Figure 2.
Obtained plates in different solid culture media after the respective incubation conditions. (a)—CFUs in different filtrated volumes (1, 10, or 100 mL) in Chromocult (left panel) or S&B (right panel). (b)—Example of a membrane placed in Kanamycin Aesculin Azide (KAA) Agar from S&B solid medium to confirm the presence of Enterococcus.

Figure 3.
Microorganism count and total organic carbon (TOC) in the selected locations over Tinto River. The data are presented as mean values from at least two independent experiments performed in duplicate (n ≥ 4); SD values are presented (vertical error bars). Where no error bars are shown, SD values are within the bars. Statistical differences were subjected to ANOVA, followed by the Tukey–Kramer multiple comparison method. The means with different letters are significantly different between the pairs (p < 0.05); the means with * are significantly different between the pairs (comparison between location numbers 2 to 14) (p < 0.05).
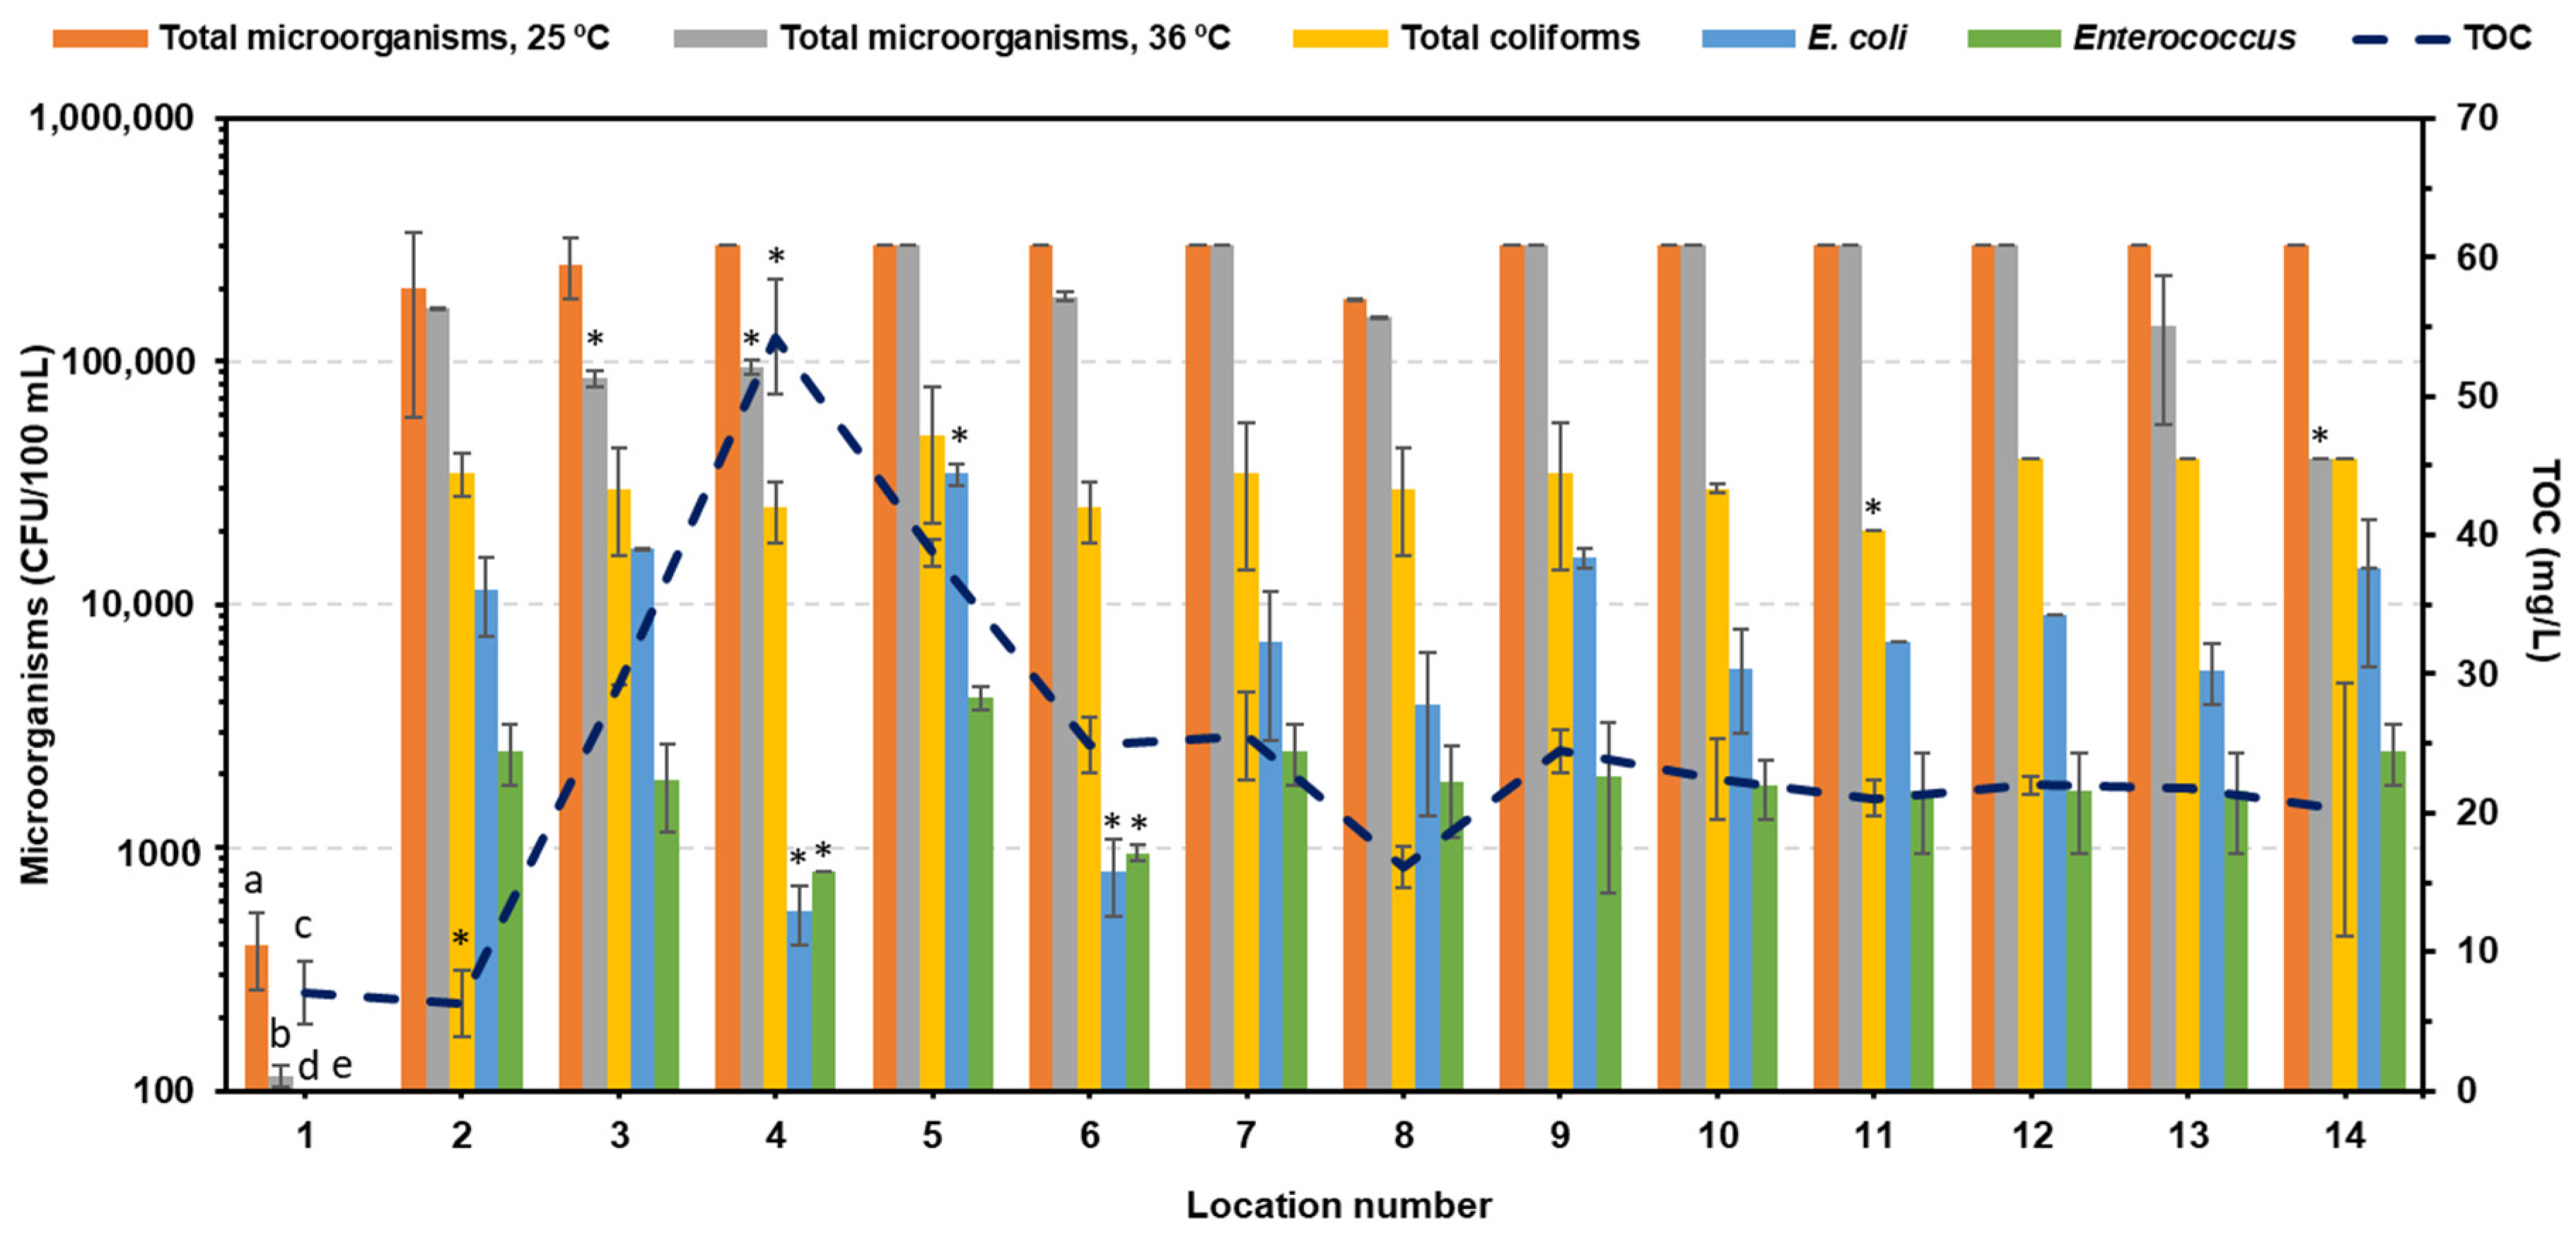
Figure 4.
Total coliforms and E. coli with the respective collection date and samples ID during the month of September (sep).
Figure 4.
Total coliforms and E. coli with the respective collection date and samples ID during the month of September (sep).


Table 1.
Selected points along the Tinto River course with Portuguese street names or specific city locations within the Porto region, location numbers (Figure 1) with the respective GPS coordinates, sample identification (ID), and meteorological data.
Table 1.
Selected points along the Tinto River course with Portuguese street names or specific city locations within the Porto region, location numbers (Figure 1) with the respective GPS coordinates, sample identification (ID), and meteorological data.
| Picking Point | Location Number | GPS Coordinates | Samples ID |
|---|---|---|---|
| “River Source” | 1 | 41.209853366678345 −8.537933108322587 | A1, D1 |
| “Prio Gas Station” | 2 | 41.20869074853031 −8.541528847316966 | C2, D2 |
| “Presas de Sá” | 3 | 41.20710548961442 −8.547250252840492 | C3, D3 |
| “Lipor Watermill” | 4 | 41.19958848134726 −8.55509042093266 | C4, D4 |
| “Granja Creek” | 5 | 41.199300462794334 −8.555304268076744 | C5, D5 |
| “Caneiro” | 6 | 41.187760506218154 −8.556703417085712 | C7, D7 |
| “Lourinha” | 7 | 41.18122056431281 −8.558955093715136 | D8, E8 |
| “Castanheira Creek” | 8 | 41.177438000751614 −8.563476039605014 | B10, E10 |
| “Vitória Watermill” | 9 | 41.173415420761636 −8.562057657537917 | B11, E11 |
| “Baixa da Ponte” | 10 | 41.16824084821879 −8.563342153608334 | B12, E12 |
| “Pego Negro” | 11 | 41.15999705881199 −8.564633560401608 | B13, E13 |
| “Azevedo de Campanhã” | 12 | 41.15195149933247 −8.572819639359995 | A14, E14 |
| “Freixo” | 13 | 41.14759752376573 −8.578804748463854 | B15, E15 |
| “Mouth of the Tinto River” | 14 | 41.14412454144438 −8.579096194097469 | B16, E16 |
Disclaimer/Publisher’s Note: The statements, opinions and data contained in all publications are solely those of the individual author(s) and contributor(s) and not of MDPI and/or the editor(s). MDPI and/or the editor(s) disclaim responsibility for any injury to people or property resulting from any ideas, methods, instructions or products referred to in the content. |
© 2024 by the authors. Licensee MDPI, Basel, Switzerland. This article is an open access article distributed under the terms and conditions of the Creative Commons Attribution (CC BY) license (https://creativecommons.org/licenses/by/4.0/).
Share and Cite
MDPI and ACS Style
Lemos, P.; Silva, P.; Sousa, C.A.; Duarte, A.J. Polluted Rivers—A Case Study in Porto, Portugal. Ecologies 2024, 5, 188-197. https://doi.org/10.3390/ecologies5020012
AMA Style
Lemos P, Silva P, Sousa CA, Duarte AJ. Polluted Rivers—A Case Study in Porto, Portugal. Ecologies. 2024; 5(2):188-197. https://doi.org/10.3390/ecologies5020012
Chicago/Turabian StyleLemos, Patrícia, Paulo Silva, Cátia A. Sousa, and Abel J. Duarte. 2024. "Polluted Rivers—A Case Study in Porto, Portugal" Ecologies 5, no. 2: 188-197. https://doi.org/10.3390/ecologies5020012