
Microbial Biogas Production from Pork Gelatine


Institute of Fluid-Flow Machinery, Polish Academy of Science, Fiszera 14 St., 80-233 Gdańsk, Poland
Hydrogen 2022, 3(2), 179-196; https://doi.org/10.3390/hydrogen3020012
Submission received: 12 March 2022
/
Revised: 7 April 2022
/
Accepted: 3 May 2022
/
Published: 6 May 2022
(This article belongs to the Topic Hydrogen Generation, Storage, and Utilization)
Abstract
:This research describes the results of the anaerobic digestion of gelatine as a potential hydrogen source with heat-shocked inoculum. The concentrations of applied gelatine were of VSS (volatile suspended solids) ranging from 10 g VSS/L to 30 g VSS/L. The initial process pH was 5.5, and, depending on the concentration, reached pH values from 7.5 to 7.8 after 55 days. Although the inoculum was heat-shocked in 30 g VSS/L of collagen, the process that occurred was hydrogenotrophic anaerobic digestion. In gelatine concentrations below 30 g VSS/L, hydrogen production was dominant only during the first 5 days of the experiments. Then, there was a change from dark fermentation to hydrogenotrophic methane production. The optimal hydrogen and methane yields resulted from the concentrations of 10 g VSS/L (7.65 mL ± 0.01 mL H2/g VSS and 3.49 ± 0.01 L CH4/g VSS). Additionally, 10 g VSS/L had the lowest accumulated emission of hydrogen sulphide (10.3 ± 0.01 mL of H2S), while 30 g VSS/L (0.440 ± 0.01mL H2S/g VSS) produced the lowest yield. After a lag time, the hydrogen production and hydrogen sulphide grew with a specific ratio, depending on the concentration. The hydrogen sulphide emission and sulphur added analysis proved that hydrogen sulphide originating from biogas created by bacteria remains longer than that from a substrate.
1. Introduction
Dark fermentation (DF) is a case of anaerobic digestion (AD) in which substrates are converted into hydrogen and volatile acids (stops in acidogenesis). Dark fermentation has the potential to become a cheap method of alternative hydrogen production [1] if some of its limitations, such as low conversion and yield, can be solved [2]. Another benefit of DF is its high potential for utilizing organic wastes, such as food waste or lignocellulose, with the production of organic acids besides hydrogen [3,4]. This study focuses on overcoming the limitations of DF by investigating the extension of potential substrates among different kinds of wastes [5]. Among the most relevant conditions for the process are stressed inoculum and acidic pH (5.0 to 6.5). The optimal temperature for DF depends on the type of bacteria, which can be psychrophilic (20–30 °C) [6], mesophilic (32–42 °C [7]), or thermophilic (55–65 °C [8]). The process has been widely reviewed with a focus on the roles of different substrates [1,5,9], including sugarbeet rests [10,11], crop residues (such as corn) [2,3], bagasse [12], cotton [13], cashew bagasse [14], molasses [15], rice bran [16], potatoes [17], petrochemical wastes [6], sunflower oil cakes [18], grape juice [19], vegetable waste from restaurants [20], fruit peels (orange peels and banana peels) [21], other food residues [22], animal waste such as cow manure [23], chicken meat [24], fish residues [18,24], OMSW residues [25] and sewage wastes [26], and other biodegradation methods leading to hydrogen production [27]. Sugar processing tries to use beets with some hydrogen production to fulfill their energy demand [28]. The stressing of inoculum stops the methanogenesis influenced by heat, centrifuging, pH, and chemicals [29]. In 2021, bacteria are mostly pretreated using heat shock or some combination of heat shock and other methods [30]. Some research centers are still developing other pretreatments, such as radiation with cobaltium [31], freezing [32], ultrasounds [33], aeration [34], and autofermentation [35,36]. Some studies on pretreatments for dark fermentation stated that more hydrogenic bacteria are selected in heat shock because they are less acidic and rest very little [37]. Much research has been conducted on the optimization of heat shock pretreatment [38,39]. This pretreatment is often used for preparing mixed-culture systems for hydrogen production [40,41]. According to Mehata et al. [42], the optimum temperature range for heat shock is between 80 °C and 130 °C, with exposure time from 15 to 1440 min. On the other hand, Acar et al. [43] preheated inoculum at 70 °C for 30 min. Mixed cultures of Clostridium are boiled to a temperature of 100 °C for 15 min [16]. However, according to Kucharska et al. [44], heat treatment for 20 min at a temperature of 121 °C decreased competitive microbial cultures significantly. The heat shock method disables hydrogenotrophic bacteria that uptake generated hydrogen and compile anaerobic bacteria such as Clostridium [45]. The non-spore-forming methanogens should be removed from the system via pretreatment [46]. In the case of the Clostridium species, heat shock pretreatment most often leads to the butyric type of fermentation [47]. There is little research about the potential of only protein wastes [48,49] as a source of DF. Protein waste utilization is an enormous problem in the tannery, fish, and butchery industries [50]. Gelatine is a hydrolyzed form of collagen (one of the most common such wastes) that was tested as a substrate for DF due to its sustainability.
Hydrogen sulphide emission is a vital problem of anaerobic digestion [51]. Thus, it is important to check the appearance of this compound in dark fermentation before it can be viable for industrialization [52]. Another aim of this research was to monitor the relationship between hydrogen and hydrogen sulphide [53], observed in the fermentation of cotton wastes [54]. Additionally, the optimal load for the process was investigated and tested. The detection of the bottom products of the digestion of proteins allows for the projection of the potential pathways of biogas production. The bottom products of dark fermentation are usually volatile organic acids [55], but ammonia compounds also appear [56]. These compounds cause pH changes, transforming the process from DF to AD (hydrogenotrophic [57] or methanotrophic) [58]. The eventual liquid products of dark fermentation can be used as bioresources for cosmetics and chemistry (low organic acids) [59] or fertilizers [60]. Some studies on anaerobic digestion applied protein-rich substrates such as leathers or meat [49,61,62].
In the case of DF, many studies added a substrate to a portion of agar plates without publishing results on agar plates alone [63,64]. Therefore, pork gelatine was chosen as a similar, but more feasible collagen content substrate, as it can be bought in every grocery store. In this experiment, it is worth checking the process trends, their spontaneity, and the necessity of their regulation.
Another aim of this research was to check the behaviour of stressed inoculum after switching the pH and adding proteins. The digestion of proteins should increase the ammonia concentration, similar to chicken manure [65]. The protein composition of collagen is well-known and can serve as a model substrate for protein digestion, similar to glucose (the carbohydrate) in DF [66] and AD [67]. The addition of gelatine with a known mass of methionine and cysteine allows for the identification of the source of hydrogen sulphide emission. Therefore, it can be observed if the hydrogen sulphide originates from the added gelatine, bacteria rests, or both. Hydrogen sulphide emission can cause problems regarding odour in biogas plants and landfills [52]. In this paper, analyses and observations of the dark fermentation of collagen with hydrogen and methane production are reported.
2. Materials and Methods
2.1. Sample Preparation and Measuring
The inoculum was collected from an agricultural biogas plant in Darżyno (near Gdańsk), working at a temperature of 38 °C, and mainly consisted of maize silage and cow manure sludge. The inoculum was stored at room temperature in plastic closed buckets for about 14 days to minimize its biogas production and sieved before filling test reactors to remove large particles.
The experiments were carried out in the Laboratory of Biomass Energy Transformation at The Szewalski Institute of Fluid-Flow Machinery in Poland. Experiments were conducted according to the NREL procedure for biogas production [68]. Fermentation setups consisted of fifteen 2 L glass reactors with a working load of 1.2 L. The tested substrates were filled in the reactor with inoculum. The pH of the digestion of gelatine was measured once per week but not regulated. A batch system is one of the most economical first-experimental methods for checking whether a selected design/product is worth scaling up. Among the most commercially available is one that was proposed by Dach et al. [69,70]. Therefore, such a model was used for checking gelatine hydrogen and methane availability.
Initially, the inoculum was treated by heat shock for 0.5 h at 105 °C, as recommended [71,72]. This method is widely used, and now it is a major approach to the pretreatment of inoculum [73,74]. Later, the initial pH of 7.84 was lowered to pH 5.5 using HCl and applied to the DF process. The bacterial layer was pretreated analogous to a Nasirian et al. [75] procedure for DF of wheat straw, but a cheaper 0.1 M solution of HCl replaced the 0.1 M solution of H2SO4. As a source of collagen, powdered pork gelatine from a grocery store was used. The chosen gelatine contains only hydrolyzed collagen without any additives. Gelatine was added to the reactor with an inoculum of different concentrations. The collagen was added at concentrations from ranging 10 g VSS/L to 30 g VSS/L. The general characteristics are shown in Table 1.
The process was established at a temperature of 38 °C because it was used in the Darżyno plant and used in some glycerol fermentation [76,77]. Biogas produced in every reactor was collected in a cylindrical vessel filled with barrier liquid to prevent biogas solubility. The system worked on the principle of connected vessels. All the experiments were carried out in triplicate. There were three reactors with only inoculum, as prime samples, and 12 reactors with gelatine. Before and after comparisons of masses of reactor mixture were made using a standard Zelmer laboratory scale with an accuracy of 0.0001 [g]. Results were the average values determined. Batch experiments were continued until daily biogas production was less than 1% of total biogas production according to NREL norms [68]. The setups were shown in Figure 1.
The volume of measured methane/biogas was normalized to standard conditions (0 °C and 1.013 bar) using Equation (1).
where Vs—a volume of measured gas at standard temperature and pressure, Vm—a volume of measured gas at ambient condition, Tm—ambient temperature, Ts—standard temperature 273. 15 (K), and Ps—standard pressure (1013 hPa), Pm—ambient pressure.
Conversion of ppm to mg/L in case of hydrogen and hydrogen sulphide was done using Equation (2)
where: ppm—is the volume of hydrogen/hydrogen sulphide measured by a gas analyzer, M—is molar mass (which in the case of hydrogen was 2.02 g/mol and in the case of hydrogen sulphide was 34.08 g/mol), and 22.4 L was the volume that one mole of gas occupies.
2.2. Equipment and Analysis
Biogas measurements were carried out every day with an accuracy of ±0.0001 dm3. The ambient temperature was measured using a room thermometer at the laboratory and noted every day of experiments. The qualitative and quantitative assessments of the gases were performed and determined in two stages, as written in [78]. During the first stage, the gas was measured using a portable biogas analyser (GA5000, Geotech QED Environmental Systems, Inc., Coventry, UK), with the volume of biogas in the cylinder being at least 0.45 dm3. The analyser poses ATEX II 2G Ex ib IIA T1 Gb (Ta from −10 °C to +50 °C), IECEx and CSA quality certifications, and UKAS ISO 17,025 calibration certificate. The equipment allowed measurements of CH4, CO2, O2, H2, and H2S in the ranges 0–100%, 0–100%, 0–25%, 0–1000 ppm, and 0–5000 ppm, respectively. Additionally, the gas analyser measured the ambient pressure used for calculation. The second stage occurred when hydrogen concentration was above 1000 ppm (upper limit of detection of hydrogen for the device), and the gas content was assessed using a gas chromatograph (GC) GC SRI 8060 with a thermal conductivity detector (SRI) and argon as a carrier (gas flow rate was 0.6 mL/h), as recommended by Hitit and Hallenbeck [79]. Hydrogen sulphide and hydrogen (in case of concentration of lower than 1000 ppm) were converted to percentage fractions and then used to calculate volumes of those gases. If hydrogen concentration exceeded 1000 ppm the hydrogen concentration, results for analysis were taken from GC analysis. A Silco packed column Restek® with characteristics of 2 m/2 mm ID 1/8” OD Silica was used. The detector temperature was between 46 °C and 196 °C. The oven was working at a temperature from 23 °C to 200 °C. The injection temperature (splitless mode) method was 45 °C.
The carbon and nitrogen ratio of gelatine and inoculum was analysed using Elementar Analyzer Flash 2000 (Thermo Scientific, Waltham, MA, USA). Determining the C:N ratio consisted of catalytic combustion in a proper amount of oxygen. Ammonium cuvette tests NH4-N/L (Hach, UK) were applied for ammonia detection. Before the analyses, samples of liquids were filtered with a 0.45 μM membrane syringe filter (Pureland). The error of measurement was ±0.01 mL. The volatile acid analysis is provided by Ekotechlab lab, with characteristics listed in Table 2.
3. Results and Discussion
In the prime tests (without gelatine), biogas production was not detected. The biogas was observed only in samples with added gelatine.
3.1. Biogas Pathways
The dark fermentation of collagen required making some modifications to the common reactions pathways for the process. Modifications were made according to the results of the analysis mentioned earlier.
Hydrogen production was reported only in protein-rich substrates [80]. According to some theories, proteins could be a source of hydrogen in DF [81].
The volatile acids analysis determined the presence of ammonia, propionic, and butyric acids. The common pathway [82] should be modified to a current substrate, see Figure 2. Therefore, the potential reactions of the process after the bottom analysis looked like this. The figure assumes gelatine, which is hydrolyzed collagen, to be a collagen mixture.
The processing time of methanogenesis occurrence depended on the gelatine concentration. In gelatine concentrations below 30 g VSS/L, methane production occurred after five days. In concentrations of 30 g VSS/L, methane production lasted the entire time. The heat shock and low pH were insufficient to stop methanogenesis in this case. The process can be classified as dark fermentation in all samples [83]. However, according to Angelidaki et al. [84], DF only occurred in the first five days for gelatine concentrations from 10 g VSS/L to 20 g VSS/L; afterwards, there was hydrogenotrophic anaerobic digestion. In the experiment, there were significant changes in the measured parameters (hydrogen production, hydrogen sulphide emission, methane production, ammonia, volatile acids, and pH changes) during all 55 days of the process. The results of the previously mentioned biogas components were given for the first 20 days and then for all 55 days to stress the transition of the dark fermentation process into anaerobic digestion.
3.2. pH Change, Ammonia, and Volatile Organic Acids Concentrations
The change in pH was caused by the appearance of ammonia and volatile organic acids. There is continuous pH mitigation that was not observed in the shocked inoculum with the digestion of sour cabbage or glucose [55]. The pH stays in the acidic range, although propionic and butyric acid production rather than hydrogen production dominates in the first 5 days at gelatine concentrations of 10 g VSS/L, 15 g VSS/L, and 20 g VSS/L. Between the 3rd and 6th days, the pH increased from 6.0 to 6.2 (10 g VSS/L), 6.3 (15 g VSS/L), 6.5 (20 g VSS/L), and 6.8 (30 g VSS/L). After 15 days, the pH was between 6.75 (10 g VSS/L), 6.8 (15 g VSS/L), 20 g 6.9 (20 g VSS/L), 7.1 (30 g VSS/L), 7.3 (20 g VSS/L and 10 g VSS/L). Looking at Figure 3, pH oscillations after earlier growth could be discerned between the 18th and 30th days.
An increase in ammonia concentration resulted in changes in pH (see Figure 4).
The pH growth depended on the gelatine concentration. Between the 19th to the 39th day of fermentation at 30 g VSS/L of gelatine, the pH value reduced and then returned to the earlier point. During this period, the pH was decreased by low volatile acids (see Figure 5).
In the concentrations of gelatine ranging from 15 g VSS/L to 20 g VSS/L, the pH growth was slower. The sudden decrease in pH occurred on the 30th day of fermentation at those concentrations. In the gelatine concentration of 10 g VSS/L, a drop in the pH value started on the 38th day and continued to decrease until the 43rd day (similar to the concentrations of 15 g VSS/L and 20 g VSS/L). Then, the increase in the pH values of gelatine 10 g VSS/L was higher than those at 15 g VSS/L and 20 VSS/L. On the 51st day, in concentrations of gelatine from 15 g VSS to 30 g VSS/L, the pH increased, whereas 10 g VSS/L reached the lowest value at the end of the process. Similar behaviour was observed by [4]. The growth of the pH in the case of 20 g VSS/L ‘overtook’ other concentrations. The pH change results were the background for the liquid compound and biogas component analyses of the reason behind the shift of the process from DF to AD.
Figure 4 showed an increase in the ammonia concentration with the growth of the gelatine concentration. This was caused by the higher decomposition of the gelatine, resulting in ammonia growth. The highest pH growth coincided with the medium highest ammonia concentration.
Other bottom products were volatile organic acids: butyric and propionic acids. The production of volatile organic acids did not block the increase of pH at a gelatine concentration of 20 g VSS/L. Figure 6 and Figure 7 showed low hydrogen production in those points, caused by the conversion of volatile organic acids to methane.
The liquid products influenced the transformation from DF to AD, similar to [85] wheat straw. The biogas relationship coincided with volatile acids and ammonia analysis.
The GC analysis determined the presence of propionic and butyric acid. The highest concentration of volatile acids coincided with the highest pH values—see Figure 4 and Figure 5—in the gelatine concentration of 20 g VSS/L. There was also a production of butyric and propionic acids that slowed down the increase of pH, more so in 30 g VSS/L than in 20 g VSS/L. Other than in the concentration of 30 g VSS/L, propionic acids occurred in much lower volumes than butyric acids. In 30 g VSS/L, the ratio of butyric to propionic acid is the highest. However, the propionic pathway is less spontaneous than butyric [86], and thus, more special conditions are required [87]. In the gelatine concentration of 30 g VSS/L, butyric acid was on the level of propionic acids. There, both acids were in lower concentrations than in other cases. This was caused by immediate methane production that converted volatile organic acids [88]. The volatile acid concentration did not differ much between 30 g VSS/L and 20 g VSS/L in pH value. The volatile acids’ absence in the gelatine concentration of 30 g VSS/L resulted in a pH that was slightly lower than that of 20 g VSS/L. The propionic acid concentrations were similar to the digestion of gelatine from 10 g VSS/L to 30 g VSS/L. The differences in the butyric acid concentration in gelatine concentrations from 10 g VSS/L to 20 g VSS/L were shrinking. The butyric acids to propionic acids volumes were the lowest in the gelatine concentration of 20 g VSS/L and the highest at 10 g VSS/L. In these concentrations, the lower the concentration of volatile acids, the higher the pH was. Propionic acid in the fermentation of gelatine replaced the usually occurring acetic acids [89,90].
3.3. Hydrogen Production
The hydrogen production results were shown in the first 20 days (Figure 6) and 55 days (Figure 7). The division of the two periods improved the readability of the hydrogen growth trends, responding to fluctuations in the pH value in Figure 3.
A significant pH growth from 5.5 to 7.3 (above one pH unit) lasted during the first ten days. On the first day of the research, the highest hydrogen production was from a collagen concentration of 10 g VSS/L. Then, until the fifth day, the produced biogas volumes in 10 g VSS/L were not measurable. Comparing Figure 6 and Figure 7, a significant progression of hydrogen production was occurring in the first 20 days. The highest collagen concentration of 30 g VSS/L resulted in the lowest volume of hydrogen from the 5th day onward. Before the 5th day, the lowest volume of hydrogen was from the collagen concentration of 15 g VSS/L. This was caused by changes in the pH that resulted in the growth of ammonia and volatile organic acids. When the pH reached 6.8 in the concentrations of 30 g VSS/L and 10 g VSS/L, the hydrogen production slowed down, replaced by methane production. The pH increased for the concentrations of 15 g VSS/L and 20 g VSS/L at the same time as in the remained concentrations, but the hydrogen production did not significantly mitigate methane production (see Figure 8 and Figure 9).
In the figures, points were placed to show the measurable volumes of the obtained biogas. In 15 g VSS/L, the hydrogen production increased, with stable and remarkable growth on the 6th and 14th days, despite having pH values that were higher than those of other cases. The pH grew on the 21st day, which coincided with the optimal growth of hydrogen production for the concentration of 15 g VSS/L. The pH changes blocked the hydrogen production, similar to [91,92]. In the gelatine concentration of 15 g VSS/L, the hydrogen production from the 28th day onward overtook that of 10 g VSS/L. After the 53rd day, an increase in the pH of 30 g VSS/L was met with hydrogen production growth. Higher concentrations of volatile acids and ammonia in the reactors were correlated with constant hydrogen growth. The correlation of ammonia is another dependent form of discerned volatile acids [93].
3.4. Hydrogen Sulphide Emission
Hydrogen sulphide emission trends (see Figure 10 and Figure 11) were similar to the accumulated hydrogen production, growing in the gelatine concentrations from 10 g VSS/L to 20 g VSS/L. In 30 g VSS/L, the hydrogen sulphide emission was lower than that of the gelatine concentration of 15 g VSS/L, and the hydrogen production was similar to that of 20 g VSS/L.
The accumulated hydrogen sulphide emission volumes in those gelatine concentrations were higher than those of the gelatine concentration of 10 g VSS/L. The emission of hydrogen sulphide increased for all samples, mostly in the first 5 to 7 days, similar to hydrogen production. In the gelatine concentration of 15 g VSS/L, hydrogen sulphide was initially lower than that of the gelatine concentration of 30 g VSS/L in the first five days, as was hydrogen for this concentration. The ratios of hydrogen sulphide and hydrogen production stabilized at around 5 or 6 days. After this period, hydrogen sulphide and hydrogen production formed a permanent and stable ratio, besides in the gelatine concentration of 10 g VSS/L during all processes (see Figure 12).
Since gelatine (here as a hydrolyzed form of gelatine) has a known mass of sulphur from the sumaric formula, calculations were made using equation (2) and the data from Figure 12 (shown in Table 3). The accumulated hydrogen sulphide, the accumulated emission volume multiplied by the density of the hydrogen sulphide at room temperature ρH2S (1.313 g/cm3), and the percentage of sulphur in the hydrogen sulphide (94.11%) divided by the mass of sulphur added with gelatine (sulphur mass is 0.2% the mass of collagen) gave the ratio (3).
The data of the sulphur that was added to and emitted by the hydrogen sulphide were given in Table 3.
In this study, mass analysis is performed, with the mass that was initially reduced (inoculum with gelatine) added after the experiment. The initial mass is 1200 g (initial workload), and the final mass after the experiment was calculated by Equation (4).
The ratio of sulphur converted as hydrogen sulphide (Table 3) at a gelatine concentration of 15 VSS/L proved its origin. It originated from bacterial rests, not only from substrates. This agrees with the conclusion of glycol ethylene fermentation [78]. Because the mass of sulphur in the produced hydrogen sulphide was higher than the sulphur added from gelatine and the hydrogen sulphide emitted from biogas converted 108% of the added sulphur that was added to the gelatine concentration of 20 g VSS/L, it could not have only originated from substrates.
3.5. Methane Production and Overall Discussion
Methane was the main biogas product after two days at a gelatine concentration of 30 g VSS/L (see Figure 8 and Figure 9). Figure 9 illustrated that in the gelatine concentrations from 15 g VSS/L to 20 g VSS/L, until the fifth day, methane production did not occur with increasing pH. Therefore, in this time range, there was classical dark fermentation [94]. Later, at these three concentrations and the gelatine concentration of 30 g VSS/L [95], hydrogenotrophic anaerobic digestion occurred [96,97]. In the case of 10 gVSS/L, methane production occurred in the beginning; however, in the first 5 days, there was no overwhelming hydrogen production. The boiling of the inoculum and the modified Dach setup for biomethane measurement potential were enough to make dark fermentation with leading hydrogen production for sour cabbage and cotton [5], but not for gelatine. In the gelatine concentration of 30 g VSS/L, during the time range with the highest pH, which was from the 10th day to the 19th day, the methane production was the highest of all the gelatine concentrations. Then, a decrease in pH until the 25th day resulted in an increase in methane that was lower than that of 10 g VSS/L and 20 g VSS/L. On the 25th day, despite the decreasing pH, there was a relevant increase in methane production in the head before the 35th day (see Figure 9), when the gelatine concentration of 30 g VSS/L reached its minimum pH value (after the 11th day of the process). Afterwards, increases in methane volumes were not as significant as those at the gelatine concentrations of 15 g VSS/L or 20 g VSS/L. The spike of methane production in the gelatine concentrations of 15 g VSS/L and 20 g VSS/L coincided with the highest hydrogen production growth, though a usual increase in methane reduced hydrogen production, similar to [81]. The methane production from the fifth day for gelatine concentrations from 10 g VSS/L to 20 g VSS/L changed rapidly during a time, similar to pH (Figure 3). From the 18th day to the 24th day, the gelatine concentration of 10 g VSS/L reached the highest methane accumulated volume of all the concentrations (during its increase from pH 6.8 to 7.3). After pH 7.3, the increase in methane production was not as high as in other cases. In this range, an increase in methane production did not coincide with an increase in hydrogen production. The methane production from 15 g VSS/L was the most changeable of all the gelatine concentrations, in time with rapid pH changes (Figure 3, Figure 11 and Figure 12). At that concentration, hydrogen production and hydrogen sulphide emission were the lowest up until the 25th day. The increase in methane production after the 25th day in this gelatine concentration was large enough to reach the highest accumulative methane volume between the 38th and 43rd day; thus, in this range, pH was decreased again to 7.2 value from 7.6. When the pH increased, the methane volume was lower than that of 20 g VSS/L. These figures showed that the heat shock stress for block methanogens is dependent on the substrate load. If the substrate contained proteins, depending on the concentration, the effect of stress shifting was reduced (gelatine from 10 g VSS/L to 20 g VSS/L), shifting sooner to hydrogenotrophic methane production (simultaneous dark fermentation and dark fermentation) after 6 days of dark fermentation or methane production in the case of 30 g VSS/L. The hydrogen yield from gelatine was in the middle (see Table 4). Gelatine is a quite promising source of hydrogen by dark fermentation. The methane production was very high, though the inoculum was stressed. The hydrogen production from gelatine with pH control was higher than in the cases of uncontrolled cotton, potato, and wheat straw fermentation, but still twice as low as the case of controlled pH [98]. The highest accumulated biogas production concentrations were different from the most efficient concentrations (see Table 4). The yields of methane and hydrogen were the highest for the gelatine concentration of 10 g VSS/L. The lowest hydrogen sulphide emission yield resulted from the gelatine concentration of 30 g VSS/L, though the accumulated hydrogen sulphide emission was higher than that of the gelatine concentration of 10 g VSS/L. For an odourless process, the concentration of 30 g VSS/L was the most suitable. The worst hydrogen yield and sulphide accumulated emission and yield were produced by the gelatine concentration of 20 g VSS/L. Regarding Table 3, an increase in the concentration causes an increase in the mass conversion to gas products.
4. Conclusions
After five days, the dark fermentation of gelatine from the concentrations of 10 g VSS/L to 20 g VSS/L transferred into hydrogenotrophic anaerobic digestion. At a gelatine concentration of 30 g VSS/L, the process was, from the beginning, hydrogenotrophic anaerobic digestion. The heat shock was not enough to block methanogenesis if the gelatine concentrations were 10 g VSS/L and 30 g VSS/L. Heat shock stopped methanogenesis for 5 days at the gelatine concentrations of 15 g VSS/L and 20 g VSS/L. The optimal biogas production was due to the accumulative production for the gelatine concentration of 20 g VSS/L: 147.2 mL of hydrogen and 57.23 L of methane. The highest yields of hydrogen and methane (7.65 mL H2/g VSS, 3.49 L CH4/g VSS) were at the gelatine concentration of 10 g VSS/L. Thus, gelatine is a promising source of hydrogen and methane. Additionally, 10 g VSS/L had the lowest accumulated emission of hydrogen sulphide (10.3 mL of H2S), though the lowest yield came from 30 g VSS/L (0.44 mL H2S/g VSS). The hydrogen production and hydrogen sulphide emission after stabilization grew, depending on the gelatine concentrations. Gelatine can become a model protein substrate, such as glucose for polysaccharides and glycerol for fats. The hydrogen sulphide emission and sulphur added to the analysis proved that the hydrogen sulphide originated from the biogas of gelatine from bacteria rests more than from substrate.
Funding
This research was funded by the National Centre for Research and Development in Poland, under project no. BIOSTRATEG 3/344128/12/NCBR/2017 and a grant from the Institute of Fluid-Flow Machinery, Polish Academy of Science in Gdansk FBW-44—Solowski. The APC was funded by corresponding author.
Institutional Review Board Statement
Not applicable.
Informed Consent Statement
Not applicable.
Data Availability Statement
All data of the study are presented available in: https://doi.org/10.21203/rs.3.rs-1146851/v1 accessed on 12 December 2021.
Acknowledgments
Special thanks to Ekotechlab Company for help with analysis and Proofart for proofreading the manuscript.
Conflicts of Interest
The authors declare no conflict of interest.
References
- Parra, D.; Valverde, L.; Pino, F.J.; Patel, M.K. A review on the role, cost and value of hydrogen energy systems for deep decarbonisation. Renew. Sustain. Energy Rev. 2019, 101, 279–294. [Google Scholar] [CrossRef]
- Palomo-Briones, R.; de Montoya-Rosales, J.J.; Razo-Flores, E. Advances towards the understanding of microbial communities in dark fermentation of enzymatic hydrolysates: Diversity, structure and hydrogen production performance. Int. J. Hydrogen Energy 2021, 46, 27459–27472. [Google Scholar] [CrossRef]
- Figeac, N.; Trably, E.; Bernet, N.; Delgenès, J.P.; Escudié, R. Temperature and inoculum origin influence the performance of ex-situ biological hydrogen methanation. Molecules 2020, 25, 5665. [Google Scholar] [CrossRef]
- Khatami, K.; Atasoy, M.; Ludtke, M.; Baresel, C.; Eyice, Ö.; Cetecioglu, Z. Bioconversion of food waste to volatile fatty acids: Impact of microbial community, pH and retention time. Chemosphere 2021, 275, 129981. [Google Scholar] [CrossRef]
- Cho, S.C.E.; Deok, J.L.; Moon, H. Synergistic benefits for hydrogen production through CO2—Cofeeding catalytic pyrolysis of cellulosic biomass waste. Cellulose 2021, 28, 4781–4792. [Google Scholar] [CrossRef]
- Elreedy, A.; Fujii, M.; Tawfik, A. Psychrophilic hydrogen production from petrochemical wastewater via anaerobic sequencing batch reactor: Techno-economic assessment and kinetic modelling. Int. J. Hydrogen Energy 2019, 44, 5189–5202. [Google Scholar] [CrossRef]
- Rojas, J.C.; Ramírez, K.G.; Velasquez, P.E.; Acevedo, P.; Santis, A. Evaluation of bio-hydrogen production by dark fermentation from Cocoa waste mucilage. Chem. Eng. Trans. 2020, 79, 283–288. [Google Scholar] [CrossRef]
- Masilela, P.; Pradhan, A. Application of thermophilic temperatures, low hydraulic retention times and high recycling of de-gassed effluent for higher biohydrogen production. Int. J. Hydrogen Energy 2020, 46, 7176–7182. [Google Scholar] [CrossRef]
- Urbaniec, K.; Grabarczyk, R. Raw materials for fermentative hydrogen production. J. Clean. Prod. 2009, 17, 959–962. [Google Scholar] [CrossRef]
- Panagiotopoulos, J.A.; Bakker, R.R.; De Vrije, T.; Urbaniec, K.; Koukios, E.G.; Claassen, P.A.M. Prospects of utilization of sugar beet carbohydrates for biological hydrogen production in the EU. J. Clean. Prod. 2010, 18, S9–S14. [Google Scholar] [CrossRef]
- Detman, A.; Mielecki, D.; Chojnacka, A.; Salamon, A.; Błaszczyk, M.K.; Sikora, A. Cell factories converting lactate and acetate to butyrate: Clostridium butyricum and microbial communities from dark fermentation bioreactors. Microb. Cell Fact. 2019, 18, 36. [Google Scholar] [CrossRef]
- Abreu, C.; Rabelo, B.S.; Soares, A.L.; Kimiko, I.; Luiz, E.; Bernadete, M.; Varesche, A. Optimization of hydrogen and organic acids productions with autochthonous and allochthonous bacteria from sugarcane bagasse in batch reactors Optimization of hydrogen and organic acids productions with autochthonous and allochthonous bacteria from sugarca. J. Environ. Manag. 2018, 223, 952–963. [Google Scholar] [CrossRef]
- Sołowski, G.; Konkol, I.; Shalaby, M.; Cenian, A. Rapid hydrogen generation from cotton wastes by mean of dark fermentation. SN Appl. Sci. 2020, 2, 1438. [Google Scholar] [CrossRef]
- Silva, J.S.; Mendes, J.S.; Correia, J.A.C.; Rocha, M.V.P.; Micoli, L. Cashew apple bagasse as new feedstock for the hydrogen production using dark fermentation process. J. Biotechnol. 2018, 286, 71–78. [Google Scholar] [CrossRef]
- Mıynat, M.E.; Argun, H. Prevention of substrate and product inhibitions by using a dilution strategy during dark fermentative hydrogen production from molasses. Int. J. Hydrogen Energy 2020, 45, 34695–34706. [Google Scholar] [CrossRef]
- Sivaramakrishnan, R.; Ramprakash, B.; Ramadoss, G.; Suresh, S.; Pugazhendhi, A.; Incharoensakdi, A. High potential of Rhizopus treated rice bran waste for the nutrient-free anaerobic fermentative biohydrogen production. Bioresour. Technol. 2021, 319, 124193. [Google Scholar] [CrossRef]
- Sekoai, P.T.; Ayeni, A.O.; Daramola, M.O. Parametric optimization of biohydrogen production from potato waste and scale-up study using immobilized anaerobic mixed sludge. Waste Biomass Valoriz. 2019, 10, 1177–1189. [Google Scholar] [CrossRef]
- Guo, X.M.; Trably, E.; Latrille, E.; Carrère, H.; Steyer, J.-P. Hydrogen production from agricultural waste by dark fermentation: A review. Int. J. Hydrogen Energy 2010, 35, 10660–10673. [Google Scholar] [CrossRef]
- François, E.; Dumas, C.; Gougeon, R.D.; Alexandre, H.; Vuilleumier, S.; Ernst, B. Unexpected high production of biohydrogen from the endogenous fermentation of grape must deposits. Bioresour. Technol. 2020, 320, 124334. [Google Scholar] [CrossRef]
- Pecorini, I.; Baldi, F.; Iannelli, R. Biochemical hydrogen potential tests using different inocula. Sustainability 2019, 11, 622. [Google Scholar] [CrossRef] [Green Version]
- Keskin, T.; Abubackar, H.N.; Yazgin, O.; Gunay, B.; Azbar, N. Effect of percolation frequency on biohydrogen production from fruit and vegetable wastes by dry fermentation. Int. J. Hydrogen Energy 2019, 44, 18767–18775. [Google Scholar] [CrossRef]
- Shao, W.; Wang, Q.; Rupani, P.F.; Krishnan, S.; Ahmad, F.; Rezania, S.; Rashid, M.A.; Sha, C.; Md Din, M.F. Biohydrogen production via thermophilic fermentation: A prospective application of Thermotoga species. Energy 2020, 197, 117199. [Google Scholar] [CrossRef]
- Turon, V.; Trably, E.; Fouilland, E.; Steyer, J.P. Potentialities of dark fermentation effluents as substrates for microalgae growth: A review. Process Biochem. 2015, 51, 1843–1854. [Google Scholar] [CrossRef]
- Yasin, N.H.M.; Mumtaz, T.; Hassan, M.A.; Abd Rahman, N. Food waste and food processing waste for biohydrogen production: A review. J. Environ. Manag. 2013, 130, 375–385. [Google Scholar] [CrossRef] [PubMed]
- Baldi, F.; Iannelli, R.; Pecorini, I.; Polettini, A.; Pomi, R.; Rossi, A. Influence of the pH control strategy and reactor volume on batch fermentative hydrogen production from the organic fraction of municipal solid waste. Waste Manag. Res. 2019, 37, 478–485. [Google Scholar] [CrossRef] [Green Version]
- Devos, P.; Haddad, M.; Carrère, H. Thermal hydrolysis of municipal sludge: Finding the temperature sweet spot: A review. Waste Biomass Valoriz. 2020, 12, 2187–2205. [Google Scholar] [CrossRef]
- Gómez, X.; Fernández, C.; Fierro, J.; Sánchez, M.E.; Escapa, A.; Morán, A. Hydrogen production: Two stage processes for waste degradation. Bioresour. Technol. 2011, 102, 8621–8627. [Google Scholar] [CrossRef]
- Detman, A.; Laubitz, D.; Chojnacka, A.; Kiela, P.R.; Salamon, A.; Barberan, A.; Chen, Y.; Blaszczyk, M.K.; Sikora, A. Dynamics of dark fermentation microbial communities in the light of lactate and butyrate production. Microbiome 2021, 9, 158. [Google Scholar] [CrossRef]
- García Depraect, O.; Muñoz, R.; van Lier, J.B.; Rene, E.B.; Diaz-Cruces, V.F.; León Becerril, E. Three-stage process for tequila vinasse valorization through sequential lactate, biohydrogen and methane production. Bioresour. Technol. 2020, 307, 123160. [Google Scholar] [CrossRef]
- Panin, S.; Setthapun, W.; Elizabeth Sinsuw, A.A.; Sintuya, H.; Chu, C.Y. Biohydrogen and biogas production from mashed and powdered vegetable residues by an enriched microflora in dark fermentation. Int. J. Hydrogen Energy 2020, 46, 14073–14082. [Google Scholar] [CrossRef]
- Dai, L.; He, C.; Wang, Y.; Liu, Y.; Ruan, R.; Zhou, Y.; Duan, D.; Fan, L.; Zhao, Y.; Yu, Z. Hydrothermal pretreatment of bamboo sawdust using microwave irradiation. Bioresour. Technol. 2018, 247, 234–241. [Google Scholar] [CrossRef] [PubMed]
- Dauptain, K.; Schneider, A.; Noguer, M.; Fontanille, P.; Escudie, R.; Carrère, H.; Trably, E. Impact of microbial inoculum storage on dark fermentative H2 production. Bioresour. Technol. 2020, 319, 124234. [Google Scholar] [CrossRef] [PubMed]
- Yang, G.; Wang, J. Biohydrogen production from waste activated sludge pretreated by combining sodium citrate with ultrasonic: Energy conversion and microbial community. Energy Convers. Manag. 2020, 225, 113436. [Google Scholar] [CrossRef]
- Toledo-Alarcón, J.; Fuentes, L.; Etchebehere, C.; Bernet, N.; Trably, E. Glucose electro-fermentation with mixed cultures: A key role of the Clostridiaceae family. Int. J. Hydrogen Energy 2020, 46, 1694–1704. [Google Scholar] [CrossRef]
- Gomes, S.D.; Fuess, L.T.; Penteado, E.D.; Lucas, S.D.M.; Gotardo, J.; Zaiat, M. The application of an innovative continuous multiple tube reactor as a strategy to control the specific organic loading rate for biohydrogen production by dark fermentation. Bioresour. Technol. 2015, 197, 201–207. [Google Scholar] [CrossRef] [PubMed]
- Penteado, E.D.; Lazaro, C.Z.; Sakamoto, I.K.; Zaiat, M. Influence of seed sludge and pretreatment method on hydrogen production in packed-bed anaerobic reactors. Int. J. Hydrogen Energy 2013, 38, 6137–6145. [Google Scholar] [CrossRef]
- Prabakar, D.; Suvetha, K.S.; Manimudi, V.T.; Mathimani, T.; Kumar, G.; Rene, A.D.; Pugazhendhi, A. Pretreatment technologies for industrial effluents: Critical review on bioenergy production and environmental concerns. J. Environ. Manag. 2018, 218, 165–180. [Google Scholar] [CrossRef]
- Arun, J.; Panchamoorthy, K.; Sivaramakrishnan, R.; Sundarrajan, P.; Malolan, R.; Pugazhendhi, A. Technical insights into the production of green fuel from CO 2 sequestered algal biomass: A conceptual review on green energy. Sci. Total Environ. 2020, 755, 142636. [Google Scholar] [CrossRef] [PubMed]
- Kumar, G.; Mathimani, T.; Rene, E.R.; Pugazhendhi, A. Application of nanotechnology in dark fermentation for enhanced biohydrogen production using inorganic nanoparticles. Int. J. Hydrogen Energy 2019, 44, 13106–13113. [Google Scholar] [CrossRef]
- Azbar, N.; Dokgöz, F.T.; Keskin, T.; Eltem, R.; Korkmaz, K.S.; Gezgin, Y.; Akbal, Z.; Öncel, S.; Dalay, M.C.; Gönen, Ç.; et al. Comparative evaluation of bio-hydrogen production from cheese whey wastewater under thermophilic and mesophilic anaerobic conditions. Int. J. Green Energy 2009, 6, 192–200. [Google Scholar] [CrossRef]
- Wang, J.L.; Wan, W. Comparison of different pretreatment methods for enriching hydrogen-producing bacteria from digested sludge. Int. J. Hydrogen Energy 2008, 33, 2934–2941. [Google Scholar] [CrossRef]
- Mahata, C.; Ray, S.; Das, D. Optimization of dark fermentative hydrogen production from organic wastes using acidogenic mixed consortia. Energy Convers. Manag. 2020, 219, 113047. [Google Scholar] [CrossRef]
- Acar, C.; Dincer, I. Review and evaluation of hydrogen production options for better environment. J. Clean. Prod. 2019, 218, 835–849. [Google Scholar] [CrossRef]
- Kucharska, K.; Cieśliński, H.; Rybarczyk, P.; Słupek, E.; Łukajtis, R.; Wychodnik, K.; Kamiński, M. Fermentative conversion of two-step pre-treated lignocellulosic biomass to hydrogen. Catalysts 2019, 9, 858. [Google Scholar] [CrossRef] [Green Version]
- Kalamaras, S.D.; Vasileiadis, S.; Karas, P.; Angelidaki, I.; Kotsopoulos, T.A. Microbial adaptation to high ammonia concentrations during anaerobic digestion of manure-based feedstock: Biomethanation and 16S rRNA gene sequencing. J. Chem. Technol. Biotechnol. 2020, 95, 1970–1979. [Google Scholar] [CrossRef]
- Poirier, S.; Steyer, J.P.; Bernet, N.; Trably, E. Mitigating the variability of hydrogen production in mixed culture through bioaugmentation with exogenous pure strains. Int. J. Hydrogen Energy 2019, 45, 2617–2626. [Google Scholar] [CrossRef]
- Liu, X.; He, D.; Yanxin, W.; Qiuxiang, X.; Wang, D.; Yang, Q.; Liu, Y.; Bing-Jie, N.; Wang, Q.X. Freezing in the presence of nitrite pretreatment enhances hydrogen production from dark fermentation of waste activated sludge. J. Clean. Prod. 2020, 248, 119305. [Google Scholar] [CrossRef]
- Gallipoli, A.; Braguglia, C.M.; Gianico, A.; Montecchio, D.; Pagliaccia, P. Kitchen waste valorization through a mild-temperature pretreatment to enhance biogas production and fermentability: Kinetics study in mesophilic and thermophilic regimen. J. Environ. Sci. 2020, 89, 167–179. [Google Scholar] [CrossRef]
- Hovorukha, V.; Havryliuk, O.; Gladka, G.; Tashyrev, O.; Kalinichenko, A.; Sporek, M.; Dołhańczuk-Śródka, A. Hydrogen dark fermentation for degradation of solid and liquid food waste. Energies 2021, 14, 1831. [Google Scholar] [CrossRef]
- Masilamani, D.; Madhan, B.; Shanmugam, G.; Palanivel, S.; Narayan, B. Extraction of collagen from raw trimming wastes of tannery: A waste to wealth approach. J. Clean. Prod. 2016, 113, 338–344. [Google Scholar] [CrossRef]
- Theuerl, S.; Klang, J.; Prochnow, A. Process disturbances in agricultural biogas production—Causes, mechanisms and effects on the biogas microbiome: A review. Energies 2019, 12, 365. [Google Scholar] [CrossRef] [Green Version]
- Andreides, M.; Pokorná-Krayzelová, L.; Říhová Ambrožová, J.; Volcke, E.I.P.; Bartáček, J. Key parameters influencing hydrogen sulfide removal in microaerobic sequencing batch reactor. Biochem. Eng. J. 2021, 168, 107951. [Google Scholar] [CrossRef]
- Ramos, I.; Peña, M.; Fdz-Polanco, M. Where does the removal of H2S from biogas occur in microaerobic reactors? Bioresour. Technol. 2014, 166, 151–157. [Google Scholar] [CrossRef] [PubMed]
- Sołowski, G.; Konkol, I.; Cenian, A. Methane and Hydrogen Production from Cotton Wastes in Dark Fermentation Process Under Anaerobic and Microaerobic Conditions. In Frontiers in Water-Energy-Nexus—Nature-Based Solutions, Advanced Technologies and Best Practices for Environmental Sustainability; Naddeo, V., Balakrishnan, M., Choo, K.-H., Eds.; Springer: Cham, Switzerland, 2020; pp. 285–287. [Google Scholar]
- Rangel, C.; Sastoque, J.; Calderon, J.; Mosquera, J.; Velasquez, P.; Cabezab, I.; Acevedob, P. Hydrogen production by dark fermentation process: Effect of initial organic load. Chem. Eng. Trans. 2020, 79, 133–138. [Google Scholar] [CrossRef]
- Seifert, K.; Zagrodnik, R.; Stodolny, M.; Łaniecki, M. Biohydrogen production from chewing gum manufacturing residue in a two-step process of dark fermentation and photofermentation. Renew. Energy 2018, 122, 526–532. [Google Scholar] [CrossRef]
- Tsapekos, P.; Kougias, P.G.; Angelidaki, I. Mechanical pretreatment for increased biogas production from lignocellulosic biomass; predicting the methane yield from structural plant components. Waste Manag. 2018, 78, 903–910. [Google Scholar] [CrossRef]
- Bertalero, G.; Addebito, P.; Bancario, C.C.; Cliente, C.A.L. Proteinaceous methanotrophs for feed additive using biowaste as carbon and nutrients source. Bioresour. Technol. 2020, 313, 123646. [Google Scholar] [CrossRef]
- Hitit, Z.Y.; Zampol Lazaro, C.; Hallenbeck, P.C. Increased hydrogen yield and COD removal from starch/glucose based medium by sequential dark and photo-fermentation using Clostridium butyricum and Rhodopseudomonas palustris. Int. J. Hydrogen Energy 2017, 42, 18832–18843. [Google Scholar] [CrossRef]
- Chiumenti, A.; Boscaro, D.; Da Borso, F.; Sartori, L.; Pezzuolo, A. Biogas from fresh spring and summer grass: Effect of the harvesting period. Energies 2018, 11, 1466. [Google Scholar] [CrossRef] [Green Version]
- Hu, X.; Meneses, Y.E.; Stratton, J.; Lau, S.K.; Subbiah, J. Integration of ozone with co-immobilized microalgae-activated sludge bacterial symbiosis for efficient on-site treatment of meat processing wastewater. J. Environ. Manag. 2021, 285, 112152. [Google Scholar] [CrossRef]
- Vasco-Correa, J.; Khanal, S.; Manandhar, A.; Shah, A. Anaerobic digestion for bioenergy production: Global status, environmental and techno-economic implications, and government policies. Bioresour. Technol. 2018, 247, 1015–1026. [Google Scholar] [CrossRef] [PubMed]
- Akoma, O.N.; Ononugbo, C.M.; Eze, C.C.; Chukwudozie, K.I.; Ogwu, J.E. Microbial Assessment of Selected, Locally- Fermented and Ready-to-eat Cassava Products Sold in Lokoja, Nigeria. Asian Food Sci. J. 2019, 8, 1–9. [Google Scholar] [CrossRef]
- Dreschke, G.; Papirio, S.; Sisinni, D.M.G.; Lens, P.N.L.; Esposito, G. Effect of feed glucose and acetic acid on continuous biohydrogen production by Thermotoga neapolitana. Bioresour. Technol. 2019, 273, 416–424. [Google Scholar] [CrossRef] [PubMed]
- Łochyńska, M.; Frankowski, J. The biogas production potential from silkworm waste. Waste Manag. 2018, 79, 564–570. [Google Scholar] [CrossRef] [PubMed]
- Pan, C.M.; Fan, Y.T.; Zhao, P.; Hou, H.W. Fermentative hydrogen production by the newly isolated Clostridium beijerinckii Fanp3. Int. J. Hydrogen Energy 2008, 33, 5383–5391. [Google Scholar] [CrossRef]
- Moodley, P.; Gueguim Kana, E.B. Comparative study of three optimized acid-based pretreatments for sugar recovery from sugarcane leaf waste: A sustainable feedstock for biohydrogen production. Eng. Sci. Technol. Int. J. 2018, 21, 107–116. [Google Scholar] [CrossRef]
- Moriarty, K. Feasibility Study of Anaerobic Digestion of Food Waste in St. Bernard, Louisiana. A Study Prepared in Partnership with the Environmental Protection Agency for the RE-Powering America’s Land Initiative: Siting Renewable Energy on Potentially Contaminated Land and Mine Sites; National Renewable Energy Laboratory: Golden, CO, USA, 2013. Available online: https://www.nrel.gov/docs/fy13osti/57082.pdf (accessed on 20 March 2020).
- Marks, S.; Dach, J.; Garcia-Morales, J.L.; Fernandez-Morales, F.J. Bio-energy generation from synthetic winery wastewaters. Appl. Sci. 2020, 10, 8360. [Google Scholar] [CrossRef]
- Janczak, D.; Malinska, K.; Czekała, W.; Cáceres, R.; Lewicki, A.; Dach, J. Biochar to reduce ammonia emissions in gaseous and liquid phase during composting of poultry manure with wheat straw. Waste Manag. 2017, 66, 36–45. [Google Scholar] [CrossRef]
- Liang, X.; Zhu, Y.; Qi, B.; Li, S.; Luo, J.; Wan, J. Structure-property-performance relationships of lactic acid-based deep eutectic solvents with different hydrogen bond acceptors for corn stover pretreatment. Bioresour. Technol. 2021, 336, 125312. [Google Scholar] [CrossRef]
- Pineda-Muñoz, C.F.; Conde-Baez, L.; Lucho-Constantino, C.; Medina-Moreno, S.A.; Jiménez-González, A. Ultrasonic energy effect on dark fermentation by ultrasound application alone and in combination with heat shock. Bioenergy Res. 2020, 13, 334–348. [Google Scholar] [CrossRef]
- Hernández, C.; Alamilla-Ortiz, Z.L.; Escalante, A.E.; Navarro-Díaz, M.; Carrillo-Reyes, J.; Moreno-Andrade, I.; Valdez-Vazquez, I. Heat-shock treatment applied to inocula for H 2 production decreases microbial diversities, interspecific interactions and performance using cellulose as substrate. Int. J. Hydrogen Energy 2019, 44, 13126–13134. [Google Scholar] [CrossRef]
- Dauptain, K.; Trably, E.; Santa-Catalina, G.; Bernet, N.; Carrère, H. Role of indigenous bacteria in dark fermentation of organic substrates. Bioresour. Technol. 2020, 313, 123665. [Google Scholar] [CrossRef] [PubMed]
- Nasirian, N.; Almassi, M.; Minaei, S.; Widmann, R. Development of a method for biohydrogen production from wheat straw by dark fermentation. Int. J. Hydrogen Energy 2011, 36, 411–420. [Google Scholar] [CrossRef]
- Toledo-Alarcón, J.; Cabrol, L.; Jeison, D.; Trably, E.; Steyer, J.-P.; Tapia-Venegas, E. Impact of the microbial inoculum source on pre-treatment efficiency for fermentative H2 production from glycerol. Int. J. Hydrogen Energy 2020, 45, 1597–1607. [Google Scholar] [CrossRef]
- Toledo-Alarcón, J.; Capson-Tojo, G.; Marone, A.; Paillet, F. Basics of Bio-Hydrogen Production by Dark Fermentation. In Bioreactors for Microbial Biomass and Energy Conversion; Springer: Berlin/Heidelberg, Germany, 2017; pp. 199–220. [Google Scholar]
- Sołowski, G.; Ziminski, T.; Cenian, A. A shift from anaerobic digestion to dark fermentation in glycol ethylene fermentation. Environ. Sci. Pollut. Res. 2021, 28, 15556–15564. [Google Scholar] [CrossRef]
- Hitit, Z.Y.; Hallenbeck, P.C. Analytical procedures, data reporting and selected reference values for biological hydrogen production. Biomass Bioenergy 2021, 147, 106014. [Google Scholar] [CrossRef]
- Rafieenia, R.; Girotto, F.; Peng, W.; Cossu, R.; Pivato, A.; Raga, R.; Lavagnolo, M.C. Effect of aerobic pre-treatment on hydrogen and methane production in a two-stage anaerobic digestion process using food waste with different compositions. Waste Manag. 2017, 59, 194–199. [Google Scholar] [CrossRef]
- Alibardi, L.; Cossu, R. Effects of carbohydrate, protein and lipid content of organic waste on hydrogen production and fermentation products. Waste Manag. 2016, 47, 69–77. [Google Scholar] [CrossRef]
- Sołowski, G.; Konkol, I.; Cenian, A. Perspectives of hydrogen production from corn wastes in Poland by means of dark fermentation. Ecol. Chem. Eng. S 2019, 26, 255–263. [Google Scholar] [CrossRef]
- Detman, A.; Mielecki, D.; Pleśniak, Ł.; Bucha, M.; Janiga, M.; Matyasik, I.; Chojnacka, A.; Jȩdrysek, M.O.; Błaszczyk, M.K.; Sikora, A. Methane-yielding microbial communities processing lactate-rich substrates: A piece of the anaerobic digestion puzzle. Biotechnol. Biofuels 2018, 11, 116. [Google Scholar] [CrossRef]
- Wu, Y.; Kovalovszki, A.; Pan, J.; Lin, C.; Liu, H.; Duan, N.; Angelidaki, I. Early warning indicators for mesophilic anaerobic digestion of corn stalk: A combined experimental and simulation approach. Biotechnol. Biofuels 2019, 12, 106. [Google Scholar] [CrossRef] [PubMed]
- Lv, N.; Zhao, L.; Wang, R.; Ning, J.; Pan, X.; Li, C.; Cai, G.; Zhu, G. Novel strategy for relieving acid accumulation by enriching syntrophic associations of syntrophic fatty acid-oxidation bacteria and H2/formate-scavenging methanogens in anaerobic digestion. Bioresour. Technol. 2020, 313, 123702. [Google Scholar] [CrossRef] [PubMed]
- Bartacek, J.; Zabranska, J.; Lens, P.N.L. Developments and constraints in fermentative hydrogen production. Biofuels Bioprod. Biorefin. 2007, 1, 201–214. [Google Scholar] [CrossRef]
- Lee, K.S.; Lo, Y.C.; Lin, P.J.; Chang, J.S. Improving biohydrogen production in a carrier-induced granular sludge bed by altering physical configuration and agitation pattern of the bioreactor. Int. J. Hydrogen Energy 2006, 31, 1648–1657. [Google Scholar] [CrossRef]
- Wainaina, S.; Awasthi, M.K.; Sarsaiya, S.; Chen, H.; Singh, E.; Kumar, A.; Ravindran, B.; Awasthi, S.J.; Liu, T.; Duan, Y.; et al. Resource recovery and circular economy from organic solid waste using aerobic and anaerobic digestion technologies. Bioresour. Technol. 2020, 301, 122778. [Google Scholar] [CrossRef]
- Sołowski, G.; Pastuszak, K. Modelling of dark fermentation of glucose and sour cabbage. Heliyon 2021, 7, e07690. [Google Scholar] [CrossRef]
- D’ippolito, G.; Squadrito, G.; Tucci, M.; Esercizio, N.; Sardo, A.; Vastano, M.; Lanzilli, M.; Fontana, A.; Cristiani, P. Electrostimulation of hyperthermophile Thermotoga neapolitana cultures. Bioresour. Technol. 2021, 319, 124078. [Google Scholar] [CrossRef]
- Cremonez, P.A.; Teleken, J.G.; Weiser Meier, T.R.; Alves, H.J. Two-Stage anaerobic digestion in agroindustrial waste treatment: A review. J. Environ. Manag. 2020, 281, 111854. [Google Scholar] [CrossRef]
- Sarkar, O.; Rova, U.; Christakopoulos, P.; Matsakas, L. Influence of initial uncontrolled pH on acidogenic fermentation of brewery spent grains to biohydrogen and volatile fatty acids production: Optimization and scale-up. Bioresour. Technol. 2021, 319, 124233. [Google Scholar] [CrossRef]
- Rajesh Banu, J.; Ginni, G.; Kavitha, S.; Yukesh Kannah, R.; Adish Kumar, S.; Bhatia, S.H.; Kumar, G. Integrated biorefinery routes of biohydrogen: Possible utilization of acidogenic fermentative effluent. Bioresour. Technol. 2021, 319, 124241. [Google Scholar] [CrossRef]
- Domański, J.; Marchut-Mikołajczyk, O.; Cieciura-Włoch, W.; Patelski, P.; Dziekońska-Kubczak, U.; Januszewicz, B.; Zhang, B.; Dziugan, P. Production of methane, hydrogen and ethanol from Secale cereale L. straw pretreated with sulfuric acid. Molecules 2020, 25, 1013. [Google Scholar] [CrossRef] [PubMed] [Green Version]
- Chojnacka, A.; Szczęsny, P.; Błaszczyk, M.K.; Zielenkiewicz, U.; Detman, A.; Salamon, A.; Sikora, A. Noteworthy facts about a methane-producing microbial community processing acidic effluent from sugar beet molasses fermentation. PLoS ONE 2015, 10, e0128008. [Google Scholar] [CrossRef] [Green Version]
- Liu, C.; Luo, G.; Liu, H.; Yang, Z.; Angelidaki, I.; O-Thong, S.; Wang, W. CO as electron donor for efficient medium chain carboxylate production by chain elongation: Microbial and thermodynamic insights. Chem. Eng. J. 2020, 390, 124577. [Google Scholar] [CrossRef]
- Hassan, G.K.; Hemdan, B.A.; El-Gohary, F.A. Utilization of food waste for bio-hydrogen and bio-methane production: Influences of temperature, OLR, and in situ aeration. J. Mater. Cycles Waste Manag. 2020, 22, 1218–1226. [Google Scholar] [CrossRef]
- Sołowski, G.; Konkol, I.; Shalaby, M.; Cenian, A. Methane and hydrogen production from potato wastes and wheat straw under dark fermentation. Chem. Process Eng. 2021, 42, 3–13. [Google Scholar] [CrossRef]
- She, Y.; Hong, J.; Zhang, Q.; Chen, B.Y.; Wei, W.; Xin, X. Revealing microbial mechanism associated with volatile fatty acids production in anaerobic acidogenesis of waste activated sludge enhanced by freezing/thawing pretreatment. Bioresour. Technol. 2020, 302, 122869. [Google Scholar] [CrossRef]
- Murarka, A.; Dharmadi, Y.; Yazdani, S.S.; Gonzalez, R. Fermentative utilization of glycerol by Escherichia coli and its implications for the production of fuels and chemicals. Appl. Environ. Microbiol. 2008, 74, 1124–1135. [Google Scholar] [CrossRef] [Green Version]
- Sandriaty, R.; Priadi, C.; Kurnianingsih, S.; Abdillah, A. Potential of biogas production from anaerobic co-digestion of fat, oil and grease waste and food waste. E3S Web Conf. 2008, 67, 02047. [Google Scholar] [CrossRef] [Green Version]
- Sołowski, G.; Konkol, I.; Shalaby, M. Effect of rotten butter shock load on anaerobic digestion of chicken manure. agriTECH 2021, 41, 362. [Google Scholar] [CrossRef]
- Rafieenia, R.; Lavagnolo, M.C.; Pivato, A. Pre-treatment technologies for dark fermentative hydrogen production: Current advances and future directions. Waste Manag. 2018, 71, 734–748. [Google Scholar] [CrossRef]
- Frigon, J.C.; Mehta, P.; Guiot, S.R. Impact of mechanical, chemical and enzymatic pre-treatments on the methane yield from the anaerobic digestion of switchgrass. Biomass Bioenergy 2012, 36, 1–11. [Google Scholar] [CrossRef] [Green Version]
- Ponsá, S.; Gea, T.; Sánchez, A. Anaerobic co-digestion of the organic fraction of municipal solid waste with several pure organic co-substrates. Biosyst. Eng. 2011, 108, 352–360. [Google Scholar] [CrossRef] [Green Version]
- Li, Y.; Zhang, Q.; Deng, L.; Liu, Z.; Jiang, H.; Wang, F. Biohydrogen production from fermentation of cotton stalk hydrolysate by Klebsiella sp. WL1316 newly isolated from wild carp (Cyprinus carpio L.) of the Tarim River basin. Appl. Microbiol. Biotechnol. 2018, 102, 4231–4242. [Google Scholar] [CrossRef] [PubMed]
Figure 1.
Scheme of Fermentation setups used in the experiment [56] (Reproduced with permission from Sołowski Heliyon Elsevier 2021).
Figure 1.
Scheme of Fermentation setups used in the experiment [56] (Reproduced with permission from Sołowski Heliyon Elsevier 2021).
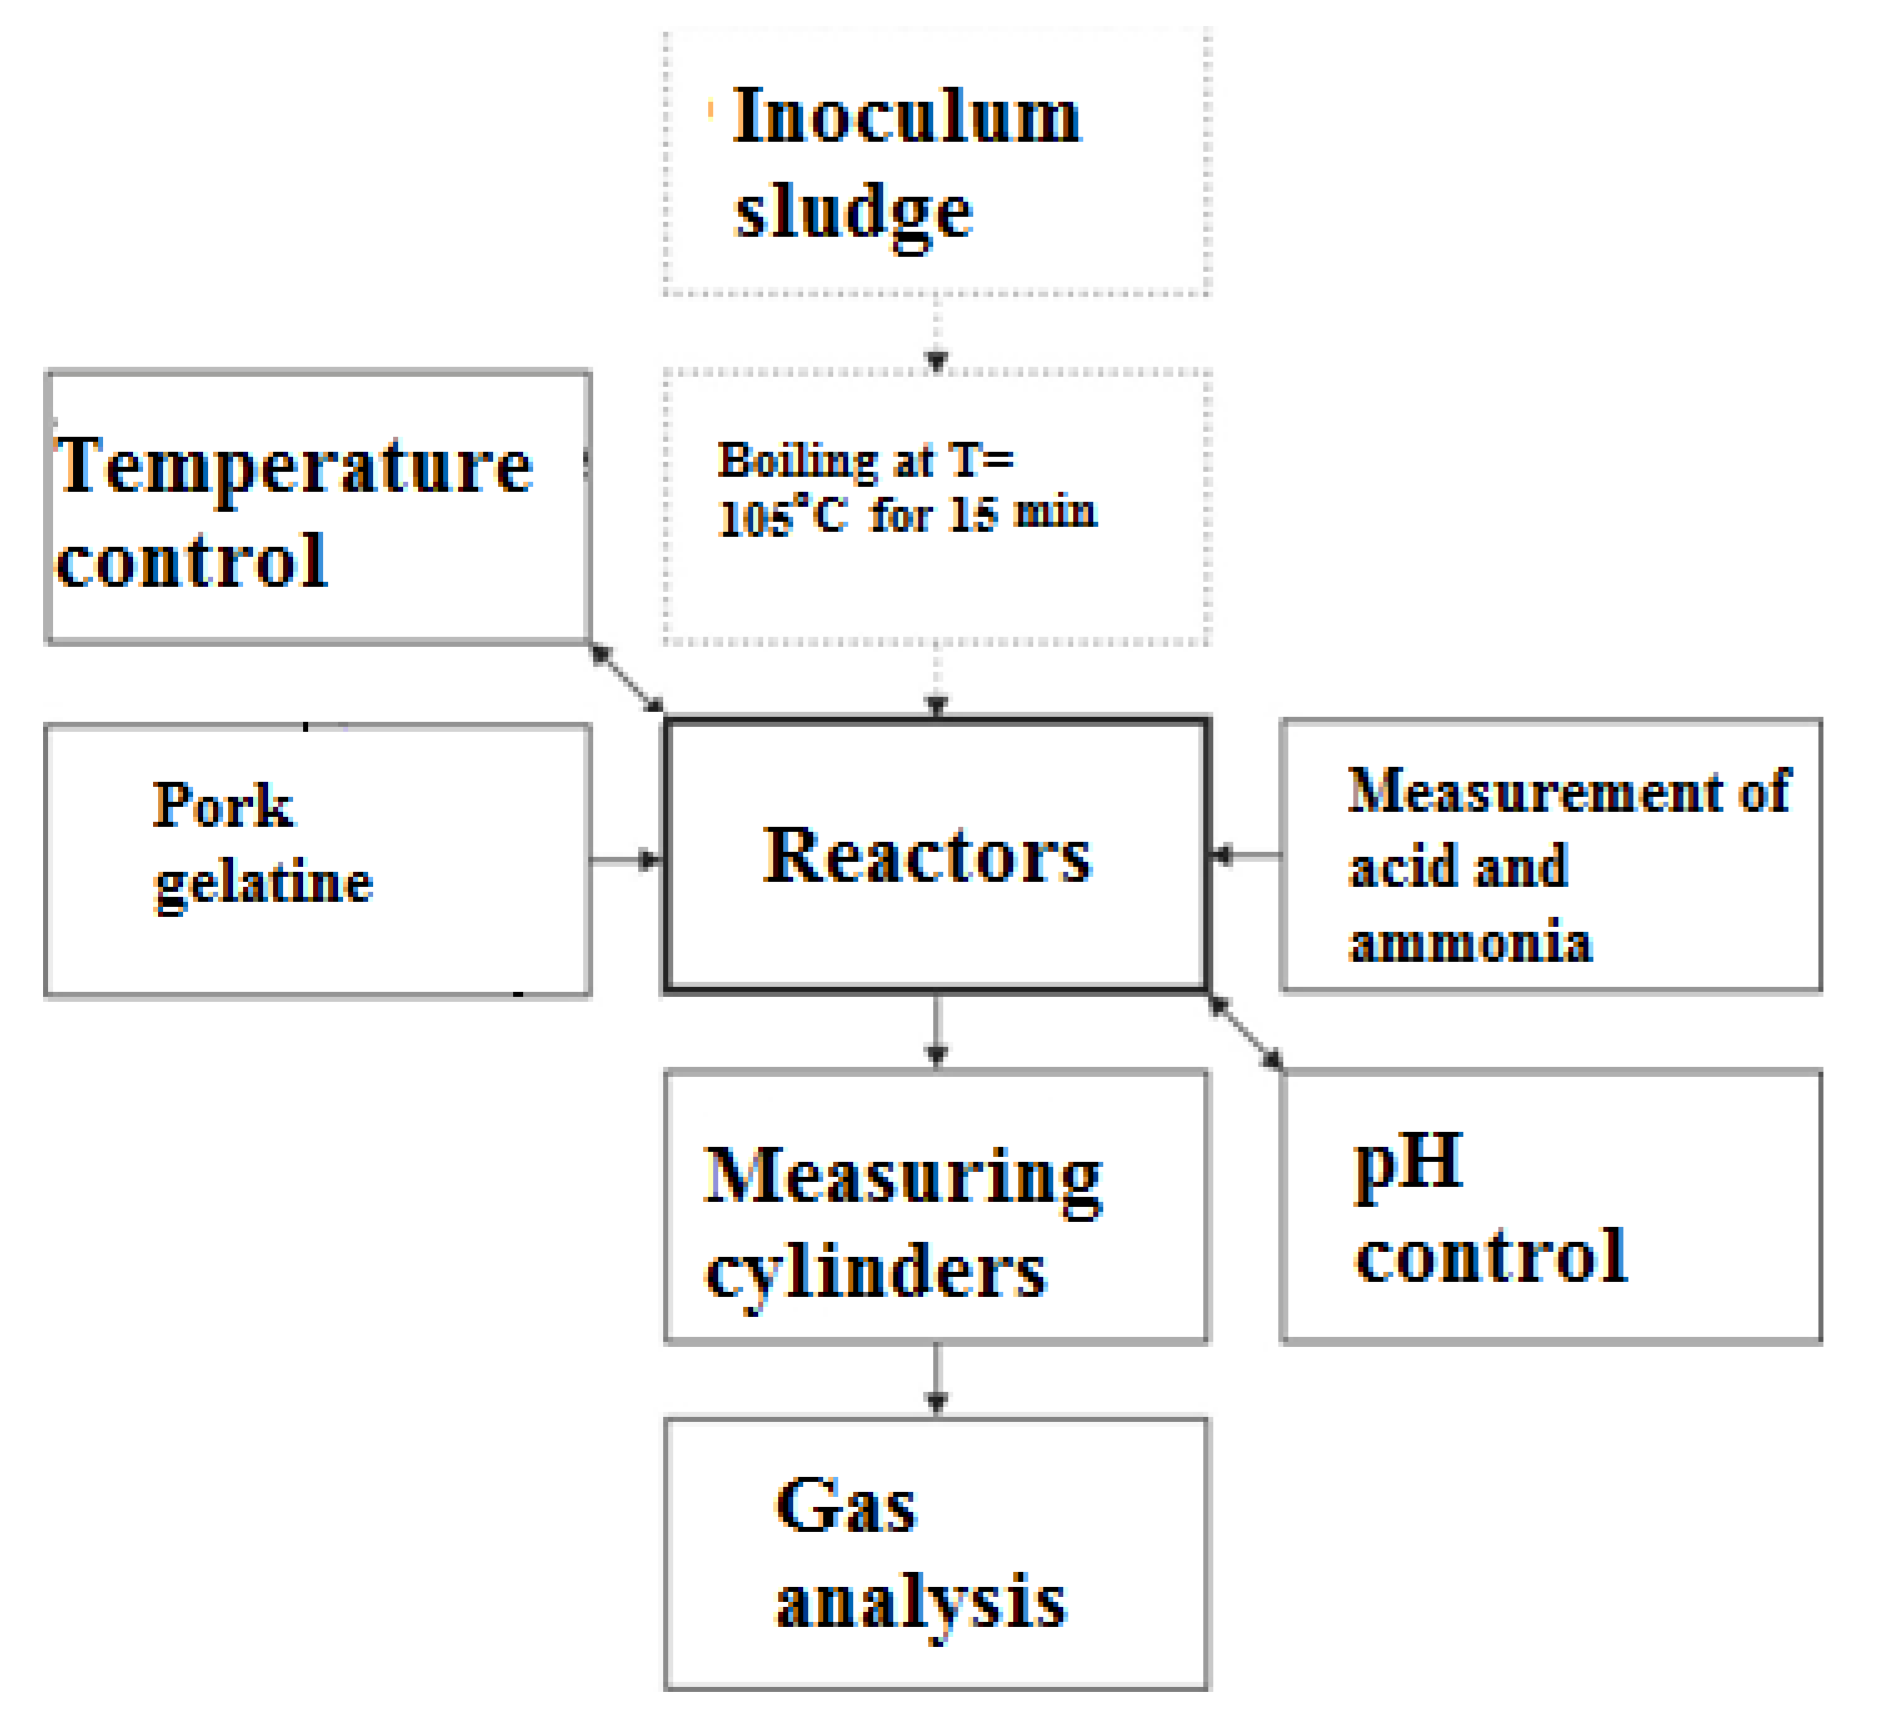
Figure 2.
Potential pathways of collagen digestion by DF and AD.

Figure 3.
Change of pH value of gelatine concentrations from 10 g VSS/L to 30 g VSS/L.

Figure 4.
Ammonia concentrations change at dark fermentation of gelatine concentrations from 10 g VSS/L to 30 g VSS/L after 55 days.
Figure 4.
Ammonia concentrations change at dark fermentation of gelatine concentrations from 10 g VSS/L to 30 g VSS/L after 55 days.

Figure 5.
Volatile acid concentrations after 55 days of anaerobic fermentation of gelatine concentrations from 10 g VSS/L to 30 g VSS/L.
Figure 5.
Volatile acid concentrations after 55 days of anaerobic fermentation of gelatine concentrations from 10 g VSS/L to 30 g VSS/L.

Figure 6.
Accumulated hydrogen production from gelatine in the first 20 days for gelatine concentrations from 10 g VSS/L to 30 g VSS/L.
Figure 6.
Accumulated hydrogen production from gelatine in the first 20 days for gelatine concentrations from 10 g VSS/L to 30 g VSS/L.

Figure 7.
Accumulated hydrogen yield from gelatine during 55 days for concentrations from 10 g VSS/L to 30 g VSS/L.
Figure 7.
Accumulated hydrogen yield from gelatine during 55 days for concentrations from 10 g VSS/L to 30 g VSS/L.

Figure 8.
Accumulated methane production yield in the first 20 days for gelatine concentration from 10 g VSS/L to 30 g VSS/L.
Figure 8.
Accumulated methane production yield in the first 20 days for gelatine concentration from 10 g VSS/L to 30 g VSS/L.

Figure 9.
Accumulated methane yield in the 55 days for gelatine concentration from 10 g VSS/L to 30 g VSS/L.
Figure 9.
Accumulated methane yield in the 55 days for gelatine concentration from 10 g VSS/L to 30 g VSS/L.

Figure 10.
Accumulated hydrogen sulphide emission from gelatine in the first 20 days for gelatine concentration from 10 g VSS/L to 30 g VSS/L.
Figure 10.
Accumulated hydrogen sulphide emission from gelatine in the first 20 days for gelatine concentration from 10 g VSS/L to 30 g VSS/L.

Figure 11.
Accumulated hydrogen sulphide emission from gelatine in all 55 days for gelatine concentration from 10 g VSS/L to 30 g VSS/L.
Figure 11.
Accumulated hydrogen sulphide emission from gelatine in all 55 days for gelatine concentration from 10 g VSS/L to 30 g VSS/L.

Figure 12.
Ratio of total hydrogen to hydrogen sulphide ratio in all 55 days for gelatine concentration from 10 g VSS/L to 30 g VSS/L.
Figure 12.
Ratio of total hydrogen to hydrogen sulphide ratio in all 55 days for gelatine concentration from 10 g VSS/L to 30 g VSS/L.


Table 1.
Physicochemical characteristics of the inoculum and substrates used in various tests.
| Material | pH | C:N Ratio | TS [%FM] | VSS [%TS] |
|---|---|---|---|---|
| Inoculum | 7.6 | 10.53 | 1.09 ± 0.03 | 36.35 ± 1.02 |
| Collagen (pork gelatine) | - | 12.8 | 89 ± 0.03 | 96.5 ± 1.06 |
Table 2.
Characteristics of volatile acid contamination and determination of compounds.
| Technique and method: | Volatile acids contamination in sample using (GC-FID) |
| Equipment: | Gas chromatograph Thermo Scientific Trace 1300 |
| Analysis conditions: | Column: Rxi 5MS 60 m Gas carrier: helium Flow: 1.0 mL/min The temperature of injection: 250 °C Stream separation: 1:10 Detector FID: 300 °C Temperature program: from 40 °C (3 min)—20 °C/min to 300 °C −300 °C (5 min) |
| Sample preparation: | To sample (6 mL) sulphuric acid (VI) (drop 0.25 mL) and sodium chloride (100 mg), then extracted with tert-butyl-methyl ether (2 mL) |
| Technique and method: | Determination of compound in gas chromatograph with a mass spectrometer (GC-MS) |
| Equipment: | Gas chromatograph of firm Shimadzu GC-2010Plus |
| Analysis conditions: | Column: Rxi 5MS 60 m Gas carrier: helium Flow: 1.0 mL/min The temperature of injection: 250 °C Stream separation: 1:20 Detector MS: 210 °C Temperature program: from 50 °C (4 min)—20 °C/min to 300 °C–300 °C (5 min) |
| Sample preparation: | To sample (6 mL) sulphuric acid (VI) (drop 0.25 mL) and sodium chloride (100 mg), then extracted with tert-butyl-methyl ether (2 mL) |
Table 3.
Sulphur added with gelatine in samples and the ratio of sulphur converted in emitted hydrogen sulphide % and mass.
Table 3.
Sulphur added with gelatine in samples and the ratio of sulphur converted in emitted hydrogen sulphide % and mass.
| Mass of Gelatine Added [g VSS/L] | Mass of Sulphur in Added Gelatine [g VSS/L] | The Percentage of Sulphur Converted in Emitted H2S% | Mass Converted to Gas% |
|---|---|---|---|
| 10 | 0.0203 | 46.402 | 3.2 |
| 15 | 0.031 | 107.59 | 4.66 |
| 20 | 0.041 | 96.41 | 5.15 |
| 30 | 0.06 | 26.1 | 8 |
Table 4.
Comparison of hydrogen and methane yield from gelatine and substrates found in articles.
| Substrate | Hydrogen Yield [mL/gVSS] | Accumulated Hydrogen Production [mL] | Methane Yield [L/gVSS] | Accumulated Methane Production [L] | Hydrogen Sulphide Yield [mL/gVSS] | Accumulated Hydrogen Sulphide Emission [mL] | Reference |
|---|---|---|---|---|---|---|---|
| Pork gelatine 30 g | 2.14 | 64.21 | 1.63 | 48.97 | 0.44 | 12.53 | This study |
| Pork gelatine 20 g | 7.36 | 147.2 | 2.86 | 57.23 | 1.53 | 30.6 | This study |
| Pork gelatine 15 g | 6.12 | 91.77 | 3.47 | 52 | 1.2 | 18.5 | This study |
| Pork gelatine 10 g | 7.65 | 76.47 | 3.49 | 34.88 | 1.03 | 10.3 | This study |
| Rapeseed oil 15 g VSS/L | 0.007 | 0.11 | [99] | ||||
| Glycerol 10 g VSS/L | 0.08 | 0.8 | [100] | ||||
| Cow manure with food wastes (butter mixture, palm oil, meat, and margarine) of ratio 1:8 | 0.31 | 3.1 | [101] | ||||
| Chicken manure with rotten butter Oxygen Flow Rate 1.4 mL/h butter 30 g VSS/L | 2.6 | 8 | 0.83 | 25 | 0.05 | 1.5 | [102] |
| Lipid waste 1.67 g VSS/L (tuna 7.5% butter 22.3%, apple 27%, banana 27%, chicken breast 7.5%, bread 1.5%, pasta 1.5%, minestrone soup 5.5%) | 27.93 | 46.64 | 0.26 | 0.43 | [103] | ||
| Protein waste 1.67 g VSS/L (tuna 31.1% butter 5.5%, apple 7.85%, banana 7.85%, chicken breast 31.1%, bread 3.2%, pasta 3.2%, minestrone soup 10.2%) | 8.02 | 13.4 | 0.35 | 0.58 | [103] | ||
| Switchgrass 5 g VSS/L | 0.26 | 1.5 | [104] | ||||
| The organic fraction of municipal solid waste 5 g VSS/L | 0.69 | 3.45 | [105] | ||||
| Cotton stalk hydrolysate 40 g VSS/L | 179 | 7160 | [106] |
Publisher’s Note: MDPI stays neutral with regard to jurisdictional claims in published maps and institutional affiliations. |
© 2022 by the author. Licensee MDPI, Basel, Switzerland. This article is an open access article distributed under the terms and conditions of the Creative Commons Attribution (CC BY) license (https://creativecommons.org/licenses/by/4.0/).
Share and Cite
MDPI and ACS Style
Sołowski, G. Microbial Biogas Production from Pork Gelatine. Hydrogen 2022, 3, 179-196. https://doi.org/10.3390/hydrogen3020012
AMA Style
Sołowski G. Microbial Biogas Production from Pork Gelatine. Hydrogen. 2022; 3(2):179-196. https://doi.org/10.3390/hydrogen3020012
Chicago/Turabian StyleSołowski, Gaweł. 2022. "Microbial Biogas Production from Pork Gelatine" Hydrogen 3, no. 2: 179-196. https://doi.org/10.3390/hydrogen3020012