Article

A Techno-Economic Assessment of Steam Methane Reforming and Alkaline Water Electrolysis for Hydrogen Production

by
Ching Cheng Chu
,
Muhammad Danial Suhainin
,
Dk Nur Hayati Amali Pg Haji Omar Ali
,
Jia Yuan Lim
,
Poh Serng Swee
,
Jerick Yap Raymundo
,
Ryan Xin Han Tan
,
Mei Kei Yap
,
Hsin Fei Khoo
,
Hazwani Suhaimi
* and
Pg Emeroylariffion Abas
*
Faculty of Integrated Technologies, Universiti Brunei Darussalam, Jalan Tungku Link, Gadong BE1410, Brunei
*
Authors to whom correspondence should be addressed.
Hydrogen 2025, 6(2), 23; https://doi.org/10.3390/hydrogen6020023
Submission received: 27 February 2025 / Revised: 14 March 2025 / Accepted: 16 March 2025 / Published: 30 March 2025

Abstract

:
This study explores hydrogen’s potential as a sustainable energy source for Brunei, given the nation’s reliance on fossil fuels and associated environmental concerns. Specifically, it evaluates two hydrogen production technologies; steam methane reforming (SMR) and alkaline water electrolysis (AWE), through a techno-economic framework that assesses life cycle cost (LCC), efficiency, scalability, and environmental impact. SMR, the most widely used technique, is cost-effective but carbon-intensive, producing considerable carbon dioxide emissions unless combined with carbon capture to yield “blue hydrogen”. On the other hand, AWE, particularly when powered by renewable energy, offers a cleaner alternative despite challenges in efficiency and cost. The assessment revealed that AWE has a significantly higher LCC than SMR, making AWE the more economically viable hydrogen production method in the long term. A sensitivity analysis was also conducted to determine the main cost factors affecting the LCC, providing insights into the long term viability of each technology from an operational and financial standpoint. AWE’s economic viability is mostly driven by the high electricity and feedstock costs, while SMR relies heavily on feedstock costs. However, Environmental Impact Analysis (EIA) indicates that AWE produces significantly higher carbon dioxide emissions than SMR, which emits approximately 9100 metric tons of carbon dioxide annually. Nevertheless, findings suggest that AWE remains the more sustainable option due to its higher LCC costs and compatibility with renewable energy, especially in regions with access to low-cost renewable electricity.

Graphical Abstract

1. Introduction

The increasing greenhouse gases (GHGs) in the atmosphere have led to worsening climate change, contributing to rising global temperatures and extreme weather events. This is primarily caused by carbon dioxide (CO2) emissions [1], primarily from fossil fuel combustion in the energy, industrial, and transportation sectors. A shift toward low-carbon and renewable energy sources is necessary, with various clean energy technologies having been explored, including solar energy [2], wind power [3], hydroelectricity [3], geothermal energy [4], biofuels [5], and energy harvesting [6] from various sources. Each of these alternative energy sources presents unique advantages in terms of sustainability, efficiency, and scalability, as well as challenges in terms of intermittency, infrastructure requirements, and economic feasibility. Among these alternatives, hydrogen has emerged as a promising solution by offering the potential to decarbonize key sectors such as transportation, industry, and power generation [7]. This is because, unlike conventional fossil fuels, hydrogen combustion does not produce CO2, making it an attractive option for reducing carbon footprints. However, the production of hydrogen itself commonly requires significant energy input, with its related environmental impact largely dependent on the method of production and energy source used.
Hydrogen production methods are commonly categorized using color codes: grey, blue, green, turquoise, and brown, as shown in Figure 1, to reflect their environmental impact, production process, and energy source. These classifications are based on carbon intensity and sustainability; hence, they play an important role in determining hydrogen’s potential in the transition toward a clean energy future.
Grey hydrogen is produced through steam methane reforming (SMR), a process that reacts to methane with steam to release hydrogen and carbon dioxide. This method is cost-effective and accounts for 95% of global hydrogen production; however, it is carbon-intensive and therefore unsustainable [9,10]. Blue hydrogen also uses SMR but incorporates Carbon Capture and Storage (CCS) technology to reduce carbon dioxide emissions by approximately 90% [11,12]. Despite this reduction, challenges such as methane leakage during natural gas extraction and CCS efficiency limitations remain [13]. Green hydrogen is synthesized through water electrolysis using renewable energy sources such as wind, solar, or hydropower. Therefore, it releases no direct carbon emissions, although it remains costly [14,15]. However, continuous research and economies of scale are expected to lower production costs over time [16]. Turquoise hydrogen is created by methane pyrolysis, where methane is split into hydrogen and solid carbon without emitting carbon dioxide [17,18]. Although still in the research phase, this method presents potential for low emissions and economic feasibility if solid carbon can be used effectively. Brown hydrogen (or black hydrogen) is obtained through the gasification of coal, which leads to high emissions of carbon dioxide. Due to its significant environmental impact, its utilization is declining as countries seek to reduce dependency on fossil fuels, though it remains relevant in regions with abundant coal deposits [19,20,21]. Shifting from grey hydrogen to blue and green hydrogen involves huge capital investments in technology and infrastructure, posing economic and legislative challenges [14,22,23]. Market conditions, investment decisions, public perception, and regulatory frameworks play key roles in this transition.
This study focuses on SMR and electrolysis, two of the most widely discussed hydrogen production methods. SMR is a widely used method due to its economic efficiency, whereas electrolysis, which utilizes electricity to split water into hydrogen and oxygen, offers a more sustainable option, especially when powered by renewable energy sources.
Generally, electrolysis consists of three main types: alkaline water electrolysis (AWE), proton exchange membrane (PEM) electrolysis, and solid oxide electrolyzer (SOE) electrolysis. Alkaline electrolyzers are relatively cheap to manufacture because they typically use non-precious metal catalysts such as nickel. Studies have also shown that approximately a 50% reduction in cost can be realized when steel-based nickel-coated electrodes are employed instead of pure nickel substrates [24]. AWE is thermally stable, operates at lower temperatures (60 to 80 °C), and is suitable for large-scale applications [25]. However, it has lower energy efficiency compared to newer electrolyzer types and is less compatible with dynamic renewable energy sources due to slow response times [26]. PEM electrolyzers can generate hydrogen at higher pressures and lower transient times than alkaline systems [27]. The electrolyte in PEM electrolyzers is a solid polymer membrane, which prevents gas crossover and ensures efficient ion transport [23,24,28]. However, PEM electrolyzers are expensive to fabricate because they use platinum or iridium-group metal catalysts, thus increasing overall costs [29]. Research is ongoing to develop alternative catalysts such as nickel and cobalt, which could reduce costs significantly [30]. SOE technology is based on solid oxide fuel cells (SOFCs) and operates at high temperatures. Operating at high temperatures eliminates the need for expensive catalysts, as materials exhibit higher conductivity under these conditions, reducing costs. However, the high operating temperatures cause material degradation, reducing lifespan and limiting its suitability for dynamic energy sources [31,32].
Among the three electrolysis methods, AWE is often regarded as the most practical choice for hydrogen production due to its cost-effectiveness, operational stability, and efficiency. AWE utilizes inexpensive metal catalysts, making it more affordable than PEM systems that rely on costly platinum and iridium. Additionally, AWE can operate effectively with lower-purity water sources, enhancing its practicality in various settings [33]. Compared to PEM systems, which require stringent operational conditions and are sensitive to power fluctuations, AWE exhibits greater durability. Although SOE technology offers high efficiency, its requirement for high temperature operation increases material degradation and operational costs. While PEM systems produce high purity hydrogen with rapid response times, their high material costs and complex infrastructure limit their scalability. In contrast, AWE provides the best balance between performance and affordability, making it the most viable option for hydrogen production at scale.
Given the economic advantages of SMRs and the sustainability benefits of AWEs, this study aims to assess and compare their feasibility for hydrogen production. Specifically, it seeks to provide valuable insights into hydrogen’s potential role as a clean energy alternative by assessing their economic feasibility and environmental impact. The mass and energy balance calculations developed in this study are based on standardized process data, ensuring that the framework is applicable beyond Brunei’s context. While the techno-economic assessment incorporates Brunei-specific economic parameters, the methodology remains adaptable to other regions by integrating region-specific cost structures, taxation policies, and subsidy impacts. By offering a structured approach to evaluating economic feasibility and environmental impact, the tools developed in this study can serve as a valuable framework for assessing hydrogen’s potential as a clean energy alternative across diverse regions.
Brunei Darussalam, an oil-rich country situated on the island of Borneo, relies heavily on fossil fuels to meet its energy demands. Despite its abundant fossil fuel resources, the country recognizes the environmental challenges associated with this dependency, particularly the emission of GHG and their contribution to climate change. As part of its commitment to sustainability and energy diversification, Brunei is actively exploring cleaner energy alternatives, with hydrogen emerging as a key candidate for achieving its long-term energy transition goals.

2. Materials and Methods

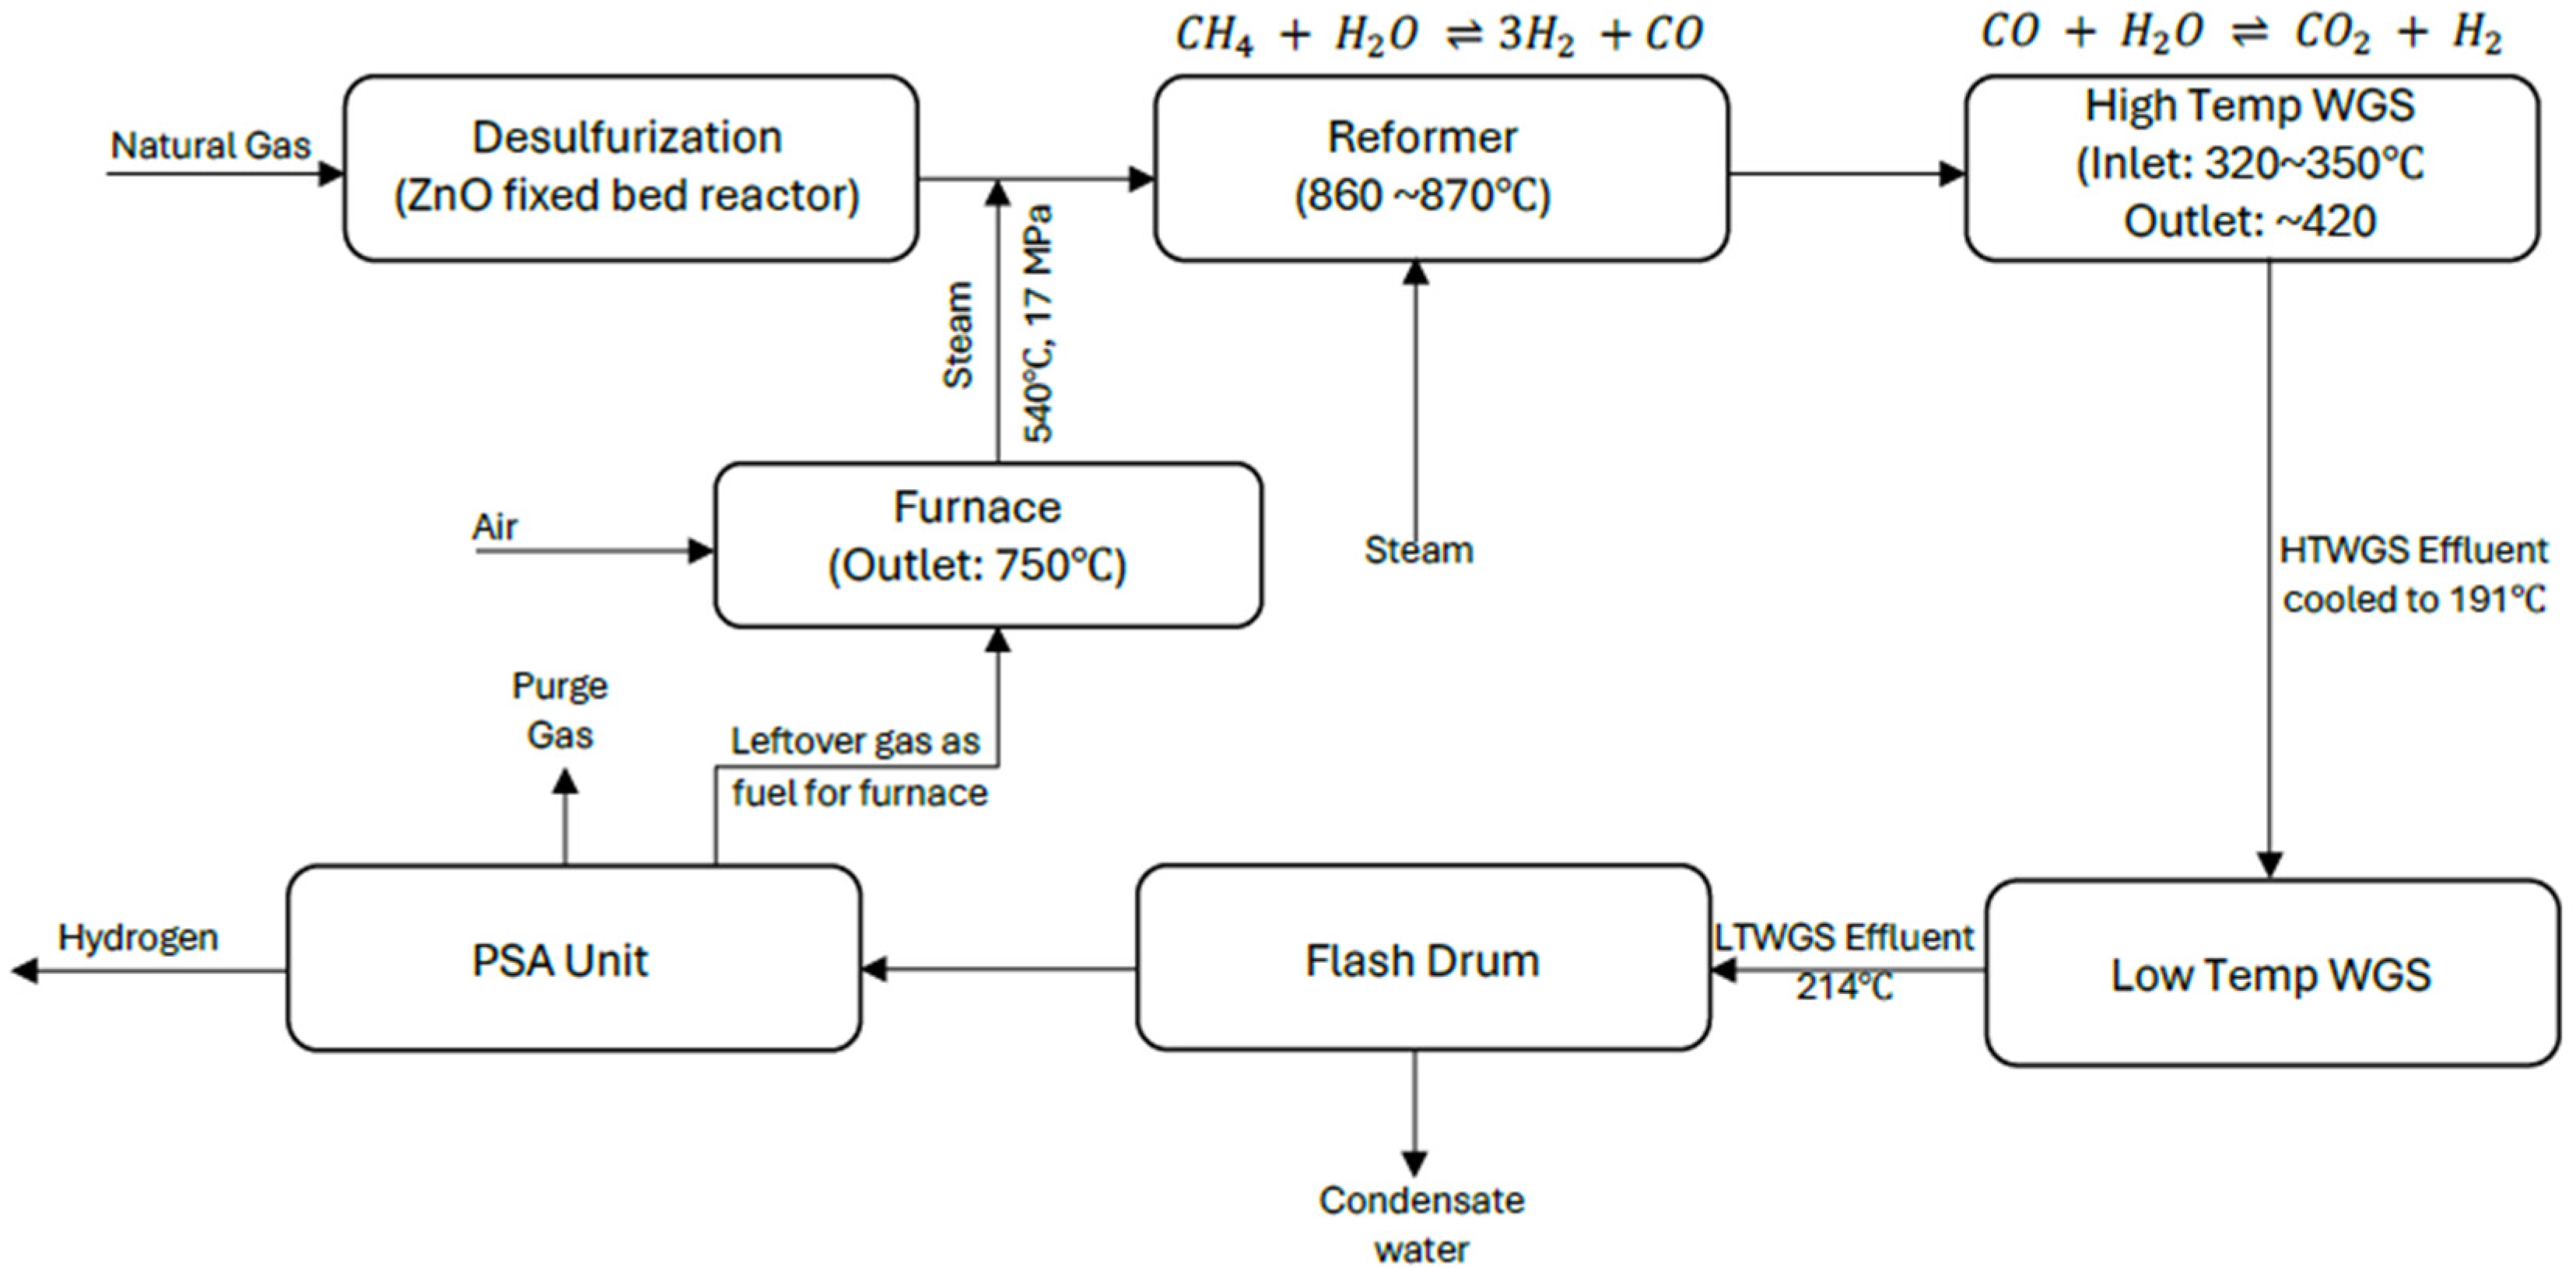
2.1. Overview of Steam Methane Reforming

SMR, also known as natural gas steam reforming, is the most prevalent method for hydrogen production, accounting for over half of global hydrogen output [34]. As depicted in Figure 2, the process begins with natural gas input, which typically contains 85–90% methane [35]. The gas is first directed to a desulfurization unit, where impurities, such as sulfur compounds, are removed using a zinc oxide (ZnO)-lined fixed-bed reactor. This desulfurization process is crucial for protecting the nickel-based catalyst, which is used during the reforming reaction, and ensuring optimal process efficiency. The next stage involves generating superheated steam, a critical component for the reforming reaction. Water is introduced into a furnace and heated to approximately 1500 °F (816 °C), producing steam at high temperatures. This superheated steam enhances the efficiency of hydrogen extraction from methane by creating optimal conditions for reforming reactions. Producing steam at such elevated temperatures ensures that the subsequent reactions proceed effectively, supporting large-scale hydrogen production.
The refined natural gas, combined with superheated steam, is then fed into the reformer. Inside the reformer, burners maintain temperatures exceeding 1500 °F (816 °C). Under these high temperature conditions and in the presence of the nickel-based catalyst, methane (CH4) reacts with steam (H2O) to produce hydrogen (H2) and carbon monoxide (CO),
C H 4 + H 2 O C O + 3 H 2
The nickel catalyst plays a crucial role in accelerating the reaction and maximizing hydrogen yield. This reaction is the cornerstone of the SMR process, generating a mixture rich in hydrogen and carbon monoxide, which is further processed to extract additional hydrogen and remove impurities. After leaving the reformer, the hydrogen-rich gas mixture is directed into a sequence of Water Gas Shift (WGS) reactors to further enhance hydrogen production. In the high temperature WGS reactor, carbon monoxide (CO) reacts with steam (H2O) in the presence of a nickel-based catalyst, producing additional hydrogen (H2) while reducing CO levels,
C O + H 2 O C O 2 + H 2
The gas mixture then enters a low-temperature WGS reactor, where the same reaction occurs at lower temperatures, further lowering CO levels and generating even more hydrogen. This two-stage WGS reaction process significantly boosts hydrogen yield, reduces carbon monoxide, and promotes a more environmentally friendly operation by converting CO into less harmful carbon dioxide (CO2). After leaving the low-temperature WGS reactor, the gas mixture enters a flash drum. This equipment is designed to remove condensable liquids, primarily water vapor, from the hydrogen-rich gas mixture. By isolating these condensates, the flash drum enhances the purity of the gas before its final purification stage. This step improves the efficiency of subsequent processes and ensures that only the necessary gaseous components remain in the mixture.
The hydrogen-rich gas is then routed to a Pressure Swing Adsorption (PSA) unit for final purification. In this stage, the gas mixture passes through a bed of adsorbent materials at high pressure, which traps impurities such as carbon dioxide, methane, and any residual carbon monoxide. The PSA unit allows the purified hydrogen to flow through while retaining the impurities. To regenerate the adsorbent material, the pressure in the PSA vessel is lowered, releasing the trapped impurities, which can then be vented or reused. The resulting hydrogen is prepared for storage or distribution, depending on its intended application. It can be liquefied for transportation or directly piped to end users. Residual methane and other gases are often recycled back into the furnace as a fuel source, improving overall process efficiency.
Despite its widespread use, SMR is a significant source of CO2 emissions, which has drawn attention to its carbon footprint amidst the global push toward renewable hydrogen solutions. To mitigate emissions, a low-carbon hydrogen generation method, known as “blue hydrogen”, can be achieved by integrating CCS technology into the SMR process [36] CCS can capture up to 90% of CO2 emissions, but it requires additional infrastructure expenses. Despite these challenges, SMR remains the dominant hydrogen production method due to its technological maturity and cost-effectiveness. However, alternative low-carbon technologies such as renewable-powered electrolysis (“green hydrogen”) are increasingly being explored [37].

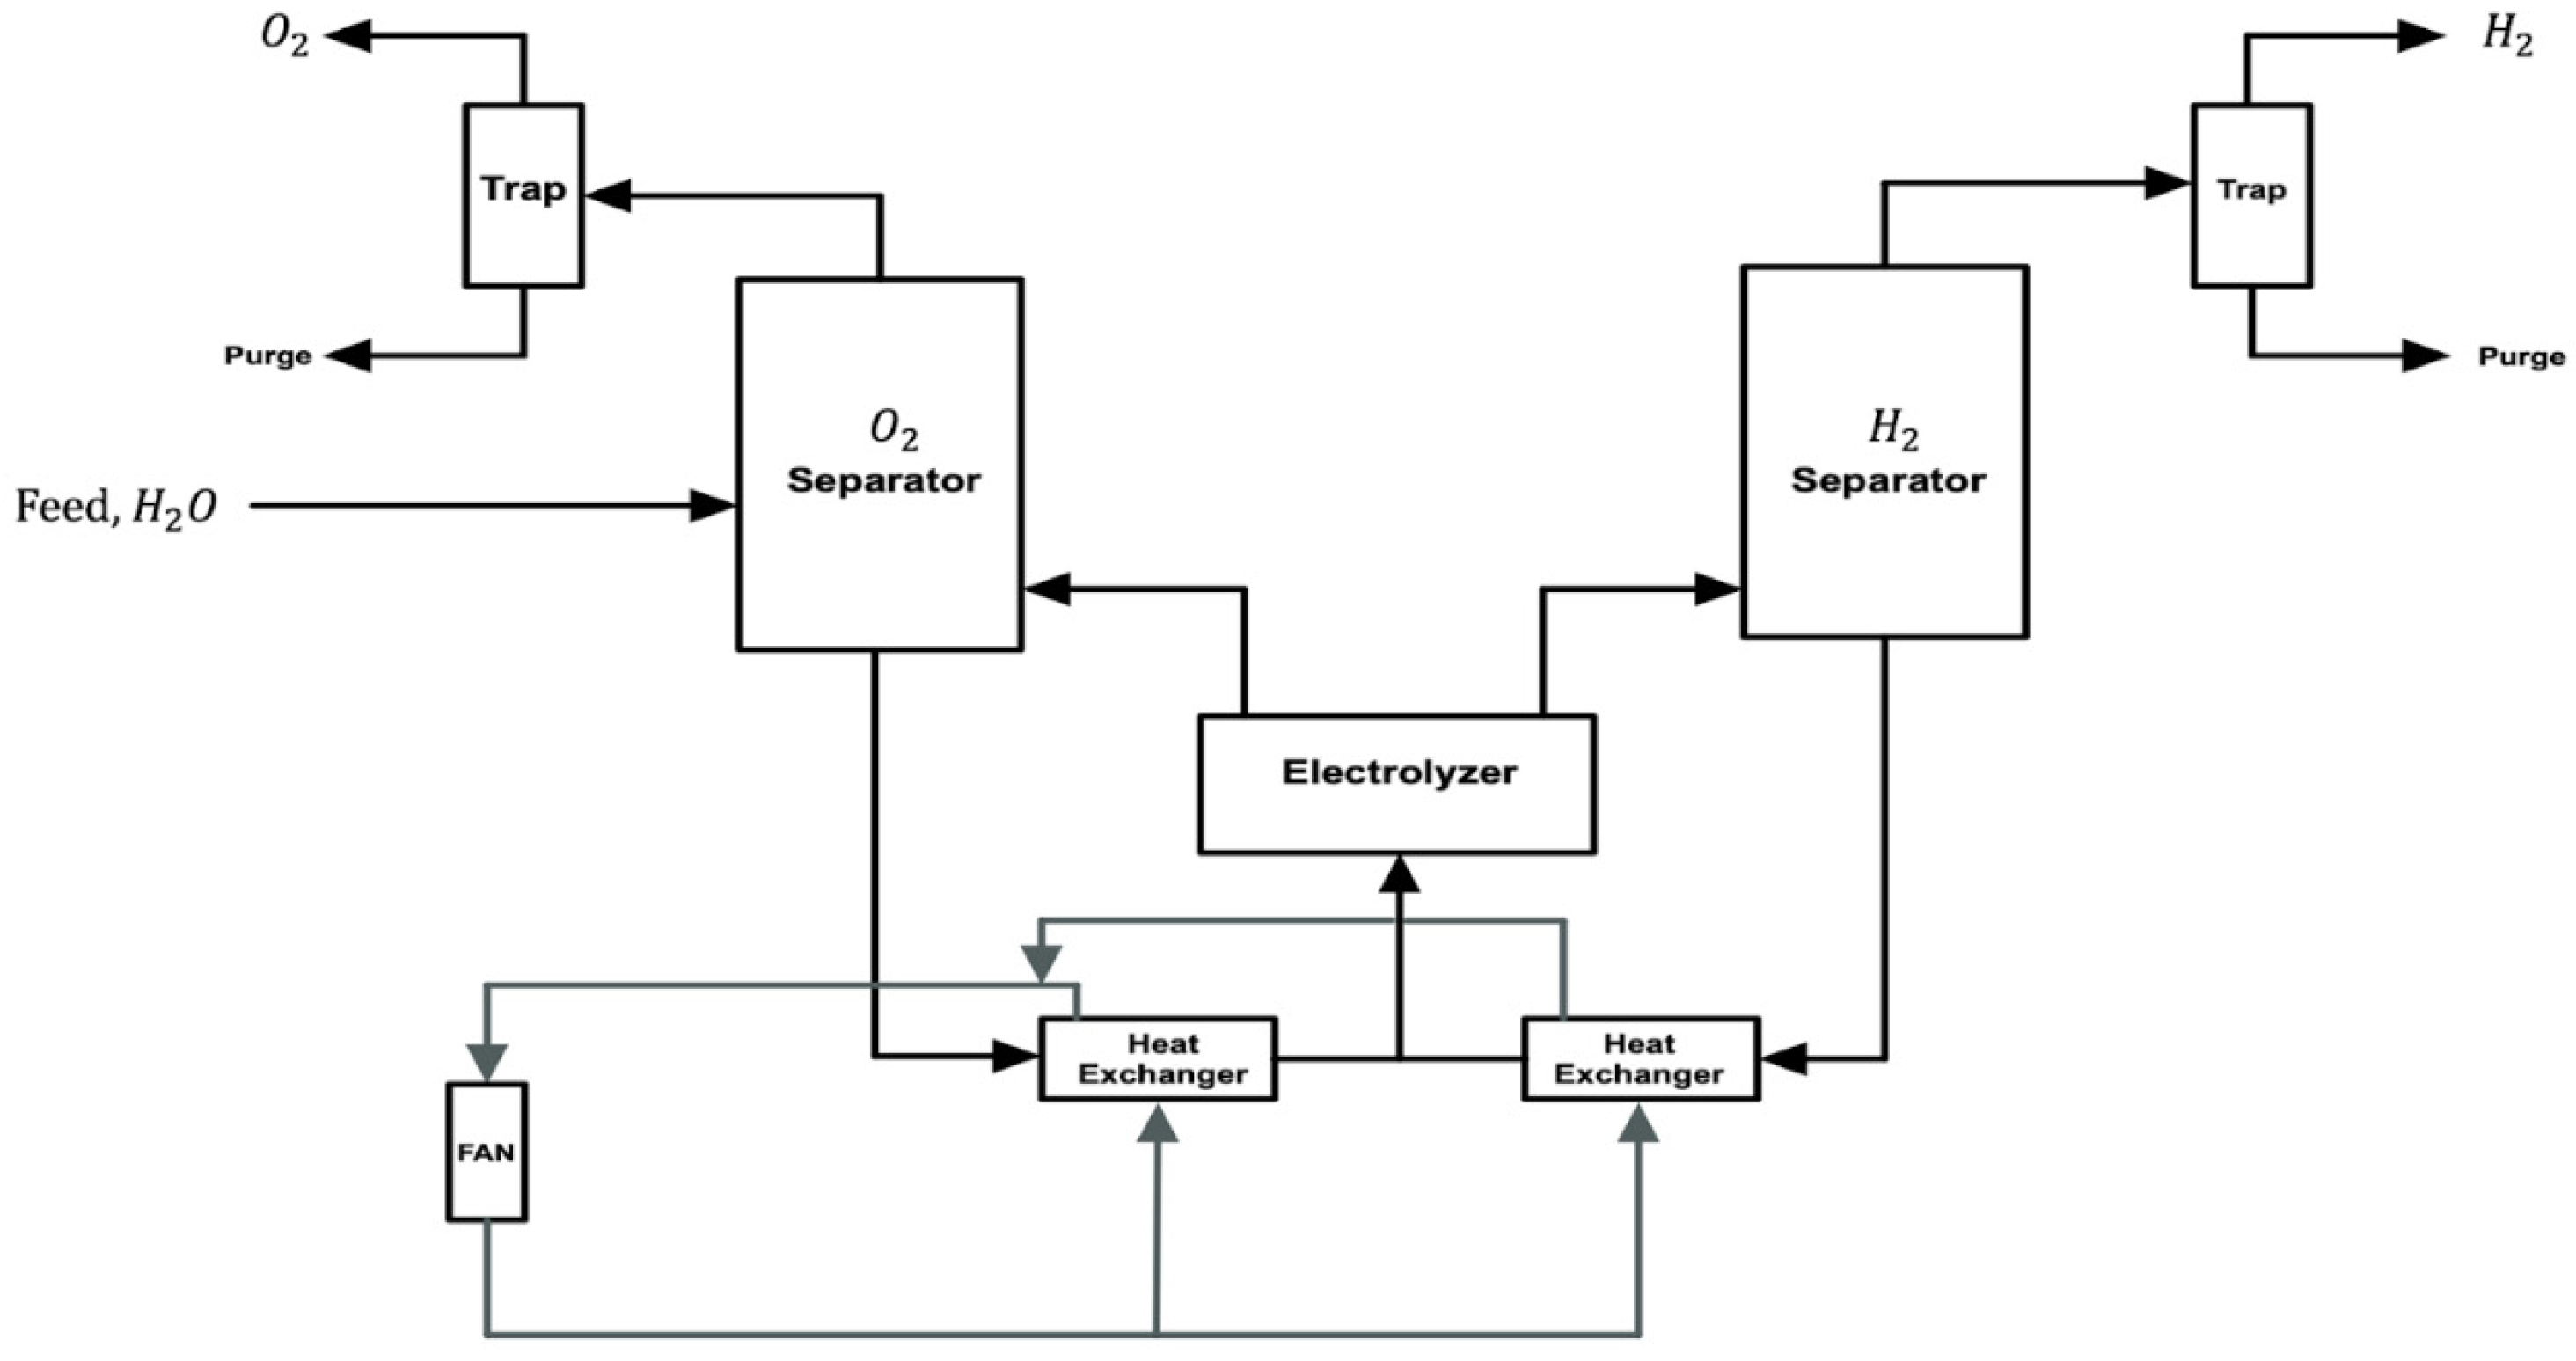
2.2. Overview of Alkaline Water Electrolysis

AWE is a widely used electrochemical process for hydrogen production through the decomposition of water. This process involves using an alkaline electrolyte, typically potassium hydroxide (KOH) or sodium hydroxide (NaOH), to facilitate the reaction. AWE operates by passing an electric current through water, causing its molecules to split into hydrogen and oxygen gases. As illustrated in Figure 3, water first enters the oxygen separator, where it aids in the separation of oxygen gas. Next, the water is mixed with KOH, forming an electrolyte solution composed of 35% KOH and 65% water. This mixture is then directed to a heat exchanger to cool down, preventing the electrolyzer stack from overheating and thus ensuring optimal performance and efficiency. Once cooled, the mixture enters the electrolyzer stack, which consists of approximately 313 cells, with each cell made up of two electrodes: a cathode and an anode. Within the stack, hydrogen and oxygen gases are produced through the electrolysis process.
The AWE process is governed by two key reactions occurring at the cathode and anode. At the cathode, a reduction reaction occurs; water molecules gain electrons to form hydrogen gas and hydroxide ions,
2 H 2 O + 2 e H 2 + 2 O H
The hydrogen gas leaves the electrolyzer stack, while the hydroxide ions migrate toward the anode. Conversely, an oxidation reaction occurs at the anode; hydroxide ions lose electrons to form oxygen gas and water, as indicated in Equation (4). The oxygen gas is subsequently separated and purified.
4 O H 2 H 2 O + O 2 + 4 e
The overall electrolysis reaction represents the complete splitting of water molecules into hydrogen and oxygen gases,
2 H 2 O 2 H 2 + O 2
During the electrolysis process, hydrogen gas is generated at the cathode, while oxygen forms at the anode. The two compartments are separated by a diaphragm, a specialized membrane that allows hydroxide ions (OH) to pass through while preventing the mixing of hydrogen and oxygen gases, ensuring a safe and efficient reaction environment. Once produced, the hydrogen gas exits the cathode side and is directed into the hydrogen separator, where it is separated from KOH and water. Similarly, the oxygen gas and any remaining water are transported into the oxygen separator.
In the oxygen separator, the mixture of oxygen gas, water, and KOH is separated. The oxygen gas, along with any water vapor, enters the oxygen trap, which removes moisture to yield pure and dry oxygen gas. Similarly, the hydrogen gas produced at the cathode enters the hydrogen separator, where any residual water vapor is removed, producing pure and dry hydrogen.

2.3. Mass and Energy Balance

2.3.1. Steam Methane Reforming

The mass balance equation for the SMR process is presented in Equation (6) and defines the total mass flow rate of hydrogen gas produced, m ˙ H 2 T . This is determined by the sum of the total molar flow rate of methane in the natural gas feed, n ˙ C H 4 N G , and the total molar flow rate of carbon monoxide entering the two-stage WGS reactor, represented by n ˙ C O H T S and n ˙ C O L T S . The efficiencies of the reformer and WGS reactors: η r e f o r m e r , η H T S , and η L T S , are considered in calculating the mass balance, together with the relative molecular weight of hydrogen, represented by M H 2 .
m ˙ H 2 T = 6 η r e f o r m e r n ˙ C H 4 N G M H 2 + 2 η H T S n ˙ C O H T S M H 2 + 2 η L T S n ˙ C O L T S M H 2
The energy balance equation for the SMR process, presented in Equation (7), represents the total system energy as Q ˙ s y s t e m . In this equation, n ˙ C O , n ˙ C H 4 , and n ˙ C O 2 represent the total molar flow rates of carbon monoxide, methane, and carbon dioxide, respectively, while m ˙ H 2 O denotes the mass flow rate of water. Additionally, Δ H C o , f o r m ,   Δ H C O 2 , f o r m , and Δ H H 2 O , f o r m correspond to the enthalpy of formation for carbon monoxide, carbon dioxide, and water, respectively. Similarly, Δ H C H 4 , c o m b Δ H H 2 O , c o m b , and Δ H C O , c o m b represent the enthalpy of combustion for methane, water, and carbon monoxide, respectively. Finally, L v H 2 O and η f u r n a c e denote the latent heat of vaporization of water and furnace efficiency, respectively.
Q ˙ s y s t e m = [ n ˙ C O Δ H C , f o r m n ˙ C H 4 Δ H C H 4 , c o m b + Δ H H 2 O , c o m b ] + [ ( n ˙ C O 2 Δ H C O 2 , f o r m   n ˙ C O Δ H C O , c o m b + Δ H H 2 O , c o m b ] + [ n ˙ C O 2 Δ H C O 2 , f o r m   n ˙ C O Δ H C O , c o m b + Δ H H 2 O , c o m b ] + L v H 2 O m ˙ H 2 O   + { η f u r n a c e [ n ˙ C O 2 ( Δ H C O 2 , f o r m + 2 Δ H H 2 O , f o r m )   n ˙ C H 4 Δ H C H 4 , c o m b ] }
For a detailed step-by-step derivation of the mass and energy balance equations for the SMR process, readers are directed to the Supplementary Material S1.

2.3.2. Alkaline Water Electrolysis

The mass balance equation for the AWE process is presented in Equation (8). In this equation, the input mass flow rate, represented by m ˙ i n p u t , refers to the water entering the system. The electrolyzer stack efficiency is denoted by λ , while the KOH electrolyte composition is represented by ε . Additionally, m ˙ i n m ˙ O 2 , and m ˙ H 2 correspond to the mass flow rates entering the stack electrolyzer, the oxygen separator, and the hydrogen separator, respectively. Furthermore, the efficiencies of the oxygen and hydrogen separators are denoted as ρ O 2 , s e p and ρ H 2 , s e p , respectively.
m ˙ i n p u t = λ 1 ε m ˙ i n m ˙ O 2 32 1 ρ O 2 , s e p 1 × 18 m ˙ H 2 2 1 ρ H 2 , s e p 1 × 18
The energy balance of the AWE process is crucial, as it provides insights into the energy required to produce hydrogen. This study focuses on the final derived mathematical model at the electrolyzer stack, where the primary water-splitting reaction occurs. In Equation (9), the energy produced by the stack is represented as Q ˙ S t a c k , while α denotes the extent of reaction. The term H r corresponds to the energy required for the electrolysis process within the stack. Meanwhile, m ˙ H 2 O , r e a c t e d represents the mass flow rate of water consumed during the reaction. The temperature at which the fluid exits the stack and enters the hydrogen and oxygen separators is denoted as T B , C , while T r e f represents the reference temperature. Heat capacities of water, KOH, hydrogen, and oxygen are given by C p H 2 O ,   C p K O H ,   C p H 2 , and C p O 2 , respectively, while their respective mass flow rates are represented as m ˙ H 2 O , m ˙ K O H , m ˙ H 2 , and m ˙ O 2 , respectively. Streams A, B, and C refer to the inlet stream into the stack, the inlet stream into the hydrogen separator, and the inlet stream into the oxygen separator, respectively.
Q ˙ S t a c k = α ( H r m ˙ H 2 O , r e a c t e d + ( T B , C T r e f ) ) . { C p H 2 O m ˙ H 2 O , S t r e a m B + m ˙ H 2 O , S t r e a m C } + C p K O H m ˙ K O H , S t r e a m B + m ˙ K O H , S t r e a m C + C p H 2 m ˙ H 2 , S t r e a m B + C p O 2 m ˙ O 2 , S t r e a m C T S t r e a m A T r e f { m ˙ H 2 O , S t r e a m A C p H 2 O + m ˙ K O H , S t r e a m A C p K O H }
A detailed step-by-step derivation of the mass and energy balance equations for the AWE process is provided in the Supplementary Material S1.

2.4. Techno-Economic Analysis

Techno-economic analysis (TEA) assesses the financial feasibility of hydrogen production by evaluating process costs and conducting a quantitative financial analysis. In this study, life cycle cost (LCC) analysis is adopted to determine the total cost of a hydrogen production plant over its operational lifespan. LCC incorporates Net Present Value (NPV) principles, where the NPV of capital costs (CC), operating costs (OC), maintenance expenses (MC), and other expenditures are computed to account for the time value of money [38,39]. This approach enables a comparative assessment of SMR and AWE by considering the long term economic viability of the processes.

2.4.1. Net Present Value

NPV is an economic indicator used to evaluate profitability by calculating the present value of all cash flows associated with hydrogen production. It is expressed as
N P V = x 1 + D R t
where x represents cost components such as operating cost (OC), maintenance cost (MC), replacement cost (RC), feedstock cost (FC), and selling price (SP). The discount rate ( D R ) accounts for the time value of money, with t denoting the time interval between the current period and the point at which a particular cost or revenue is realized. For this study, the discount rate is set at 8% [40].

2.4.2. Life Cycle Cost

LCC analysis provides a comprehensive economic assessment of the total cost associated with a hydrogen production plant from construction to the end of its operational lifespan. This method accounts for all project expenses and revenue sources, including capital investment, operational expenses, maintenance, and replacement costs, as well as revenue generated from hydrogen and by-product sales. Unlike capital investment-focused evaluations, LCC considers total expenditures over the entire plant’s lifetime, offering deeper insights into cost-effectiveness and financial sustainability.
To better reflect the overall economic viability, the LCC formula has been modified so that a more positive LCC value indicates greater net profitability, with the modified LCC formula given by:
L C C = S P C C + O C + M C + R C + F C
where SP represents the NPV of revenue from hydrogen and by-product sales. CC, OC, MC, RC, and FC denote the NPV of capital, operating, maintenance, replacement, and feedstock costs, respectively, ensuring all expenditures are evaluated in present value terms. A higher LCC value signifies greater profitability over the lifetime of the plant.

Selling Price

The Selling Price (SP) represents the NPV of revenue generated from hydrogen sales and by-products, and it directly influences the economic potential of hydrogen production. Commonly, selling prices are influenced by market demand, production costs, and government incentives. For SMR, hydrogen is the sole revenue-generating product. In contrast, AWE benefits from dual revenue streams, as both hydrogen and oxygen sales contribute to total earnings, improving its economic viability. For this study, the preliminary selling prices of hydrogen and oxygen are set at USD 5.23 and EUR 3.14 per kilogram, respectively [41].

Capital Cost

The capital cost (CC) represents the NPV of the initial investment required to establish a hydrogen production facility. For SMR, expenses include all system components, such as reforming units, water-gas shift reactors, and CO2 separation systems, with a focus on machinery, piping, and electrical installations. In contrast, the cost of setting up an AWE facility includes electrolyzer stacks, balance-of-plant components, and electrical infrastructure. The need for high purity water and alkaline electrolytes in AWE systems increases capital expenses compared to SMR, as these systems require expensive materials and advanced equipment.

Operating Cost

Operating costs (OC) represent the NPV of recurring expenses incurred during regular plant operations. These include costs related to land, labor, supervision, utilities, laboratory analysis, instrumentation and control, as well as distribution and sale of hydrogen and by-products. In SMR, the primary operating costs stem from fuel expenses for methane reforming and the power required for compression and separation units. In contrast, AWE has higher operating costs due to its significant electricity consumption, which directly affects financial viability assessments.

Maintenance Cost

Maintenance costs (MC) represent the NPV of periodic servicing and upkeep expenses, ensuring the plant remains operational. In SMR, maintenance operations involve regular inspections of reformers, heat exchangers, and separation units. In AWE, maintenance expenses include the upkeep of electrolyzer stacks, pumps, and cooling systems, all of which degrade over time. While AWE typically has fewer core components than SMR, resulting in lower overall maintenance costs, the need for electrolyte replacement and the degradation of cells can negatively impact this metric.

Replacement Cost

Replacement costs (RC) represent the NPV of expenses related to replacing components that degrade over time. In SMR, reformers require periodic replacement of catalysts to maintain operational efficiency. For AWE, electrolyzer stacks also require periodic maintenance. In this analysis, it is assumed that stack replacements occur every 9 years due to electrolyte corrosion. As a result, plant owners must budget for these stack replacements every few years, which constitutes a significant portion of the lifecycle costs for AWE.

Feedstock Cost

Feedstock costs (FC) account for the NPV of raw material expenses required for hydrogen production. SMR relies on natural gas or methane, making feedstock costs highly sensitive to fluctuations in the market price of fossil fuels. In contrast, the feedstock for AWE includes deionized water combined with KOH, with costs primarily influenced by water purification and electrolyte costs. A significant advantage of AWE is its independence from hydrocarbons, which provides an operational edge in geographic regions where renewable power is available at low costs.

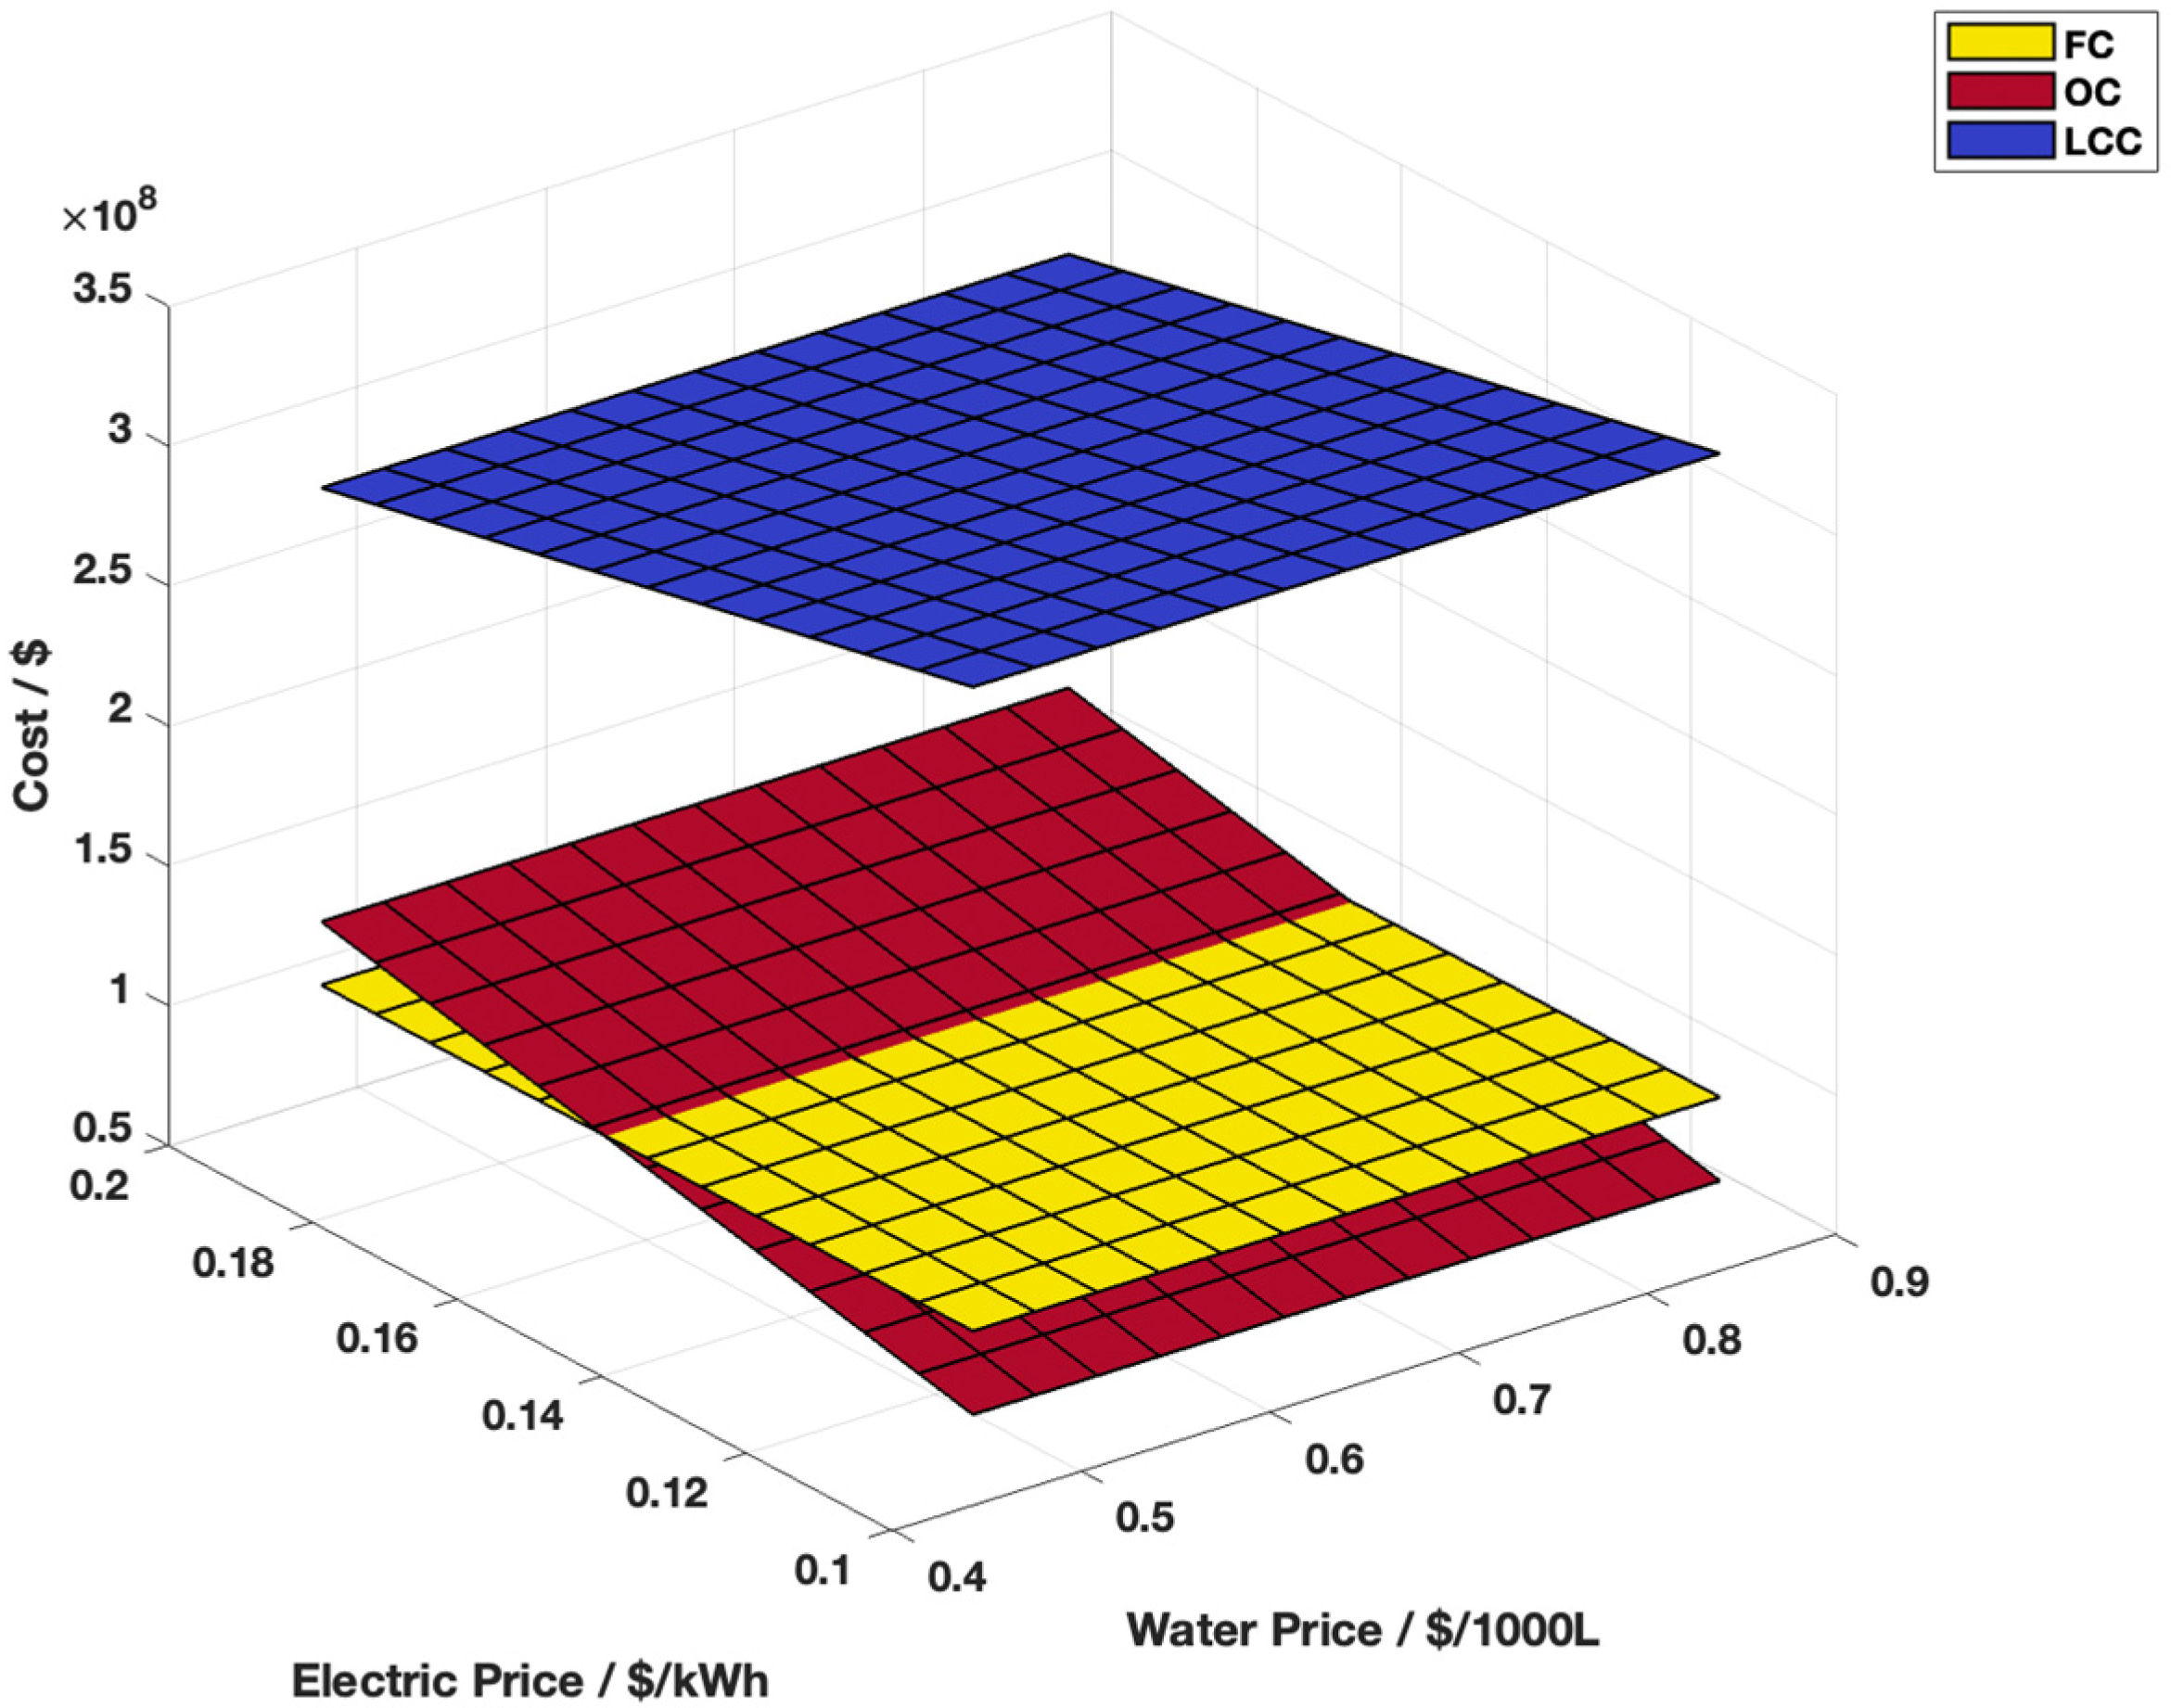
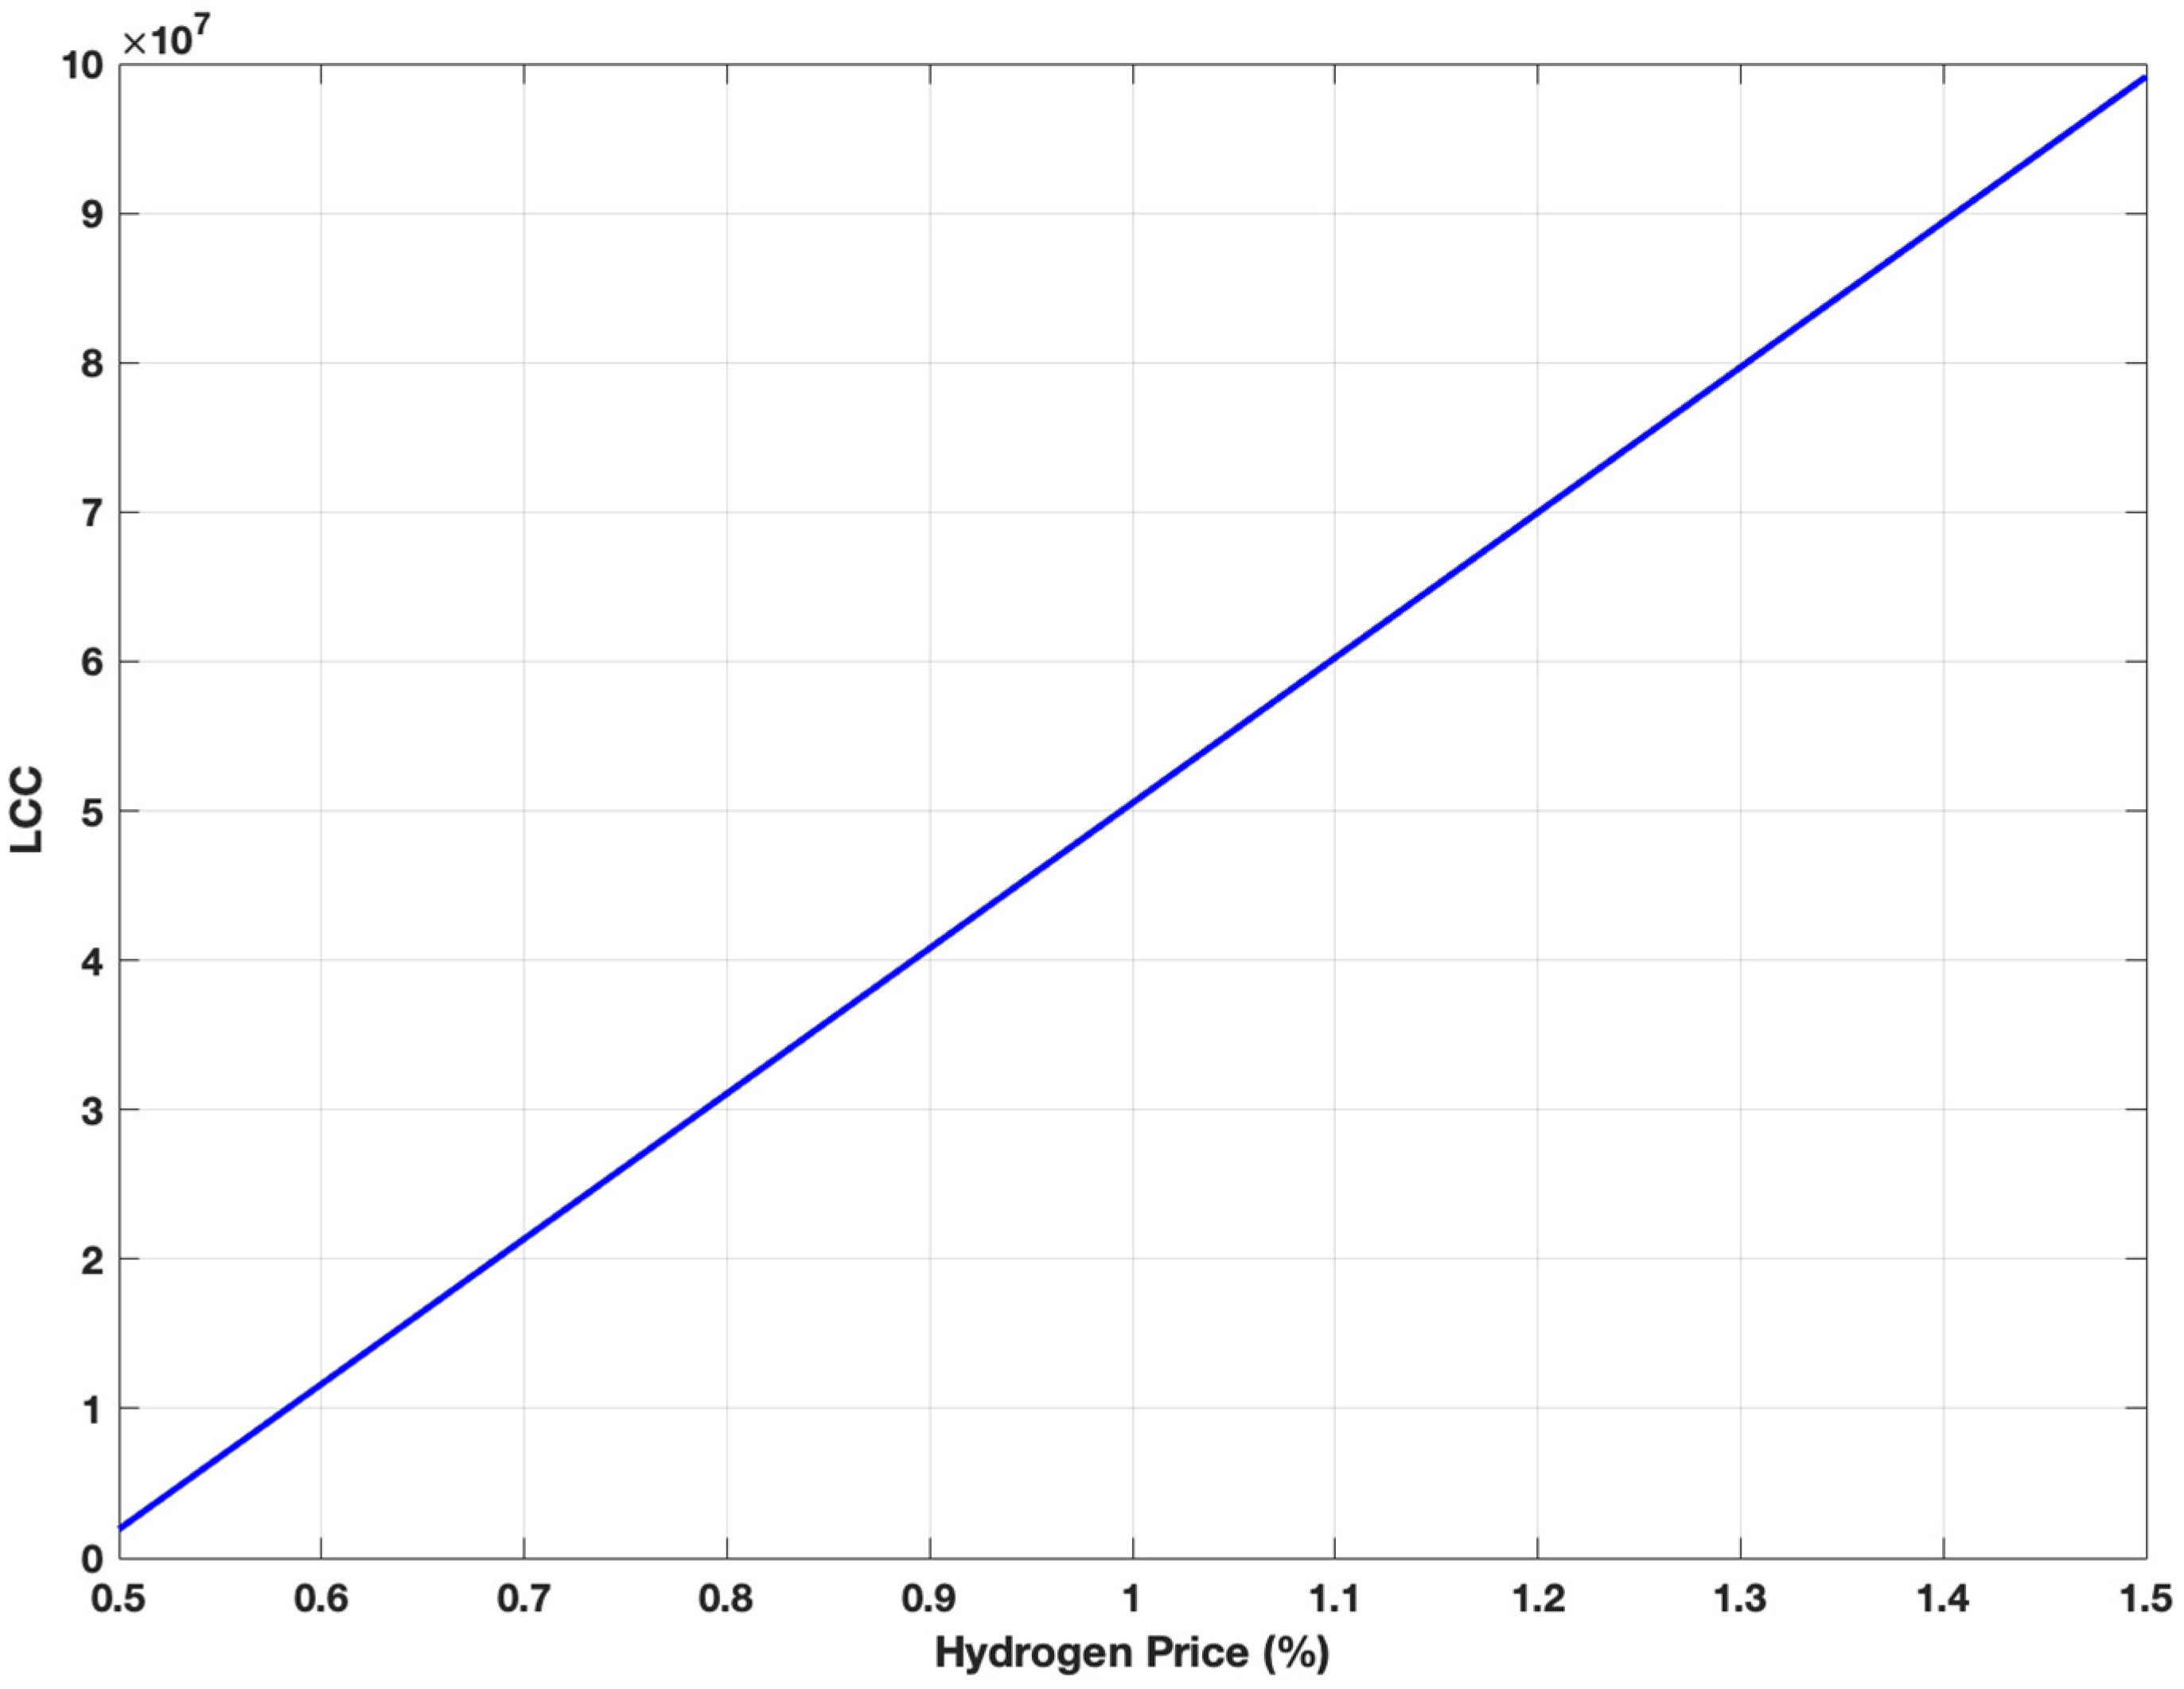
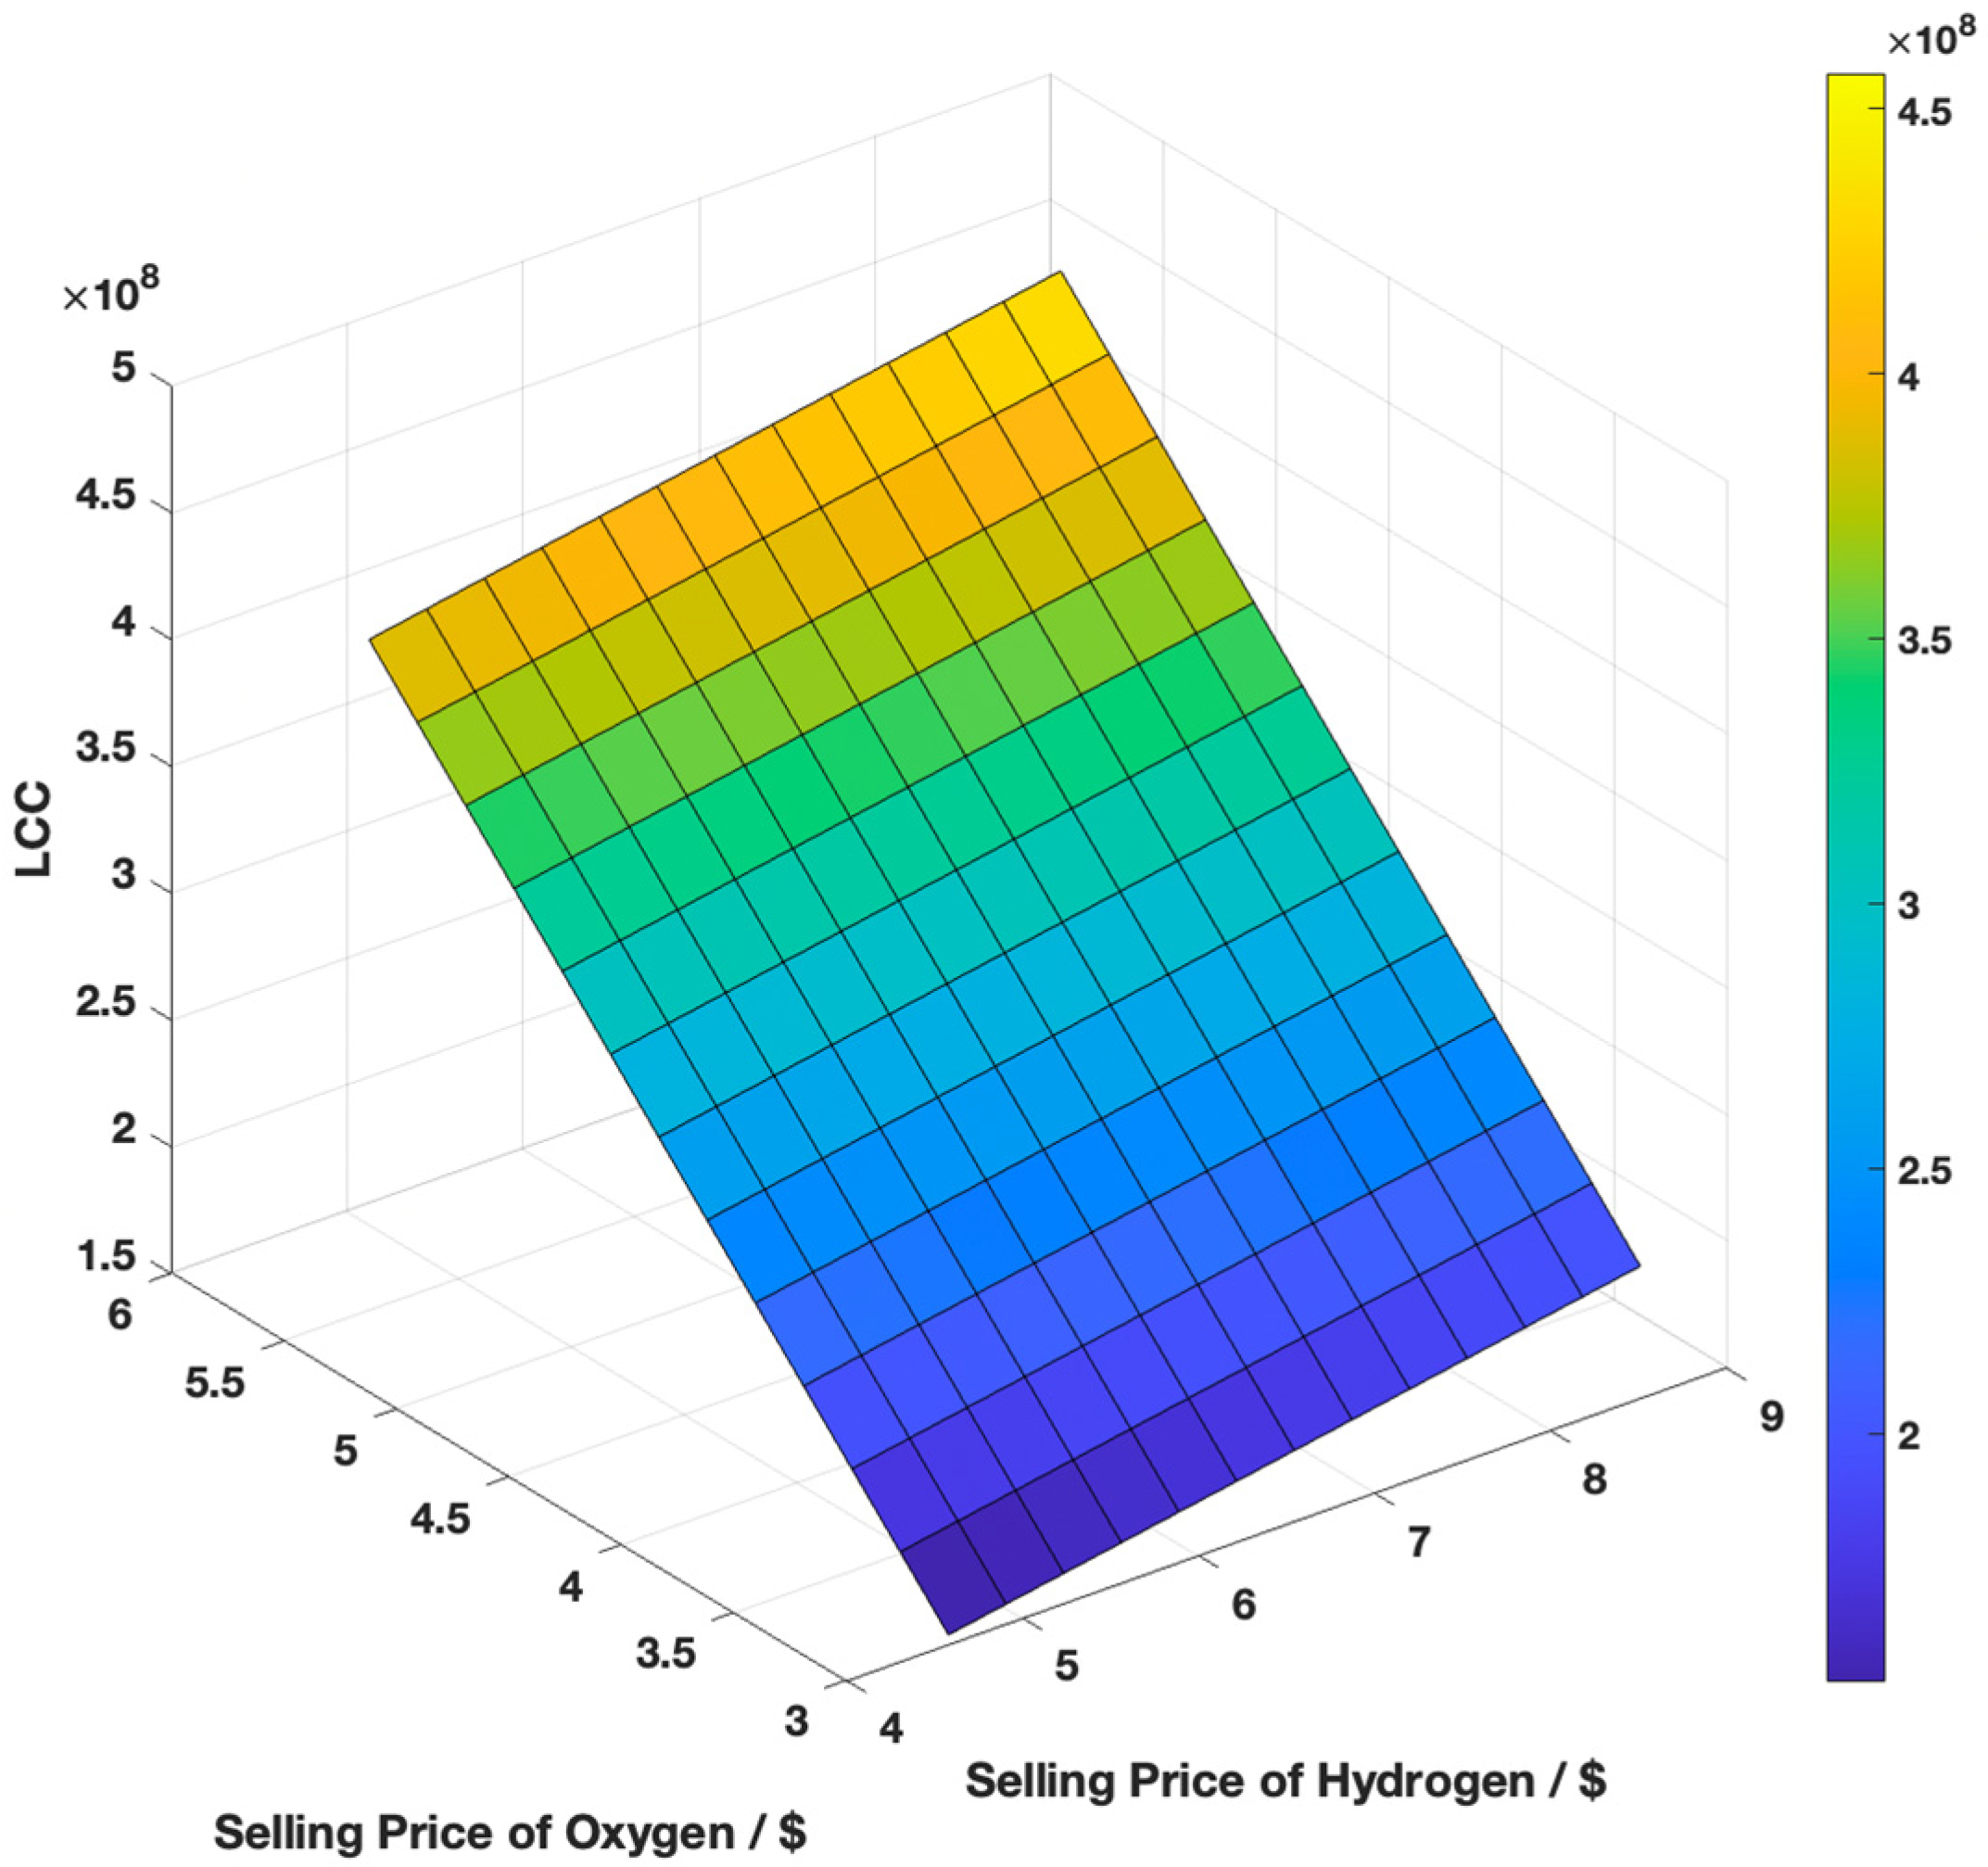
2.5. Sensitivity Analysis

This study conducts a sensitivity analysis to evaluate the impact of variations in key operational and economic factors on the feasibility of SMR and AWE. The analysis examines variations in discount rate, system efficiency, KOH concentration and price, water and electricity costs, as well as the selling price of hydrogen and its by-products.
The discount rate is a critical parameter as it determines the present value of future cash flows; a higher discount rate diminishes NPV, making long term investments less attractive. This study evaluates how different discount rates affect the economic feasibility of SMR and AWE, considering their distinct cost structures. System efficiency is another key factor, as higher efficiency reduces feedstock and energy consumption, resulting in lower operating expenses and increased profitability. In SMR, efficiency improvements decrease natural gas usage, while in AWE, increased efficiency reduces electricity and electrolyte consumption.
Additionally, KOH concentration and price were analyzed, as these directly influence operational costs of AWE. Changes in KOH electrolyte prices affect the LCC, as higher costs increase operational expenses, thereby impacting overall feasibility. Water and electricity costs are also critical factors in AWE’s cost structure. Electricity, in particular, represents the largest expense due to the high energy demands of the AWE system; higher electricity rates significantly increase operating expenses, weakening the competitiveness of AWE against SMR, which relies on natural gas.
Additionally, the impact of selling prices on economic viability was examined by evaluating fluctuations in hydrogen and by-product prices. Higher hydrogen prices improve project profitability, helping to offset AWE’s higher capital and operational expenses, particularly in markets with government incentives for green hydrogen. The sale of oxygen as a by-product provides an additional revenue stream for AWE, further enhancing its financial viability. Furthermore, AWE generates extra revenue by selling oxygen as a by-product.
This sensitivity analysis provides a data-driven basis for decision-making, allowing for a comparative evaluation of SMR and AWE under varying market conditions.

2.6. Environmental Impact Analysis

An Environmental Impact Assessment (EIA) was conducted to quantify GHG emissions from SMR and AWE, measured in CO2 equivalent (CO2-eq). This assessment considers direct emissions from fuel and feedstock combustion, as well as indirect emissions from electricity generation and transportation [42].
In SMR, the primary source of GHG emissions is the methane reforming process, which generates CO2 as a by-product. Additional emissions arise from fuel combustion required for the heating process. In contrast, the electricity source used for the electrolysis process is the primary factor influencing AWE emissions, with the carbon intensity of grid electricity determining its environmental footprint.
The electricity grid’s carbon intensity was accounted for when evaluating AWE’s emissions. Specifically, indirect emissions from electricity generation were included alongside direct emissions from fuel and feedstock combustion in SMR. Since Brunei’s electricity generation relies entirely on natural gas [43] industry standard CO2 equivalent factors based on natural gas emissions were used to estimate AWE’s carbon footprint. However, localized electricity generation data, such as distribution losses and generator efficiencies, were not explicitly considered, which presents a potential refinement for future studies.
By integrating industry standard CO2 equivalent factors, this study provides a comparative assessment of emissions from SMR and AWE systems, highlighting key factors influencing their environmental sustainability. The results offer insights into how grid electricity mix and fuel composition affect overall emissions, emphasizing the role of renewable energy adoption in minimizing electrolysis-related emissions.

3. Results and Discussion

3.1. Data Requirement

The parameters listed in Table 1 serve as the basis for this analysis. These values define the material and energy requirements of each process, directly influencing the techno-economic assessment, particularly in terms of cost estimation, energy efficiency, and environmental impact.
The feed in the SMR process refers to the hydrocarbon fuel, specifically natural gas or methane, which undergoes reforming to generate hydrogen. For SMR, the feed and water inputs of 384.11 kg/h and 834.98 kg/h, respectively, are required to generate 143.80 kg/h of hydrogen. Additionally, the process results in a CO2 purge gas output of 905.72 kg/h, which must be accounted for in emission assessments. A condensate output of 273.82 kg/h is also produced, which can be recovered and reused, potentially influencing overall process efficiency.
In contrast, AWE requires a significantly higher water input (2233.68 kg/h) along with a KOH electrolyte feed (1202.75 kg/h) to produce a nearly identical hydrogen output (143.70 kg/h). Unlike SMR, AWE also generates oxygen (1149.6 kg/h) as a valuable by-product, presenting opportunities for additional revenue generation. Efficiency parameters such as stack efficiency (0.579), hydrogen separation (0.90), and oxygen separation (0.95) define the effectiveness of AWE in converting electrical energy into hydrogen and oxygen. Additionally, the high trap efficiencies (0.99 for H2 and O2) indicate minimal gas losses.
A discounted interest rate of 8% was assumed in the economic analysis, with an operational plant lifetime of 20 years assumed for both SME and AWE. These parameters were utilized in the calculations in Table 2, which also includes the selling prices of by-products and by-product credits for both SMR and AWE.

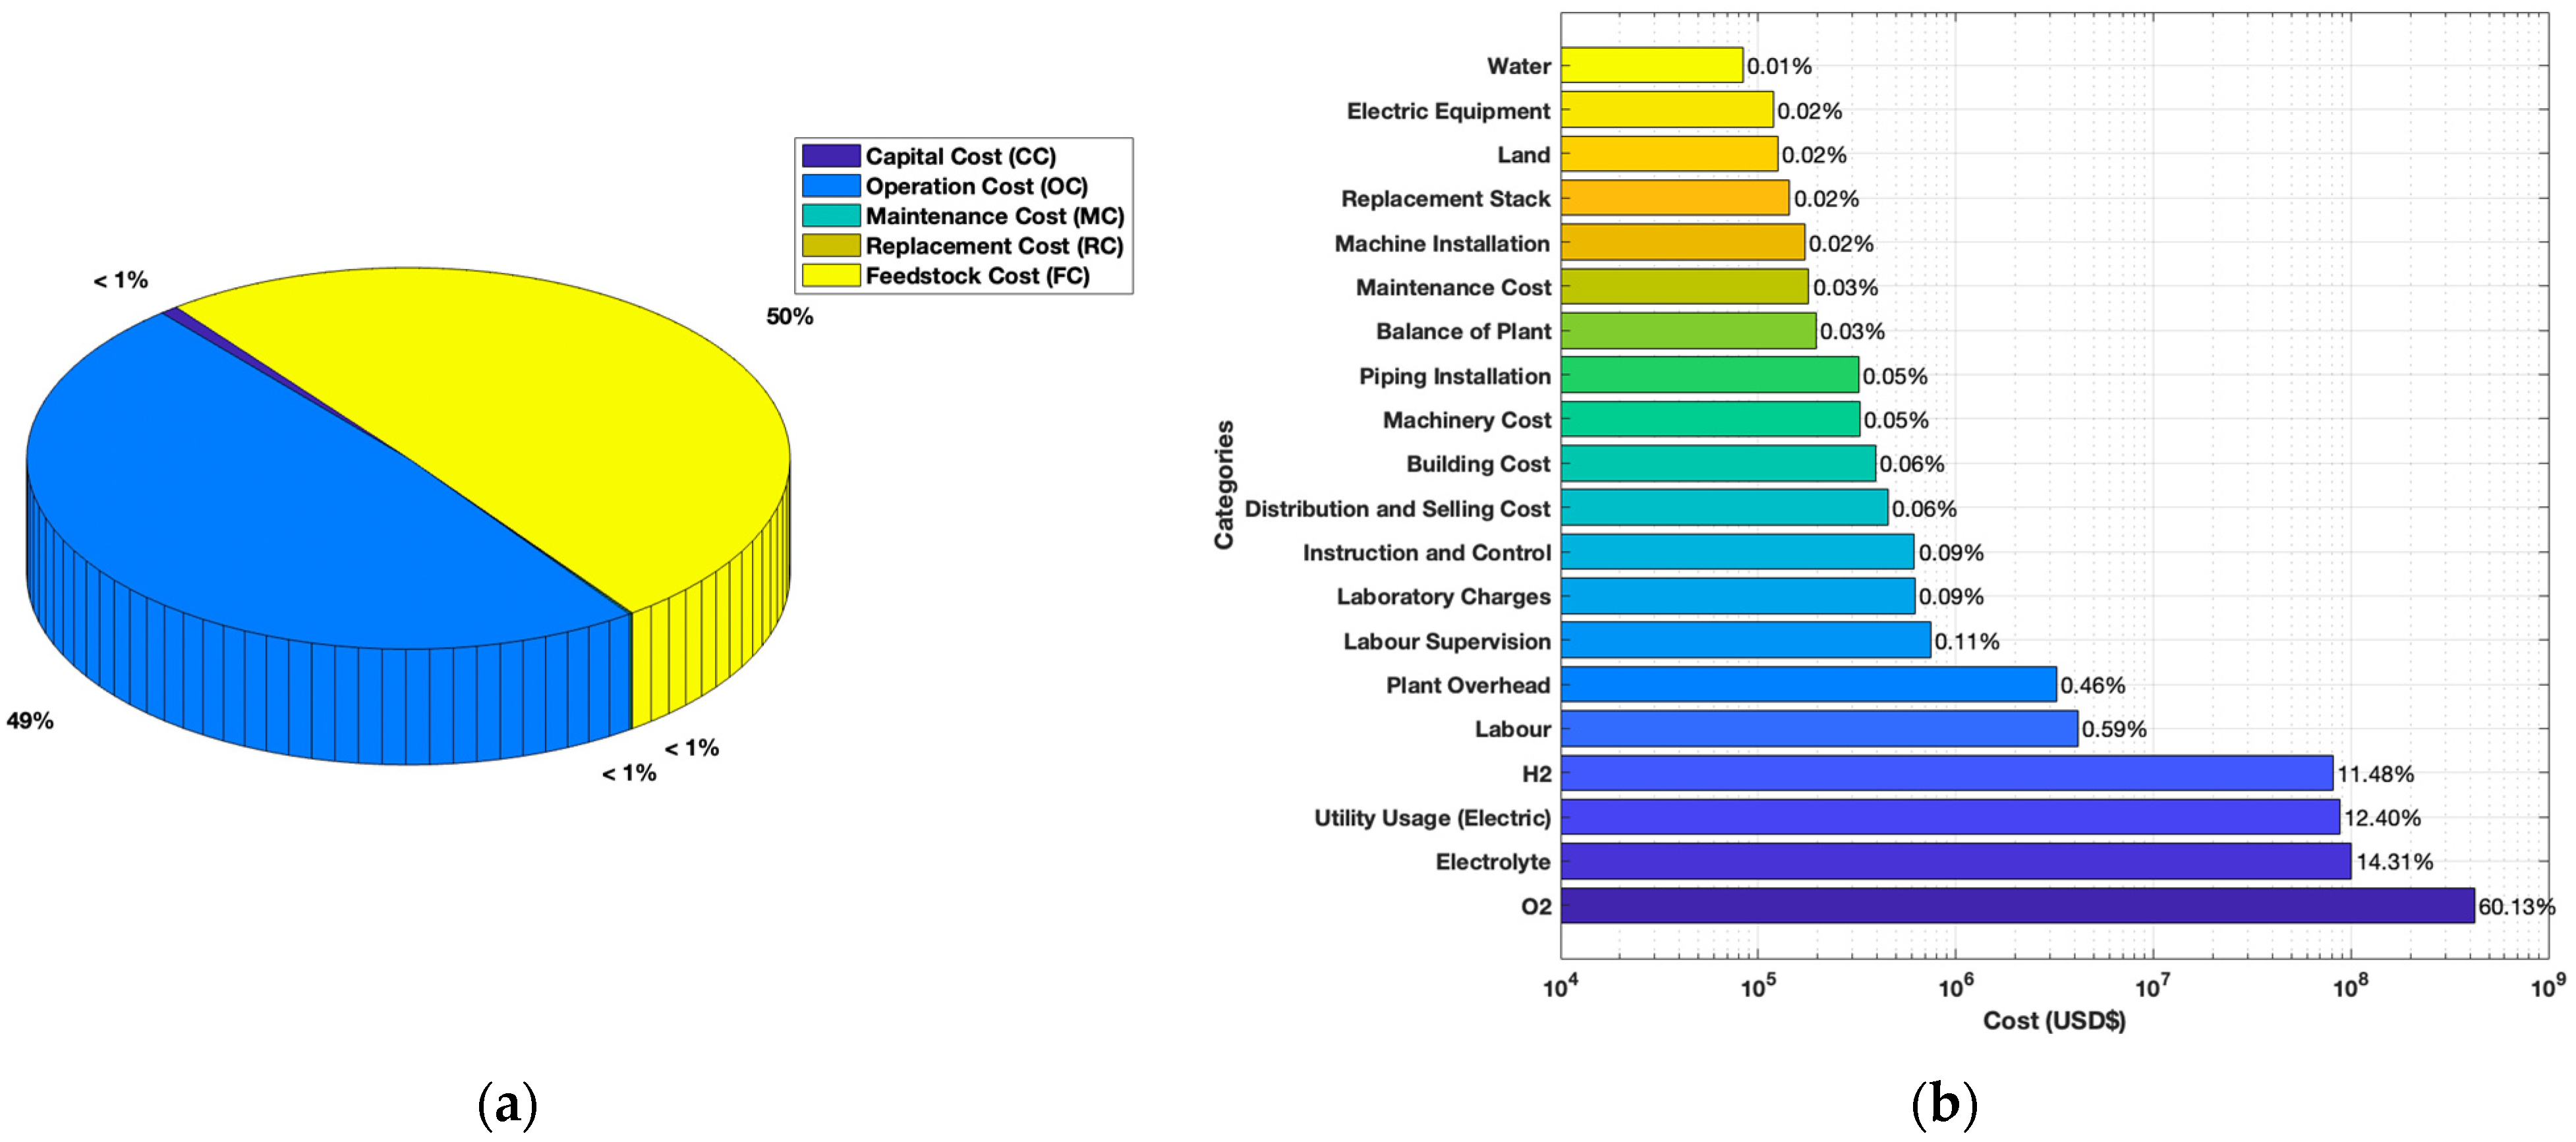
3.2. Cost Breakdown of Steam Methane Reforming

The cost distribution for SMR is illustrated in Figure 4a, highlighting the relative contributions of capital cost (CC), operating cost (OC), maintenance cost (MC), replacement cost (RC), and feedstock cost (FC) in the life cycle cost (LCC) assessment. CC contributes the least to the LCC, accounting for only 0.50% of the total LCC, with CC representing a one-time investment incurred only once at year 0, whereas other costs recur annually. Conversely, OC is the highest at 55.04% of the LCC, contributing more than half of the total cost. This is primarily due to the intensive labor required to operate the plant, making labor costs the dominant factor in OC. FC follows closely, contributing 41.68% of the LCC, largely driven by natural gas consumption, which is the primary feedstock for SMR. MC is relatively low at 1.64% of LCC. Similarly, RC also contributes relatively little to the LCC at 1.15%, with catalysts having a lifespan of five years and thereby reducing the frequency of replacement.
From Figure 4b, natural gas accounts for 21.09% of feedstock costs, while labor constitutes 53.24% of operating costs. Together, feedstock costs and operating costs make up 96.71% of the total cost, showing that the production process is highly dependent on resources and energy. Therefore, reducing feedstock and operating costs is essential for improving the process’s economic feasibility. The cost of oxygen delivery plays a fundamental yet secondary role at 20.51% in hydrogen production, while other costs, including maintenance, land, and machinery upkeep, amount to a marginal 3.59% overall. To enhance cost-effectiveness, investing in automation technologies coupled with affordable natural gas could improve economic profitability. Hydrogen production via SMR could become more cost-efficient by optimizing oxygen management strategies and refining hydrogen separation techniques.
One potential approach to reducing feedstock costs is substituting natural gas with more cost-effective feedstocks, such as propane or methanol. Research has shown that methanol is a possible feedstock for SMR due to its high hydrogen yield [52]. Additionally, integrating Carbon Capture and Storage (CCS) to capture and sell CO2 by-products could generate additional revenue streams, thereby further enhancing the economic feasibility of SMR [53].

3.3. Cost Breakdown of Alkaline Water Electrolysis

The cost distribution for AWE is presented in Figure 5a, detailing the relative contributions of capital cost (CC), operating cost (OC), maintenance cost (MC), replacement cost (RC), and feedstock cost (FC) in the life cycle cost (LCC) analysis. CC accounts for only 0.77% of the total cost, reflecting a one-time expenditure at project initiation, unlike the recurring costs in other categories. Operating costs constitute nearly half (48.64%) of the total cost, driven primarily by the electricity demands of the electrolysis process. Maintenance costs remain minimal at 0.09%, as they are calculated as a proportion of the total capital cost, covering balance-of-plant, machinery, and facility upkeep. Replacement costs are similarly minimal at 0.1%, due to the nine-year lifespan of the electrolysis stack, reducing the need for frequent replacements. However, feedstock costs emerge as the largest component at 50.44%, primarily due to electrolyte expenses.
A deeper analysis of operating costs and feedstock costs reveals that electricity comprises 51% of operating costs, while electrolytes account for 42.10% of feedstock costs, reinforcing the significant influence of resource and energy inputs on the total cost. Together, operating costs and feedstock costs represent over 99% of total costs, suggesting that reductions in these cost categories is essential for improving economic feasibility. Wan et al. highlight that AWE requires substantial energy due to high current density and voltage demands, which escalate operating costs [54]. Additionally, Jin et al. indicate that energy conversion efficiency, influenced by temperature control, plays a crucial role in optimizing AWE’s economic impact [26].
Reducing feedstock costs and operating costs can enhance cost efficiency by improving energy efficiency within the electrolysis stack. Enhanced efficiency decreases electricity consumption per unit of hydrogen produced, thereby reducing operating costs. Zainul underscores the potential of diaphragm advancements in mitigating energy demands, improving efficiency, and enhancing gas purity, aligning with the goal of optimizing resource utilization in electrolysis [55]. Thus, advancing stack technology and energy efficiency is paramount to reducing the total costs and achieving a more economically viable hydrogen production process.
As illustrated in Figure 5b, oxygen represents the largest expense factor at 60.13%, followed by electrolytes at 14.31%, electricity usage at 12.40%, and hydrogen at 11.48%. This breakdown highlights the resource-intensive nature of electrolysis-based hydrogen production. Material consumption remains significant due to oxygen and electrolyte expenses, while electric power consumption demonstrates the high energy requirements of electrolysis. Other cost components have a relatively minor impact, with labor at 0.59%, plant overhead at 0.46%, and infrastructure expenses below 1%. To improve the economic feasibility of hydrogen production via electrolysis, enhancing electricity efficiency, optimizing electrolyte management, and recovering oxygen as a valuable by-product are key strategies for cost reduction.

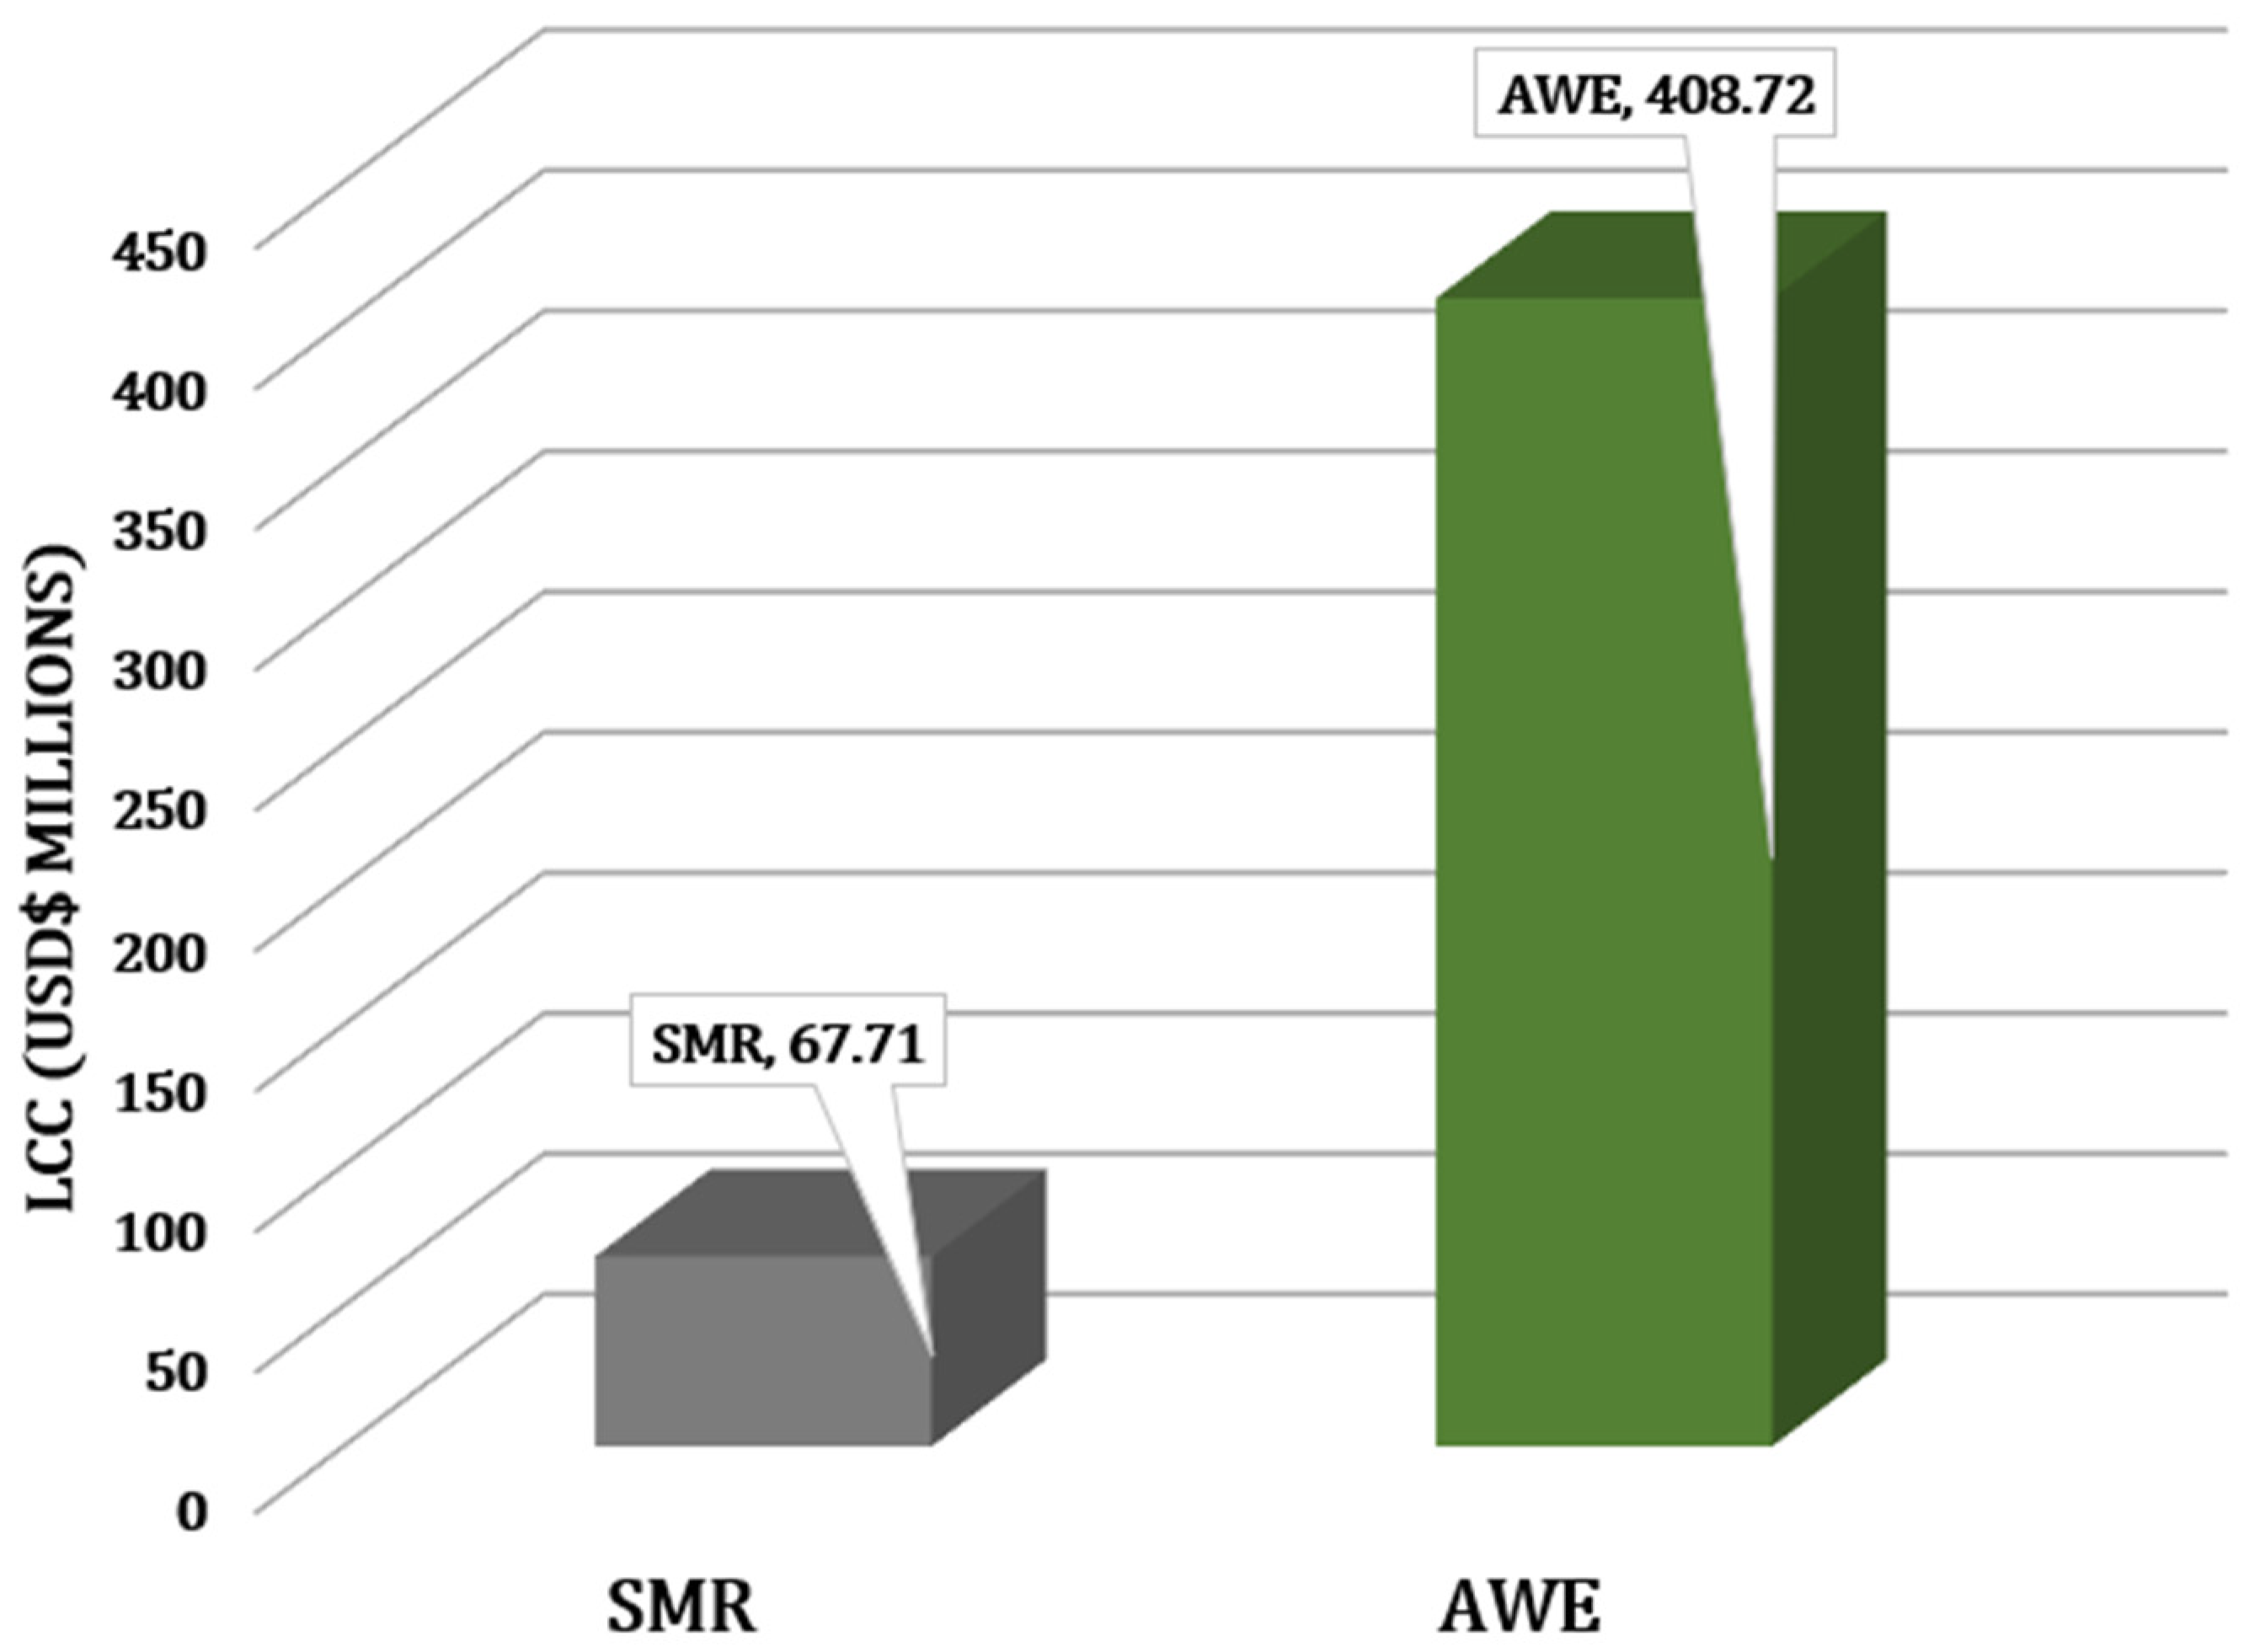
3.4. Life Cycle Cost Distribution

Table 3 provides an overview of the LCCs of SMR and AWE. A more positive LCC value indicates a greater net profit over the system’s lifetime. These data forms the basis for the bar chart in Figure 6, which visually represents the comparison of the LCC distribution of the two technologies.
LCC analysis serves as an essential tool in project planning, offering insights into the total investment and operational costs for each technology. This analysis assists in assessing costs, comparing between SMR and AWE to determine the most economically viable hydrogen production process [56].
As shown in Figure 6, there is a substantial difference between the LCC of SMR and AWE, with AWE demonstrating a higher LCC of USD$408.71 million, thereby making it a more viable option as compared to SMR’s lower LCC of USD$67.7 million. AWE presents a more sustainable and potentially cost-effective option in the long term. Unlike SMR, which relies entirely on fossil fuels, AWE utilizes water as its primary feedstock, offering a renewable and sustainable alternative. Additionally, with electricity powered from a renewable energy source, AWE could further reduce its environmental impact, potentially reducing costs in the long term.
Although the initial capital expenditure of AWE is higher than that of SMR, it can be offset by technological improvements, such as better energy efficiency and access to cheaper renewable energy sources, which could help lower overall expenses. In contrast, while SMR’s initial capital expenditure is lower, its costs are more susceptible to fluctuations in fossil fuel prices, leading to higher operational expenses over time.
With technological improvements and optimized energy sourcing, AWE has the potential to become a more economically viable hydrogen production method, particularly in regions with access to low-cost renewable energy.

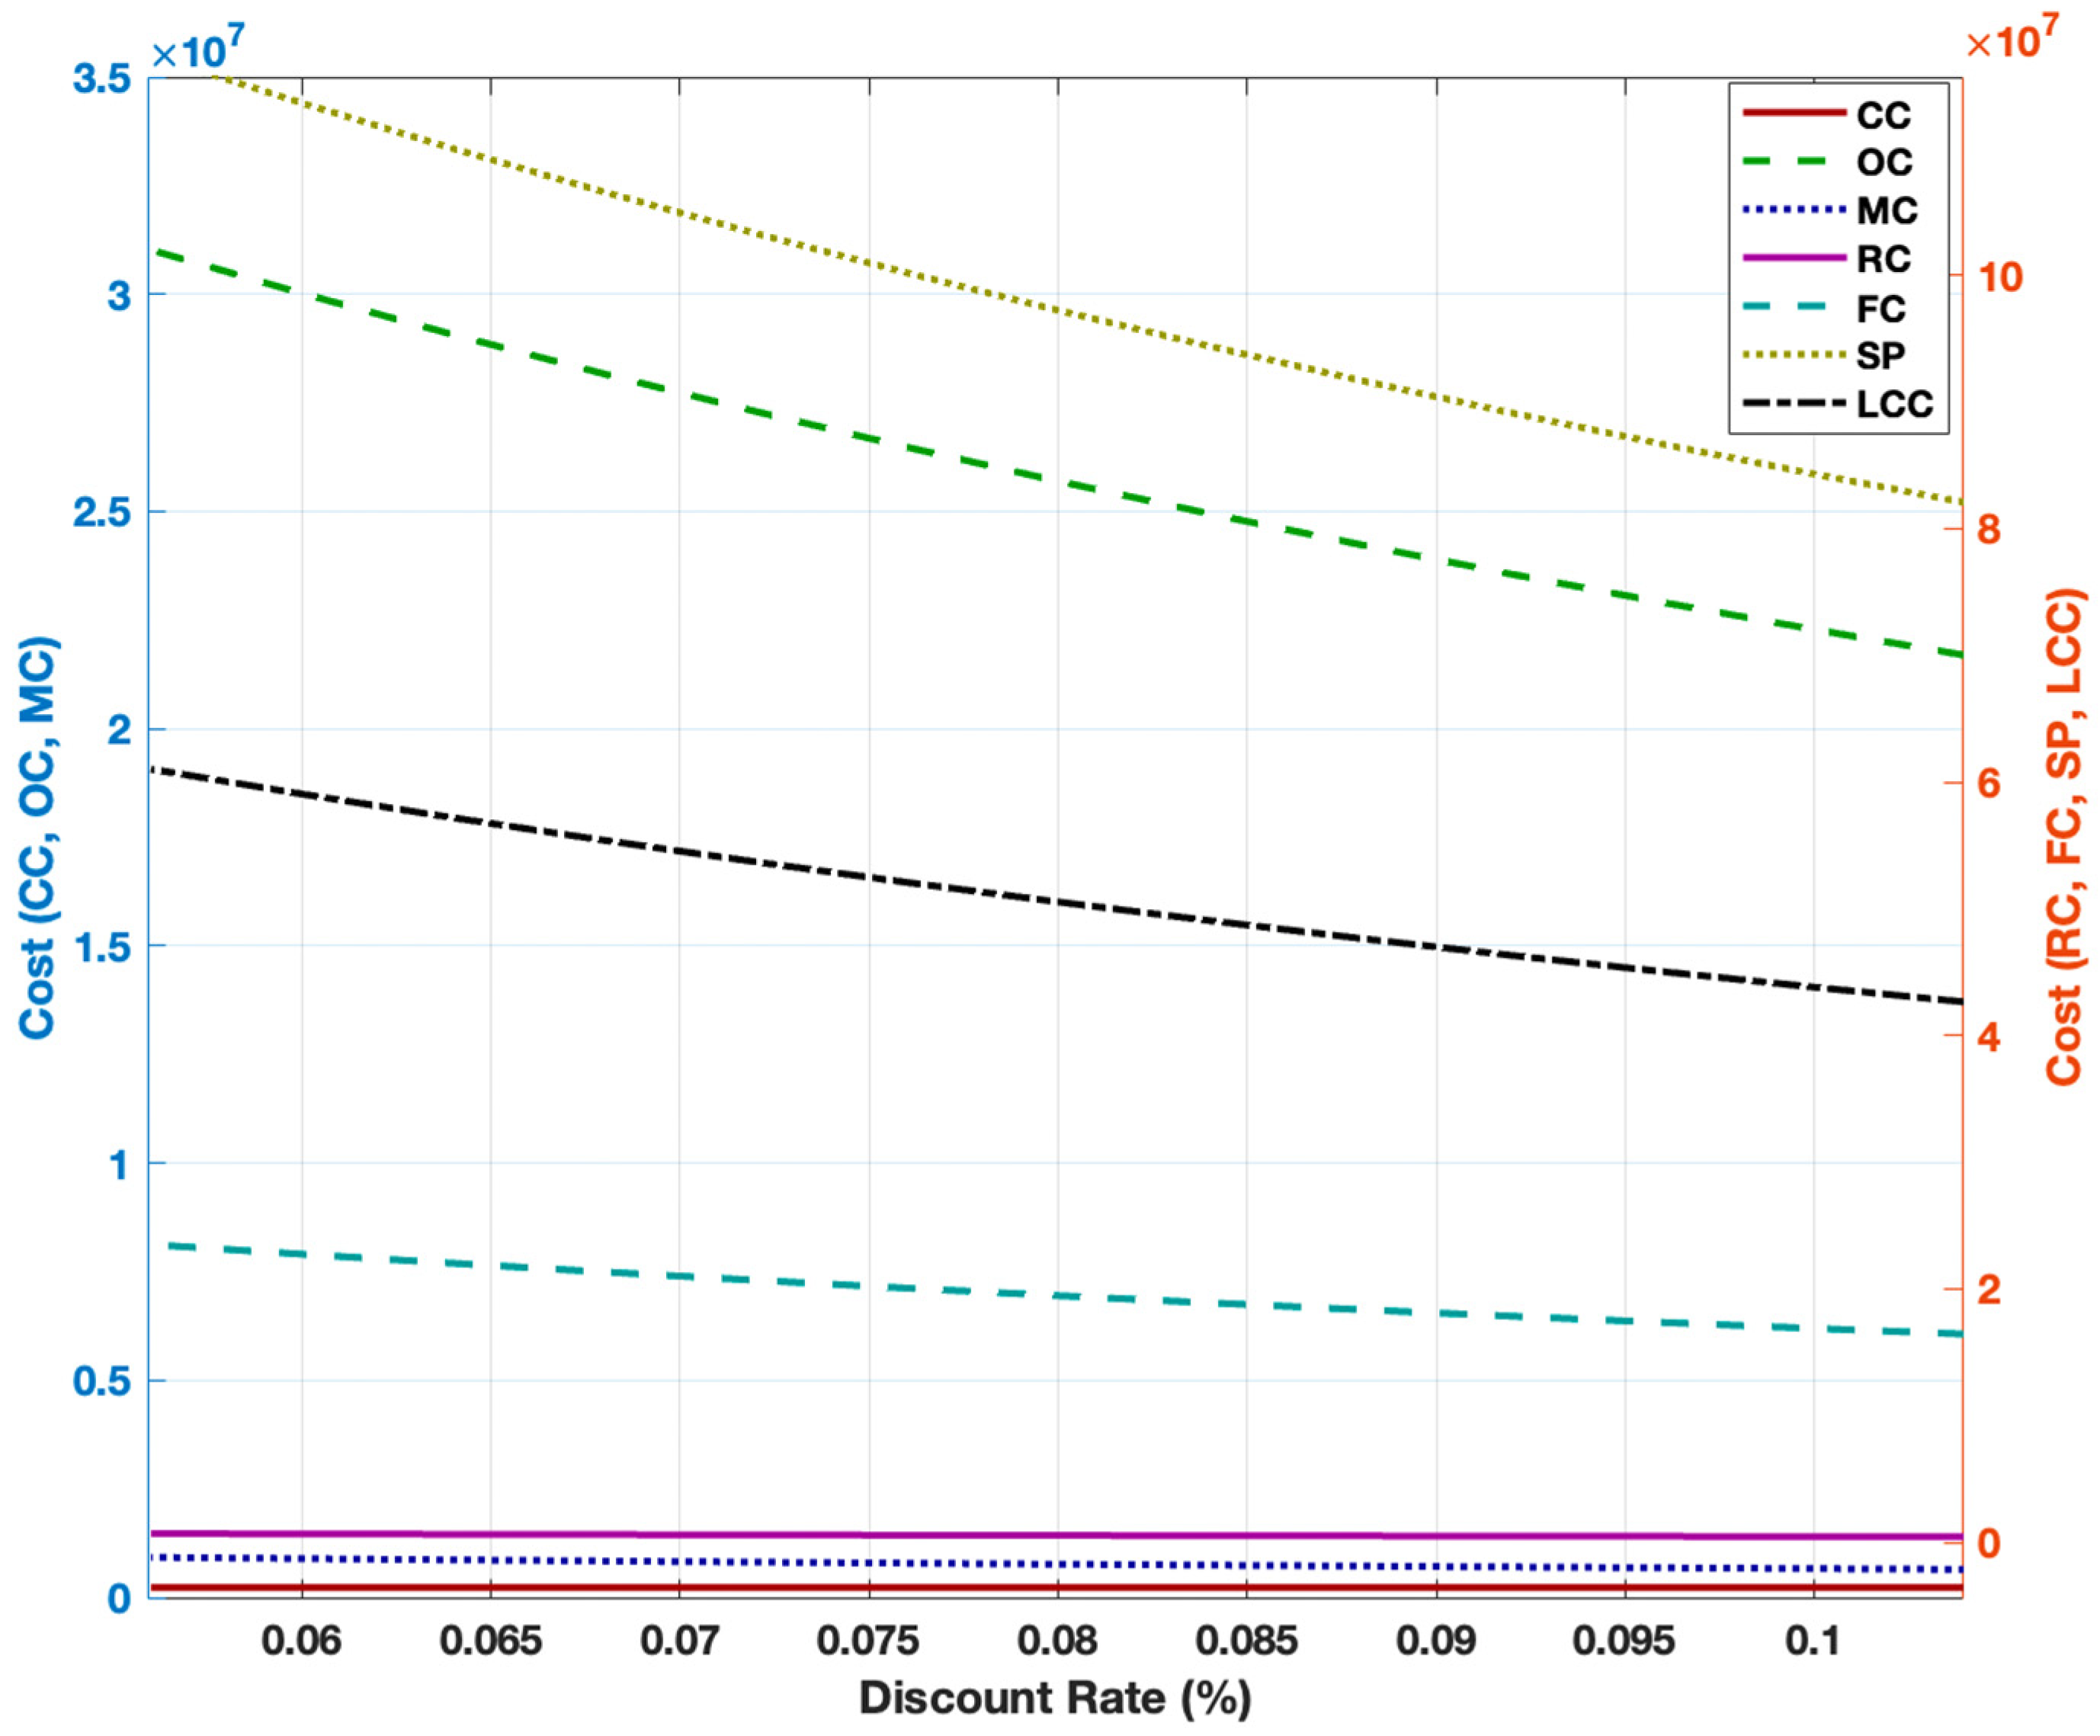
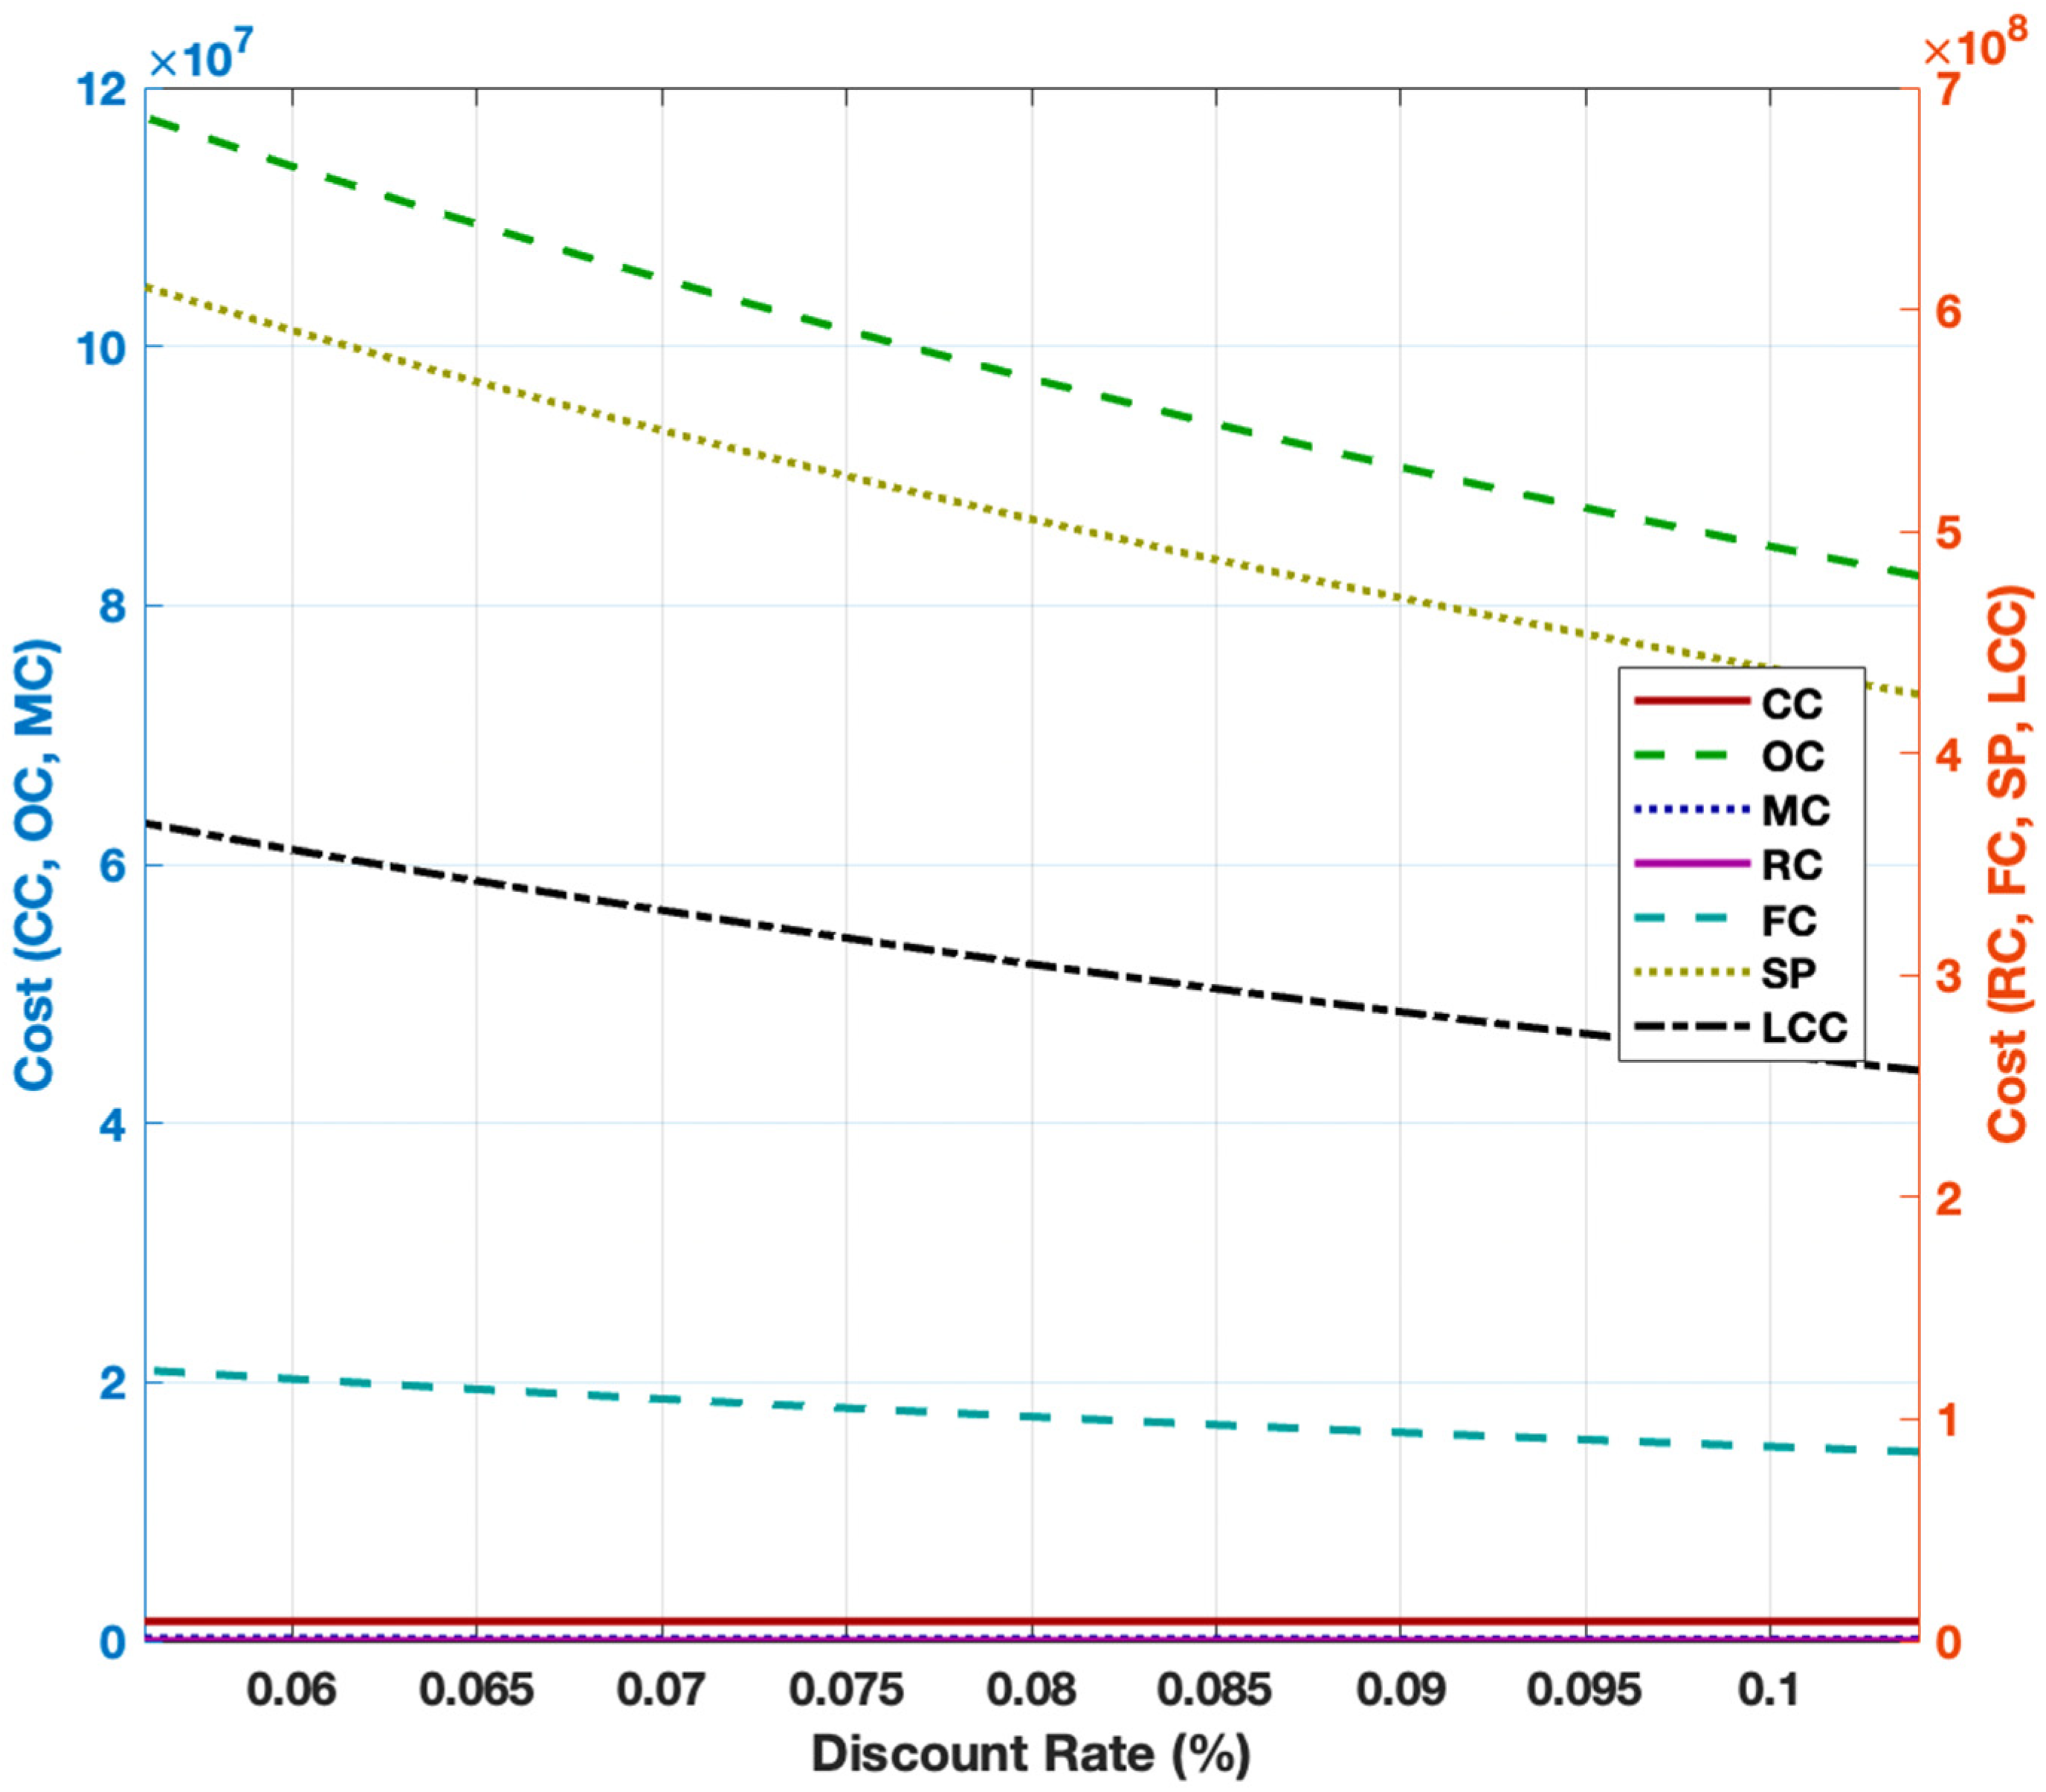
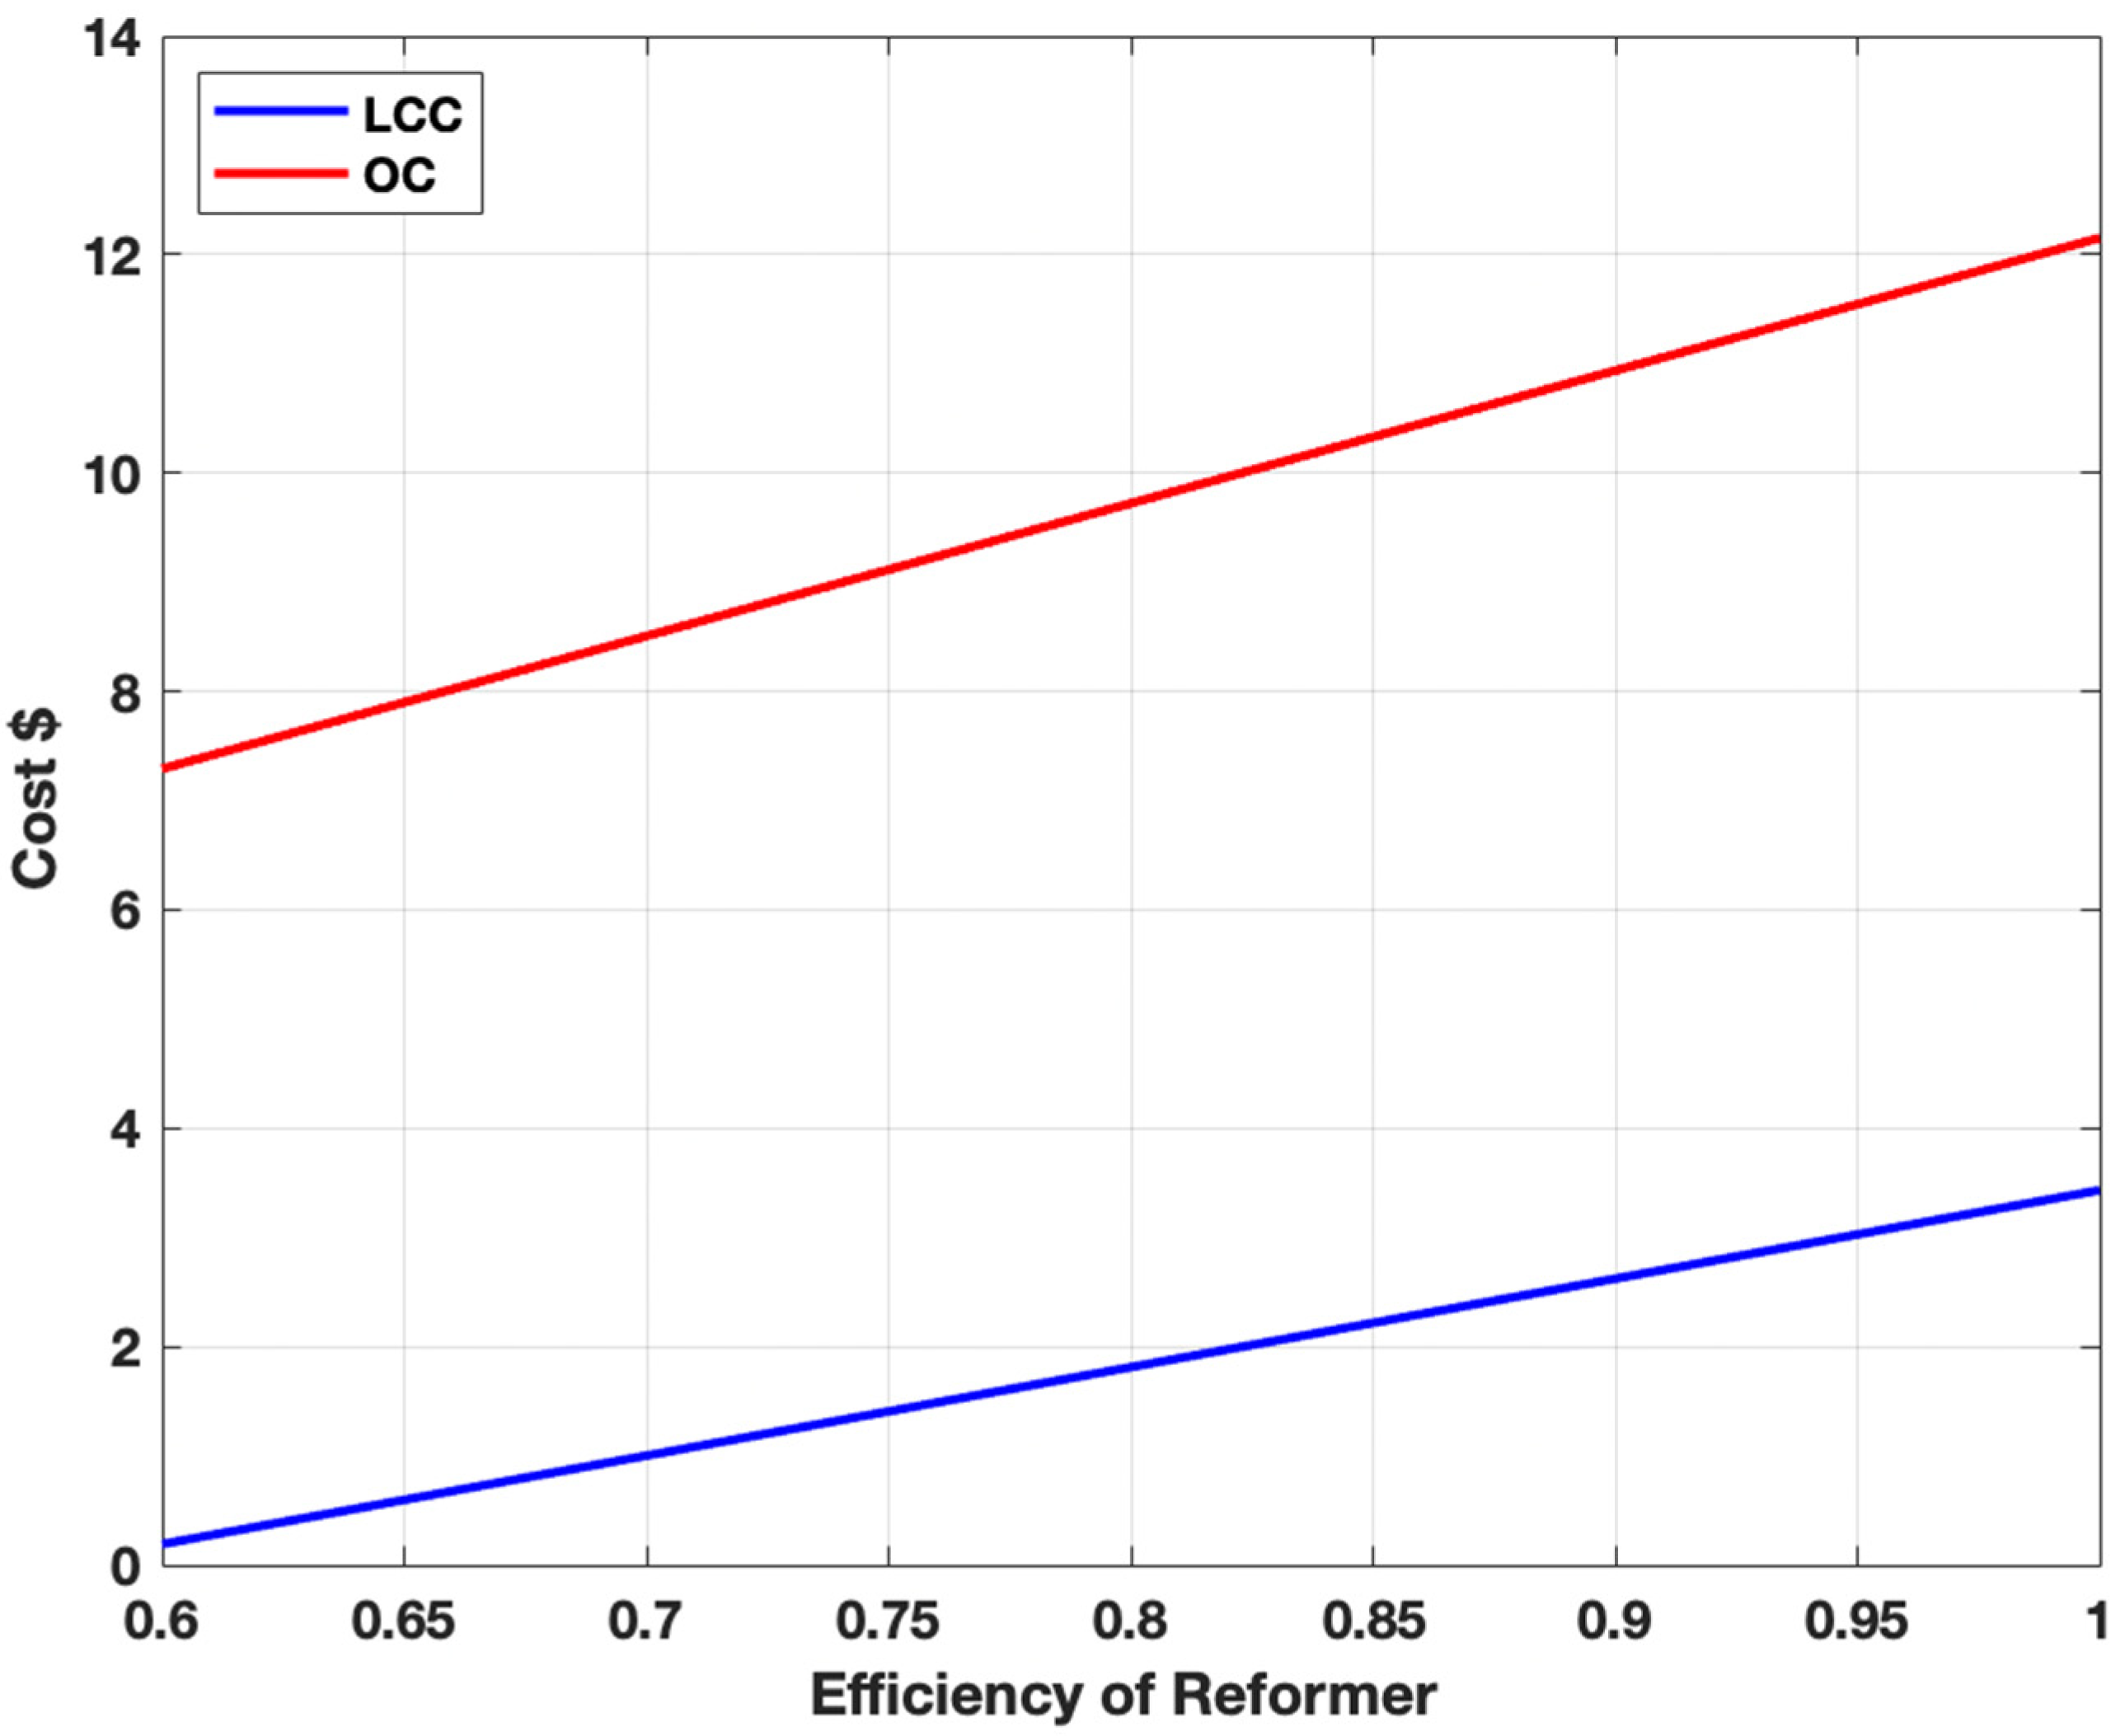
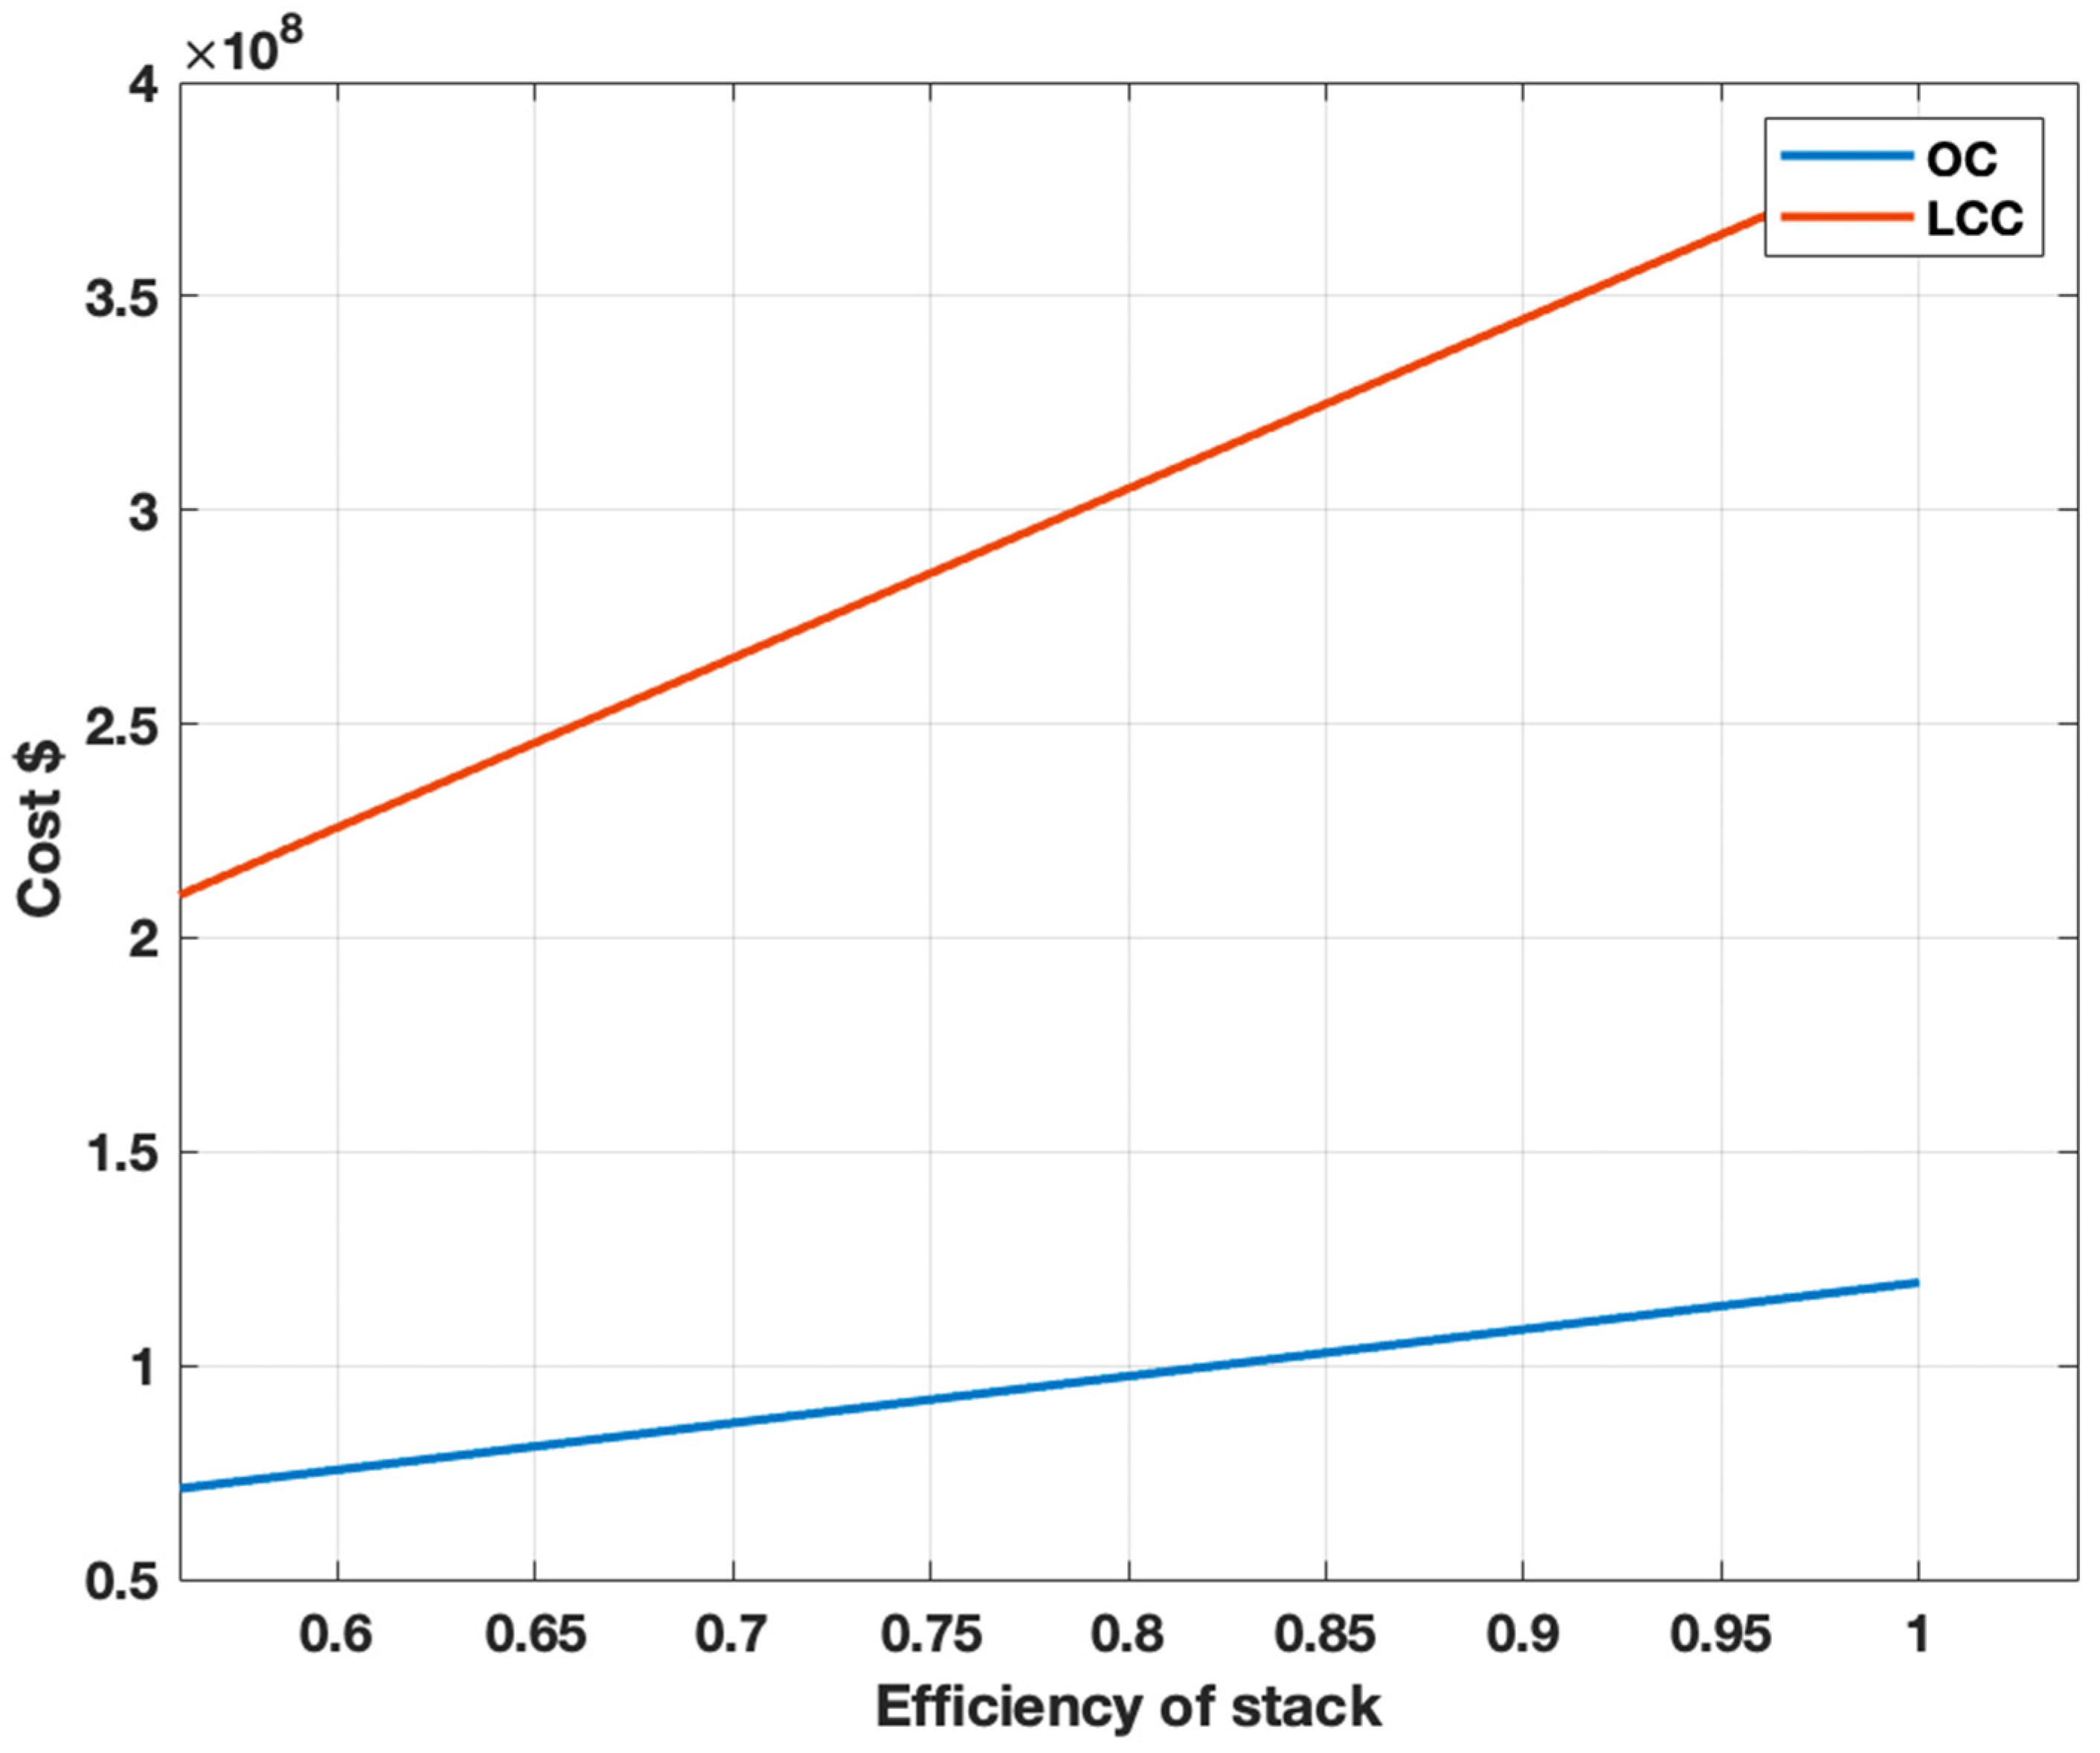
3.5. Sensitivity Analysis for Steam Methane Reforming and Alkaline Water Electrolysis

Figure 7 illustrates the impact of discount rate variations on the present value of different cost components in the SMR process. With the discount rate set at 8% [51] all cost components show a downward trend as the discount rate increases, reducing the present value of future expenses and revenues [57]. Notably, while higher discount rates affect all cost components, CC remains unchanged at year 0. Despite uniform discount rates, SP has a larger undiscounted value than other cost components, leading to a greater reduction in present value. This results in an overall decline in LCC, as the discounted impact of revenues outweighs expenditures. The trend aligns with [49] showing how increasing discount rates reduce future financial flows, making long term investments less appealing. OC and FC gradually decline, reflecting their diminishing contribution at higher discount rates, while RC and MC have minimal impact due to their smaller proportion of lifecycle costs. This behavior is consistent with [58], emphasizing discount rates’ role in financial viability assessments.
Like SMR, AWE also shows a declining LCC trend with increasing discount rates (Figure 8). However, AWE’s greater dependency on electricity costs and dual revenue streams from hydrogen and oxygen affect its discounting impact. At an 8% discount rate, LCCs of SMR and AWE are USD$67.7 million and USD$408.71 million, respectively, a difference of USD$340 million. Reducing the discount rate of SMR to 7% increases its LCC by USD$3.33 million, while increasing it to 9% reduces the LCC to USD$2.64 million. Similarly, in AWE, adjusting the discount rate to 7% increases the LCC difference to USD$ 5.90 million, while increasing it to 9% reduces the difference to USD$5.37 million. Lower discount rates emphasize future costs, whereas higher discount rates reduce their impact, making projects appear less expensive over time.
Figure 8 highlights that as the discount rate rises, the present value of SP, OC, MC, RC, and FC declines, while CC remains unchanged since it is incurred at year 0. A key observation is that reductions in SP and other cost elements increase LCC, negatively impacting long term profitability by reducing the NPV of SP and operational savings. These findings align with Navarro et al. [59], who stress that even small discount rate variations significantly impact long term cost projections. The sensitivity analysis confirms that moderate discount rate increases reduce profitability by elevating LCC, offering a crucial insights for decision-makers in AWE investments. Literature supports these findings, particularly regarding capital cost stability under discount rate fluctuations. Colli et al. [40] note that using low-cost materials in AWE stabilizes capital and operational costs despite varying discount rates. Additionally, Navarro et al. [59] emphasize that adjusting market conditions, inflation, and investment risks through discount rate variations is vital for accurate LCC projections. Figure 8 underscores the importance of discount rate assumptions in AWE techno-economic assessments, showing that conservative discount rates help maintain profitability by stabilizing future cost projections.
Figure 9 illustrates how variations in reformer efficiency impact both OC and LCC in an SMR plant. A more efficient reformer requires less methane (CH4) feedstock to produce the same hydrogen output, as demonstrated in Equation (6). While reducing methane consumption lowers feedstock costs, Equation (7) demonstrates that this also increases overall energy demand; methane combustion actually contributes to sustaining the high temperatures required for reforming reactions. Hence, with less methane available, additional external energy input is needed to compensate for the reduced energy, leading to higher electricity consumption. This trade-off results in lower feedstock costs but at the expense of increased OC due to the higher energy demand needed to sustain reaction conditions. Although reformer efficiency enhances hydrogen production, the additional energy requirement partially offsets cost savings, making operating expenses a crucial determinant of overall economic feasibility. Studies by [60,61] report that improving reformer efficiency generally reduces feedstock consumption but may increase energy demands, particularly in heat-intensive processes.
However, the overall impact on LCC remains positive, as the reduction in FC outweighs the increase in OC, leading to a net improvement in economic performance. To maximize financial benefits, efficiency enhancements should be carefully managed alongside energy optimization strategies, ensuring that SMR remains both cost-effective and sustainable.
Figure 10 analyzes the impact of stack efficiency on the LCC and overall economic viability of an AWE plant. The results show that as stack efficiency improves, LCC increases, enhancing profitability. This improvement continues up to a maximum efficiency threshold of 100%. The efficiency of the electrolyzer stack is assumed to be 80% in this study, consistent with findings by M. El-Shafie [62], who reported typical conversion efficiencies in AWE ranging from 60 to 80%, and de Groot [63], who also used 80% as a baseline efficiency in line with common operational standards.
Higher stack efficiency leads to increased electricity consumption, raising operational costs due to intensified production. As described in Equations (8) and (9), electrolyzer efficiency directly influences feedstock costs by influencing both hydrogen production and energy demand. Equation (8) represents the required oxygen input relative to the hydrogen production rate, which depends on the efficiency parameter, λ 1 ε . This means that an increase in electrolyzer efficiency alters the input mass flow rate, contributing to higher operational costs. Conversely, Equation (9) shows that as efficiency improves, the system demands more precise control, leading to additional operating expenses.
Despite these higher costs, increased efficiency enhances profitability. As noted by Jin et al. [26], greater efficiency improves hydrogen purity and production rates, allowing hydrogen to be sold at marketable prices, thus contributing significantly to revenue generation. Figure 10 captures this trend, demonstrating how increased efficiency strengthens economic performance by increasing deliverables and LCC. Todoroki et al. [64] also support these findings, showing that durability improvements in AWE electrodes not only enhance stack efficiency but also enable hydrogen to command higher market prices, boosting profitability.
Moreover, the limited sensitivity of feedstock costs and operating costs to efficiency variations suggests that optimizing stack efficiency remains economically viable without significantly increasing operating expenditures. Figure 10 highlights this efficiency economic relationship, reinforcing the potential for AWE plants to enhance profitability through technological improvements while maintaining cost-effectiveness.
Figure 11 examines the effect of KOH concentration variations on the feedstock costs and LCC in an AWE plant. Literature has shown that utilizing KOH solution as an electrolyte instead of sodium hydroxide enhances efficiency in hydrogen production by 14.77% [65]. Additionally, many electrolysis models have integrated the use of similar KOH concentrations, typically at 35% [18,33,44,46,62] which has been similarly applied in this study.
As illustrated in Figure 11, increasing KOH concentration from 20% to 40%, a range proposed by various studies [33,44,45,62,66], results in a corresponding increase in feedstock costs, subsequently leading to an increase in LCC. This is due to the greater amount of KOH required to sustain higher concentrations, leading to higher electrolyte consumption over time. Additionally, higher concentrations accelerate equipment degradation, particularly affecting electrodes, diaphragms, and membranes, increasing MC and RC [63,67,68]. While higher KOH concentrations enhance conductivity in AWE, studies by Sakr et al. [67] and Kim et al. [68] indicate that they also lower hydrogen purity, negatively impacting production quality and overall efficiency. The literature further supports this efficiency decline, with Haug et al. [69] reporting that excessive KOH levels reduce anodic hydrogen content. Although this reduction enhances safety, it is undesirable for maximizing hydrogen output. Moreover, de Groot [63] suggests that while lower nominal current densities can improve overall plant efficiency and reduce electricity costs, higher KOH concentrations necessitate more frequent electrolyzer maintenance, thereby increasing MC. This highlights a critical trade-off in AWE operation: while moderate KOH concentrations improve conductivity, excessive levels increase electrolyte consumption, accelerate component wear, and reduce hydrogen purity, leading to higher OC and MC.
As the KOH price increases from USD$1503.37 to USD$1958.69 per 1000 kg, the feedstock cost also rises proportionally, increasing from USD$77,468,382.74 to USD$100,683,166.87. This price surge directly impacts LCC, resulting in a linear increase, which suggests reduced overall profitability.
Figure 11 visually depicts this relationship, demonstrating that increases in both KOH concentration and price significantly challenge the economic feasibility of the AWE process. These findings emphasize the need for cost-optimization strategies, such as efficient electrolyte management and alternative procurement approaches, to mitigate the impact of fluctuating KOH prices on overall plant economics [18,46,57,65].
Figure 12 illustrates the effects of variations in water and electricity costs on the LCC of the SMR process. The horizontal axes represent the percentage changes in electricity costs, which contribute to the overall operating cost, and water costs, which are associated with feedstock expenses in the SMR process. The vertical axis illustrates the total LCC of the SMR system. Changes in electricity and water costs can arise due to market interactions, such as fluctuations in supply and demand, or can be artificially introduced by governments through subsidies (which lower costs) or taxation policies (which increase costs). These external influences have a significant impact on the economic feasibility of SMR hydrogen production.
As electricity and water costs increase, the LCC increases accordingly, though the trend appears nonlinear. The sensitivity analysis indicates that LCC is more strongly influenced by electricity price fluctuations than water cost variations, as reflected by the steeper slope along the electricity cost axis. This suggests that electricity prices have a greater impact on the overall economic feasibility of SMR compared to water costs. Subsequently, reducing electricity costs through subsidies could lead to significant LCC reductions, making energy optimization within SMR operations a key strategy for cost savings. In regions with electricity and water subsidies, minimizing these costs could substantially improve the economic viability of SMR-based hydrogen production. Conversely, if electricity prices rise due to taxation or market conditions, this would increase SMR’s operating expenses, reducing its economic competitiveness.
Operating cost (OC) and life cycle cost (LCC) are more notably impacted by electricity price changes than water price changes due to SMR’s technology’s energy-intensive requirements. Multiple operations in the SMR process depend on electricity usage during steam generation compression and purification, which makes electricity the main cost factor [70]. Both OC and LCC experience significant growth when electricity prices increase, particularly if higher electricity tariffs or taxes are applied. Since LCC considers all expenses that occur throughout the system’s complete lifespan, the 3D plot reveals a steep trend between electricity price hikes and both OC and LCC elevations, indicating that electricity costs determine the economic sustainability of SMR-based hydrogen production.
The cost variations of water as an essential reforming reactant result in negligible effects on both OC and LCC. Water used in SMR for steam generation plays a minor economic role because it does not exceed electricity consumption in terms of overall costs. However, in regions where water is heavily taxed or where water tariffs increase due to resource scarcity, its impact on LCC may become more significant. Despite this, electricity remains the dominant cost factor in SMR economics.
SMR’s feedstock expense primarily depends on natural gas prices, which function independently from fluctuations of electricity and water prices. The dual role of natural gas as a reforming reactant and heater fuel means its cost is determined by external market factors rather than operational expenses. Changes in natural gas production or consumption levels do not directly impact gas prices, because factors such as global supply chains, extraction expenses, market demand, and geopolitical aspects determine gas costs [71]. Feedstock costs exhibit stable price patterns, as water and electricity prices have minimal impact unless there are changes in the external fuel market.
Figure 13 illustrates the effect of water and electricity cost variations on feedstock cost (FC), operating cost (OC), and the life cycle cost (LCC) of AWE. As electricity powers the energy-intensive electrolysis process, and water serves as the primary feedstock, fluctuations in these costs have a direct impact on hydrogen production expenses.
As shown in Figure 13, increasing electricity and water prices leads to a corresponding increase in both feedstock costs and operating costs, thereby affecting the overall LCC. These findings align with Lee et al. [72] who highlighted that AWE’s production costs are particularly sensitive to variations in electricity and water prices, thereby directly influencing the overall economic feasibility of the system. As more positive LCC values correspond to higher profitability, minimizing electricity and water costs is important in enhancing the economic viability of AWE.
Regions with subsidized electricity and water—such as Brunei Darussalam—stand to benefit significantly by achieving cost-effective hydrogen production. This aligns with findings from Colli et. al. [40] which emphasize that reducing energy costs is critical to improving the financial feasibility of AWE. The ability to secure low-cost electricity and water plays a pivotal role in determining the overall economic competitiveness of electrolysis-based hydrogen production, reinforcing the importance of regional policy support and energy pricing structures. Conversely, Australia serves as an example where AWE is not economically viable due to high electricity and water costs. With water prices reaching up to [26] USD$2 per m3 [73] coupled with electricity prices at USD$0.273 per kWh, the LCC of an electrolysis plant shifts to a positive value, indicating a massive loss at USD$125,510,442. This reinforces the conclusion that AWE remains financially feasible primarily in regions with heavily subsidized electricity and water. The case highlights the critical role of energy and resource affordability in determining whether electrolysis-based hydrogen production can be commercially sustainable.
This analysis demonstrates that the economic sustainability of both AWE and SMR is strongly influenced by electricity and water pricing policies. While subsidies enhance feasibility, higher tariffs or energy-related taxes can reduce competitiveness. Future research could explore policy-driven optimization strategies for hydrogen production to further assess how energy taxation, subsidies, and regulatory mechanisms influence the long-term viability of different hydrogen production pathways.
Figure 14 shows the linear relationship between the hydrogen price and the life cycle cost (LCC) of SMR. This suggests that the SMR method continues to generate profitable hydrogen production at higher prices when market demand sustains these higher prices, exceeding the impact of the total production cost of a particular project. In addition to this, the study also supports the relationship between hydrogen selling prices and SMR production costs, where it serves as a vital tool for improving hydrogen manufacturing approaches and analyzing the competitiveness of SMR versus alternative methods, making it an ideal candidate for policy-driven financial incentives.
Figure 15 illustrates the relationship between the selling prices of hydrogen (primary product) and oxygen (by-product) and the LCC in an AWE plant. Unlike SMR, where hydrogen prices remain relatively stable due to their dependence on natural gas costs, carbon tax regulations, and market trends [74] the economic feasibility of AWE is highly sensitive to fluctuations in hydrogen prices. This is due to AWE’s reliance on renewable energy sources and policy incentives, making the selling price of hydrogen a crucial determinant of its financial viability.
As expected, higher hydrogen and oxygen prices increase revenue, helping to offset operational and feedstock costs, thereby improving LCC. Specifically, a 10% increase in hydrogen prices from USD$4.88 to USD$5.38 and oxygen prices from USD$3.20 to USD$3.52 results in an LCC increase of USD$35,107,158. The dataset evaluation shows H2 and O2 prices affect LCC costs for AWE, while O2 price changes create larger LCC cost reductions than H2 price changes. The reduction of O2 price produces a substantially larger impact on the LCC than a reduction in H2 price. For example, when H2 price is at USD$8.52, a change from O2 price of USD$5.58 to USD$3.00 brings about a substantial LCC reduction from USD$456,664,720.9 to USD$201,972,759.9. The data shows that O2 price holds primary importance in achieving cost reductions when compared to H2 price levels.
Consequently, a reduction in H2 price accompanied by a fixed O2 price results in reduced LCC values but shows less impact than when lowering the O2 price. The LCC reduction becomes smaller when O2 price remains constant at USD$5.58 and the H2 price drops from USD$8.52 to USD$4.59, thus generating a new LCC value of USD$408,056,552.3. The study data indicates O2 price optimization holds promise as the better approach for reducing life cycle costs in AWE systems.
This reinforces the importance of favorable market conditions in sustaining the economic viability of AWE operations. Market environments with high demand and limited competition typically support higher product prices, leading to greater profitability [75].

3.6. Environmental Impact Analysis

Figure 16 illustrates the substantial difference in GHG emissions between SMR and AWE in hydrogen production. SMR generates approximately 9100 metric tons of CO2 annually, whereas AWE emits a significantly higher 53,142 metric tons of CO2, primarily due to high electricity consumption.
In SMR, emissions predominantly stem from methane reforming, where CO2 is produced as a direct by-product. Additionally, fuel combustion required to maintain high temperature operations contribute to further emissions. Beyond CO2, the SMR process also generates 22 metric tons of CO2 equivalent carbon monoxide, along with sulfur oxides (SOX) and nitrogen oxides (NOX), which contribute to atmospheric degradation and air quality concerns. These pollutants were quantified and included in the environmental impact assessment, where they account for 4% of total emissions and 98% of all non-CO2 pollutants. The presence of sulfur compounds in SMR feedstocks further exacerbates SOX emissions, leading to acid rain formation and respiratory health risks if not properly controlled. Similarly, NOX emissions contribute to ground-level ozone formation, negatively impacting both human health and ecosystems. As noted by Pei et al. [76] these pollutants are significant contributors to atmospheric pollution, reinforcing the need for stringent emissions control policies in SMR-based hydrogen production to mitigate their environmental impact.
In contrast, AWE emissions are primarily electricity-driven, as the electrolysis process itself does not generate direct CO2 emissions. However, the carbon intensity of electricity generation, measured at 894 gCO2/kWh, significantly influences its overall environmental impact. Since AWE requires large amounts of electricity, its total CO2 emissions exceed those of SMR, despite being perceived as a cleaner hydrogen production method. This highlights that AWE’s true environmental benefits depend on the energy mix powering electrolysis. If renewable energy sources are used, AWE’s carbon footprint can be drastically reduced, making it a viable low-carbon alternative.
Sofiev et al. [77] emphasized that while low-sulfur fuels reduce particulate matter, considerable GHG emissions remain, underlining the need for policies that promote renewable energy use. While SMR produces lower total CO2 emissions than AWE, it introduces additional air pollutants with negative environmental consequences. Conversely, AWE’s sustainability is closely tied to the decarbonization of electricity sources, reinforcing the need for policy incentives and renewable energy integration to make electrolysis a truly green hydrogen solution.

4. Opportunities and Challenges

AWE presents numerous opportunities that could significantly accelerate advancements in hydrogen production, particularly in the transition towards sustainable and alternative fuels. One of its most compelling advantages is its compatibility with renewable energy sources. When integrated with solar, wind, or hydroelectric power, AWE facilitates the production of “green hydrogen”, which is essential for reducing carbon emissions in transportation, industrial, and energy storage sectors [64,78]. This synergy not only enhances the viability of renewable energy systems but also allows for efficient energy storage to mitigate the challenges of intermittency in power grids. By utilizing surplus renewable energy during peak production periods, hydrogen produced via AWE can be stored and later used to stabilize grid demand, facilitating a more resilient and sustainable energy network [25,31]. The results indicate that optimizing operating conditions, such as temperature and electrolyte concentration, would significantly improve system efficiency and overall cost-effectiveness. The findings show that increasing efficiency directly improves the LCC, highlighting the importance of process optimization for the scalability of AWE.
Furthermore, advancements in catalysts and membrane technologies hold great promise for improving AWE efficiency and reducing its operational cost. Ongoing research into nickel-iron-based catalysts, perovskite oxides, and optimized membrane electrode assemblies (MEAs) aims to improve hydrogen production rates whilst reducing reliance on expensive noble metals, thereby making AWE a more cost-competitive solution [40,79]. The discussion also highlighted that electrode degradation could impact system longevity. Selecting robust electrode materials would help enhance LCC performance by reducing the frequency of replacements and lowering maintenance costs.
Additionally, layered double hydroxides such as CuAi, a study by [80], and non-precious metal catalysts [81] are being investigated to enhance catalytic activity, increase efficiency, and extend electrolyzer lifespans, addressing some of the cost and durability limitations of AWE [40,82].
AWE’s ability to produce high purity hydrogen in large volumes makes it particularly well-suited for industrial applications, such as ammonia synthesis [83], petroleum refining, and methanol production, where demand for sustainable hydrogen is rapidly increasing [84,85]. As industries shift toward sustainable production pathways, AWE could play a pivotal role in limiting waste heat and production emissions [86], particularly in regions where carbon taxation and emission reduction mandates are being implemented [76,77]. The findings support this, demonstrating that higher hydrogen purity improves downstream process efficiency and reduces additional purification costs. System engineers must also optimize process parameters, such as pressure and temperature, to minimize energy losses and maximize system performance.
The scalability of AWE is another crucial advantage. Unlike proton exchange membrane water electrolysis (PEMWE), which requires expensive platinum-group metals, AWE relies on low-cost alkaline electrolytes, making it an attractive option for large-scale deployment. Additionally, hybrid electrolysis models, combining AWE with PEMWE or Solid Oxide Electrolysis Cells (SOECs), offer the potential for more flexible hydrogen production systems, allowing for better adaptability to fluctuating renewable energy inputs [62]. Results indicate that integrating AWE with other electrolysis technologies could improve overall efficiency and reduce operational costs by optimizing energy consumption. This underscores the importance of system design in enhancing LCC and making AWE more economically competitive. By leveraging hybrid systems, such as PEMWE [87] industries can optimize hydrogen production efficiency, reduce overall electricity consumption, and improve grid stability.
Furthermore, advancements in system integration and automation are expected to enhance AWE performance. The use of AI-driven process control, real-time monitoring, and predictive maintenance strategies can minimize downtime, optimize electrolyte usage, and prevent component degradation, improving the economic feasibility of AWE on a global scale. As research continues, new electrolyzer designs and modular systems could further support rapid industrial scaling, which is essential as global hydrogen demand continues to rise. The results indicate that implementing automated control mechanisms improved system reliability and minimized fluctuations in hydrogen production rates, reinforcing the importance of digital optimization for large-scale AWE deployment.
Despite its advantages, AWE faces several technical, economic, and operational challenges that hinder widespread industrial adoption. One of the primary limitations of AWE is its lower efficiency compared to advanced electrolyzers such as PEMWE [87]. AWE operates at lower current densities, which results in reduced hydrogen production rates and higher energy consumption due to the slower kinetics of the Hydrogen Evolution Reaction (HER) and Oxygen Evolution Reaction (OER) in alkaline conditions [84,88]. This makes AWE less competitive in regions where electricity costs are high, necessitating further efficiency improvements to lower overall energy consumption. Experimental findings highlighted that higher operating temperatures slightly improved reaction kinetics; however, this was accompanied by increased degradation of membrane components, highlighting the trade-off involved in AWE optimization.
Another major challenge is electrode degradation over time, which is exacerbated by the highly aggressive alkaline environment. Electrodes in AWE systems are prone to corrosion and passivation, leading to higher overpotentials and a decline in catalytic activity over their operational lifespan [79,89]. Consequently, frequent maintenance and component replacement are required, increasing MC and RC, thereby complicating the long term economic viability of AWE. Research into corrosion-resistant electrode materials, such as nickel-based alloys, cobalt-doped structures, and protective oxide coatings, aims to enhance durability and minimize degradation-related losses. The discussion reinforced these challenges, noting that while surface modifications improved electrode stability, long term exposure to alkaline conditions still led to performance declines, emphasizing the need for novel protection strategies.
Another key concern is gas crossover, where hydrogen and oxygen gases mix due to diffusion through the electrolyte, posing both safety risks and efficiency losses [90]. This challenge is particularly critical because hydrogen-oxygen crossover increases the risk of explosion, making effective gas separation a fundamental requirement in AWE system design. Improved diaphragm and membrane technologies are essential to enhance gas selectivity while maintaining high ionic conductivity, ensuring safe and efficient electrolysis operations. The discussion in these studies [91,92] suggested that enhanced membrane structures reduced gas crossover to some extent; however, complete mitigation remains an ongoing challenge that requires further material innovations.
Membrane durability remains a critical bottleneck in AWE development. The membranes used in AWE must withstand highly corrosive alkaline environments while maintaining high proton conductivity and minimal degradation over extended operational periods. Current membranes often suffer from structural deterioration, reducing system longevity and necessitating frequent replacements, further contributing to increased operational costs. Advances in reinforced polymeric membranes, composite materials, and anion-exchange membranes are being explored to address these limitations [93].
From an economic perspective, AWE is highly dependent on electricity costs, which significantly impact overall operating expenses. The discussion reinforced that economic feasibility remains a key barrier, with sensitivity analysis showing that electricity costs and system longevity are major determinants of profitability. In regions where renewable electricity is expensive or unavailable, AWE’s viability becomes questionable, especially when competing with fossil fuel-based hydrogen production methods like SMR. Furthermore, the high upfront capital investment required for large-scale AWE deployment poses an additional challenge, limiting market penetration. Policy incentives, such as potential government subsidies for renewable electricity, carbon pricing mechanisms, and government-backed hydrogen roadmaps, are crucial for making AWE more financially competitive in the global market. In 2014, Brunei adopted a strategic plan to achieve a 10% share of renewables in the national energy mix by 2035 [93]. Given Brunei’s potential in solar and wind energy [3], integrating AWE with these renewable sources could significantly enhance its cost-effectiveness.
Overcoming these challenges will require a multidisciplinary approach, integrating material science, electrochemical engineering, and policy support. Innovations in catalyst materials, system design, and automation could significantly enhance AWE efficiency, reliability, and cost-effectiveness. Additionally, strategic investments in renewable energy infrastructure, coupled with technological improvements in electrolyzer design, will be essential for positioning AWE as a dominant hydrogen production method in the coming decades. Results emphasized that targeted improvements in component stability and cost reductions are necessary for AWE to achieve large-scale adoption.
Ultimately, the future success of AWE will depend on continued research, industrial-scale innovation, and favorable policy frameworks that incentivize clean hydrogen production, making AWE a critical pillar in the transition to a sustainable energy future.

5. Conclusions

The comparison of hydrogen production methods is based on the amount of hydrogen produced by each process. According to the techno-economic analysis, AWE is more economically advantageous than SMR, with an LCC of USD$408.71 million compared to SMR at USD$67.7 million. This higher LCC reflects AWE’s greater revenue potential, primarily due to its ability to generate by-products, namely hydrogen and oxygen. An analysis of AWE’s key cost components reveals that electricity accounts for 51.01% of its operating costs, while feedstock contributes 50.44%. In contrast, SMR is more heavily influenced by feedstock costs, which make up 41.68% of total expenses, with operations accounting for 55.04%. This study suggests that optimizing energy efficiency and reducing electricity expenses could further enhance AWE’s profitability.
However, the EIA shows that SMR produces lower emissions compared to AWE. These findings provide a balanced perspective, highlighting the trade-offs between economic feasibility and environmental impact in both hydrogen production methods. Sensitivity analysis, which examined key factors such as discount rate, system efficiency, KOH concentration and price, electricity and water costs, and selling prices, revealed significant dependencies on cost variations.
The cost performance comparison between SMR and AWE demonstrates that AWE offers better economic and environmental efficiency for hydrogen production under certain conditions. Both methods possess unique advantages, but AWE proves to be more advantageous in terms of time and cost consumption, as well as LCC and environmental impacts. While SMR operates at a reformer efficiency of about 85%, AWE’s electrolyzer stack efficiency is slightly lower at 80%. Despite this, AWE’s design provides operational ease and the potential for integration with renewable energy sources, enhancing its long term viability. When evaluated at an 8% discount rate, AWE’s LCC remains competitive over time, whereas SMR’s profitability is hindered by its dependence on natural gas and the associated costs.
The selling prices of hydrogen and oxygen play a significant role in determining the economic impact. For AWE, increasing the hydrogen price from USD$4.88 to USD$5.38 per kg results in a USD$37.72 million improvement in the LCC. Additionally, a 10% increase in both by-products improved LCC by USD$35.1 million, reinforcing AWE’s potential for scalability and profitability under standard market conditions. In contrast, SMR struggles with conversion inefficiencies, as natural gas—accounting for 41.68% of total costs—serves as the primary feedstock. Furthermore, SMR is highly vulnerable to market fluctuations in CH4 prices. Given its reliance on electricity, AWE is more compatible with renewable energy sources, offering long term sustainability. Moreover, hydrogen’s selling price helps stabilize revenue, ensuring financial consistency.
LCC analysis reveals that the operating costs for SMR are primarily driven by workforce and feedstock costs, with feedstock making up 55.04% of the operating costs. In comparison, AWE’s operating costs account for 48.64%, with electricity being the main contributor. However, AWE’s feedstock cost stands at 50.44%, largely due to spending on electrolytes. Despite this, with the adoption of forward-thinking stack technologies and reduced energy consumption, AWE becomes more cost-effective to operate over its lifecycle, resulting in a lower overall LCC compared to SMR in the long term.
The primary advantage of AWE lies in its compatibility with renewable energy sources to produce “green hydrogen”. Although AWE currently generates 53,142 metric tons of CO2 annually, significantly higher than SMR’s 9100 metric tons, this emission gap can be reduced by utilizing clean electricity. In contrast, SMR not only produces CO2 but also sulfur oxides, further contributing to pollution. While SMR offers higher initial efficiency and lower electricity costs, AWE proves to be more sustainable and economically viable in the long term due to its alignment with renewable energy sources, reduced reliance on fossil fuels, and adaptability to market price fluctuations. However, current economic barriers such as high CAPEX, electrolyte costs, and the absence of renewable integration remain significant challenges for AWE. To support this development, government subsidies or increased investment in research and development (R&D), particularly in reducing CAPEX and electrolyte costs, as well as the integration of renewable energy sources, will be essential to unlocking AWE’s full potential as a sustainable energy solution. Ongoing advancements in AWE technology are expected to improve efficiency and enhance its competitiveness with other hydrogen production methods, solidifying its role in the hydrogen economy’s future development.
Future research could enhance this study by applying Response Surface Methodology (RSM) for a more comprehensive multi-variable sensitivity analysis, considering the combined effects of feedstock costs, electricity tariffs, water prices, and policy interventions. Additionally, the impact of carbon taxation on hydrogen production economics warrants further investigation, particularly its influence on AWE’s competitiveness when powered by grid electricity. While this study used Brunei-specific data, the methodology can be adapted to other regions by integrating localized energy costs, taxation policies, and infrastructure constraints. Further work could also explore the economic feasibility of hybrid renewable-electrolysis systems, optimizing AWE’s integration with solar and wind energy to reduce grid dependency and improve sustainability.
Beyond economic considerations, future work should also address the opportunities and challenges outlined in Section 4, particularly those related to efficiency limitations, material degradation, and system design improvements. Advancements in electrode materials and surface modifications could enhance catalytic activity and durability, mitigating performance losses due to corrosion and passivation in alkaline environments. Similarly, improvements in membrane technology could enhance gas separation efficiency, reducing gas crossover risks and improving overall safety and reliability. The integration of hybrid electrolysis models, such as combining AWE with PEMWE or SOECs, could further improve operational flexibility and energy efficiency, particularly when coupled with renewable energy sources. A promising area for future research is the adoption of automation and AI-driven process control, which could optimize real-time system performance, minimize downtime, and extend the operational lifespan of AWE systems. The implementation of predictive maintenance strategies could further reduce component failure rates and maintenance costs, thereby improving long term economic viability.
To provide a more holistic assessment of hydrogen production sustainability, future studies could adopt Life Cycle Assessment (LCA) frameworks, such as ReCiPe, to evaluate additional environmental indicators, including water footprint, land use, and other air pollutant emissions. Incorporating such methods would enable a broader evaluation of hydrogen production pathways, ensuring a comprehensive comparison of their long term sustainability impacts.
Addressing these technical, economic, and environmental challenges will be essential for positioning AWE as a viable large-scale hydrogen production method. Continued advancements in system design, material innovation, and policy-driven incentives will play a crucial role in supporting global energy transitions and enhancing the sustainability of hydrogen-based technologies.

Supplementary Materials

The following supporting information can be downloaded at: https://www.mdpi.com/article/10.3390/hydrogen6020023/s1, Figure S1: Block flow diagram of SMR; Figure S2: Block flow diagram of AWE.

Author Contributions

Conceptualization, H.S. and P.E.A.; methodology, C.C.C., M.D.S., J.Y.L., P.S.S., D.N.H.A.P.H.O.A., J.Y.R., R.X.H.T., M.K.Y., H.F.K., H.S. and P.E.A.; software, C.C.C., D.N.H.A.P.H.O.A., J.Y.R., R.X.H.T. and P.E.A.; validation, D.N.H.A.P.H.O.A., H.S. and P.E.A.; formal analysis, C.C.C., M.D.S., J.Y.L., P.S.S., D.N.H.A.P.H.O.A., J.Y.R., R.X.H.T., M.K.Y., H.F.K., H.S. and P.E.A.; investigation, C.C.C., M.D.S., J.Y.L., P.S.S., D.N.H.A.P.H.O.A., J.Y.R., R.X.H.T., M.K.Y., H.F.K., H.S. and P.E.A.; data curation, C.C.C., M.D.S., D.N.H.A.P.H.O.A., J.Y.R., R.X.H.T. and P.E.A.; writing—original draft preparation, D.N.H.A.P.H.O.A., H.S. and P.E.A.; writing—review and editing, D.N.H.A.P.H.O.A., H.S. and P.E.A.; supervision, H.S. and P.E.A.; project administration, H.S. and P.E.A.; funding acquisition, H.S. All authors have read and agreed to the published version of the manuscript.

Funding

The APC was funded by Universiti Brunei Darussalam Research Grant No.: UBD/RSCH/1.3/FICBF(b)/2020/005.

Data Availability Statement

The original contributions presented in this study are included in the article/Supplementary Material. Further inquiries can be directed to the corresponding authors.

Conflicts of Interest

The authors declare no conflicts of interest.

References

  1. Mahlia, T.M.I.; Lim, J.Y.; Aditya, L.; Riayatsyah, T.M.I.; Abas, A.E.P.; Nasruddin. Methodology for implementing power plant efficiency standards for power generation: Potential emission reduction. Clean. Technol. Environ. Policy 2018, 20, 309–327. [Google Scholar] [CrossRef]
  2. Mahlia, T.M.I.; Syaheed, H.; Abas, A.E.P.; Kusumo, F.; Shamsuddin, A.H.; Ong, H.C.; Bilad, M.R. Organic Rankine Cycle (ORC) System Applications for Solar Energy: Recent Technological Advances. Energies 2019, 12, 2930. [Google Scholar] [CrossRef]
  3. Malik, A.Q. Assessment of the potential of renewables for Brunei Darussalam. Renew. Sustain. Energy Rev. 2011, 15, 427–437. [Google Scholar] [CrossRef]
  4. Manzella, A. Geothermal energy. EPJ Web Conf. 2017, 148, 12. [Google Scholar] [CrossRef]
  5. Mahlia, T.M.I.; Syazmi, Z.; Mofijur, M.; Abas, A.P.; Bilad, M.; Ong, H.C.; Silitonga, A. Patent landscape review on biodiesel production: Technology updates. Renew. Sustain. Energy Rev. 2020, 118, 109526. [Google Scholar] [CrossRef]
  6. Iqbal, M.; Khan, F.U.; Mehdi, M.; Cheok, Q.; Abas, E.; Nauman, M.M. Power harvesting footwear based on piezo-electromagnetic hybrid generator for sustainable wearable microelectronics. J. King Saud Univ.—Eng. Sci. 2022, 34, 329–338. [Google Scholar] [CrossRef]
  7. Aravindan, M.; Kumar, P. Hydrogen towards sustainable transition: A review of production, economic, environmental impact and scaling factors. Results Eng. 2023, 20, 101456. [Google Scholar] [CrossRef]
  8. Incer-Valverde, J.; Korayem, A.; Tsatsaronis, G.; Morosuk, T. “Colors” of hydrogen: Definitions and carbon intensity. Energy Convers. Manag. 2023, 291, 117294. [Google Scholar] [CrossRef]
  9. Li, F.; Wu, Q.; Yuan, W.; Chen, Z. Ruthenium-based single atom catalysts: Synthesis and application in the electrocatalytic hydrogen evolution reaction. Dalton Trans. 2024, 53, 12022–12033. [Google Scholar] [CrossRef]
  10. Li, X.; Yao, Y.; Tian, Y.; Jia, J.; Ma, W.; Yan, X.; Liang, J. Recent advances in key components of proton exchange membrane water electrolysers. Mater. Chem. Front. 2024, 8, 2493–2510. [Google Scholar] [CrossRef]
  11. Kwon, J.; Ko, S.; Kim, H.; Park, H.J.; Lee, C.; Yeo, J. Recent advances in vacuum- and laser-based fabrication processes for solar water-splitting cells. Mater. Chem. Front. 2024, 8, 2322–2340. [Google Scholar] [CrossRef]
  12. Bauer, C.; Treyer, K.; Antonini, C.; Bergerson, J.; Gazzani, M.; Gencer, E.; Gibbins, J.; Mazzotti, M.; McCoy, S.T.; McKenna, R.; et al. On the climate impacts of blue hydrogen production. Sustain. Energy Fuels 2022, 6, 66–75. [Google Scholar] [CrossRef]
  13. Howarth, R.W.; Jacobson, M.Z. How green is blue hydrogen? Energy Sci. Eng. 2021, 9, 1676–1687. [Google Scholar] [CrossRef]
  14. Zun, M.T.; McLellan, B.C. Cost Projection of Global Green Hydrogen Production Scenarios. Hydrogen 2023, 4, 932–960. [Google Scholar] [CrossRef]
  15. Reichartz, T.; Jacobs, G.; Rathmes, T.; Blickwedel, L.; Schelenz, R. Optimal position and distribution mode for on-site hydrogen electrolyzers in onshore wind farms for a minimal levelized cost of hydrogen (LCoH). Wind Energy Sci. 2024, 9, 281–295. [Google Scholar] [CrossRef]
  16. Jaszczur, M.; Hassan, Q.; Sameen, A.Z.; Salman, H.M.; Olapade, O.T.; Wieteska, S. Massive Green Hydrogen Production Using Solar and Wind Energy: Comparison between Europe and the Middle East. Energies 2023, 16, 5445. [Google Scholar] [CrossRef]
  17. Ingale, G.U.; Kwon, H.-M.; Jeong, S.; Park, D.; Kim, W.; Bang, B.; Lim, Y.-I.; Kim, S.W.; Kang, Y.-B.; Mun, J.; et al. Assessment of Greenhouse Gas Emissions from Hydrogen Production Processes: Turquoise Hydrogen vs. Steam Methane Reforming. Energies 2022, 15, 8679. [Google Scholar] [CrossRef]
  18. Sánchez-Bastardo, N.; Schlögl, R.; Ruland, H. Methane Pyrolysis for Zero-Emission Hydrogen Production: A Potential Bridge Technology from Fossil Fuels to a Renewable and Sustainable Hydrogen Economy. Ind. Eng. Chem. Res. 2021, 60, 11855–11881. [Google Scholar] [CrossRef]
  19. Yin, Y.; Wang, J.; Li, L. An Assessment Methodology for International Hydrogen Competitiveness: Seven Case Studies Compared. Sustainability 2024, 16, 4981. [Google Scholar] [CrossRef]
  20. Arcos, J.M.M.; Santos, D.M.F. The Hydrogen Color Spectrum: Techno-Economic Analysis of the Available Technologies for Hydrogen Production. Gases 2023, 3, 25–46. [Google Scholar] [CrossRef]
  21. Luboń, K.; Tarkowski, R.; Uliasz-Misiak, B. Impact of Depth on Underground Hydrogen Storage Operations in Deep Aquifers. Energies 2024, 17, 1268. [Google Scholar] [CrossRef]
  22. Noussan, M.; Raimondi, P.P.; Scita, R.; Hafner, M. The Role of Green and Blue Hydrogen in the Energy Transition—A Technological and Geopolitical Perspective. Sustainability 2020, 13, 298. [Google Scholar] [CrossRef]
  23. Zhao, C.; Kobayashi, L.Z.; Alquaity, A.B.S.; Monfort, J.-C.; Cenker, E.; Miralles, N.; Sarathy, S.M. Solutions for decarbonising urban bus transport: A life cycle case study in Saudi Arabia. Commun. Eng. 2024, 3, 95. [Google Scholar] [CrossRef]
  24. Zayat, B.; Mitra, D.; Irshad, A.; Rajan, A.S.; Narayanan, S.R. Inexpensive and robust iron-based electrode substrates for water electrolysis and energy storage. Curr. Opin. Electrochem. 2021, 25, 100628. [Google Scholar] [CrossRef]
  25. Brauns, J.; Turek, T. Model-Based Analysis and Optimization of Pressurized Alkaline Water Electrolysis Powered by Renewable Energy. J. Electrochem. Soc. 2023, 170, 064510. [Google Scholar] [CrossRef]
  26. Jin, L.; Nakashima, R.N.; Comodi, G.; Frandsen, H.L. Alkaline electrolysis for green hydrogen production: Techno-economic analysis of temperature influence and control. In Proceedings of the 36th International Conference on Efficiency, Cost, Optimization, Simulation and Environmental Impact of Energy Systems, ECOS 2023, Las Palmas de Gran Canaria, Spain, 25–30 June 2023; pp. 908–919. [Google Scholar] [CrossRef]
  27. Ozcan, H.; El-Emam, R.S.; Celik, S.; Amini Horri, B. Recent advances, challenges, and prospects of electrochemical water-splitting technologies for net-zero transition. Clean. Chem. Eng. 2023, 8, 100115. [Google Scholar] [CrossRef]
  28. Scheepers, F.; Stähler, M.; Stähler, A.; Rauls, E.; Müller, M.; Carmo, M.; Lehnert, W. Improving the efficiency of PEM electrolyzers through membrane-specific pressure optimization. Energies 2020, 13, 612. [Google Scholar] [CrossRef]
  29. Yan, T.; Chen, S.; Sun, W.; Liu, Y.; Pan, L.; Shi, C.; Zhang, X.; Huang, Z.-F.; Zou, J.-J. IrO2 Nanoparticle-Decorated Ir-Doped W18O49 Nanowires with High Mass Specific OER Activity for Proton Exchange Membrane Electrolysis. ACS Appl. Mater. Interfaces 2023, 15, 6912–6922. [Google Scholar] [CrossRef]
  30. Zarkadoulas, A.; Field, M.J.; Papatriantafyllopoulou, C.; Fize, J.; Artero, V.; Mitsopoulou, C.A. Experimental and Theoretical Insight into Electrocatalytic Hydrogen Evolution with Nickel Bis(aryldithiolene) Complexes as Catalysts. Inorg. Chem. 2016, 55, 432–444. [Google Scholar] [CrossRef]
  31. Choi, B.B.; Jo, J.H.; Lee, T.; Jeon, S.Y.; Kim, J.; Yoo, Y.S. Operational characteristics of high-performance kw class alkaline electrolyzer stack for green hydrogen production. J. Electrochem. Sci. Technol. 2021, 12, 302–307. [Google Scholar] [CrossRef]
  32. Heenan, T.M.M.; Robinson, J.B.; Lu, X.; Bailey, J.J.; Brett, D.J.L.; Shearing, P.R. Analyzing the Mechanical Performance of Solid Oxide Fuel Cells at Interfacial Anode/Electrolyte Regions Using Sub-Micron Resolution 3D X-Ray Computed Tomography. ECS Trans. 2017, 78, 2317–2321. [Google Scholar] [CrossRef]
  33. Sebbahi, S.; Assila, A.; Belghiti, A.A.; Laasri, S.; Kaya, S.; Hlil, E.K.; Rachidi, S.; Hajjaji, A. A comprehensive review of recent advances in alkaline water electrolysis for hydrogen production. Int. J. Hydrogen Energy 2024, 82, 583–599. [Google Scholar] [CrossRef]
  34. Abdin, Z.; Zafaranloo, A.; Rafiee, A.; Mérida, W.; Lipiński, W.; Khalilpour, K.R. Hydrogen as an energy vector. Renew. Sustain. Energy Rev. 2020, 120, 109620. [Google Scholar] [CrossRef]
  35. Taipabu, M.I.; Viswanathan, K.; Wu, W.; Hattu, N.; Atabani, A.E. A critical review of the hydrogen production from biomass-based feedstocks: Challenge, solution, and future prospect. Process Saf. Environ. Prot. 2022, 164, 384–407. [Google Scholar] [CrossRef]
  36. IEA. The Future of Hydrogen; IEA: Paris, France, 2019; Available online: https://www.iea.org/reports/the-future-of-hydrogen (accessed on 13 November 2024).
  37. Dickel, R. Blue Hydrogen as an Enabler of Green Hydrogen: The Case of Germany; Oxford Institute for Energy Studies: Oxford, UK, 2020. [Google Scholar]
  38. Tabat, M.E.; Omoarukhe, F.O.; Güleç, F.; Adeniyi, D.E.; Mukherjee, A.; Okoye, P.U.; Ogbaga, C.C.; Epelle, E.I.; Akande, O.; Okolie, J.A. Process design, exergy, and economic assessment of a conceptual mobile autothermal methane pyrolysis unit for onsite hydrogen production. Energy Convers. Manag. 2023, 278, 116707. [Google Scholar] [CrossRef]
  39. Gutiérrez Ortiz, F.J. Techno-economic assessment of supercritical processes for biofuel production. J. Supercrit. Fluids 2020, 160, 104788. [Google Scholar] [CrossRef]
  40. Colli, A.N.; Girault, H.H.; Battistel, A. Non-Precious Electrodes for Practical Alkaline Water Electrolysis. Materials 2019, 12, 1336. [Google Scholar] [CrossRef]
  41. Squadrito, G.; Nicita, A.; Maggio, G. A size-dependent financial evaluation of green hydrogen-oxygen co-production. Renew. Energy 2021, 163, 2165–2177. [Google Scholar] [CrossRef]
  42. Yusof, N.K.; Abas, P.E.; Mahlia, T.M.I.; Hannan, M.A. Techno-Economic Analysis and Environmental Impact of Electric Buses. World Electr. Veh. J. 2021, 12, 31. [Google Scholar] [CrossRef]
  43. Danial, M.; Azis, F.A.; Abas, P.E. Techno-economic analysis and feasibility studies of electric vehicle charging station. World Electr. Veh. J. 2021, 12, 264. [Google Scholar] [CrossRef]
  44. Dincer, I.; AlZahrani, A.A. 4.25 Electrolyzers. Compr. Energy Syst. 2018, 4, 985–1025. [Google Scholar] [CrossRef]
  45. Sánchez, M.; Amores, E.; Abad, D.; Rodríguez, L.; Clemente-Jul, C. Aspen Plus model of an alkaline electrolysis system for hydrogen production. Int. J. Hydrogen Energy 2020, 45, 3916–3929. [Google Scholar] [CrossRef]
  46. Jeddizahed, J.; Webley, P.A.; Hughes, T.J. Integrating alkaline electrolysis with oxyfuel combustion for hydrogen and electricity production. Appl. Energy 2024, 361, 122856. [Google Scholar] [CrossRef]
  47. Zeng, X.; Zheng, C.; Li, A.; Fan, G.; Xiao, Y.; Yan, C. Numerical study on a new separator for downhole gas-liquid separation. Chem. Eng. Res. Des. 2025, 214, 317–326. [Google Scholar] [CrossRef]
  48. Zeng, X.; Fan, G.; Xu, J.; Liu, A.; Xu, Y.; Yan, C. Experimental study on a new gas–liquid separator for a wide range of gas volume fraction. Chem. Eng. Res. Des. 2020, 160, 561–570. [Google Scholar] [CrossRef]
  49. Trap Efficiency of Reservoirs: Concept, Review and Application. Available online: https://www.researchgate.net/publication/366042934_Trap_Efficiency_of_Reservoirs_Concept_Review_and_Application (accessed on 9 March 2025).
  50. Arfan, M.; Eriksson, O.; Wang, Z.; Soam, S. Life cycle assessment and life cycle costing of hydrogen production from biowaste and biomass in Sweden. Energy Convers. Manag. 2023, 291, 117262. [Google Scholar] [CrossRef]
  51. Udemu, C.; Font-Palma, C. Potential cost savings of large-scale blue hydrogen production via sorption-enhanced steam reforming process. Energy Convers. Manag. 2024, 302, 118132. [Google Scholar] [CrossRef]
  52. Di Nardo, A.; Portarapillo, M.; Russo, D.; Di Benedetto, A. Hydrogen production via steam reforming of different fuels: Thermodynamic comparison. Int. J. Hydrogen Energy 2024, 55, 1143–1160. [Google Scholar] [CrossRef]
  53. IEA. Putting CO2 to Use Creating Value from Emissions; IEA: Paris, France, 2019. [Google Scholar]
  54. Wan, L.; Pang, M.; Le, J.; Xu, Z.; Zhou, H.; Xu, Q.; Wang, B. Oriented intergrowth of the catalyst layer in membrane electrode assembly for alkaline water electrolysis. Nat. Commun. 2022, 13, 7956. [Google Scholar] [CrossRef]
  55. Zainul, R.; Qayoom, A.; Ahmad, M.S.; Selvaraj, J.; Rahim, N.A. Investigative study of cost-effective ZrO 2 nanoparticles/acrylic based diaphragm for alkaline electrolyzers. IOP Conf. Ser. Earth Environ. Sci. 2023, 1281, 012046. [Google Scholar] [CrossRef]
  56. Pg Haji Omar Ali, D.N.H.A.; Suhaimi, H.; Abas, P.E. Membrane-Based Hydrogen Production: A Techno-Economic Evaluation of Cost and Feasibility. Hydrogen 2025, 6, 9. [Google Scholar] [CrossRef]
  57. Dou, W.W.; Ji, Y.; Wu, W. Competition, profitability, and discount rates. J. Financ. Econ. 2021, 140, 582–620. [Google Scholar] [CrossRef]
  58. Kumar, R. Perspectives on value and valuation. Valuation 2016, 3–46. [Google Scholar] [CrossRef]
  59. Navarro, I.; Yepes, V.; Martí, J. Life Cycle Cost Assessment of Preventive Strategies Applied to Prestressed Concrete Bridges Exposed to Chlorides. Sustainability 2018, 10, 845. [Google Scholar] [CrossRef]
  60. Shirasaki, Y.; Tsuneki, T.; Ota, Y.; Yasuda, I.; Tachibana, S.; Nakajima, H.; Kobayashi, K. Development of membrane reformer system for highly efficient hydrogen production from natural gas. Int. J. Hydrogen Energy 2009, 34, 4482–4487. [Google Scholar] [CrossRef]
  61. Wang, M.; Deng, C.; Chen, H.; Wang, X.; Liu, B.; Sun, C.; Chen, G.; El-Halwagi, M.M. An analytical investigation on the energy efficiency of integration of natural gas hydrate exploitation with H2 production (by in situ CH4 reforming) and CO2 sequestration. Energy Convers. Manag. 2020, 216, 112959. [Google Scholar] [CrossRef]
  62. El-Shafie, M. Hydrogen production by water electrolysis technologies: A review. Results Eng. 2023, 20, 101426. [Google Scholar] [CrossRef]
  63. de Groot, M.T.; Kraakman, J.; Garcia Barros, R.L. Optimal operating parameters for advanced alkaline water electrolysis. Int. J. Hydrogen Energy 2022, 47, 34773–34783. [Google Scholar] [CrossRef]
  64. Todoroki, N.; Wadayama, T. Heterolayered Ni–Fe Hydroxide/Oxide Nanostructures Generated on a Stainless-Steel Substrate for Efficient Alkaline Water Splitting. ACS Appl. Mater. Interfaces 2019, 11, 44161–44169. [Google Scholar] [CrossRef]
  65. Mandal, B.; Sirkar, A.; De, P.; Baran Kuila, S. Studies on the Effect of Electrolyte Concentration on Alkaline Electrolysis and Ion Exchange Membrane Water Splitting for Production of Hydrogen. Available online: http://www.esatjournals.org (accessed on 9 March 2025).
  66. Kumar, S.S.; Himabindu, V. Hydrogen production by PEM water electrolysis—A review. Mater. Sci. Energy Technol. 2019, 2, 442–454. [Google Scholar] [CrossRef]
  67. Sakr, M.; Mahrous, A.-F.M.; Balabel, A.; Ibrahim, K. Experimental Investigation into Hydrogen Production Through Alkaline Water Electrolysis. ERJ. Eng. Res. J. 2011, 34, 37–41. [Google Scholar] [CrossRef]
  68. Kim, D.; Oh, L.S.; Park, J.H.; Kim, H.J.; Lee, S.; Lim, E. Perovskite-based electrocatalysts for oxygen evolution reaction in alkaline media: A mini review. Front. Chem. 2022, 10, 1024865. [Google Scholar] [CrossRef] [PubMed]
  69. Haug, P.; Koj, M.; Turek, T. Influence of process conditions on gas purity in alkaline water electrolysis. Int. J. Hydrogen Energy 2017, 42, 9406–9418. [Google Scholar] [CrossRef]
  70. Katebah, M.; Al-Rawashdeh, M.; Linke, P. Analysis of hydrogen production costs in Steam-Methane Reforming considering integration with electrolysis and CO2 capture. Clean. Eng. Technol. 2022, 10, 100552. [Google Scholar] [CrossRef]
  71. Zakariazadeh, A.; Ahshan, R.; Al Abri, R.; Al-Abri, M. Renewable energy integration in sustainable water systems: A review. Clean. Eng. Technol. 2024, 18, 100722. [Google Scholar] [CrossRef]
  72. Lee, B.; Choe, C.; Kim, H.; Kim, A.; Shin, Y.-U.; Haider, J.; Lim, H. Economic Parity Analysis of Green Methanol Synthesis Using Water Electrolysis Based on Renewable Energy. ACS Sustain. Chem. Eng. 2021, 9, 15807–15818. [Google Scholar] [CrossRef]
  73. Grafton, R.Q.; Manero, A.; Chu, L.; Wyrwoll, P. The Price and Value of Water: An Economic Review. Camb. Prism. Water 2023, 1, e3. [Google Scholar] [CrossRef]
  74. Ali, S.M.; Alkhatib, I.I.I.; AlHajaj, A.; Vega, L.F. How sustainable and profitable are large-scale hydrogen production plants from CH4 and H2S? J. Clean. Prod. 2023, 428, 139475. [Google Scholar] [CrossRef]
  75. ECONOMICS (BOUNDLESS) Boundless (Now LumenLearning) Boundless. Available online: https://LibreTexts.org (accessed on 13 November 2024).
  76. Pei, X.; Tian, H.; Roberts, W.L. Swirling Flame Combustion of Heavy Fuel Oil Blended with Diesel: Effect of Asphaltene Concentration. Energies 2022, 15, 6156. [Google Scholar] [CrossRef]
  77. Sofiev, M.; Winebrake, J.J.; Johansson, L.; Carr, E.W.; Prank, M.; Soares, J.; Vira, J.; Kouznetsov, R.; Jalkanen, J.-P.; Corbett, J.J. Cleaner fuels for ships provide public health benefits with climate tradeoffs. Nat. Commun. 2018, 9, 406. [Google Scholar] [CrossRef]
  78. Brauns, J.; Turek, T. Alkaline Water Electrolysis Powered by Renewable Energy: A Review. Processes 2020, 8, 248. [Google Scholar] [CrossRef]
  79. Chi, J.; Yu, H.; Qin, B.; Fu, L.; Jia, J.; Yi, B.; Shao, Z. Vertically Aligned FeOOH/NiFe Layered Double Hydroxides Electrode for Highly Efficient Oxygen Evolution Reaction. ACS Appl. Mater. Interfaces 2017, 9, 464–471. [Google Scholar] [CrossRef] [PubMed]
  80. Lokesh, S.; Srivastava, R. CuAl layered double hydroxide as a highly efficient electrocatalyst for the electrolysis of water into hydrogen and oxygen fuels. Int. J. Hydrogen Energy 2023, 48, 35–50. [Google Scholar] [CrossRef]
  81. Lim, T.; Kim, S.K. Non-precious hydrogen evolution reaction catalysts: Stepping forward to practical polymer electrolyte membrane-based zero-gap water electrolyzers. Chem. Eng. J. 2022, 433, 133681. [Google Scholar] [CrossRef]
  82. Shi, W.; Zhu, J.; Gong, L.; Feng, D.; Ma, Q.; Yu, J.; Tang, H.; Zhao, Y.; Mu, S. Fe-Incorporated Ni/MoO2 Hollow Heterostructure Nanorod Arrays for High-Efficiency Overall Water Splitting in Alkaline and Seawater Media. Small 2022, 18, 2205683. [Google Scholar] [CrossRef]
  83. Pagani, G.; Hajimolana, Y.; Acar, C. Green hydrogen for ammonia production—A case for the Netherlands. Int. J. Hydrogen Energy 2024, 52, 418–432. [Google Scholar] [CrossRef]
  84. Wang, Y.; Williamson, N.; Dawson, R.; Bimbo, N. Electrodeposition of nickel–iron on stainless steel as an efficient electrocatalyst coating for the oxygen evolution reaction in alkaline conditions. J. Appl. Electrochem. 2023, 53, 877–892. [Google Scholar] [CrossRef]
  85. Hnát, J.; Plevova, M.; Tufa, R.A.; Zitka, J.; Paidar, M.; Bouzek, K. Development and testing of a novel catalyst-coated membrane with platinum-free catalysts for alkaline water electrolysis. Int. J. Hydrogen Energy 2019, 44, 17493–17504. [Google Scholar] [CrossRef]
  86. Shahidi, S.M.M.; Shayan, M.E.; Najafi, G.; Mazlan, M. Exergy and energy analysis of Organic Rankine Cycle integration in the carbon black industry using pinch technology. Therm. Sci. Eng. Progress. 2023, 46, 102160. [Google Scholar] [CrossRef]
  87. Arunachalam, M.; Han, D.S. Efficient solar-powered PEM electrolysis for sustainable hydrogen production: An integrated approach. Emergent Mater. 2024, 7, 1401–1415. [Google Scholar] [CrossRef]
  88. Hnát, J.; Paidar, M.; Schauer, J.; Žitka, J.; Bouzek, K. Polymer anion selective membranes for electrolytic splitting of water. Part I: Stability of ion-exchange groups and impact of the polymer binder. J. Appl. Electrochem. 2011, 41, 1043–1052. [Google Scholar] [CrossRef]
  89. Li, Y.; Wei, B.; Yu, Z.; Bondarchuk, O.; Araujo, A.; Amorim, I.; Zhang, N.; Xu, J.; Neves, I.C.; Liu, L. Bifunctional Porous Cobalt Phosphide Foam for High-Current-Density Alkaline Water Electrolysis with 4000-h Long Stability. ACS Sustain. Chem. Eng. 2020, 8, 10193–10200. [Google Scholar] [CrossRef]
  90. Wu, R.; Hu, Z.; Zhang, H.; Wang, J.; Qin, C.; Zhou, Y. Bubbles in Porous Electrodes for Alkaline Water Electrolysis. Langmuir 2024, 40, 721–733. [Google Scholar] [CrossRef] [PubMed]
  91. Rehberger, H.; Rezaei, M.; Aljabour, A. Challenges and Opportunities of Choosing a Membrane for Electrochemical CO2 Reduction. Membranes 2025, 15, 55. [Google Scholar] [CrossRef]
  92. Kodir, A.; Yim, S.D.; Lee, H.; Shin, D.; Bae, B. Comprehensive study of hydrogen-crossover reducing agents for polymer electrolyte membranes. J. Membr. Sci. 2024, 707, 122989. [Google Scholar] [CrossRef]
  93. Brunei Darussalam—Countries & Regions—IEA. Available online: https://www.iea.org/countries/brunei-darussalam (accessed on 9 March 2025).
Figure 1. Summary of the sources of energy and hydrogen atoms, the process of production, and emissions associated with the following proposed colors to refer to hydrogen: green, orange, red, pink, blue, gray, turquoise, brown, black, and yellow (adapted from [8]).
Hydrogen 06 00023 g001
Figure 2. Block flow diagram of steam methane reforming.
Hydrogen 06 00023 g002
Figure 3. Block flow diagram of alkaline water electrolysis.
Hydrogen 06 00023 g003
Figure 4. (a) Breakdown of SMR costs, illustrating individual cost components considered in the LCC (i.e., CC, OC, MC, RC, and FC), (b) Percentage categorization of cost-contributing parameters for SMR.
Hydrogen 06 00023 g004
Figure 5. (a) Breakdown of AWE costs, illustrating individual cost components considered in the LCC (i.e., CC, OC, MC, RC, and FC), (b) Percentage categorization of cost-contributing parameters for AWE.
Hydrogen 06 00023 g005
Figure 6. Bar chart presentation of LCC comparison for SMR and AWE.
Hydrogen 06 00023 g006
Figure 7. Effect of varying discount rates on the LCC of SMR.
Hydrogen 06 00023 g007
Figure 8. Effect of varying discount rates on the LCC of AWE.
Hydrogen 06 00023 g008
Figure 9. Effect of reformer efficiency variation on OC and LCC of SMR.
Hydrogen 06 00023 g009
Figure 10. Effect of stack efficiency variation on OC and LCC of AWE.
Hydrogen 06 00023 g010
Figure 11. Impact of varying KOH concentration and its cost on FC and LCC of AWE.
Hydrogen 06 00023 g011
Figure 12. Effect of water and electricity cost variations on the FC, OC, and LCC of SMR.
Hydrogen 06 00023 g012
Figure 13. Effect of water and electricity cost variations on the FC, OC, and LCC of AWE.
Hydrogen 06 00023 g013
Figure 14. Effect of variations in hydrogen selling price on the LCC of the SMR plant.
Hydrogen 06 00023 g014
Figure 15. Surface plot illustrating the effect of variations in hydrogen (main product) and oxygen (by-product) selling prices on the LCC of the AWE plant.
Hydrogen 06 00023 g015
Figure 16. GHG emissions comparison between SMR and AWE.
Hydrogen 06 00023 g016
Table 1. Input and output quantities of key reactants and products.
ParameterSMRReferenceAWEReference
Feed (kg/h)384.11Calculated--
H2O Feed (kg/h)834.98Calculated2233.68Calculated
H2 Produced (kg/h)143.80Calculated143.70Calculated
Condensate (kg/h)273.82Calculated--
CO2 Purge Gas (kg/h)905.72Calculated--
Electrolyte Value (%)--35[44,45,46]
Stack Efficiency (%)--57.9[45]
H2 Separation Efficiency (%)--90[47,48]
H2 Trap Efficiency (%)--99[49]
O2 Separation Efficiency (%)--95[47,48]
O2 Trap Efficiency (%)--99[49]
KOH Feed (kg/h)--1202.75Calculated
O2 Produced (kg/h)--1149.6Calculated
Table 2. Important parameters used for techno-economic analysis.
ParameterValueUnitReference
Plant Lifetime20year[50]
Hydrogen Production Rate1,259,758.1kg/yearCalculated
Oxygen Production Rate10,078,064.8kg/yearCalculated
Discount Rate8%[51]
Hydrogen Selling Price5.23USD/kg[41]
Oxygen Selling Price3.14USD/kg[41]
Table 3. LCC breakdown of SMR and AWE.
Steam Methane Reforming (SMR)Alkaline Water Electrolysis (AWE)
Preliminary LCC (USD)67,707,977.96408,719,639.17
Disclaimer/Publisher’s Note: The statements, opinions and data contained in all publications are solely those of the individual author(s) and contributor(s) and not of MDPI and/or the editor(s). MDPI and/or the editor(s) disclaim responsibility for any injury to people or property resulting from any ideas, methods, instructions or products referred to in the content.

