Article

Concentrated O/W Emulsion Stability of Non-Ionic Chitosan Oligomer Surfactants Modified by Epoxidized Fatty Chains at pH7: Influence of Emulsification Conditions

1
ICGM (Institut Charles Gerhardt Montpellier), University Montpellier, CNRS, ENSCM, 34293 Montpellier, France
2
LMGC (Laboratoire de Mécanique et Génie Civil), IMT Mines Ales, University Montpellier, CNRS, 30100 Ales, France
*
Author to whom correspondence should be addressed.
Polysaccharides 2024, 5(2), 67-84; https://doi.org/10.3390/polysaccharides5020005
Submission received: 29 February 2024 / Revised: 8 April 2024 / Accepted: 9 April 2024 / Published: 11 April 2024

Abstract

:
In this study, chitosan-based surfactants were synthesized by epoxy–amine chemistry to stabilize concentrated O/W emulsions at pH7. Chitosan was first depolymerized by nitrous deamination to obtain chitooligosaccharides (COS) with degrees of polymerization of 10 (DP10) and 20 (DP20). Then, three different epoxidized fatty chains, i.e., octyl/decyl glycidyl ether (C9), hexadecyl glycidyl ether (C16) and epoxidized cardanol (card), were grafted onto the amine groups of chitosan to form six amphiphilic structures. NMR measurements revealed grafting efficiencies ranging from 1 to 30% while HLB values ranged from 13 to 20. The relationships between these surfactant structures and their adsorption properties were investigated by tensiometric measurements, highlighting the need for a short hydrophilic moiety and high grafting efficiency to obtain the best adsorption. Subsequently, concentrated O/W emulsions (66% of oil) at pH7 were produced using COS-based surfactants and the impact of stirring time and speed during the emulsification process was described through rheological, droplet size and microscopy measurements. Finally, emulsions were stored over 2 months in order to study the destabilization phenomenon into the mixture, i.e., coalescence and creaming, by using laser granulometry and Turbiscan. Results demonstrated that stability could be enhanced by increasing emulsion viscosity, reducing droplet size or optimizing the adsorption layer at the O/W interfaces.

Graphical Abstract

1. Introduction

O/W emulsions are widely employed in industrial applications including cosmetics, food products, delivery systems and crop protection formulation, among others [1]. They are generally used to encapsulate active ingredients into oil droplets and distribute them evenly throughout the mixture. One way of improving the maximum concentration of active ingredients is to increase the oil content. From an oil mass ratio of 0.6, an emulsion is considered to be a concentrated emulsion [2]. Unlike dilute emulsions, the droplets in concentrated emulsions are crowded together thus increasing their interactions. Consequently, both their rheological properties and degree of stability might be different than that of diluted emulsions [3].
To enhance emulsion stability, surfactants are used as stabilizing agents. These surfactants, located at the droplet surface, exhibit the capacity to reduce interfacial tensions between water and oil, thereby sustaining emulsion stability for a certain time [4]. Nonetheless, a major challenge lies in the fact that surfactants commonly used on an industrial scale are derived from fossil resources, presenting significant toxicity and ecotoxicity risks for human health and ecosystems [5]. Over the last decade, scientific research has focused on the development of biobased surfactants possessing features such as biocompatibility, biodegradability and, most of all, nontoxicity. Biobased surfactants including lipopeptides [6], sophorolipids [7], polymeric surfactants [8] and seed oil compounds [9] are already available in the market [10] and mainly employed in food [11] and health [12] application. Some polysaccharides have been investigated as a hydrophilic part of surfactants such as chitosan [13], which is a deacetylated version of chitin. Chitin is derived from the exoskeleton of crustacea, insect’s cuticles, algae and fungi [14]. It is the most abundant biopolymer in biomass after cellulose [15], which makes it particularly interesting for the development of new biobased materials.
Chitosan exhibits significant potential for many applications including cosmetics, biotechnology, the food industry and medicine [16,17]. This is attributed to its inherent antimicrobial, antioxidative, biocompatible and biodegradable properties [18]. Furthermore, chitosan possesses both reactive alcohol and amine functions, which can be functionalized to form chitosan-based materials. These amines are potentially cationizable, enabling the formation of an ionic structure under low pH conditions. In addition, NH2 functions can enhance greater adhesion to the interface, improving stability [19]. Amphiphilic chitosan has been studied for its emulsifying properties across different applications [20,21]. Nevertheless, high molar mass chitosan exhibits high viscosity in solution and poor reactivity. By reducing the molar mass, chitooligosaccharides (COS) can be obtained [22], which are easier to functionalize [23] to reach amphiphilic branched structures capable of spontaneous self-assembly. Some papers demonstrated that branched surfactants outperform conventional surfactants in various aspects, because they exhibit lower surface tension, faster adsorption and better wetting abilities [24,25].
Generally, COS are modified with fatty acids leading to the formation of micelles employed in drug delivery applications [26], and their utility extends to other domains including direct O/W emulsion. Chapelle et al. [27] have developed a method to synthesize biobased chemically modified COS surfactants with epoxidized fatty chains, and have evaluated their potential use in O/W emulsion stabilization. Their work reveals that these surfactants exhibit fulfilling surface-active properties and can stabilize O/W emulsion for 55 days at pH = 2 (acidic conditions were used to activate the cationic character of these surfactants), as well as not being eco-toxic. These current COS-based surfactants should present the potential for broad applicability in diverse emulsion systems. However, a comprehensive understanding and optimization of emulsification conditions (surfactant structure, stirring time and stirring speed) are crucial to achieving optimal system performance over time.
Nonetheless, various destabilizing phenomena may manifest during emulsion storage such as coalescence, flocculation, or gravitational separation, leading to the emulsion breakdown. In addition, some undesirable phenomena including phase inversion and solid-like behavior at a high dispersed phase ratio may occur during the emulsification step, potentially compromising emulsion properties. Some papers have already highlighted these phenomena for conventional systems [28,29,30], or those incorporating polysaccharides as stabilizers combined with surfactants [31,32], but none on oligomeric branched surfactants such as COS-based surfactants.
The purpose of this paper is to understand the behavior of COS-based surfactants within a concentrated O/W emulsion and investigate the influence of various conditions during emulsion preparation on destabilization phenomena. First, COS-based surfactants modified with epoxidized fatty chains have been synthesized according to Chapelle’s protocol [33]. The surface-active properties of these surfactants were subsequently characterized through zeta potential, CMC and surface tension measurements. Then, these surfactants were employed at 5% by mass to emulsify a concentrated O/W emulsion at pH = 7, and the study of formulation and emulsification conditions were studied by monitoring the average droplet size and the viscosity over a 2-month storage period. Phase inversion phenomena and solid-like behavior were described using both microscopy and rheological measurements.

2. Materials and Methods

Chitosan (shrimp, 250 kDa, DA 9.4%) was purchased from Glentham Science and used as received. Cardanol glycidyl ether (NC513) was purchased from Cardolite. Octyl/decyl glycidyl ether (C9), hexadecyl glycidyl ether (C16), hydroxylamine hydrochloride (NH2OH), acetic acid (AcOH), sodium nitrite (NaNO2), sodium hydroxide (NaOH), hydrochloric acid (HCl) and acetone (>98%) were purchased from Sigma Aldrich and used without purification. Dimethylsulfoxide (DMSO) and methanol (MeOH) were obtained from VWR. Deuterium oxide (D2O) was purchased from Eurisotop.

2.1. Synthesis of Chitooligosaccharides (COS)

Chitosan (250 kDa) was depolymerized according to a protocol described by Chapelle [33]. Briefly, chitosan (1.0 g, 1 eq) was dissolved in a solution of acetic acid 1% v/v (800 µL in 80 mL of distilled water) with slow stirring at 50 °C overnight. The next day, an aqueous solution (10 mL) of NaNO2 (0.4 eq to obtain DP10, 0.2 eq to obtain DP20) was added to the solution. The reaction was carried out for 3 h at 50 °C. At the end of the reaction, the pH was raised to 10 by adding a concentrated solution of NaOH (1 M), then NH2OH (0.8 eq) was added and the solution was maintained at room temperature for 24 h under stirring. The desired product was precipitated dropwise in cold acetone (800 mL), collected by centrifugation, washed with cold acetone and vacuum dried to obtain COS as white/brown (respectively DP10/DP20) powder. To purify these COS, a solubilization in water/precipitation in acetone step was carried out, the final product was collected by vacuum filtration, washed again with cold acetone and vacuum dried.
1H NMR of DP10 (D2O, 400 MHz, 298 K) δ [ppm] (see Supplementary Materials, Figure S1): 7.43 (Hk), 4.87 (Ha’), 4.36 (Ha, Hi, Hj, Hl), 3.20–4.20 (Hb’, Hc, Hd, He, Hf, Hh, Hm), 2.58 (Hb), 1.94 (Hg)

2.2. Functionalization of COS with C9 or C16 Epoxy Fatty Chains

The synthesis of COS modified by C9 or C16 epoxy was inspired by a protocol described by Chapelle [33]. First, COS (1 g, 1 eq) was solubilized in a mixture of deionized water/MeOH (30 mL, 2:1 v/v) at 80 °C. To this solution, C9 or C16 (3 eq) in MeOH (10 mL) was added, and it was maintained at 80 °C for 24 h under stirring. The desired product was precipitated dropwise in cold acetone (300 mL), collected by centrifugation, washed with cold acetone and vacuum dried to obtain COS modified as white/brown (respectively DP10/DP20) powder. To purify these surfactants, a solubilization in water/precipitation in acetone step was carried out, the final product was collected by vacuum filtration, washed again with cold acetone and vacuum dried.
1H NMR of COS-DP10 + C9 (D2O, 400 MHz, 298 K) δ [ppm] (see Supplementary Materials, Figure S2): 7.43 (Hk), 4.87 (Ha′), 4.20–4.60 (Ha, Ha″, Hi, Hj, Hl), 3.26–4.00 (Hb′, Hb″, Hc, Hd, He, Hf, Hh, Hm, Hw, Hx, Hy), 3.24 (Hv), 2.71 (Hb), 1.94 (Hg), 1.45 (Hu), 1.19 (Ho, Hp, Hq, Hr, Hs, Ht), 0.77 (Hn)
1H NMR of COS-DP10 + C16 (D2O, 400 MHz, 298 K) δ [ppm] (see Supplementary Materials, Figure S3): 7.43 (Hk), 4.92 (Ha′), 4.20–4.60 (Ha, Ha″, Hi, Hj, Hl), 3.25–4.00 (Hb′, Hb″, Hc, Hd, He, Hf, Hh, Hm, HD, HE, HF, HC), 3.00 (Hb), 2.15 (Hg), 1.44 (HB), 1.14 (Ho, Hp, Hq, Hr, Hs, Ht, Hu, Hv, Hw, Hx, Hy, Hz, HA), 0.73 (Hn)

2.3. Functionalization of COS with Epoxidized Cardanol

The synthesis of COS modified by epoxidized cardanol was inspired by a protocol described by Chapelle [33]. First, COS (1 g, 1 eq) was solubilized in DMSO (30 mL) at 80 °C. To this solution, epoxidized cardanol (3 eq) in DMSO (10 mL) was added, and it was maintained at 80 °C for 24 h under stirring. The desired product was precipitated dropwise in cold acetone (300 mL), collected by centrifugation, washed with cold acetone and vacuum dried to obtain amphiphilic COS. To purify these surfactants, a solubilization in water/precipitation in acetone step was carried out, the final product was collected by vacuum filtration, washed again with cold acetone and vacuum dried.
1H NMR of COS-DP10 + epoxidized cardanol (D2O, 400 MHz, 298 K) δ [ppm] (see Supplementary Materials, Figure S4): 7.34 (Hk), 5.90–6.4 (HC, HD, HE, HF), 5,69 (Ho, Hq, Hr, Ht, Hu), 4.82 (Ha′) 4.15–4.55 (Ha, Ha″, Hi, Hj, Hl), 3.20–4.10 (Hb′, Hb″, Hc, Hd, He, Hf, Hh, Hm, HG, HH, HJ), 2.98 (Hb), 2.34 (Hg), 1.60–2.10 (Hp, Hs, Hv, HB), 1.28 (HA), 0.80–1.20 (Hw, Hx, Hy, Hz), 0.67 (Hn)

2.4. Calculation of the Grafting Efficiency

The grafting efficiency of epoxidized fatty chains onto chitosan amines was calculated using Equation (1) by using 1H NMR analysis. Fatty epoxy compounds are insoluble in water; thus, the signals correspond to a grafted oligomer. In addition, signal intensity corresponding to the proton in the alpha of the free amine decreased, meaning that free amines were consumed for the ring opening. To calculate the DS of free amines, the signals Hn between 0.70 and 0.85 ppm corresponding to the terminal CH3 of alkyl chains were compared to the total intensity of the amine Hb
D S % = 1 3 I H n 1 3 I H n + I H b × 100

2.5. HLB Calculation

HLB were calculated as follows with MH and ML being the molar mass of the hydrophilic and the lipophilic part, respectively (Equation (2)). MH is actually dependent on DP and it represents COS molar masses. For DP10 with one N-acetyl-β-D-glucosamine unit (MMN-acetyl-β-D-glucosamine unit = 203 g/mol), eight β-D-glucosamine units (MMβ-D-glucosamine unit = 161 g/mol) and one oxime unit (MMoxime unit = 160 g/mol) in the end-chain, MH = 1651 g/mol. For the same reasons, MH = 3303 g/mol for DP20. ML represents the fatty moieties (C9, C16 and Cardanol; MM = 200, 298 and 354 g/mol respectively) grafted onto COS. Finally, x is the number of fatty chains grafted onto COS
H L B = M H M H + ( x × M L )

2.6. Zeta Potential

The zeta potential of COS-based surfactants was measured by dynamic light scattering using a Malvern Zetasizer nano ZS equipped with a He-Ne gas laser operating at a wavelength of 633 nm. The voltage applied to the electrodes of the electrophoresis cell was 40 V. The samples were concentrated at 1 g·L−1 in deionized water at pH7. The analysis was carried out at 20 °C, and measurements were conducted in triplicate. The cell was rinsed with deionized water before each measurement.

2.7. CMC and Surface Tension

The CMC and surface tensions at the water–air interface of COS-based surfactants were determined with a SCAT Dataphysics tensiometer by using the Wilhelmy plate method. A roughened platinum plate was used. Before each measurement, the plate was rinsed with distilled water, flamed and then left to cool down. Measurements were conducted in triplicate.

2.8. Preparation of the Emulsions

Refined soybean oil was used as a dispersed oil phase. O/W emulsions were produced as follows. Surfactant was dissolved in an adequate volume of deionized water at pH = 7 by magnetic stirring, and oil was added after. The mixture was then blended with a homogenizer ULTRA-TURRAX T25 (provided from IKA-Werke, Staufen, Germany), which has a dispersion modulus S25N-18G. Speed and time of mixing were modulated. Emulsifications were performed on 15 mL of liquid. Temperatures were monitored during the emulsification stage using a temperature probe, in the same way as the thermostated bath water used to cool down the system. Emulsions were stored at 20 °C for 2 months and regularly characterized by a particle size analyzer, rheometer and Turbiscan Lab.

2.9. Droplet Size

Determination of the variation in mean droplet size was performed on a particle size analyzer Malvern 2000 (Zetasizer software v7.13) coupled with a Hydro 2000S module and equipped with a He-Ne gas laser operating at a wavelength of 633 nm. Samples were diluted enough (200–400 times) to be accepted by the device and filtered on 0.45 μm nylon filters before use. Measurements were carried out in triplicate at 20 °C. The size taken into account in this study is D50, i.e., the mean diameter. A specific index (SPAN) was also calculated by the software to quantify size distribution width. A SPAN value close to 0 means that the distribution is more uniform and the size consistency is better (Equation (3))
S P A N = D 90 D 10 D 50
where D90 is the diameter where 90% of the distribution has a smaller size, and D10 is the diameter where 10% of the distribution has a smaller size.

2.10. Rheological Behavior

Rheological properties were carried out on an Anton Paar MCR 302 rheometer with a cone plate geometry (diameter: 25 mm, angle: 2°, cone truncation: 105 µm). The viscosity η was measured on a shear rate range of 0.001 to 1000 s−1 at 20 °C (upward curves only). Time-dependent behavior was studied for one of the surfactants, i.e., DP10-card, by applying an increase in shear rate from 0.001 to 1000 s−1, followed by 15 min at 1000 s−1 and finally a decrease from 1000 to 0 s−1.
The determination of the LVR (linear viscosity region) was carried out by strain sweep tests from 0.01% to 100% for two frequencies, i.e., 1 and 10 Hz. For both frequencies, the elastic modulus G′ remains constant up to 1% strain. Consequently, the modulus G′ and G″ were measured on a frequency rate range of 1 to 100 Hz at 20 °C with a shear strain of 0.1% in order to be in the LVR.

2.11. Turbiscan

In addition to measurements by the particle size analyzer and rheometer, the stability of emulsions was evaluated by static multiple light scattering (SMLS) using a Turbiscan Lab. Twenty milliliters of the emulsions were poured into a cylindric glass cell and scanned from the bottom to the top. The stability of the emulsions was determined based on changes in both backscattering (BS%) (Equation (4)) and transmission (T%) (Equation (5)) level as a function of time, which are directly linked to d the mean particle diameter (µm) and ɸ the oil volume fraction (v) of the sample with ri the internal radius of the measurement cell (µm), λ the photon transport mean free path (µm), λ* the photon transport mean free path corrected by a factor in the case of nonisotropic scatterers (µm) (Equation (6) and (7)), T0 the transmittance of the continuous phase, g the asymmetry factor and Qs the scattering efficiency factor. These two factors are both derived from Mie’s theory [34]
B S = 1 λ 1 2
T = T 0 e 2 r i λ
λ = 2 d 3 ɸ 1 g Q s
λ = λ ( 1 g )
A destabilization index (TSI) was calculated according to the evolution of transmission and backscattering profiles. The instrument calculates the TSI value by comparing each scan to the previous one at a selected height and dividing the result by the total height (Equation (8))
T S I = i h s c a n i h s c a n i 1 ( h ) H
where scani(h) and scani−1(h) are the values of the backscattering level (when T = 0%) or transmission level (when T ≠ 0%) for a given scan “i” and the previous one “i − 1” obtained at a given height “h” and H is the total height of the sample. The TSI values change in the range 0–100. The increase in TSI value indicates a loss of emulsion stability [35].

2.12. Microscopy Measurements

Optical microscopy (Leica DM 6000M) coupled with a camera was used to observe the morphologies and the configurations of oil droplets dispersed on the emulsion. Samples were diluted between 200 and 500 times to obtain satisfying images and the objective used was ×50.
Fluorescence microscopy (EVOS FL) was also used to determine the type of the emulsion (O/W or W/O) and identify a phase inversion. The fluorescent marker for the aqueous phase is calcein. The objective used was ×50.

3. Results and Discussion

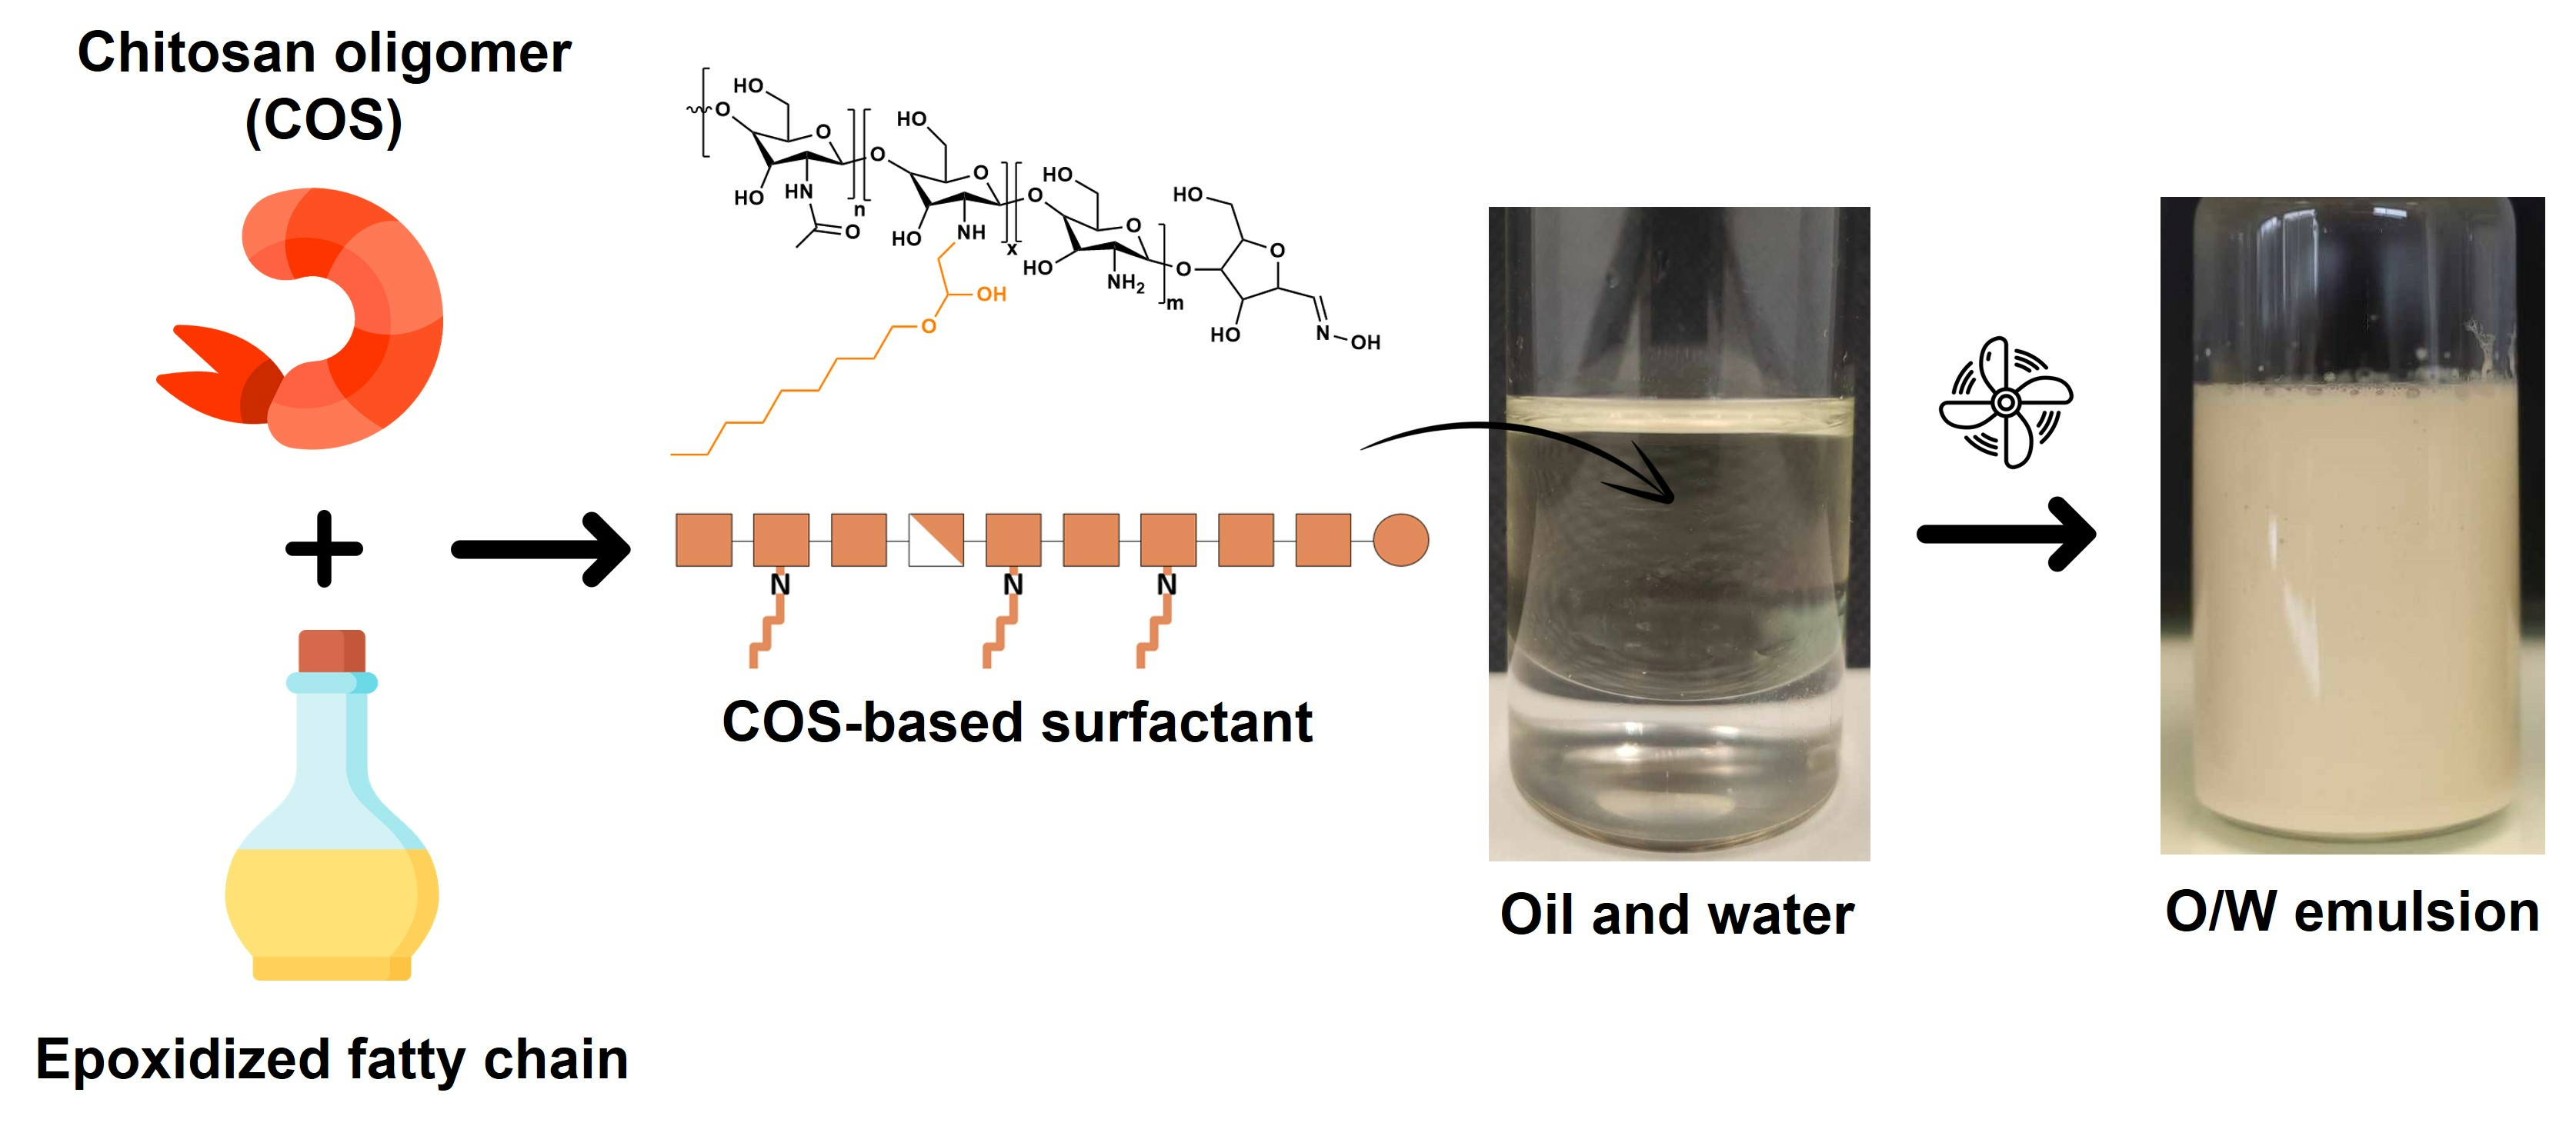
3.1. Synthesis and Characterization of COS-Based Surfactants

Three different fatty chains were grafted onto COS with different degrees of polymerization (DP). These syntheses led to six different structures. The originality of these oligomeric surfactants lies on their branched structure, which allows for better solvation, better adsorption and greater steric hindrance at the O/W interface than linear surfactants [25]. COS surfactants are named according to the size of the oligomer chain (DP10 or DP20) and the nature of hydrophobic chains (C9, C16 or card). For the grafting, three equivalents of fatty chains per glucosamine unit are employed in each synthesis. Table 1 shows their degree of substitution (DS), hydrophilic–lipophilic balance (HLB), zeta potential at pH = 7, critical micellar concentration (CMC) and surface tension at 1 g·L−1. The DS strongly depends on the COS length and the nature of the fatty chain, ranging from 1 to 30%. C9 fatty chain grafting generates the highest DS, and these values align with the findings reported in the literature [24]. Conversely, grafting onto DP20 leads to low DS.
The HLB values were calculated using an equation derived from Griffin’s (Equation (2)). An HLB greater than 7 indicates that the surfactant is water-soluble and capable of stabilizing an O/W emulsion. Here, all COS-based surfactants have an HLB value between 13.4 and 19.5, suggesting that these surfactants can be used as O/W emulsifiers. Regarding the ionic charge, chitosan possesses potentially cationizable NH2 functions with a pKa between 6.3 and 6.7. At pH = 7, these amines should be predominantly non-ionic. The zeta potential gives the electrostatic potential at the slipping plane of dispersed particles/droplets and indicates the degree of electrostatic repulsion between any two of them. This potential was measured at 1 g·L−1 of surfactant at 20 °C. As expected, these surfactants exhibit a zeta potential close to 0 mV, indicating that electrostatic repulsion in these systems should not occur.
The adsorption properties of COS-based surfactants can be evaluated according to the following two parameters: efficiency and performance. First, the efficiency of a surfactant is related to its critical micellar concentration (CMC). This CMC is defined at a given temperature as the concentration of surfactant from which the interface between air and water is saturated, and surfactant molecules spontaneous self-assemble in the medium to form micelles. Low CMC induces high surfactant efficiency. The lower the CMC, the more effective the surfactant. In this study, we were able to classify the surfactants as follows: DP10-C9 > DP10-card > DP20-C9 > DP20-card > DP10-C16 > DP20-C16. Then, the performance of a surfactant is related to the ability to lower the surface tension between two media and can be assessed by looking at values of surface tension at Csurfactants = 1 g/L, i.e., above the CMC. The lower the surface tension, the more stable the system, the better the surfactant performance. The COS-based surfactants can also be classified as follows: DP10-C9 > DP10-card > DP20-C9; DP20-card > DP10-C16 > DP20-C16. Chapelle et al. [24] had already explained the relationship between the surfactants’ structure and their adsorption properties at pH = 2. At pH = 7, these systems seem to behave similarly. First, these properties mostly depend upon the size of the COS. Oligomers are less efficient when the hydrophilic chain is longer, i.e., DP10 >> DP20. Then, the hydrophobic chain length and the DS can also influence the adsorption properties of these surfactants. A low DS, i.e., a few grafted fatty chains, decreases both performance and efficiency during the adsorption, i.e., DP10-C9 (DS = 29.3%) > DP10-card (DS = 23%) > DP10-C16 (DS = 6.6%). A sufficient number of chains is therefore required for the surfactant to adsorb as well as possible at the interface. However, grafting even more of these fatty chains onto COS is complicated due to the limit of reactivity of epoxy–amine chemistry. In addition, a too high DS may result in lower water solubility in this case.
As a consequence of these results, C16-based surfactants were not considered due to poor adsorption and low surface properties for the rest of this study.

3.2. Optimization of Emulsification Protocol

Concentrated O/W emulsions are particular emulsions with a high oil ratio, above 0.6. Both viscosity and droplet size were evaluated at the initial state (t0) for different stirring times and stirring speeds. First, the emulsion viscosity governs the kinetics of destabilization mechanisms such as gravitational separation, coalescence and flocculation, i.e., high viscosity slows down droplet movement, limiting collisions and migration [36,37]. This phenomenon is even more pronounced in a concentrated O/W emulsion where the viscosity is high enough to achieve gel-like behavior [38]. An increase in oil content therefore results in greater stability [39]. Romero et al. [40] showed that viscosity increases during the emulsification process, i.e., stirring time can influence viscosity. However, this phenomenon was not explained and will be investigated herein.
Regarding the second emulsion parameter, it is well-known in the literature that the stability of an emulsion is also dependent on the formed droplet size [41]. Generally, the smaller the droplet size, the greater the stability. This is because smaller droplets are less affected by gravitational phenomena, thus limiting creaming. However, the internal pressure in the smallest droplets is higher than in the largest droplets, favoring Ostwald ripening [42]. This phenomenon is even more prevalent in polydisperse emulsions. Several papers [43,44] have demonstrated that the most effective way to reduce droplet size is to supply high energy to the system during the emulsification phase by increasing the stirring speed.
Here, the emulsions were assessed with deionized water and refined soybean oil at pH = 7. The oil fraction was fixed at 0.66 to obtain a concentrated O/W emulsion, and a surfactant concentration of 50 g·L−1 (≈ 5% per weight (wt%)) was used. Jianguo Feng et al. [45] have shown that a high surfactant concentration is essential to optimize the O/W emulsion stability. They observed a decrease in droplet size as well as in SPAN value when the surfactant concentration was increased from 2 wt% to 6 wt%, results consistent with others O/W emulsion studies [46,47]. They also explained that when used at low concentration, surfactant molecules are unable to rapidly diffuse to the newly formed O/W interfaces and the amount of surfactant is insufficient to completely cover the exposed interfaces, thereby leading to droplet coalescence. Moreover, a high surfactant concentration can contribute to the formation of a high-strength interfacial film, thicker multilayer absorption and lower interfacial tension [48,49]. In addition, preliminary tests at different surfactant concentrations (1, 10, 30, 50 and 70 g·L−1) showed that 50 g·L−1 was the optimum concentration for obtaining both uniform and stable droplets. Indeed, at 1 g·L−1, i.e., close to the CMC, the system formed a phase inversion. This can be explained by the presence of a weak adsorption layer, which does not allow correctly stabilizing O/W interfaces. At 10 g·L−1 and 30 g·L−1, the adsorption layer is dense enough to prevent phase inversion, but microscopy images reveal a high presence of internal droplets (Figure 1), which decreases as the concentration increases. Finally, above 50 g·L−1, stable droplets are obtained. Because there were no significant differences between these two concentrations, 50 g·L−1 was chosen.
Evaluation of the modulation for emulsification conditions, i.e., stirring time and stirring speed, was first carried out on the emulsion with DP10-card surfactant. The aim is to achieve high viscosity and low droplet size.

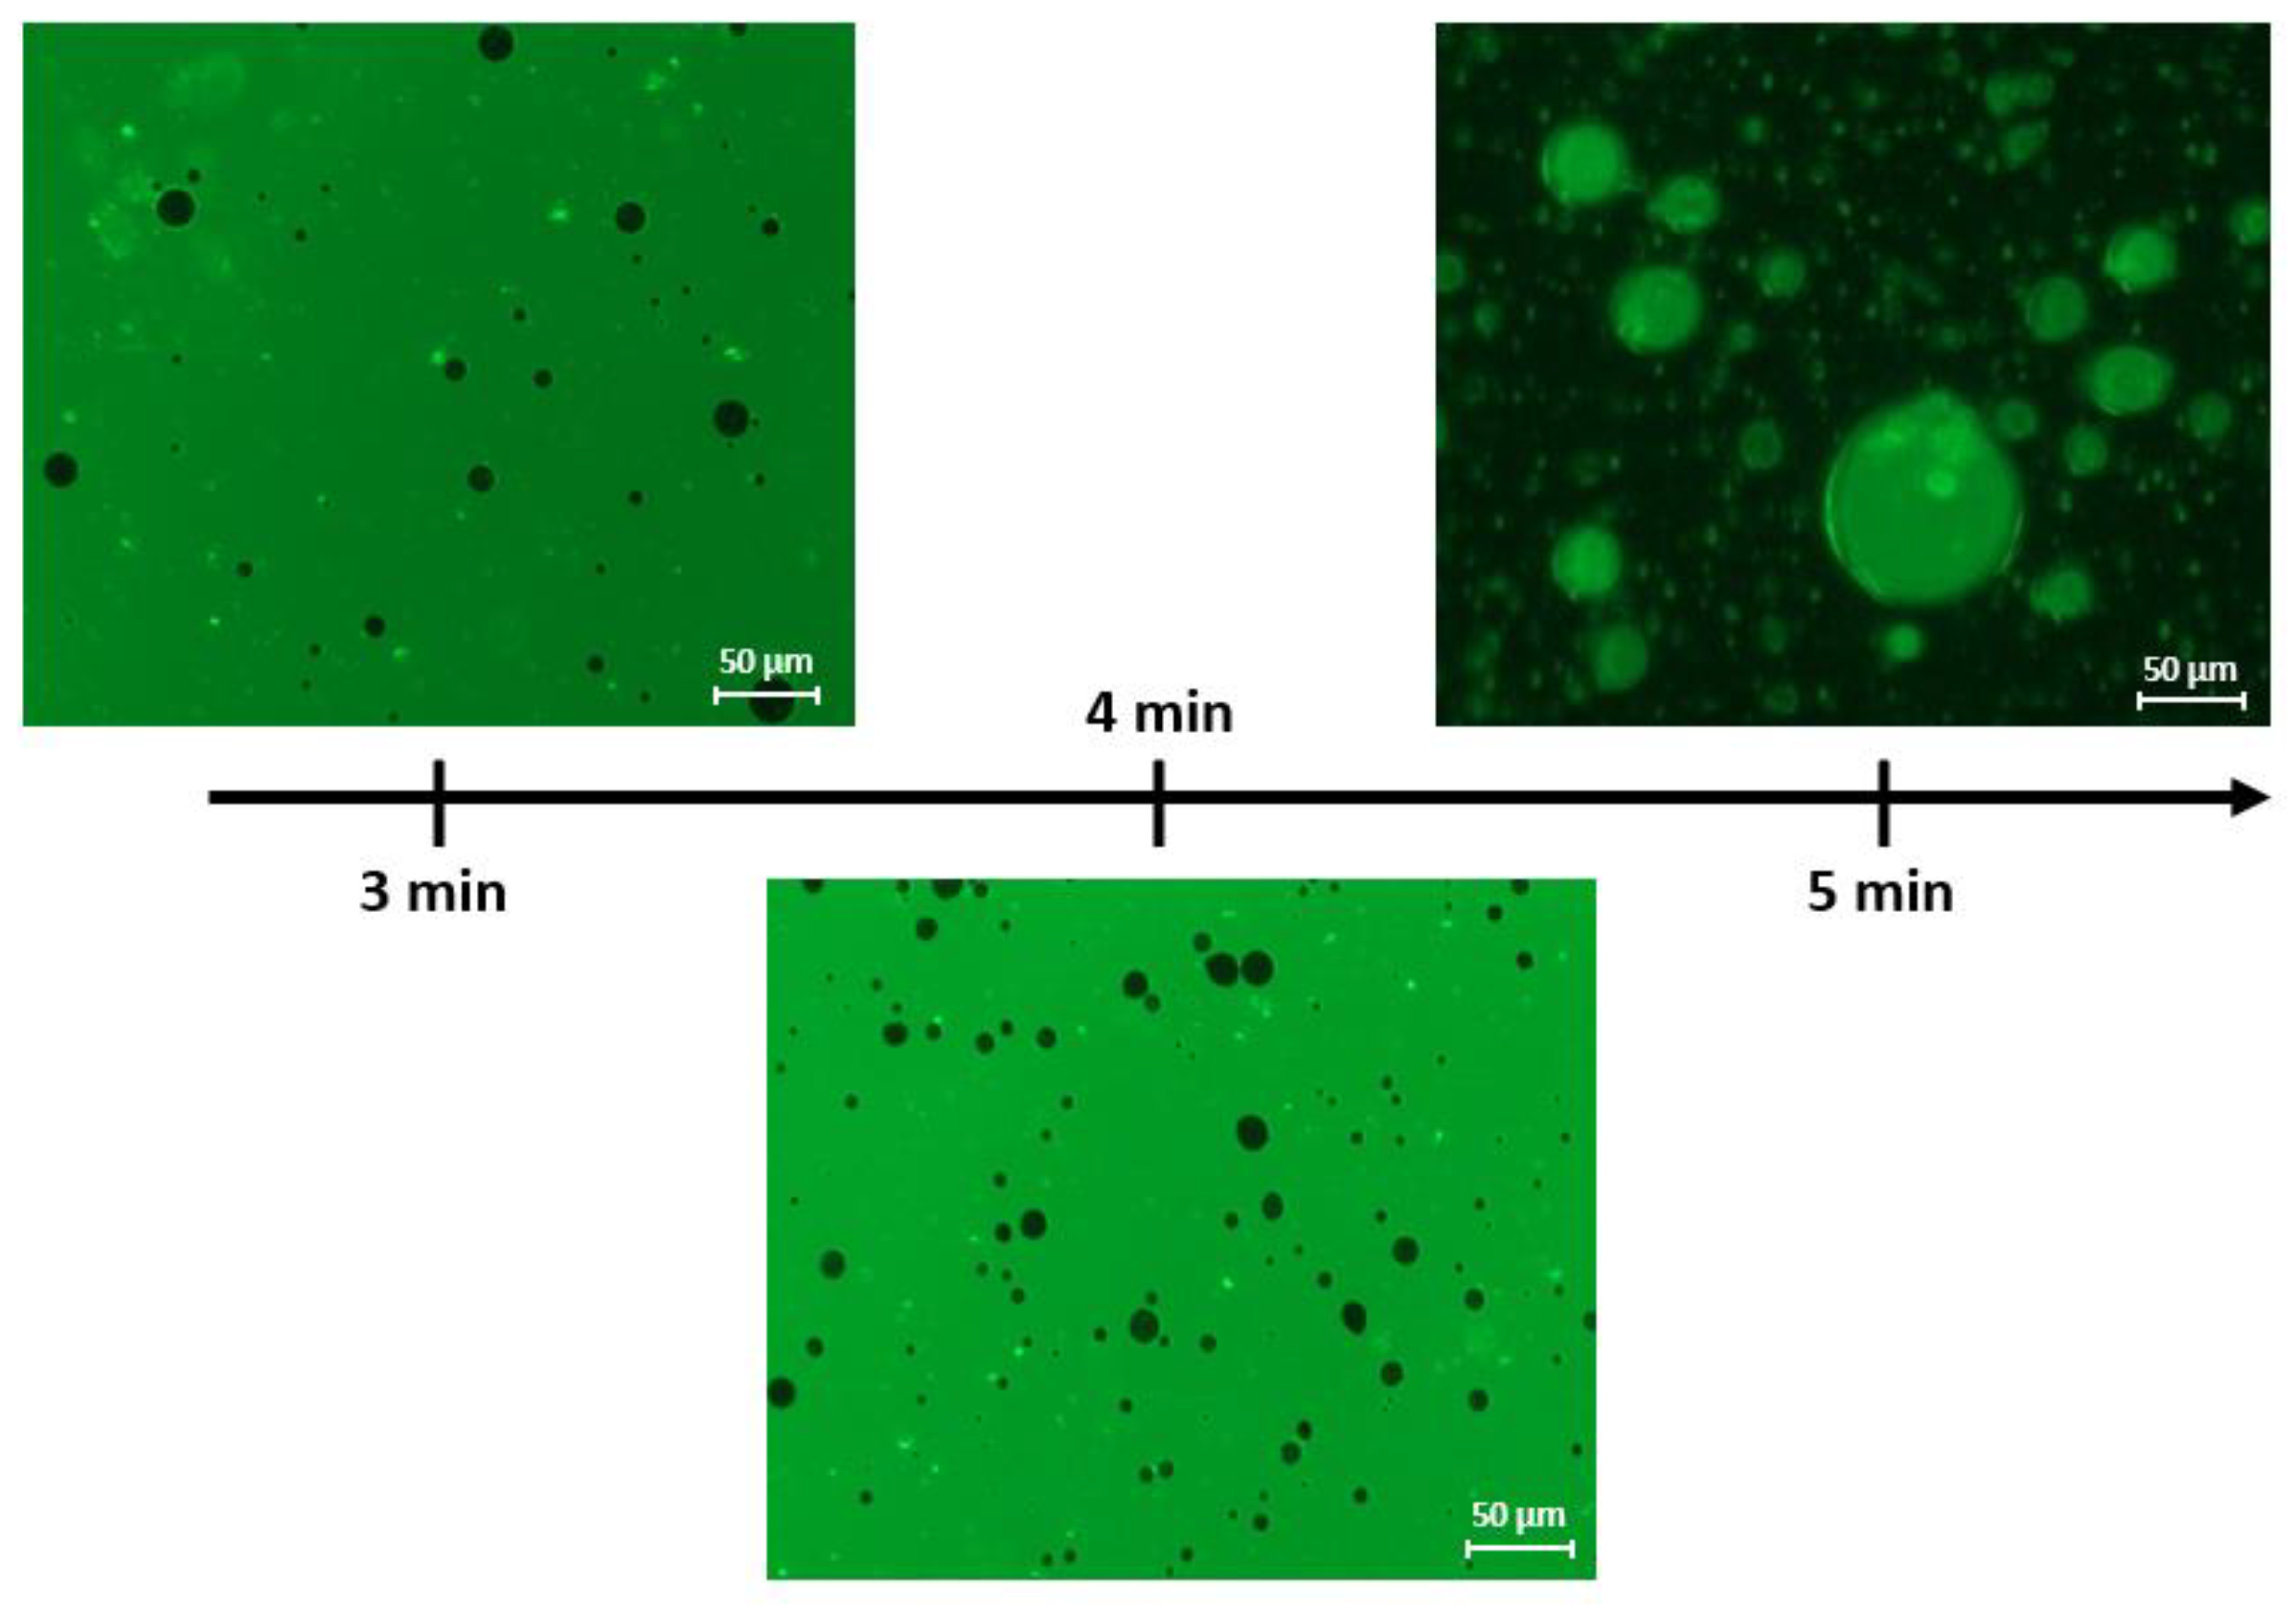
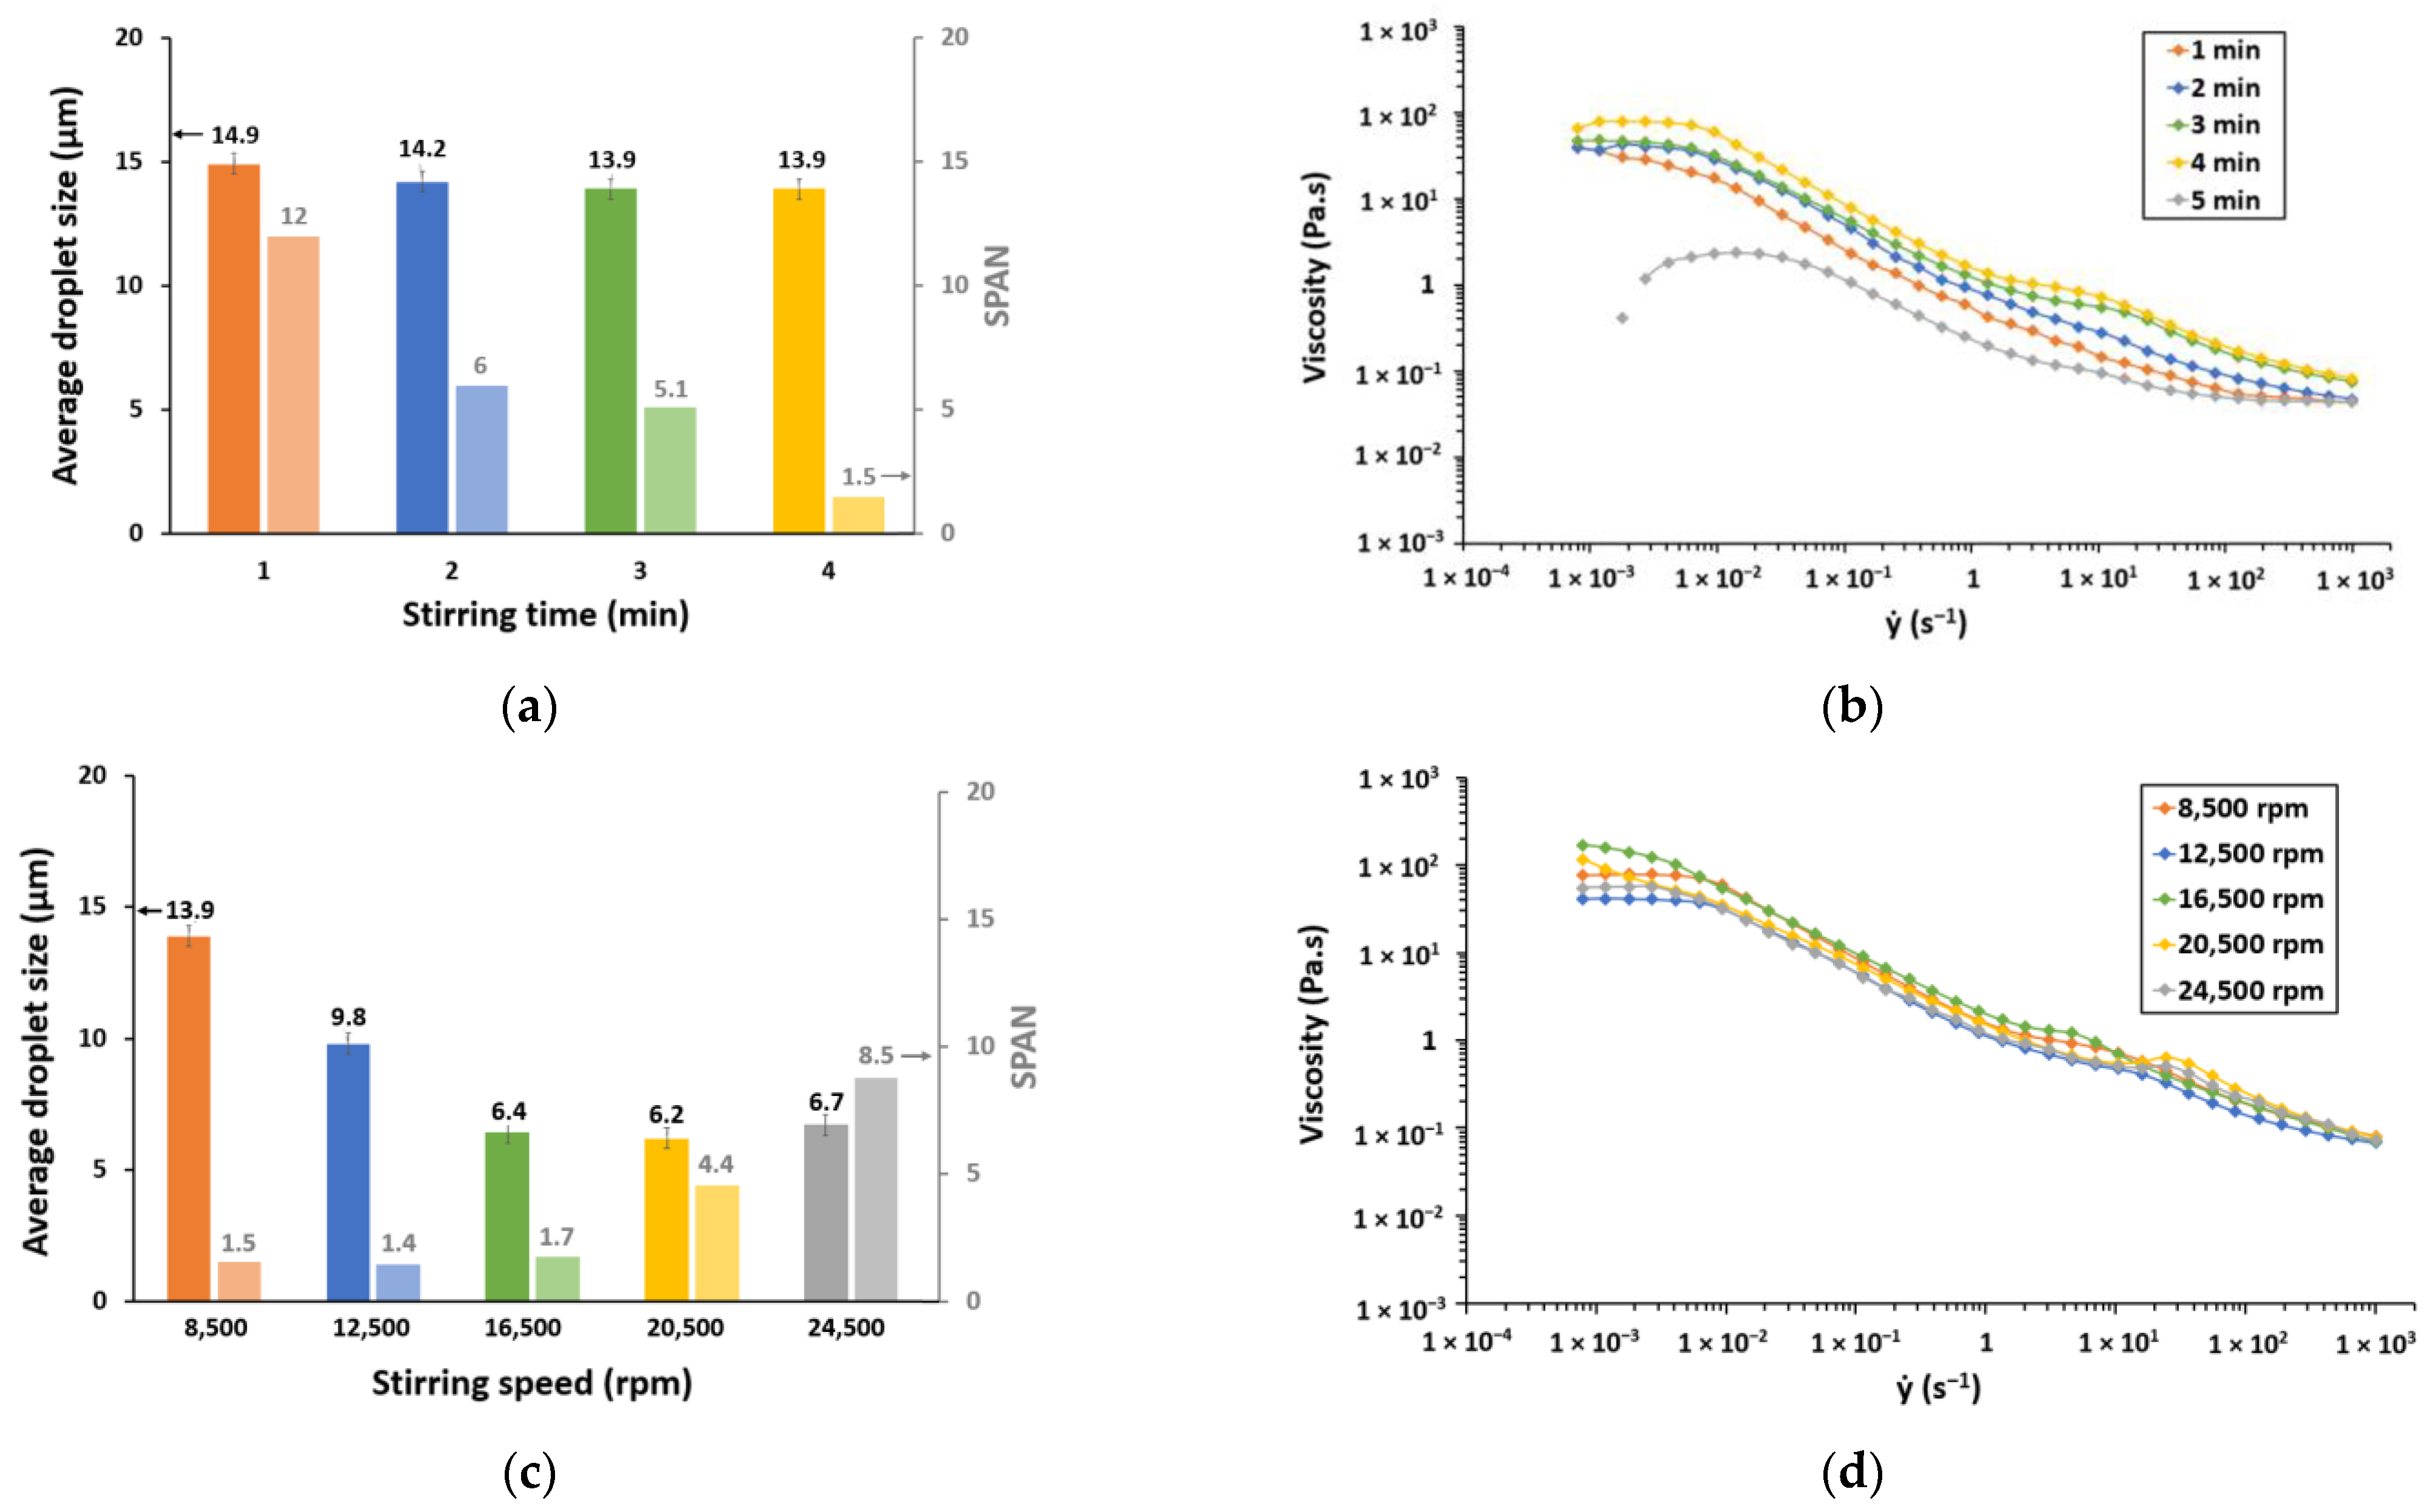
3.2.1. Stirring Time

Stirring time during the emulsification step varied from 1 to 5 min. Viscosity and mean droplet size given by light scattering are shown in Figure 2. Size values have been confirmed by calculation performed on Image J from microscopy images (see Supplementary Materials, Figure S5). First, the viscosimetric analysis reveals that all emulsions exhibit non-Newtonian fluid behavior. It has been demonstrated in the literature that within a concentrated emulsion, the potential evolution of interaction forces can lead to thixotropic behavior in certain cases [50]. This behavior was investigated for one of the systems, i.e., DP10-card, and the results (see Supplementary Materials, Figure S6) show a weakly anti-thixotropic behavior with an increase in viscosity for a constant shear rate. Viscosity is regenerated when the shear rate returns to zero. This test exhibits that these emulsions have a time-dependent behavior. For the rest of this study, the viscosity profiles presented are upward curves results only.
Looking at the results below, increasing the stirring time from 1 to 4 min generates a slight increase in viscosity. While the droplet size remains largely unchanged with increasing stirring time, the size distribution (see Supplementary Materials, Figure S7) becomes progressively finer, contributing to enhanced homogeneity. In concentrated emulsions, a high homogeneity is indicative of a high droplet density of the same size. The droplets would be in a compact configuration within the system [51] unlike a common O/W emulsion, and the resultant inter-droplet frictional forces would bring a higher resistance to flow.
The viscosity profile of the emulsion reveals a significant drop in viscosity between the 4th and 5th minute. This drop in viscosity is indicative of a phase inversion [52]. This undesirable phenomenon occurs under specific emulsification conditions, resulting in the revert of the original O/W emulsion into a W/O emulsion [53]. To confirm this phenomenon, fluorescence microscopy images were taken at 3, 4 and 5 min where the aqueous phase was green-labeled by calcein (Figure 3). Until 4 min, dark oil droplets appear in a green aqueous phase, which proves the O/W emulsion. At 5 min, green water droplets are shown into the dark oil phase, confirming the appearance of phase inversion. Here, the DP10-card surfactant could therefore be at the boundary between O/W and W/O emulsion. Nevertheless, as evidenced by the viscosity profile at 5 min, DP10-card exhibits limited efficacy in stabilizing a W/O emulsion, resulting in the formation of unstable coarse droplets (Figure 3). The optimal approach is then to stir for 4 min to ensure a high level of homogeneity and to avoid reverse W/O emulsion.

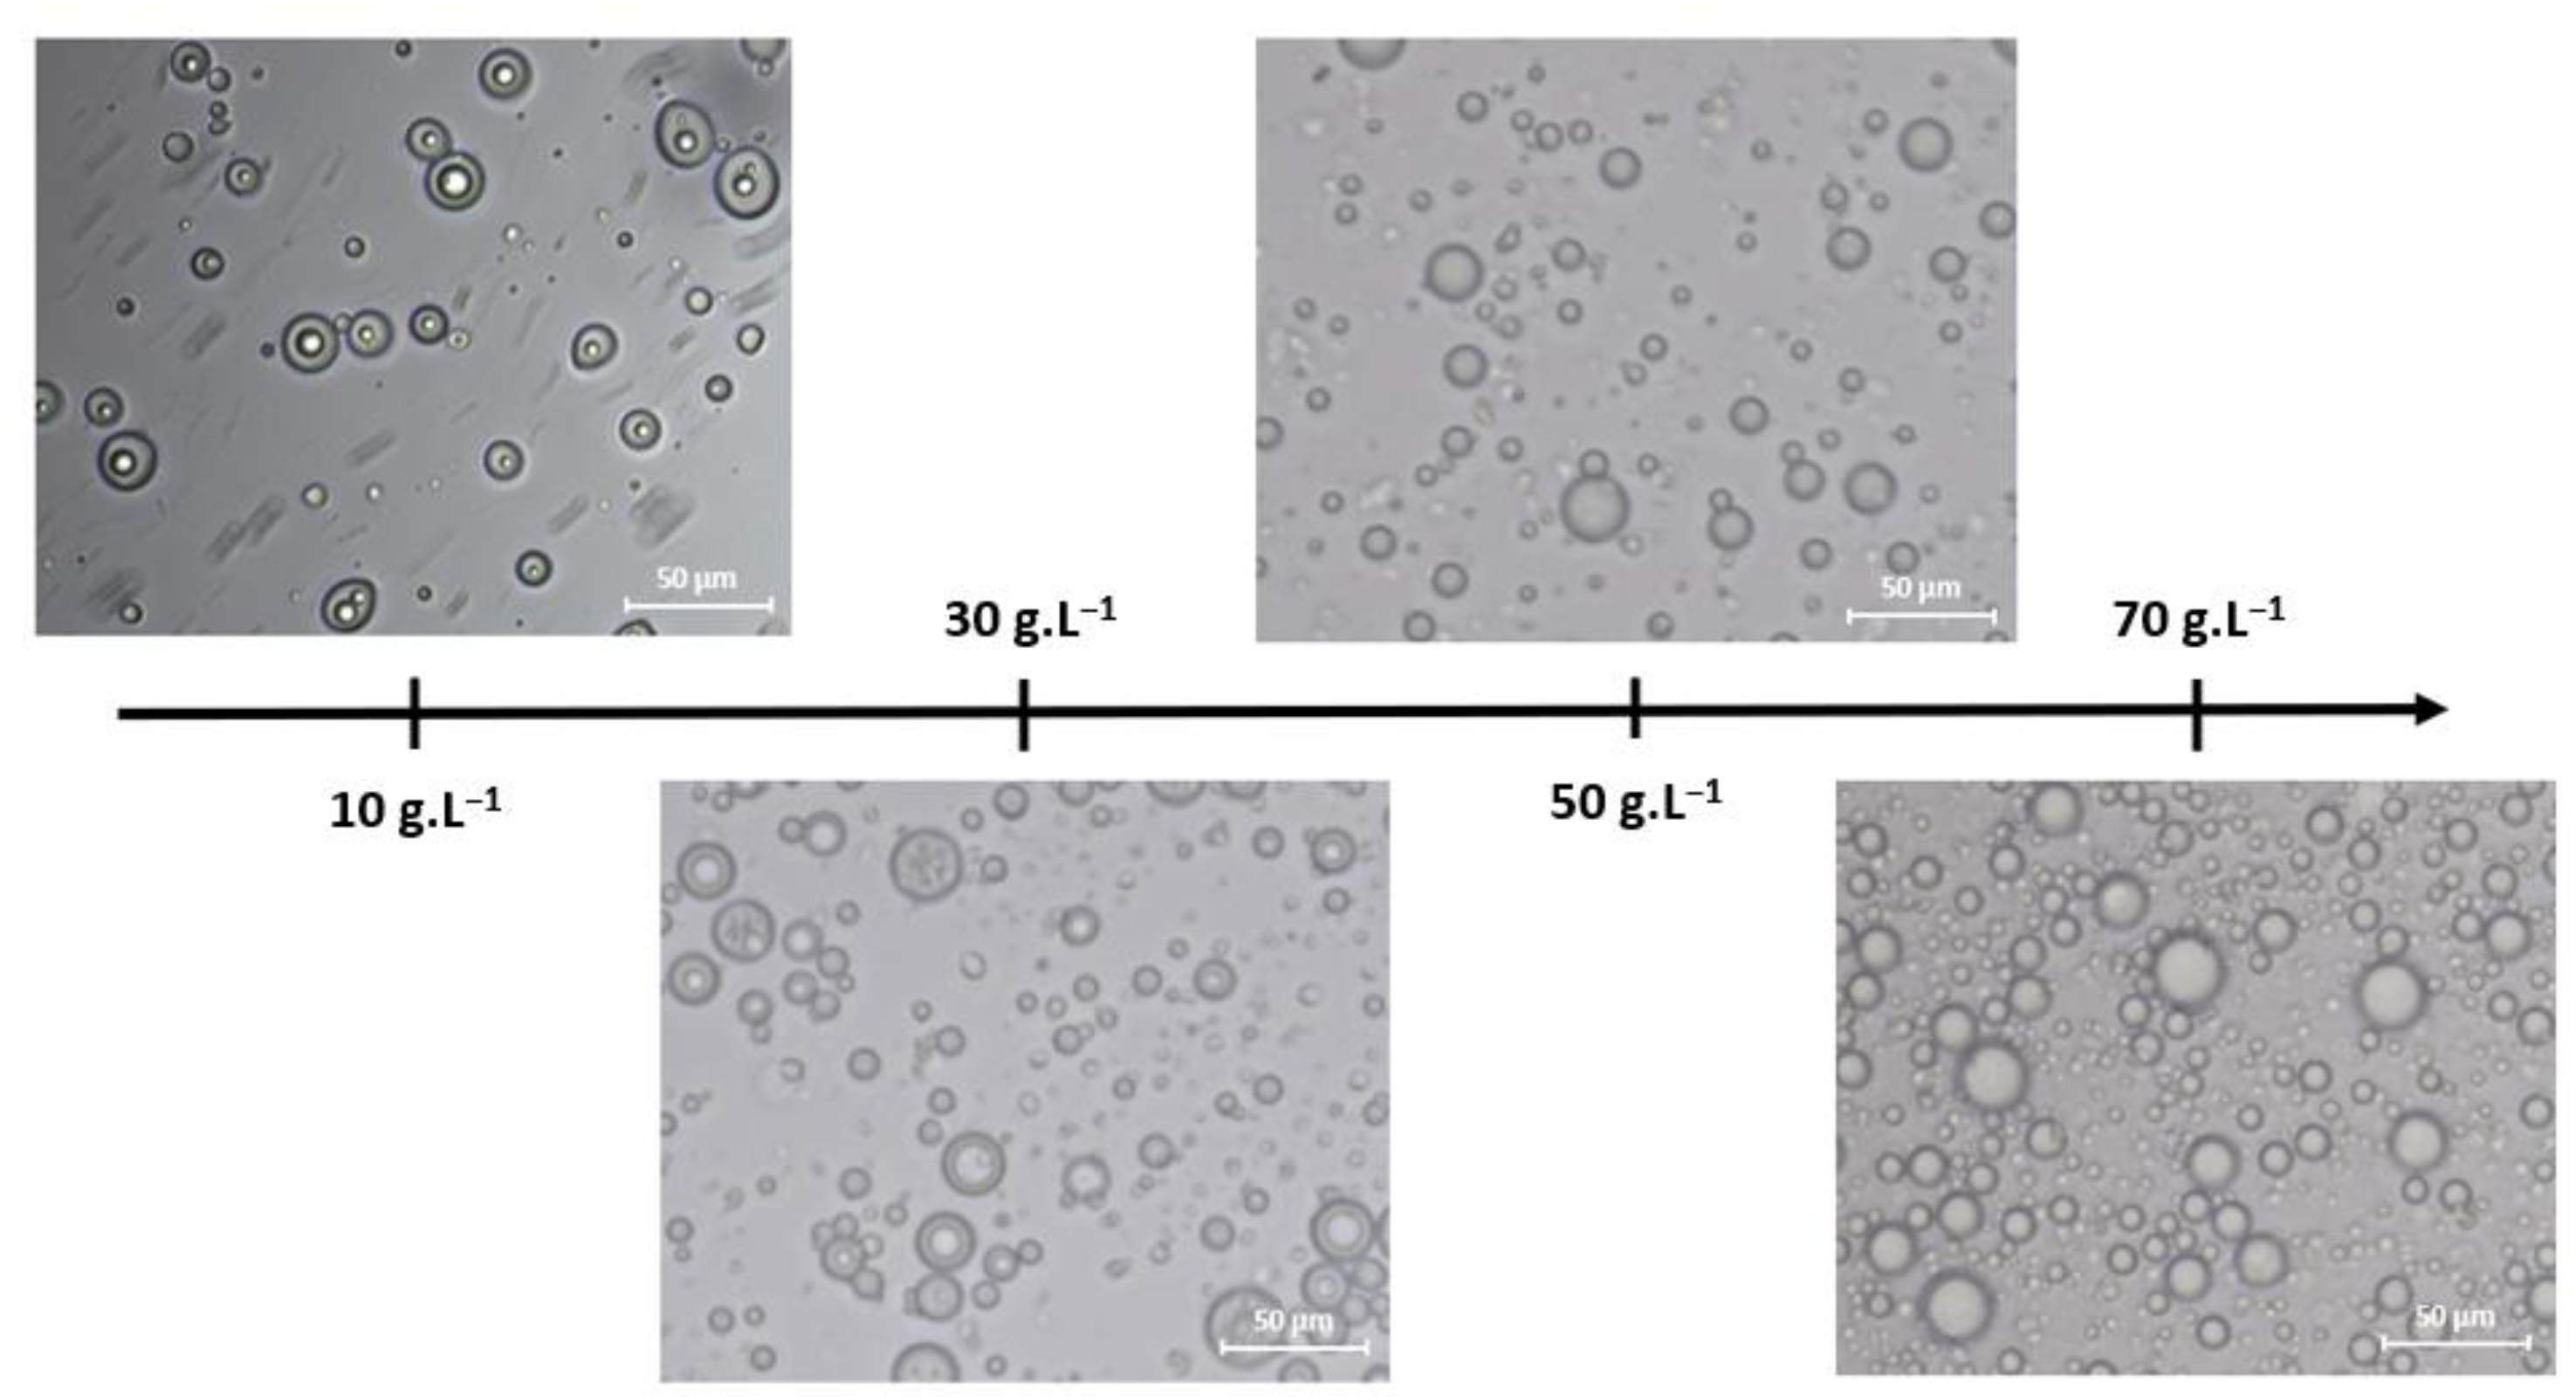
3.2.2. Stirring Speed

Increasing stirring speed leads to a progressive decrease in the average droplet size up to a certain thermodynamic limit (Figure 2c). This limit, in our case, is approximately 6 µm and is attained at a stirring speed of 16,500 rpm. Beyond this threshold, a further increase in stirring speed does not affect the average droplet size (Figure 2c), Nevertheless, the size distribution profiles indicate an alteration in the width of the distribution. A comparison of the size distribution profiles (see Supplementary Materials, Figure S8) of emulsions generated at 16,500 rpm, 20,500 rpm and 24,500 rpm reveals a gradual shift toward a coarser and more heterogeneous distribution, accompanied by a noticeable increase in the SPAN value. Mehrina et al. [54] highlighted a similar phenomenon for W/O emulsions, explaining that the energy supplied to the system at high stirring speed can lead to forced coalescence by increasing the frequency of collisions between droplets during emulsification, thereby resulting in a more heterogeneous distribution. Additionally, the work of Chen et al. [28] on O/W emulsion with sorbitan monooleate as surfactant suggested that at high speeds, surfactants also may disconnect from the adsorption layer and weaken it during emulsification. Furthermore, the increased droplet collisions can lead to the formation of multiple emulsions within some droplets [55]. Here, optical microscope images were able to highlight these internal droplets, although sparsely present in the system (see Supplementary Materials, Figure S9).
Although less visible here, it is also possible to observe the trend described in the previous section concerning a slight decrease in viscosity when homogeneity is decreased, i.e., 16,500 rpm < 20,500 rpm < 24,500 rpm (Figure 2d). Given that this stability holds even greater significance for smaller droplet sizes, a stirring speed of 16,500 rpm was selected.

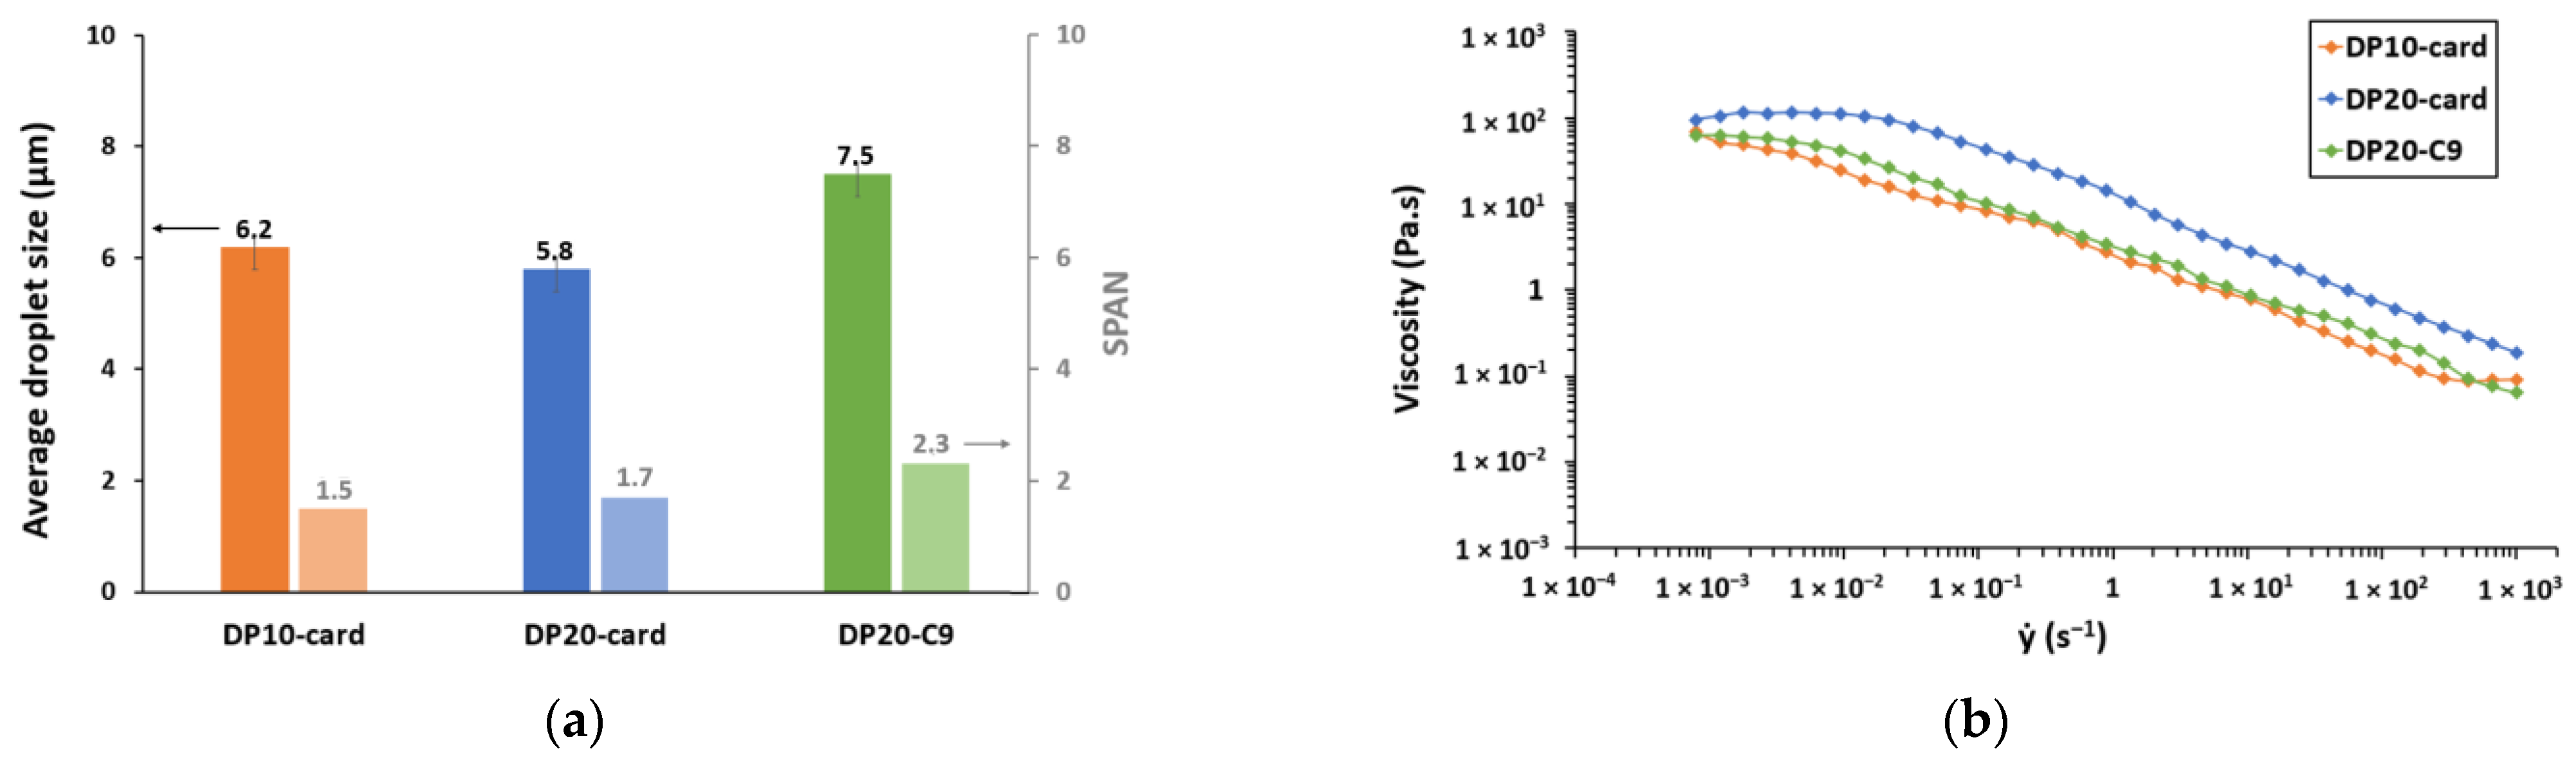
3.2.3. Surfactant Structure

Formulation and emulsification conditions are generally specific to the systems studied, but trends may emerge between different systems, particularly when the surfactants used have similar structures. After studying protocol optimization for the other systems, it was decided to keep the same emulsification conditions for all oligomeric surfactants. In the case of DP10-C9, which exhibits the most favorable adsorption properties at the water/air interface within this surfactant generation, emulsification experiments have revealed that this surfactant consistently triggers phase inversions whatever the conditions imposed. This observation suggests that DP10-C9 lacks the affinity necessary for stabilizing O/W emulsions. This behavior is likely attributed to the relatively short length of its fatty chains. Terreros et al. [56] demonstrated that linear surfactants with shorter hydrophobic chains contribute to reduced emulsion stability by promoting coalescence due to the low adhesion of these short chains into the oil droplet. In contrast, surfactants with longer fatty chains possess the capacity to penetrate deeper into the oil droplets, forming more robust hydrophobic interactions, and thus are more effective in preventing coalescence. Due to these considerations, this surfactant has been excluded from further investigation.
In the case of the DP20-C9 system, it also gives rise to phase inversion under particular emulsification conditions. However, when the previously established optimized protocol is employed, it successfully generates a stable O/W emulsion. This behavior can be attributed to the comparatively longer oligomeric chain length in DP20-C9 compared to DP10-C9, which imparts sufficient steric hindrance to avert coalescence and phase inversion under the specified conditions. In summary, stability assessment during storage will only be carried out for DP10-card, DP20-card and DP20-C9. Their average droplet size and viscosity at t0 with the optimized protocol are shown in Figure 4.
On one hand, the average droplet size of these three systems falls within a similar range, specifically between 5.5 and 7.5 µm. These results underscore the fact that altering emulsification conditions, particularly the stirring speed, exert a more pronounced influence on droplet size than the structural variations of the surfactant. DP20-C9 system appears to form the largest droplets, signifying that the C9 fatty chain exhibits lower affinity with the emulsion studied than cardanol. The system’s thermodynamic equilibrium tends toward smaller droplet sizes when the hydrophilic chain of surfactants is longer. Niraula et al. [57] have shown the same trend when using glucopyranoside surfactants with alkyl lengths ranging from C7 to C10.
On the other hand, the viscosity at t0 of these emulsions is close too. The disparity in viscosity between the emulsion containing DP10-card and that containing DP20-card could be explained by the hydrophilic chain length of these surfactants. Specifically, DP20-card features a longer hydrophilic chain, thus introducing a higher degree of steric hindrance. This, in turn, results in a slight elevation of inter-droplet friction forces, leading to an increment in viscosity. Regarding the DP20-C9 system, its viscosity is close to the DP10-card system. In summary, at the initial state, these three systems exhibit nearly identical optimal values for viscosity and average droplet size. The structural characteristics of these surfactants alone may give rise to variances in the study of destabilization mechanisms during storage.

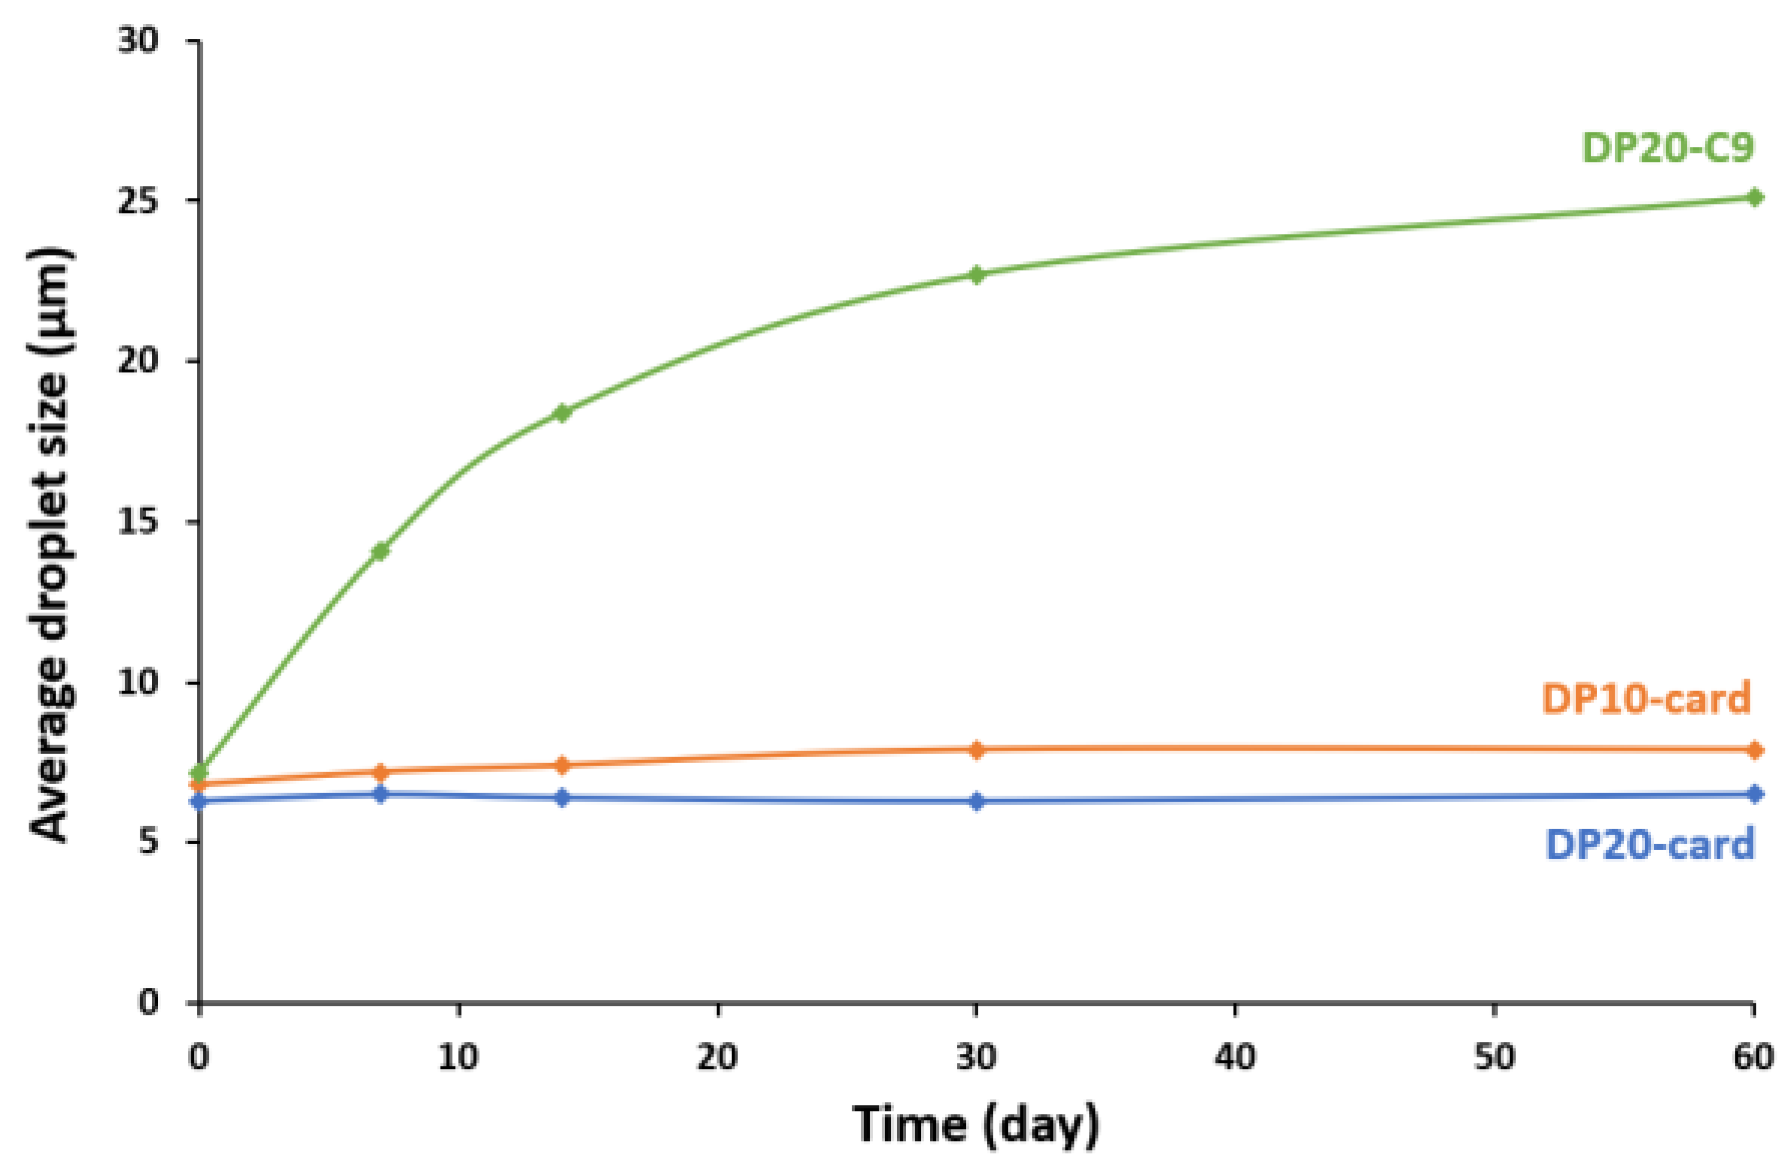
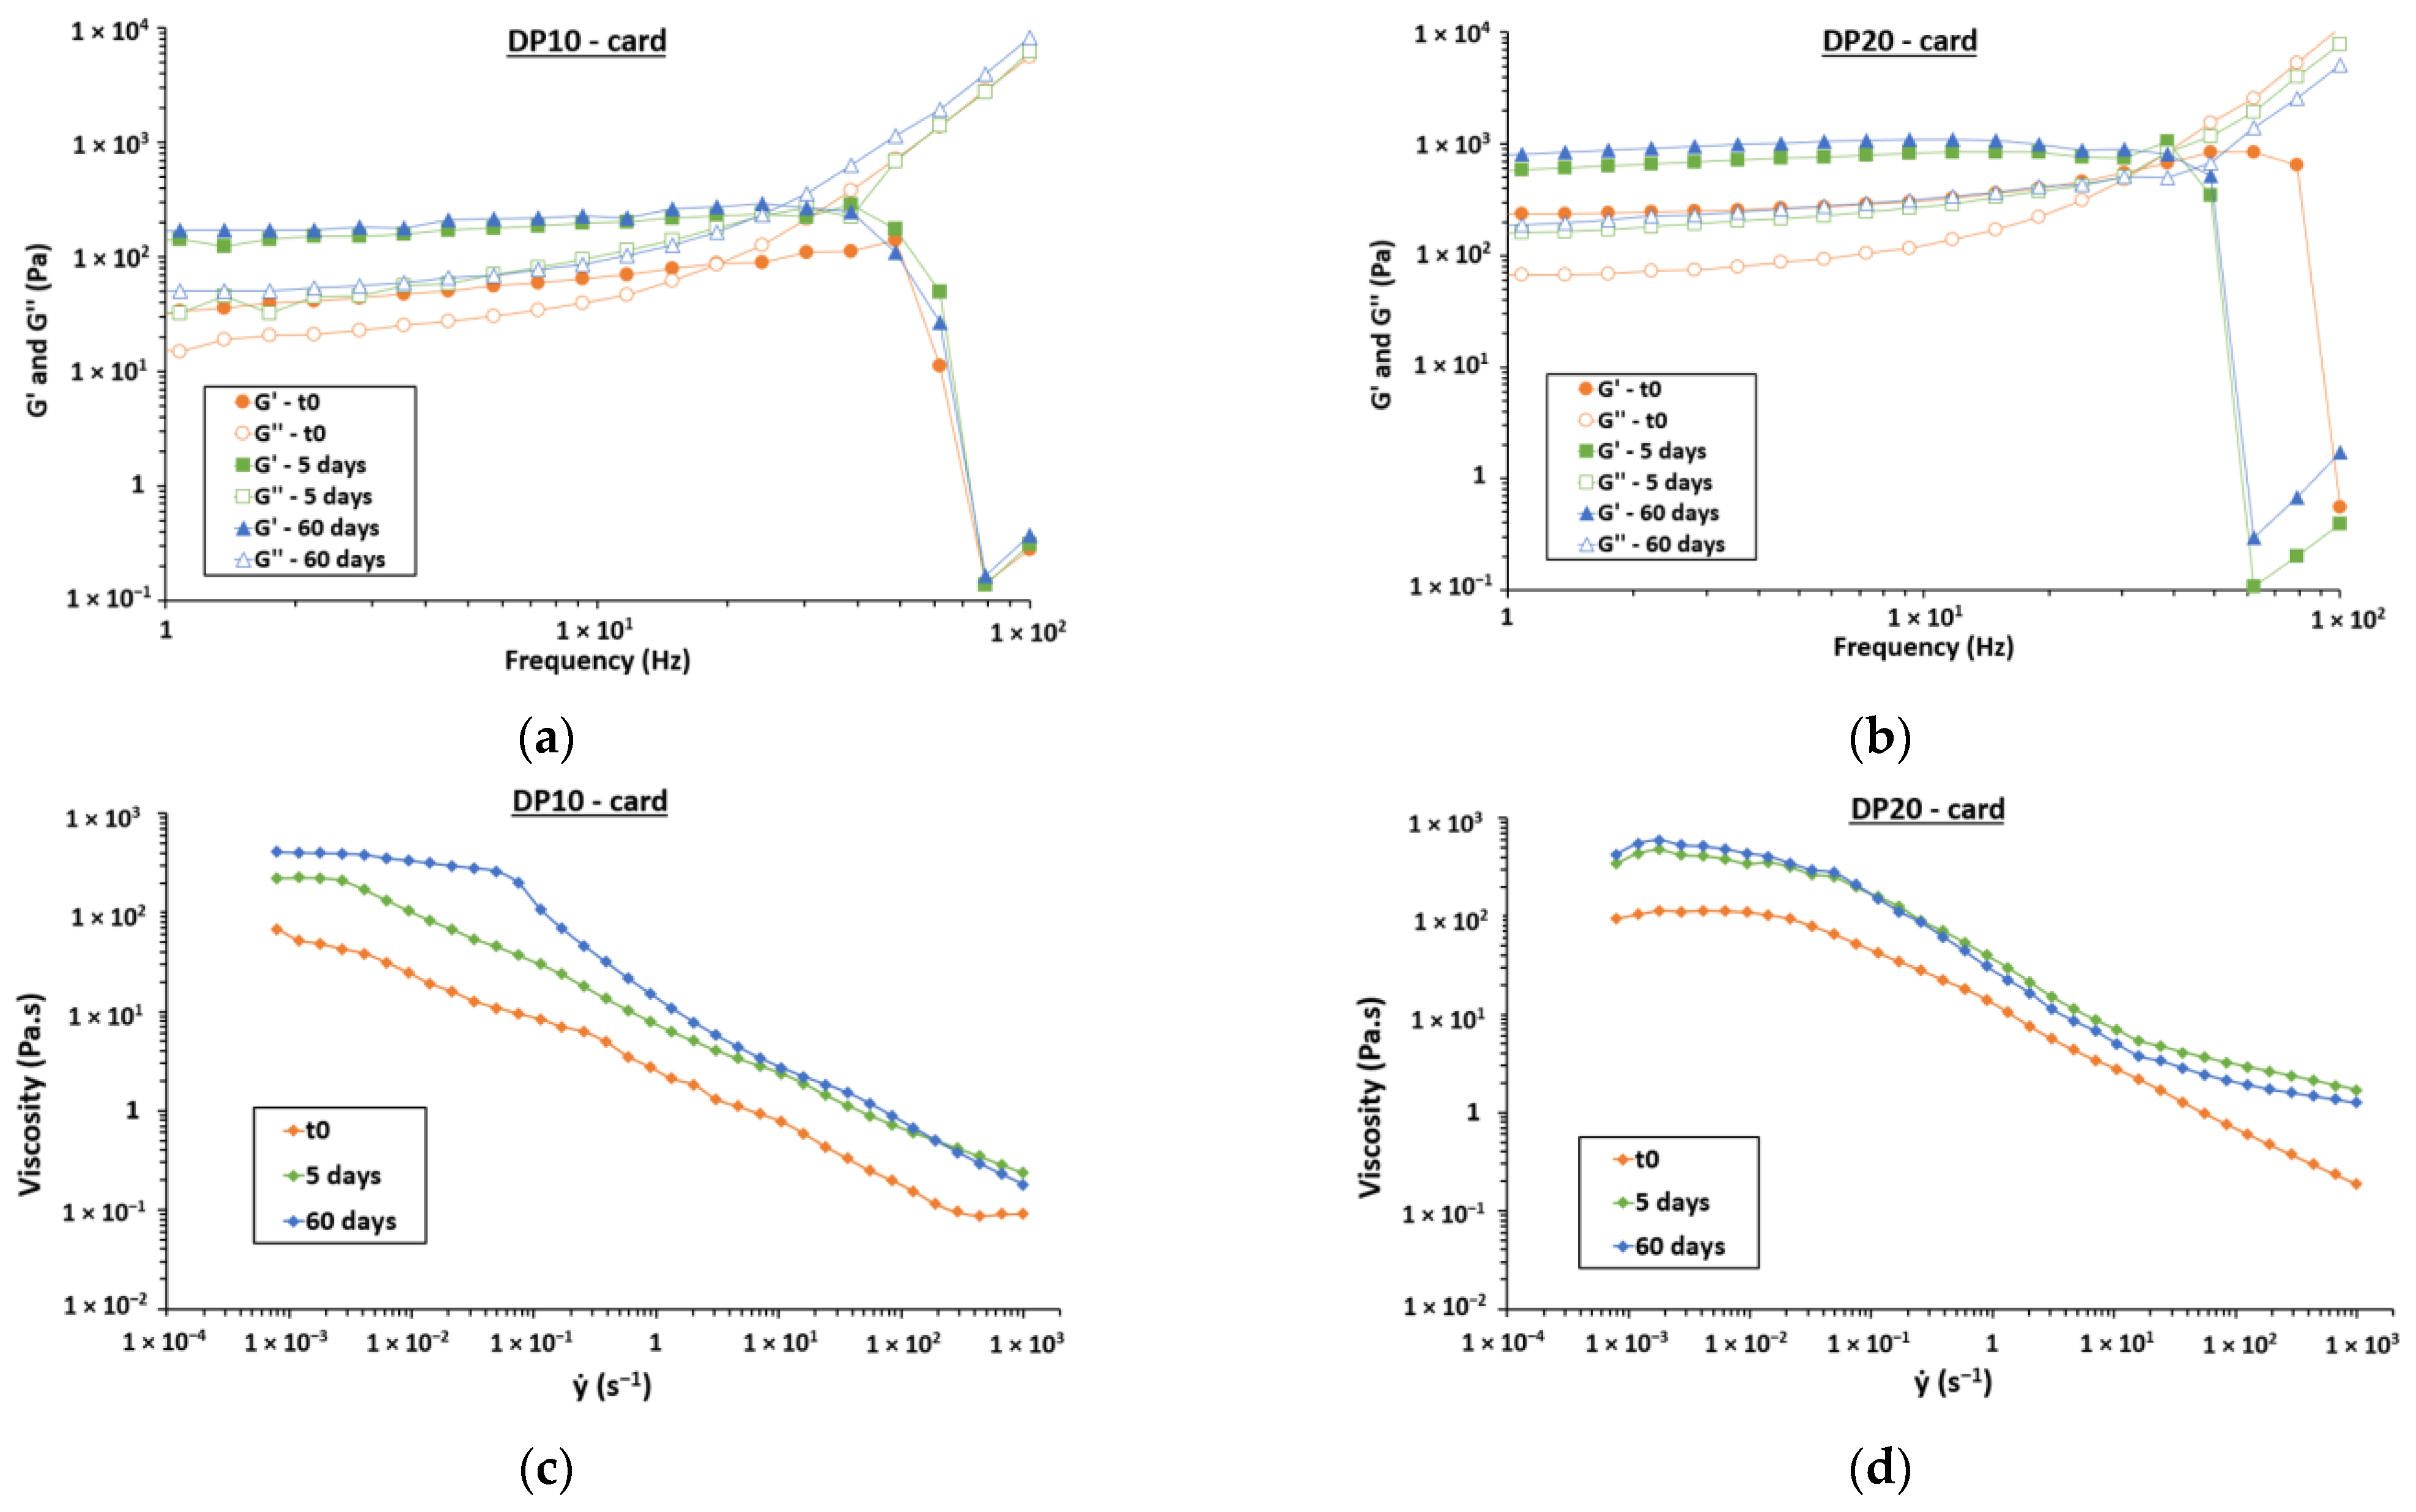
3.3. Stability over 2 Months

The destabilization of these emulsions occurs via multiple destabilization mechanisms, including creaming, a phase separation process driven by gravitational forces, flocculation and coalescence, which involve the aggregation and fusion of droplets. The present investigation examines these various phenomena within concentrated oil-in-water (O/W) emulsions at pH = 7 and 20 °C over 2 months.

3.3.1. Aggregation and Fusion of Droplets

In the context of a highly concentrated emulsion characterized by closely spaced droplets, discussing flocculation becomes irrelevant. In addition, when emulsion is diluted, the flocculation rate is very low (see Supplementary Materials, Figure S10). Moreover, the small difference in average size given by light scattering and Image J (see Supplementary Materials, Figure S5) support this phenomenon. This highlights the fact that these chitosan-based surfactants greatly limit flocculation.
The evolution of droplet size over 2 months monitored by laser granulometry is presented in Figure 5. As we can see, flocculation/coalescence occurs mainly during the first few days of storage and then reaches a plateau. This phenomenon may be explained in part by the reorganization of surfactants at the oil–water interface to reach a more stable state, which is a long process of aging for a few days [24]. This reorganization within the adsorption layer can promote coalescence. When the system is thermodynamically more stable, coalescence still occurs, but is less intense.
An emulsion made with C9-based surfactant exhibits significant coalescence, transitioning from 7 µm at t0 to 25 µm after 60 days. This observation highlights the inadequacy of C9 groups, which possess a too short chain and therefore have a too weak compatibility with oil to effectively stabilize the O/W droplet interface. Conversely, the cardanol-based surfactant systems reveal that epoxidized cardanol is a good hydrophobic chain because the droplet remained stable over time, i.e., from 6.2 µm to 7.9 µm for DP10-card and from 5.8 µm to 6.5 µm for DP20-card. The lower increase in droplet size of the DP20-card system is linked to its higher viscosity, thereby restricting droplet mobility. In addition, the longer DP20 hydrophilic chain brings more steric hindrance to the adsorption layer, which limits droplets fusion. These results are in good agreement with the low values of flocculation/coalescence kinetics quantified with Turbiscan Lab (backscattering mean value evolution at the sample middle during the first 4 h) for DP20-card and DP10-card (respectively −0.03%BS/h and −0.28%BS/h) compared with the higher value of −1.19%BS/h for the C9-based surfactant (see Supplementary Materials, Figure S11).
To summarize, increasing steric hindrance, fatty chain length or viscosity helps control and even limits flocculation and coalescence.

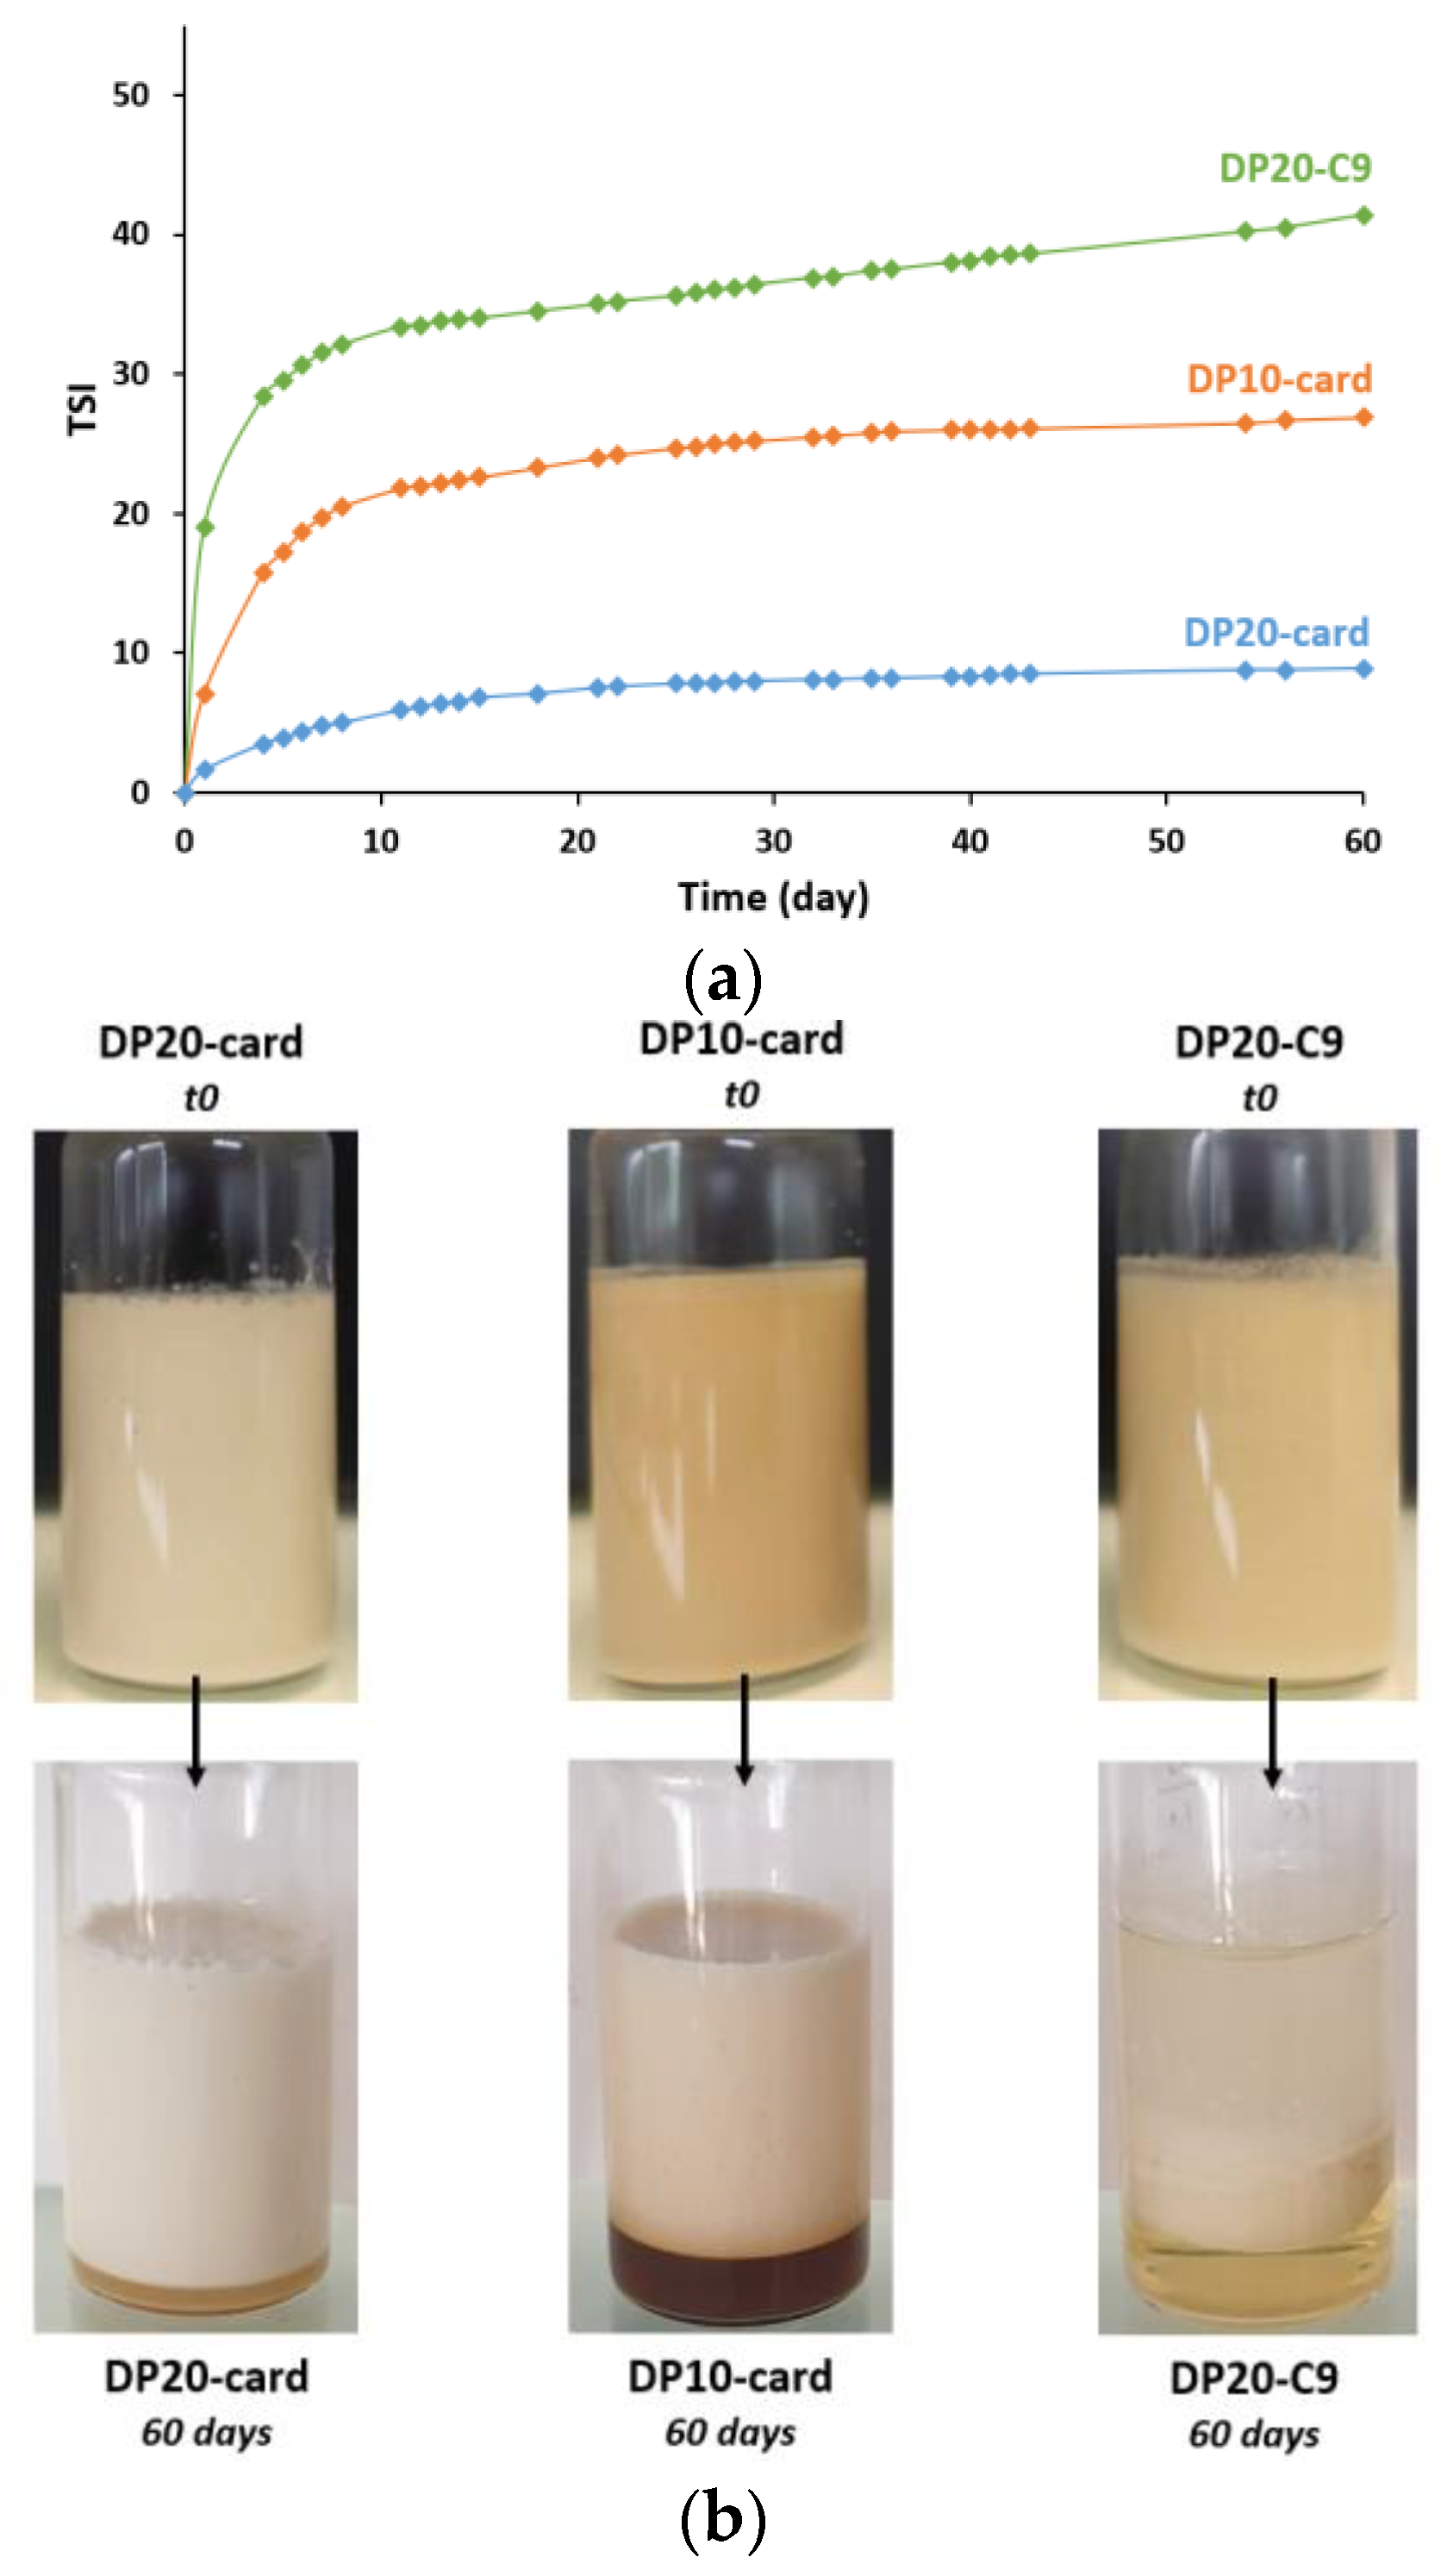
3.3.2. Gravitational Separation

Because water is denser than oil, gravitational separation will occur during storage. Oil droplets will tend to migrate toward the surface, and an aqueous phase will form at the bottom of the emulsion. This phenomenon, known as creaming, leads to a system demixion. Turbiscan profile evolution can identify creaming into the emulsion and all nascent destabilization phenomena as flocculation (see Supplementary Materials, Figures S13–S15). At t0, no transmission and high stable backscattering values (Equations (4) and (5)) were observed for all systems, witnessing both homogeneous volume fraction and droplet mean size. After 1 day, there are two distinct phases for each system. The lower one is a serum phase without any oil traces (5–10% of the total emulsion) and the other one is the concentrated emulsion. For the emulsion with DP20-C9, a third phase appears at the top, representing the demixion oil phase.
All destabilization phenomena are quantified by TSI index (Figure 6a) and show that the emulsion with DP20-card surfactant exhibits the lowest gravitational destabilization. This result is mainly due to the high viscosity of the system (Figure 7d), which strongly limits droplet movement. Rheological analysis of both elastic (G′) and viscous (G″) modulus indicates a predominant elastic component resulting in gel-like behavior of this emulsion because G′ is higher than G″ (Figure 7b). As a reminder, G′ is a measure of the energy stored in a cycle of oscillation and G″ is a measure of the energy dissipated as viscous flow in a cycle of oscillation [58]. An intersection point can be observed at high frequency witnessing gel breaking. After a few days, when maximum creaming is observed, an increase in the emulsion phase rheological properties occurs due to higher oil concentration. This phenomenon tends to completely gel the system and block creaming, leading to solid-like behavior with a viscosity close to 600 Pa.s (Figure 7d). At the bottom of the emulsion, the increase in transmission percentage values over time allows determining the kinetics of aqueous phase formation during the first 5 days of storage using the slope at the origin (see Supplementary Materials, Figure S11). Here, the DP20-card system has obviously the lowest value of Vaq, i.e., Vaq(DP20-card) = 2.1 × 10⁻⁷ mm/min < Vaq(DP10-card) = 1.9 × 10⁻⁴ mm/min < Vaq(DP20-C9) = 7.3 × 10⁻³ mm/min.
The emulsion with DP10-card surfactant exhibits greater gravitational separation in the first few days due to lower viscosity (Figure 7c) and lower G′ and G″ values at t0 (Figure 7a), but quickly reaches a high viscosity close to the DP20-card system when the maximum height of the aqueous phase is reached. Indeed, water is expelled from the emulsion phase, leading to an increase in the viscosity. The C9-based system shows strong destabilizations due to the lack of affinity of its surfactant with this O/W emulsion, leading to low stability and oil demixing (see Supplementary Materials, Figure S15). It’s interesting to note that the height of the aqueous layer here is lower than that of the DP10-card system, but the rate of this aqueous layer obtention is higher (see Supplementary Materials, Figure S12). The small emulsion phase did not expel all the water and kept a relatively low viscosity compared to the cardanol-based systems.
However, these destabilizing phenomena are reversible when the emulsion is stirred to reincorporate the aqueous phase into the emulsion phase. After 2 months, emulsions can regain their original viscosity by simple agitation (Figure 8b) without affecting both droplet size and SPAN values (Figure 8a).
To summarize, increasing viscosity or reducing coalescence helps control and limit gravitational separation. In addition, this phenomenon is reversible by simply shaking.

4. Conclusions

In this work, the adsorption properties of chitosan-based surfactants and their ability to stabilize a concentrated O/W emulsion at pH = 7 were evaluated. COS of DP10 and DP20 modified with fatty epoxides (C9, C16 and cardanol) were investigated. This study demonstrated that surfactant properties exhibit dependency on both hydrophilic and hydrophobic chain lengths and grafting ratio, but mainly on the added fatty chain length. Surfactants functionalized with C9 appear to have better CMC and surface tension values at 1 g·L−1 than their analogs with longer alkyl chains. In addition, a too long hydrophilic part such as DP20 disadvantages surfactant properties due to their low adsorption. However, the evaluation of emulsifying properties into concentrated O/W emulsion demonstrates that adsorption properties alone cannot predict the behavior of these surfactants during stabilization. Good affinity and adhesion are both necessary to restrain destabilizing phenomena during emulsion storage, so the cardanol fatty chain is better than C9. High steric hindrance also limits coalescence, as has been proven with DP20-card surfactants. In addition, increasing viscosity by modulating the emulsification conditions limits both coalescence and creaming by reducing droplet movement, and a very high viscosity seems to prevent these phenomena by gelling the system. Finally, the reversibility of creaming was demonstrated after 2 months with no change in droplet size associated with viscosity recovery.
This understanding study of the adsorption properties at the air–water interfaces and stability properties of concentrated O/W emulsions of these COS-based branched surfactants can be very useful for designing new biobased surfactants for applications requiring stability with a large quantity of oil.

Supplementary Materials

The following supporting information can be downloaded at: https://www.mdpi.com/article/10.3390/polysaccharides5020005/s1, Figure S1: 1H NMR (400 MHz, D2O) spectrum, and proton assignments for DP10-oxime; Figure S2: 1H NMR (400 MHz, D2O) spectrum, and proton assignments for DP10-C9; Figure S3: 1H NMR (400 MHz, D2O) spectrum, and proton assignments for DP10-C16; Figure S4: 1H NMR (400 MHz, D2O) spectrum, and proton assignments for DP10-card; Figure S5: Comparison of average droplet size (in µm) determination by light scattering and Image J (microcopy images) for the experiment as a function of stirring time. For the Image J results, average droplet size was calculated by averaging 200 droplets for each sample; Figure S6: Viscosity profile of the emulsion with D10-card surfactant (stirring speed of 16,500 rpm and stirring time of 4 min). An increase and then a decrease in shear rate were used to highlight the anti-thixotropic behavior; Figure S7: Size distribution of emulsion with DP10-card surfactant at (a) 1 min of stirring; (b) 2 min of stirring; (c) 3 min of stirring; (d) 4 min of stirring; Figure S8: Size distribution of emulsion with DP10-card surfactant at (a) 16,500 rpm; (b) 20,500 rpm; (c) 24,500 rpm; Figure S9: Optical microscopy images of (a) an emulsion at a stirring speed of 16,500 rpm; (b) an emulsion at a stirring speed of 24,500 rpm. Internal droplets are shown with arrows; Figure S10: Optical microscopy images of diluted emulsions (×200) at t0 with (a) DP10-card surfactant; (b) DP20-C9 surfactant. Flocs are shown with arrows.; Figure S11: Backscattering percentage values over time for DP10-card, DP20-card and DP20-C9. Kinetics of flocculation/coalescence were measured during the first 4 h of storage; Figure S12: Transmission percentage values over time for DP10-card, DP20-card and DP20-C9. Kinetics of aqueous phase formation were measured during the first 5 days of storage using the slope at the origin; Figure S13: Transmission and backscattering profiles evolution as a function of time for the emulsion with DP20-card during 60 days. Horizontal representation of emulsion column at t0 and after 60 days; Figure S14: Transmission and backscattering profiles evolution as a function of time for the emulsion with DP10-card during 60 days. Horizontal representation of emulsion column at t0 and after 60 days; Figure S15: Transmission and backscattering profiles evolution as a function of time for the emulsion with DP20-C9 during 60 days. Horizontal representation of emulsion column at t0 and after 60 days.

Author Contributions

Conceptualization, S.B.; Methodology, S.B. and N.A.; Formal analysis, J.F.; Writing—original draft, C.N.; Supervision, G.D. All authors have read and agreed to the published version of the manuscript.

Funding

This research received no external funding.

Data Availability Statement

Data is contained within the article and Supplementary Material.

Conflicts of Interest

The authors declare no conflicts of interest.

References

  1. Pradilla, D.; Vargas, W.; Alvarez, O. The Application of a Multi-scale Approach to the Manufacture of Concentrated and Highly Concentrated Emulsion. Chem. Eng. Res. Des. 2015, 95, 162–172. [Google Scholar] [CrossRef]
  2. Briceno, M.; Salager, J.L.; Bertrand, J. Influence of Dispersed Phase Content and Viscosity on the Mixing of Concentrated Oil-in-Water Emulsion in the Transition Flow Regime. Chem. Eng. Res. Des. 2001, 79, 943–948. [Google Scholar] [CrossRef]
  3. Nor Hayati, I.; Bin Che Man, Y.; Ping Tan, C.; Nor Aini, I. Stability and Rheology of Concentrated O/W Emulsions Based on Soybean Oil/palm Kernel Olein Blends. Food Res. Int. 2007, 40, 1051–1061. [Google Scholar] [CrossRef]
  4. Atkin, R.; Craig, V.S.J.; Wanless, E.J.; Biggs, S. Mechanism of Cationic Surfactant Adsorption at the Solid–Aqueous Interface. Adv. Colloid Interface Sci. 2003, 103, 219–304. [Google Scholar] [CrossRef] [PubMed]
  5. Rebello, S.; Asok, A.K.; Mundayoor, S.; Jisha, M.S. Surfactants: Toxicity, Remediation and Green Surfactants. Environ. Chem. Lett. 2014, 12, 275–287. [Google Scholar] [CrossRef]
  6. Debois, D.; Fernandez, O.; Franzil, L.; Jourdan, E.; De Brogniez, A.; Willems, L.; Clément, C.; Dorey, S.; De Pauw, E.; Ongena, M. Plant Polysaccharides Initiate Underground Crosstalk with Bacilli by Inducing Synthesis of the Immunogenic Lipopeptide Surfactin: Bacillus Lipopeptides Induced by Plant Polymers. Environ. Microbiol. Rep. 2015, 7, 570–582. [Google Scholar] [CrossRef] [PubMed]
  7. Delbeke, E.; Van Geem, K. Sophorolipid Modification: The Power of Yeasts and Enzymes. In Lipid Modification by Enzymes and Engineered Microbes; Bornscheuer, U.T., Ed.; AOCS Press: Urbana, IL, USA, 2018; Chapter 14; pp. 315–341. [Google Scholar] [CrossRef]
  8. Bouyer, E.; Ghozlene, M.; Rosilio, V.; Grossiord, J.L.; Agnely, F. Proteins, Polysaccharides, and Their Complexes Used as Stabilizers for Emulsions: Alternatives to Synthetic Surfactants in the Pharmaceutical Field. Int. J. Pharm. 2012, 436, 359–378. [Google Scholar] [CrossRef] [PubMed]
  9. Adewuyi, A.; Göpfert, A.; Wolff, T. Properties of Sodium Phosphate-Hydroxy Ethanolamide Gemini Surfactant Synthesized from the Seed Oil of Luffa Cylindrical. Open Chem. 2013, 11, 1368–1380. [Google Scholar] [CrossRef]
  10. Farias, C.B.B.; Almeida, F.C.; Silva, I.A.; Souza, T.C.; Meira, H.M.; Rita de Cássia, F.; Luna, J.M.; Santos, V.A.; Converti, A.; Banat, I.M.; et al. Production of Green Surfactants: Market Prospects. Electron. J. Biotechnol. 2021, 51, 28–39. [Google Scholar] [CrossRef]
  11. Ribeiro, B.G.; Guerra, J.M.C.; Sarubbo, L.A. Biosurfactants: Production and application prospects in the food industry. Biotechnol. Progress 2020, 36, 5. [Google Scholar] [CrossRef]
  12. Satpute, S.K.; Kulkarni, G.R.; Banpurkar, A.G.; Banat, I.M.; Mone, N.S.; Patil, R.H.; Cameotra, S.S. Biosurfactant/s from Lactobacilli species: Properties, challenges and potential biomedical applications. J. Basic Microbiol. 2016, 56, 1140–1158. [Google Scholar] [CrossRef] [PubMed]
  13. Lsabee, M.Z.; Morsi, R.E.; Al-Sabagh, A.M. Surface active properties of chitosan and its derivatives. Colloids Surf. B Biointerfaces 2009, 74, 1–16. [Google Scholar] [CrossRef] [PubMed]
  14. Kou, S.; Peters, L.M.; Mucalo, M.R. Chitosan: A review of sources and preparation methods. Int. J. Biol. Macromol. 2021, 169, 85–94. [Google Scholar] [CrossRef] [PubMed]
  15. Aranaz, I.; Alcantara, A.R.; Civera, M.C.; Aria, C.; Elorza, B.; Heras Caballero, A.; Acosta, N. Chitosan: An Overview of Its Properties and Applications. Polymers 2021, 13, 3256. [Google Scholar] [CrossRef] [PubMed]
  16. Majeti, N.V.; Kumar, R. A Review of Chitin and Chitosan Applications. React. Funct. Polym. 2000, 46, 1–27. [Google Scholar] [CrossRef]
  17. Luengo, G.S.; Leonforte, F.; Greaves, A.; Rubio, R.G.; Guzman, E. Phisico-chemical challenges on the self-assembly of natural and bio-based ingredients on hair surfaces: Towards sustainable haircare formulations. Green Chem. 2023, 25, 7863–7882. [Google Scholar] [CrossRef]
  18. Abd El-Hack, M.E.; El-Saadony, M.T.; Shafi, M.E.; Zabermawi, N.M.; Arif, M.; Elsaber Batiha, G.; Khafaga, A.F.; Abd El-Hakim, Y.M.; Al-Sagheer, A.A. Antimicrobial and Antioxidant Properties of Chitosan and Its Derivatives and Their Applications: A Review. Int. J. Biol. Macromol. 2020, 164, 2726–2744. [Google Scholar] [CrossRef]
  19. Pestman, J.M. Carbohydrate-Derived Surfactants Containing an N-acylated Amine Functionality: Fundamental Aspects and Practical Applications. Ph.D. Thesis, University of Groningen, Groningen, The Netherlands, 1998. [Google Scholar]
  20. Rodriguez, M.S.; Albertengo, L.A.; Agullo, E. Emulsification Capacity of Chitosan. Carbohydr. Polym. 2002, 48, 271–276. [Google Scholar] [CrossRef]
  21. Oh, B.H.L.; Bismarck, A.; Chan-Park, M.B. Modified Chitosan Emulsifiers: Small Compositional Changes Produce Vastly Different High Internal Phase Emulsion Types. J. Mater. Chem. B 2015, 3, 4118–4122. [Google Scholar] [CrossRef]
  22. Chapelle, C.; David, G.; Caillol, S.; Negrell, C.; Durand, G.; Desroches Le Foll, M.; Trombotto, S. Water-Soluble 2,5-Anhydro-d-Mannofuranose Chain End Chitosan Oligomers of a Very Low Molecular Weight: Synthesis and Characterization. Biomacromolecules 2019, 20, 4353–4360. [Google Scholar] [CrossRef]
  23. Naveed, M.; Phil, L.; Sohail, M.; Hasnat, M.; Baig, M.M.F.A.; Ihsan, A.U.; Shumzaid, M.; Kakar, M.U.; Khan, T.M.; Akabar, M.D.; et al. Chitosan Oligosaccharide (COS): An Overview. Int. J. Biol. Macromol. 2019, 129, 827–843. [Google Scholar] [CrossRef] [PubMed]
  24. Qinghong, Z.; Li, Y.; Song, Y.; Li, J.; Wang, Z. Properties of Branched Alcohol Polyoxyethylene Ether Carboxylates. J. Mol. Liq. 2018, 258, 34–39. [Google Scholar] [CrossRef]
  25. Adkins, S.S.; Chen, X.; Nguyen, Q.P.; Sanders, A.W.; Johnston, K.P. Effect of Branching on the Interfacial Properties of Nonionic Hydrocarbon Surfactants at the Air–Water and Carbon Dioxide–Water Interfaces. J. Colloid Interface Sci. 2010, 346, 455–463. [Google Scholar] [CrossRef] [PubMed]
  26. Song, Z.; Wen, Y.; Deng, P.; Teng, F.; Zhou, F.; Xu, H.; Feng, S.; Zhu, L.; Feng, R. Linolenic Acid-Modified Methoxy Poly (Ethylene Glycol)-Oligochitosan Conjugate Micelles for Encapsulation of Amphotericin B. Carbohydr. Polym. 2019, 205, 571–580. [Google Scholar] [CrossRef] [PubMed]
  27. Chapelle, C.; David, G.; Caillol, S.; Negrell, C.; Catrouillet, S.; Desroches Le Foll, M.; Azéma, N. Surfactant Properties of Chemically Modified Chitooligosaccharides and Their Potential Application in Bitumen Emulsions. Colloids Surf. A Physicochem. Eng. Asp. 2021, 628, 127327. [Google Scholar] [CrossRef]
  28. Chen, G.; Tao, D. An Experimental Study of Stability of Oil–Water Emulsion. Fuel Process Technol. 2005, 86, 499–508. [Google Scholar] [CrossRef]
  29. Thakur, R.K.; Villette, C.; Aubry, J.M.; Delaplace, G. Dynamic Emulsification and Catastrophic Phase Inversion of Lecithin-Based Emulsions. Colloids Surf. A Physicochem. Eng. Asp. 2008, 315, 285–293. [Google Scholar] [CrossRef]
  30. Gao, H.; Ma, L.; Cheng, C.; Liu, J.; Liang, R.; Zou, L.; Liu, W.; McClements, D.J. Review of Recent Advances in the Preparation, Properties, and Applications of High Internal Phase Emulsions. Trends Food Sci. Technol. 2021, 112, 36–49. [Google Scholar] [CrossRef]
  31. Grant, J.; Cho, J.; Allen, C. Self-Assembly and Physicochemical and Rheological Properties of a Polysaccharide−Surfactant System Formed from the Cationic Biopolymer Chitosan and Nonionic Sorbitan Esters. Langmuir 2006, 22, 4327–4335. [Google Scholar] [CrossRef]
  32. Long, X.; Qiu, Z.; Gong, H.; Zhu, C.; Li, Z.; Li, Y.; Dong, M. Rheological Behaviors of Microbial Polysaccharides with Different Substituents in Aqueous Solutions: Effects of Concentration, Temperature, Inorganic Salt and Surfactant. Carbohydr. Polym. 2019, 219, 162–171. [Google Scholar] [CrossRef]
  33. Chapelle, C.; David, G.; Caillol, S.; Negrell, C.; Durand, G.; Desroches Le Foll, M. Functionalization of Chitosan Oligomers: From Aliphatic Epoxide to Cardanol-Grafted Oligomers for Oil-in-Water Emulsions. Biomacromolecules 2021, 22, 846–854. [Google Scholar] [CrossRef] [PubMed]
  34. Mengual, O.; Meunier, G.; Cayre, I.; Puech, K.; Snabre, P. Characterisation of instability of concentrated dispersions by a new optical analyser: The TURBISCAN MA 1000. Colloids Surf. 1999, 152, 111–123. [Google Scholar] [CrossRef]
  35. Blazi, M.; Algieri, C. Application of Turbiscan Stability Index for the Preparation of Alumina Photocatalytic Membranes for Dye Removal. Membranes 2023, 13, 400. [Google Scholar] [CrossRef]
  36. Tesch, S.; Schubert, H. Influence of Increasing Viscosity of the Aqueous Phase on the Short-Term Stability of Protein Stabilized Emulsions. J. Food Eng. 2002, 52, 305–312. [Google Scholar] [CrossRef]
  37. Wang, Z.; Hui, L.; Zhennan, Z.; Baojiang, S.; Jianbo, Z.; Wenqiang, L. Research on the Effects of Liquid Viscosity on Droplet Size in Vertical Gas–Liquid Annular Flows. Chem. Eng. Sci. 2020, 220, 115621. [Google Scholar] [CrossRef]
  38. Kundu, P.; Kuma, V.; Mishra, I.M. Modeling the Steady-Shear Rheological Behavior of Dilute to Highly Concentrated Oil-in-Water (o/w) Emulsions: Effect of Temperature, Oil Volume Fraction and Anionic Surfactant Concentration. J. Pet. Sci. Eng. 2015, 129, 189–204. [Google Scholar] [CrossRef]
  39. Pal, R. Novel Viscosity Equations for Emulsions of Two Immiscible Liquids. J. Rheol. 2001, 45, 509–520. [Google Scholar] [CrossRef]
  40. Romero, A.; Perez-Puyana, V.; Marchal, P.; Choplin, L.; Guerrero, A. Emulsification Process Controlled by a Mixer Type Rheometer in O/W Protein-Based Emulsions. LWT-Food Sci. Technol. 2017, 76, 26–32. [Google Scholar] [CrossRef]
  41. Fontenot, K.; Schork, F.J. Sensitivities of Droplet Size and Stability in Monomeric Emulsions. Ind. Eng. Chem. Res. 1993, 32, 373–385. [Google Scholar] [CrossRef]
  42. Meinders, M.B.J.; Kloek, W.; van Vliet, T. Effect of Surface Elasticity on Ostwald Ripening in Emulsions. Langmuir 2001, 17, 3923–3929. [Google Scholar] [CrossRef]
  43. Ilia, A.; Abdurahman, N. Effect of Viscosity and Droplet Diameter on water-in-oil (w/o) Emulsion: An Experimental Study. World Acad. Sci. Eng. Technol. 2010, 62, 595–598. [Google Scholar] [CrossRef]
  44. Caubet, S.; Le Guer, Y.; Grassl, B.; El Omari, K.; Normandin, E. A Low-energy Emulsification Batch Mixer for Concentrated Oil-in-water Emulsions. AIChE J. 2011, 57, 27–39. [Google Scholar] [CrossRef]
  45. Feng, J.; Chen, Q.; Wu, X.; Jafari, S.M.; McClements, D.J. Formulation of Oil-in-water Emulsions for Pesticide Applications: Impact of Surfactant Type and Concentration on Physical Stability. Environ. Sci. Pollut. Res. 2018, 25, 21742–21751. [Google Scholar] [CrossRef] [PubMed]
  46. Liu, W.; Sun, D.; Li, C.; Liu, Q.; Xu, J. Formation and Stability of Paraffin Oil-in-water Nano-emulsion Prepared by the Emulsion Inversion Point Method. J. Colloid Interface Sci. 2006, 303, 557–563. [Google Scholar] [CrossRef] [PubMed]
  47. Sajjadi, S. Formation of Fine Emulsions by Emulsification at High Viscosity or Low Interfacial Tension: A Comparative Study. Colloids Surf. A Physicochem. Eng. Asp. 2007, 299, 73–78. [Google Scholar] [CrossRef]
  48. Pichot, R.; Spyropoulos, F.; Norton, I.T. Competitive adsorption of surfactants and hydrophilic silica particles at the oil-water interface: Interfacial tension and contact angle studies. J. Colloid Interface Sci. 2012, 377, 396–405. [Google Scholar] [CrossRef] [PubMed]
  49. O’Sullivan, M.; Howe, A.J.; Clarke, S.M.; Routh, A.F. Heteroaggregation of water-in-oil droplets: The effects of relative internal solute concentrations and size. Soft Matter 2011, 7, 11216–11221. [Google Scholar] [CrossRef]
  50. Ghannam, M.T. Investigation of Thixotropy Behavior of Crude Oil-Polyacrylamide Emulsions. J. Appl. Polym. Sci. 2008, 12, 867–875. [Google Scholar] [CrossRef]
  51. Pal, R. Rheology of high internal phase ratio emulsions. Food Hydrocoll. 2006, 20, 997–1005. [Google Scholar] [CrossRef]
  52. Tyrode, E.; Allouche, J.; Choplin, L.; Salager, J.L. Emulsion catatrophic inversion from abnormal to normal morphology. Following the emulsion viscosity during three inversion protocols and extending the critical dispersed-phase concept. Ind. Eng. Chem. Res. 2005, 44, 67–74. [Google Scholar] [CrossRef]
  53. Subeen, K.; KyuHan, K.; Siyoung, Q.C. Controllable one-step double emulsion formation via phase inversion. Soft Matter 2018, 14, 1094–1099. [Google Scholar] [CrossRef]
  54. Mehrina, M.A.; Jafari, S.M.; Makhamal-Zadeh, B.S.; Maghsoudlou, Y. Crocin loaded nano-emulsion: Factors affecting emulsion properties in spontaneous emulsification. Int. J. Biol. Macromol. 2016, 84, 261–267. [Google Scholar] [CrossRef] [PubMed]
  55. Brooks, B.W.; Richmond, H.N. Phase inversion in non-ionic surfactant-oil-water systems. Drop size studies in catastrophic inversion with turbulent mixing. Chem. Eng. Sci. 1994, 49, 1065–1075. [Google Scholar] [CrossRef]
  56. Terreros, A.; Gomez, P.G.; Lopez-Cabarcos, E. Influence of the surfactant chain length and the molecular weight of poly(oxyethylene) on the stability of oil-in-water concentrated emulsion. Prog. Colloid Polym. Sci. 2000, 115, 50–54. [Google Scholar] [CrossRef]
  57. Niraula, B.; Cok King, T.; Kok Chun, T.; Misran, M. Rheology Properties of Glucopyranoside Stabilized Oil-Water Emulsions: Effect of Alkyl Chain Length and Bulk Concentration of the Surfactant. Colloids Surf. A Physicochem. Eng. Asp. 2004, 251, 117–132. [Google Scholar] [CrossRef]
  58. Tadros, T. Application of rheology for assessment and prediction of the long-term physical stability of emulsions. Adv. Colloids Interface Sci. 2004, 108, 227–258. [Google Scholar] [CrossRef]
Figure 1. Microscopy images of emulsions made with DP10-card at different surfactant concentrations.
Polysaccharides 05 00005 g001
Figure 2. (a) Average droplet size (in black) and SPAN value (in gray) as a function of stirring time; (b) viscosity profile of emulsions as a function of shear rate (from 0.001 to 1000 s−1) for different stirring time values; (c) average droplet size (in black) and SPAN value (in gray) as a function of stirring speed; (d) viscosity profile of emulsions as a function of shear rate (from 0.001 to 1000 s−1) for different stirring speed values. The surfactant used is DP10-card.
Polysaccharides 05 00005 g002
Figure 3. Fluorescence microscopy images of an emulsion made with DP10-card at different stirring times. Water is green-labeled by calcein.
Polysaccharides 05 00005 g003
Figure 4. (a) Average droplet size (in black) and SPAN values (in gray) as a function of surfactant structure; (b) viscosity profile of emulsions as a function of shear rate (from 0.001 to 1000 s−1) for different surfactant structures.
Polysaccharides 05 00005 g004
Figure 5. Evolution of average droplet size as a function of time.
Polysaccharides 05 00005 g005
Figure 6. (a) Evolution of TSI (destabilization index) as a function of time; (b) emulsions at t0 and at 60 days.
Polysaccharides 05 00005 g006
Figure 7. Elastic (G′) and viscous (G″) modulus according to frequency after 0, 5 and 60 days for (a) DP10-card system; (b) DP20-card system. Viscosity according to shear rate after 0, 5 and 60 days for (c) DP10-card system; (d) DP20-card system.
Polysaccharides 05 00005 g007
Figure 8. Evolution of emulsion with DP10-card of: (a) droplet size (in black) and SPAN values (in gray) after shaking; (b) viscosity after shaking.
Polysaccharides 05 00005 g008
Table 1. DS, HLB, zeta potential, CMC and surface tension values of COS-based surfactants.
SurfactantDS (%)HLBZeta Potential at pH7 (mV)CMC (g·L−1)Surface Tension at 1 g·L−1
DP10-C929.414.8+3.2 ± 1.560.20428.6
DP10-C166.617.8+2.7 ± 1.370.75651.8
DP10-card2313.4+2.9 ± 1.460.41139.5
DP20-C923.815.5+2.3 ± 1.670.60242.2
DP20-C161.219.5+4.2 ± 2.170.78252.9
DP20-card8.616.9+2.6 ± 1.620.70643.1
Disclaimer/Publisher’s Note: The statements, opinions and data contained in all publications are solely those of the individual author(s) and contributor(s) and not of MDPI and/or the editor(s). MDPI and/or the editor(s) disclaim responsibility for any injury to people or property resulting from any ideas, methods, instructions or products referred to in the content.

