Article

Ultrasound-Assisted Process to Increase the Hydrophobicity of Cellulose from Oat Hulls by Surface Modification with Vegetable Oils

by
Gina A. Gil-Giraldo
1,
Janaina Mantovan
2,
Beatriz M. Marim
3,
João O. F. Kishima
3,
Natália C. L. Beluci
3 and
Suzana Mali
3,*
1
Faculty of Health Sciences, University Institution Colegio Mayor de Antioquia (COLMAYOR), Medellín 050036, Colombia
2
Department of Chemistry and Biochemistry, School of Technology and Sciences, São Paulo State University (UNESP), Presidente Prudente 19060-900, SP, Brazil
3
Department of Biochemistry and Biotechnology, CCE, State University of Londrina, Londrina 86051-990, PR, Brazil
*
Author to whom correspondence should be addressed.
Polysaccharides 2024, 5(3), 463-477; https://doi.org/10.3390/polysaccharides5030029
Submission received: 27 June 2024 / Revised: 23 August 2024 / Accepted: 2 September 2024 / Published: 5 September 2024
(This article belongs to the Topic Polymers from Renewable Resources, 2nd Volume)

Abstract

:
Cellulose obtained from oat hulls by bleaching with peracetic acid was modified, employing an ultrasound method that resulted in an esterification reaction with different vegetable oils (soybean, sunflower, and coconut) to produce modified cellulose (MC) with increased hydrophobicity. MC samples were characterized by Fourier transform infrared spectroscopy (FTIR), X-ray diffraction, scanning electron microscopy, and their wettability and oil and water absorption capacities. FTIR indicated that the reaction occurred with all oils, which was observed by forming a new band associated with ester carbonyl groups at 1747 cm−1. The modification did not affect the crystalline structure or surface morphology of the cellulose. MC samples modified with all oil sources showed a 6 to 9-fold decrease in water absorption capacity, a 3-fold increase in oil absorption capacity, and a higher affinity for nonpolar solvents. The modified samples adsorbed lower amounts of water at a slower rate. Different oil sources did not affect the main properties of MC. The ultrasonication-assisted process was not only effective in modifying cellulose by esterification with vegetable oils but was also an eco-friendly and simple strategy that does not require toxic reagents, providing reassurance of its sustainability.

Graphical Abstract

1. Introduction

Natural cellulose materials, including wood, hemp, and cotton, have been used as engineering materials for thousands of years; however, environmental issues in the last few years have driven research on using and transforming lignocellulosic materials from other sources to obtain cellulose [1]. Cellulose can be obtained from several agroindustrial residues, which are comprised mainly of cellulose, hemicellulose, and lignin (generally with lower amounts of lignin than wood). Thus, interest in using agroindustrial residues for cellulose extraction has grown substantially in the last few years since these materials have a low production cost, high availability, low density, and good thermal and mechanical resistances [2,3,4].
Oat hulls are a byproduct of grain milling and represent 25 to 30% of the grain weight. They contain nearly 90% insoluble fibers, a cellulose content of approximately 28–35%, hemicellulose of 18–28%, and lignin of 18–22% [5,6,7,8].
The utilization of agroindustrial residues to create new products aligns with the concept of biorefineries, which can be described as the evolution of technologies consisting of integrated systems of sustainable, environmental, and resource-friendly processes. The biorefinery concept can be a tangible step toward a sustainable economy. It aligns with this vision by utilizing biological resources and maximizing benefits and profits through strategies that value the plant biomass chain [9,10].
Regardless of the origin of cellulose, its chemical structure is the same. Glucose units are connected by glycosidic bonds β (1–4) between the equatorial hydroxyl group of C4 and the C1 carbon atom [11,12,13], and the resulting cellulose is a linear-chain polymer with a large number of hydroxyl groups. Each glucose unit presents three hydroxyl groups, one primary moiety, and two secondary moieties. The cellulose chain length is expressed as the number of glucose units (degree of polymerization, DP), which varies with the origin and treatment of the raw material [12,13,14].
Hydroxyl groups give cellulose a hydrophilic character with a high capacity to rearrange water molecules in its surroundings. This hydrophilic characteristic restricts its use for some applications and reduces the structural stability of the biopolymer. Surface hydroxyl groups of cellulose allow its modification through esterification, which promotes the replacement of hydroxyl groups by nonpolar molecules, resulting in materials with more hydrophobic surfaces [15], which can be targeted for several applications, including its use in biodegradable food packaging systems to improve its water barrier properties and mechanical stability [16], as ingredients in low-calorie, low-fat or functional additives in several processed foods [17], and as a gelator in oleogel production [18,19,20].
Many chemicals used to modify biomaterials are harmful to the environment and derived from nonrenewable sources. As a result, in recent years, efforts have been underway to replace these chemical reagents with less aggressive reactive organic agents, preferably from renewable sources [4,21,22,23,24,25].
Vegetable oils are constituted mainly by triglycerides containing three acyl chains of varying lengths and degrees of saturation attached to a glycerol backbone. According to Dankovich and Hsieh [23], cellulose can react with triglycerides by an esterification reaction between hydroxyl groups from cellulose and hydrophobic long acyl chains from triglycerides, forming a covalently bonded network, which results in hydrophobic cellulose. Additionally, unsaturated fatty acyl chains can form covalently bonded networks by crosslinking reactions, and the unsaturation levels can change the orientation of the acyl chains along the surface of the fiber in addition to crosslinking among the acyl chains. The use of vegetable oils is little explored in the literature, with few studies reporting the production of hydrophobic cellulose by reaction with triglycerides from vegetable oils [22,23,24,25], which can also be attributed to the low reactivity of cellulose hydroxyl groups with fatty acids.
Ultrasound has been considered a promising and environmentally friendly alternative for cellulose extraction and modification, consisting of the process of transmitting energy in the form of sound waves (mechanical) into the system [4,5,26]. It can be employed to overcome the low reactivity of cellulose hydroxyl groups with fatty acids from triglycerides, increasing the reactivity and accessibility of cellulose.
Thus, this work aimed to extract cellulose from oat hulls and modify it by esterification with vegetable oils from different sources (soybean, sunflower, and coconut) to produce modified cellulose (MC) with increased hydrophobicity, employing a simple process based on ultrasound. In this study, three vegetable oils with different saturated/unsaturated fatty acid ratios were employed, with coconut oil with the lowest saturated/unsaturated fatty acid ratio (0.1), followed by soybean (5.7) and sunflower (7.3) [24]. The MC samples were characterized by Fourier transform infrared spectroscopy (FTIR), X-ray diffraction (XRD), and scanning electron microscopy (SEM) and by their wettability, oil and water absorption capacities, and water adsorption isotherms and kinetics.

2. Materials and Methods

2.1. Materials

Oat hulls were acquired from a local processing industry (SL Alimentos—Mauá da Serra, PR, Brazil). Soybean (Cocamar, Maringá, PR, Brazil), sunflower (Cocamar, Maringá, PR, Brazil), and coconut (Natural Life, São José dos Campos, SP, Brazil) oils were used without further purification. Glacial acetic acid PA (99%, Synth, Sao Paulo, Brazil) and hydrogen peroxide PA (H2O2 35%, Synth, Brazil) were used in the experiments.

2.2. Cellulose Extraction

First, 50 g of oat hulls were dispersed in 500 mL of peracetic acid solution (50% acetic acid, 38% hydrogen peroxide, and 12% distilled water) at 60 °C with stirring for 24 h, and the volume of the solution was sufficient for the sample to be immersed. Subsequently, the sample was filtered while still hot using a polyester fabric filter. During this process, it is washed with distilled water until it reaches a pH of 5.5 to 6.5. Finally, it was dried at 35 °C until a constant weight [8].

2.3. Cellulose Modification with Vegetable Oils

Cellulose modification was performed according to the protocol described by Dong et al. [24], with some modifications. Three different vegetable oils were used for cellulose modification: soybean, sunflower, or coconut. To obtain a homogeneous mixture of cellulose and oil, 1.0 g of each oil was dispersed in 38 g of ethanol with continuous stirring, and 2.5 g of cellulose was added to the solution. Each mixture was exposed to an ultrasonic treatment (Fisher Scientific Sonicator model 505, Pittsburgh, PA, USA) coupled with a probe with a tip diameter of 1.27 cm (Fisher Scientific model FB 4219, Pittsburgh, PA, USA). The operational conditions were 40% amplitude for 1 or 2 min (MCA401min and MCA402min samples) and 80% amplitude for 1 or 2 min (MCA801min and MCA802min samples). Samples were placed in an oven (Tecnal, São Paulo, Brazil) at 110 °C for 2 h, and finally, the material was washed by centrifugation (Hettich centrifuge, universal model 320R, Tuttlingen, Germany) for 30 min at 9000 rpm with ethanol three times and dried at room temperature.

2.4. Cellulose, Hemicellulose, and Lignin Contents

Cellulose and hemicellulose contents were determined using the Van Soest method [27]. Lignin contents were determined by the TAPPI T222 om-88 method [28].

2.5. Fourier Transform Infrared Spectroscopy (FTIR)

The samples were compressed into tablets with potassium bromide. The analyses were carried out on a FTIR Prestige spectrometer (Shimadzu, Kyoto, Japan) in the range of 4000–400 cm−1 with a resolution of 4 cm−1. The esterification extension of cellulose modified samples was calculated from the ratio between the absorbance intensity of the ester carbonyl (C=O) stretching vibrations band at 1747 cm−1 (A1747) and the absorbance intensity of the band at 1592 cm−1 (A1592) (an internal standard that remained unchanged after the esterification reactions) [29].

2.6. X-ray Diffraction (XRD)

A PANalytical X’Pert PRO MPD diffractometer (Almelo, The Netherlands) was employed with radiation Kα of copper (λ = 1.5418 Å), operational conditions of 40 kV and 30 mA, scan range 2θ = 2 a 2θ = 50°, step 0.1° and speed 1°/min, equipped with a secondary graphite beam monochromator. The crystallinity index (CI) was calculated by the method of Segal et al. [30] as follows:
C I = I 200 I a m × 100 I 200
where CI refers to the crystallinity index of cellulose, I200 is the maximum peak intensity corresponding to the plane (200) (2θ = 22°), and Iam is the intensity of the amorphous fraction, which can be considered as the minimum intensity between the diffraction peaks (2θ = 18°).

2.7. Scanning Electron Microscopy (SEM)

An FEI Quanta 200 scanning electron microscope (Hillsboro, OR, USA) was used. The samples were incubated in an air circulation oven (Marconi MA 035, São Paulo, Brazil) at 60 °C for 3 h and then conditioned for 7 days in a desiccator with anhydrous CaCl2 (≈0% relative humidity (RH)). After that, the samples were fixed in aluminum stubs and coated with a thin layer of gold (40–50 nm).

2.8. Wettability

According to the protocol described by Namazi and Dadkha [31], samples (cellulose and MC) were mixed with two immiscible solvents, water (density = 1.000 g cm−3) and dichloromethane (d: 1.335 g cm−3), with different polarities and densities to observe the affinity between the samples and solvents.

2.9. Oil Absorption Capacity (OAC)

The oil absorption capacity of the samples was determined according to the methodology described by Lu et al. with modifications [32]. Approximately 0.05 g of each sample (M0) was placed in a previously weighed centrifuge tube, and 2.5 mL of soy oil (M1) was added to the samples, which were vortexed for 10 min at 600 rpm (Brand Phoenix Luferco, model AP56, Araraquara, Brazil) and then centrifuged (Hettich centrifuge, universal model 320R, Tuttlingen, Germany) for 30 min at 9000 rpm. The free oil layer (M2) was removed, while the oil absorbed by the samples was estimated as the difference between M1 and M2. OAC was determined by Equation (2):
O A C   g / g = M 1 M 2   M 0

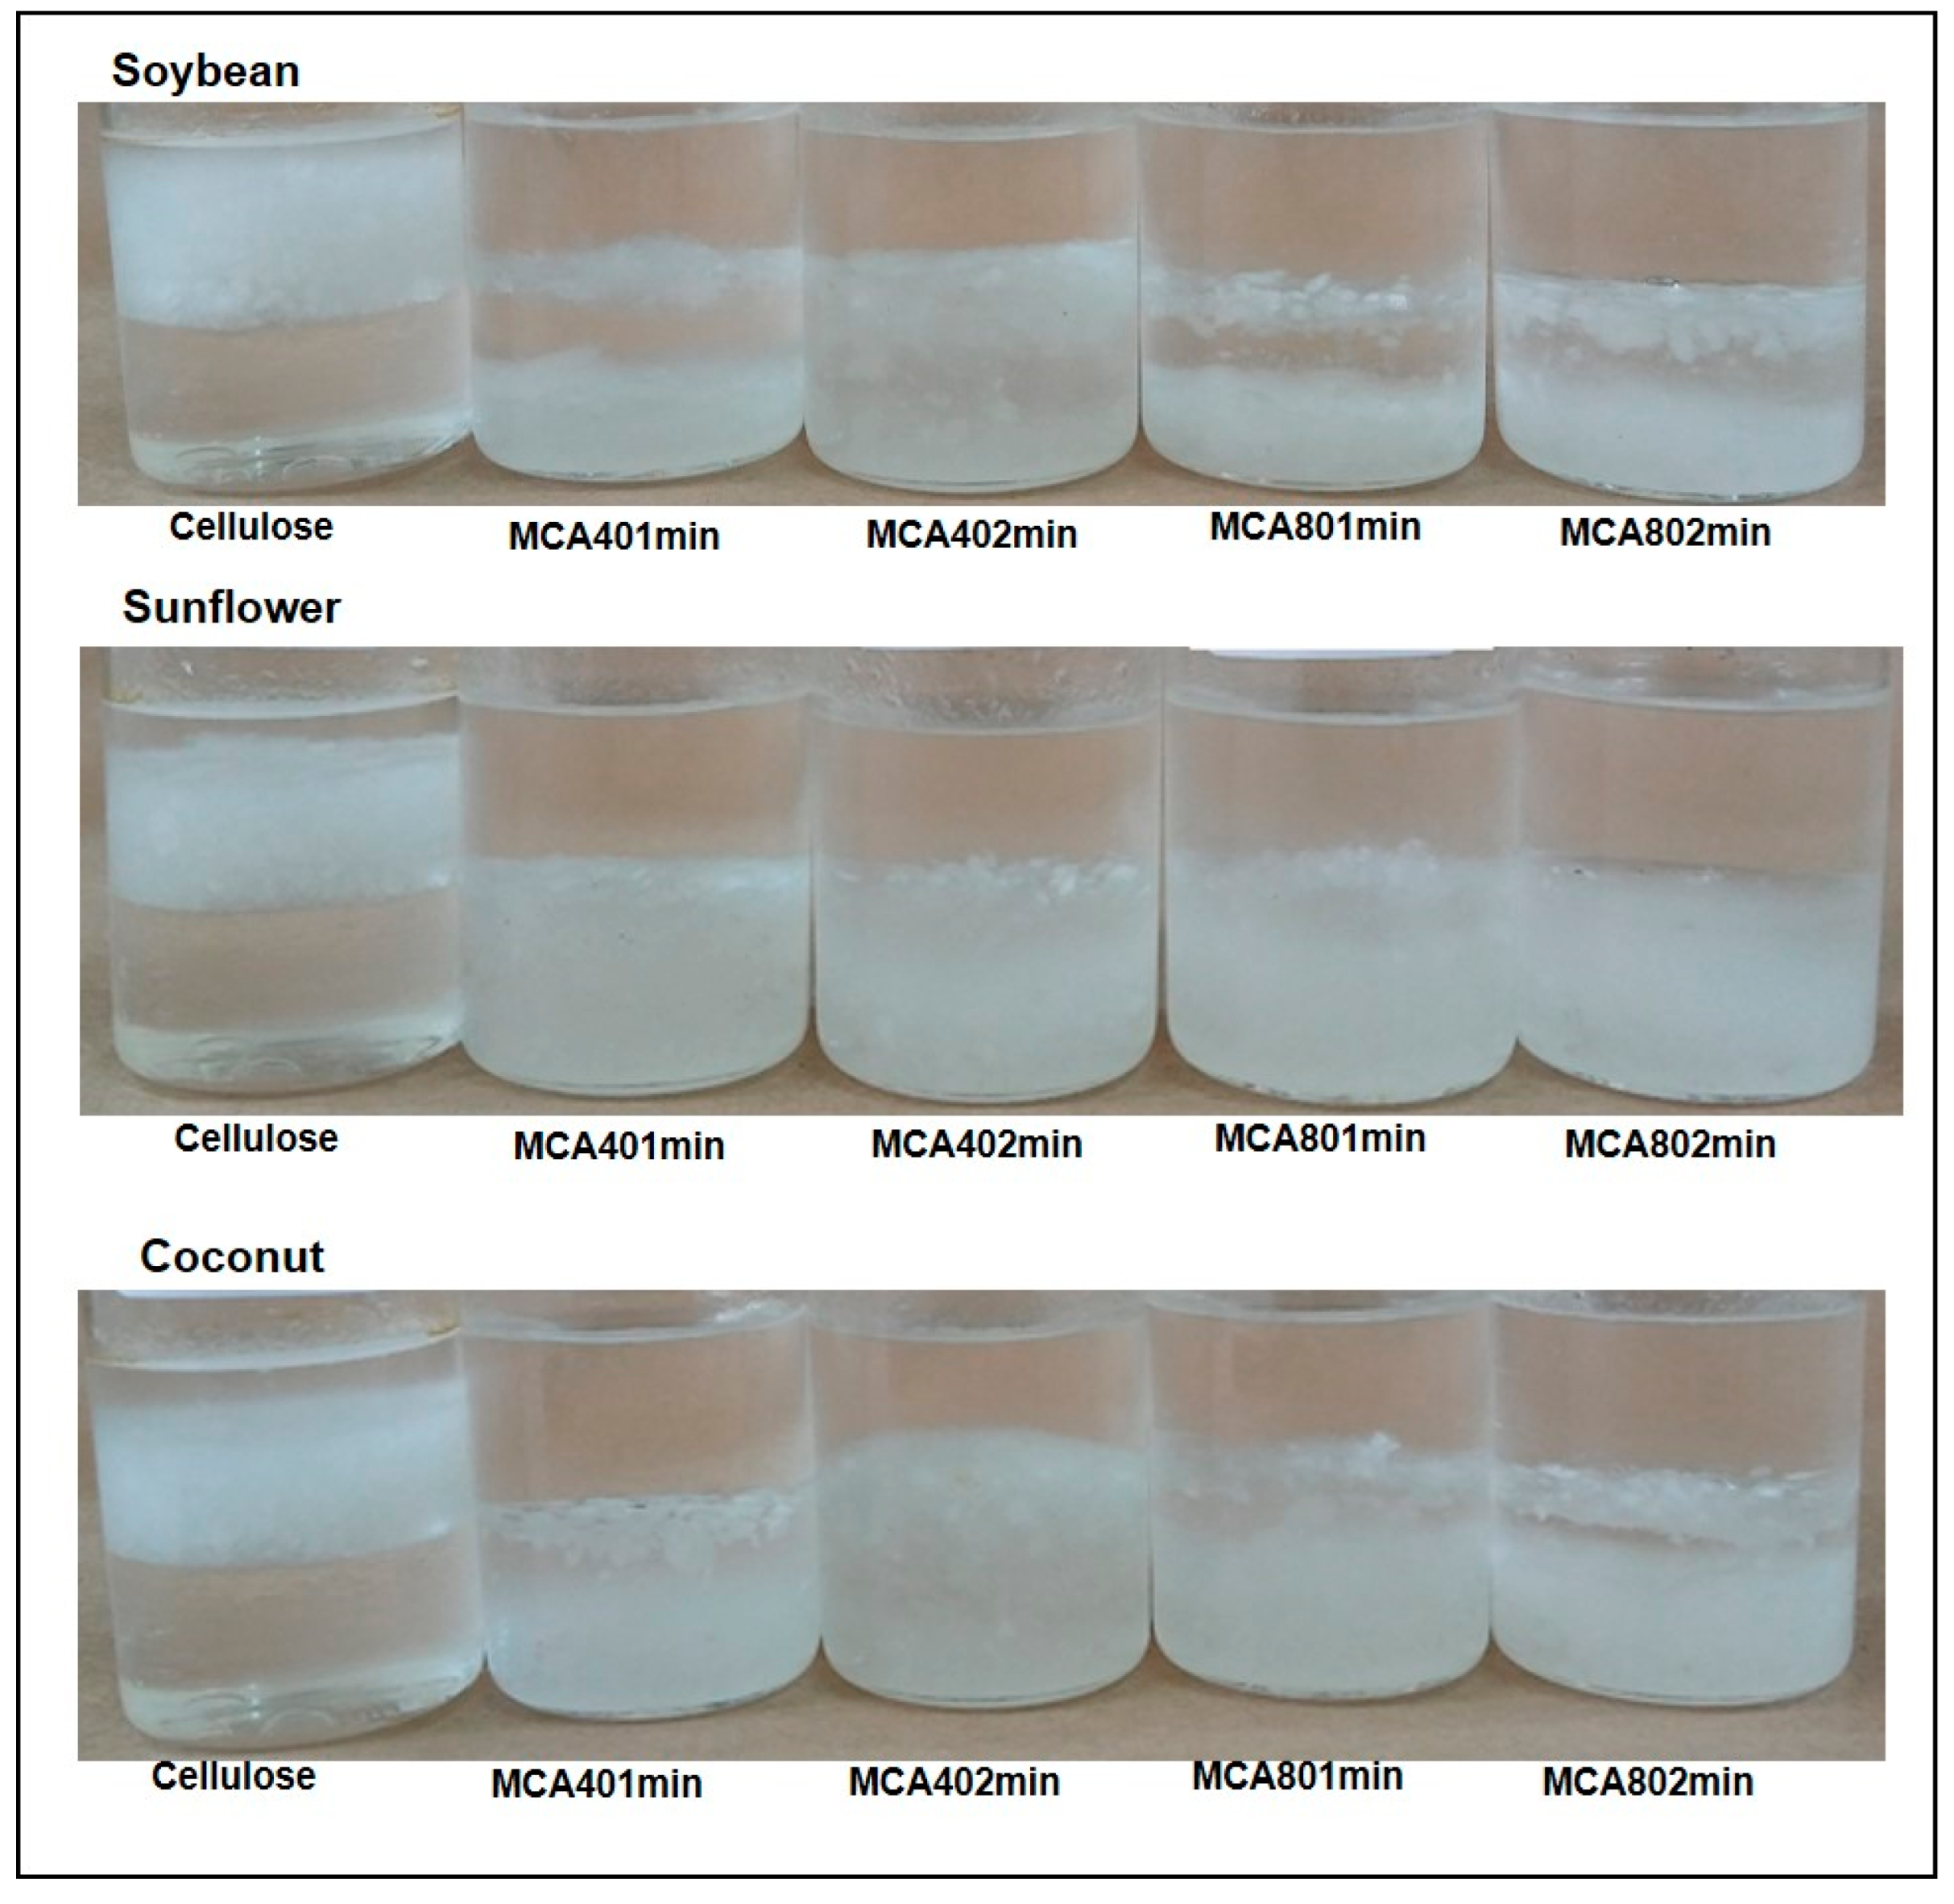
2.10. Water Absorption Capacity (WAC)

The water absorption capacity of the samples was determined according to the methodology described by Lu et al. [32] with modifications. A known weight of 0.05 g of each sample (M0) was placed in a previously weighed centrifuge tube, and 1.5 mL distilled water (M1) was added to the samples. The samples were placed in a water bath (Marconi MA 127) for 30 min and then centrifuged (Hettich centrifuge, universal model 320R, Germany) for 30 min at 9000 rpm. The free water layer (M2) was removed, while the water absorbed by the samples was estimated as the difference between M1 and M2. WAC was evaluated as follows:
W A C   g / g = M 1 M 2   M 0

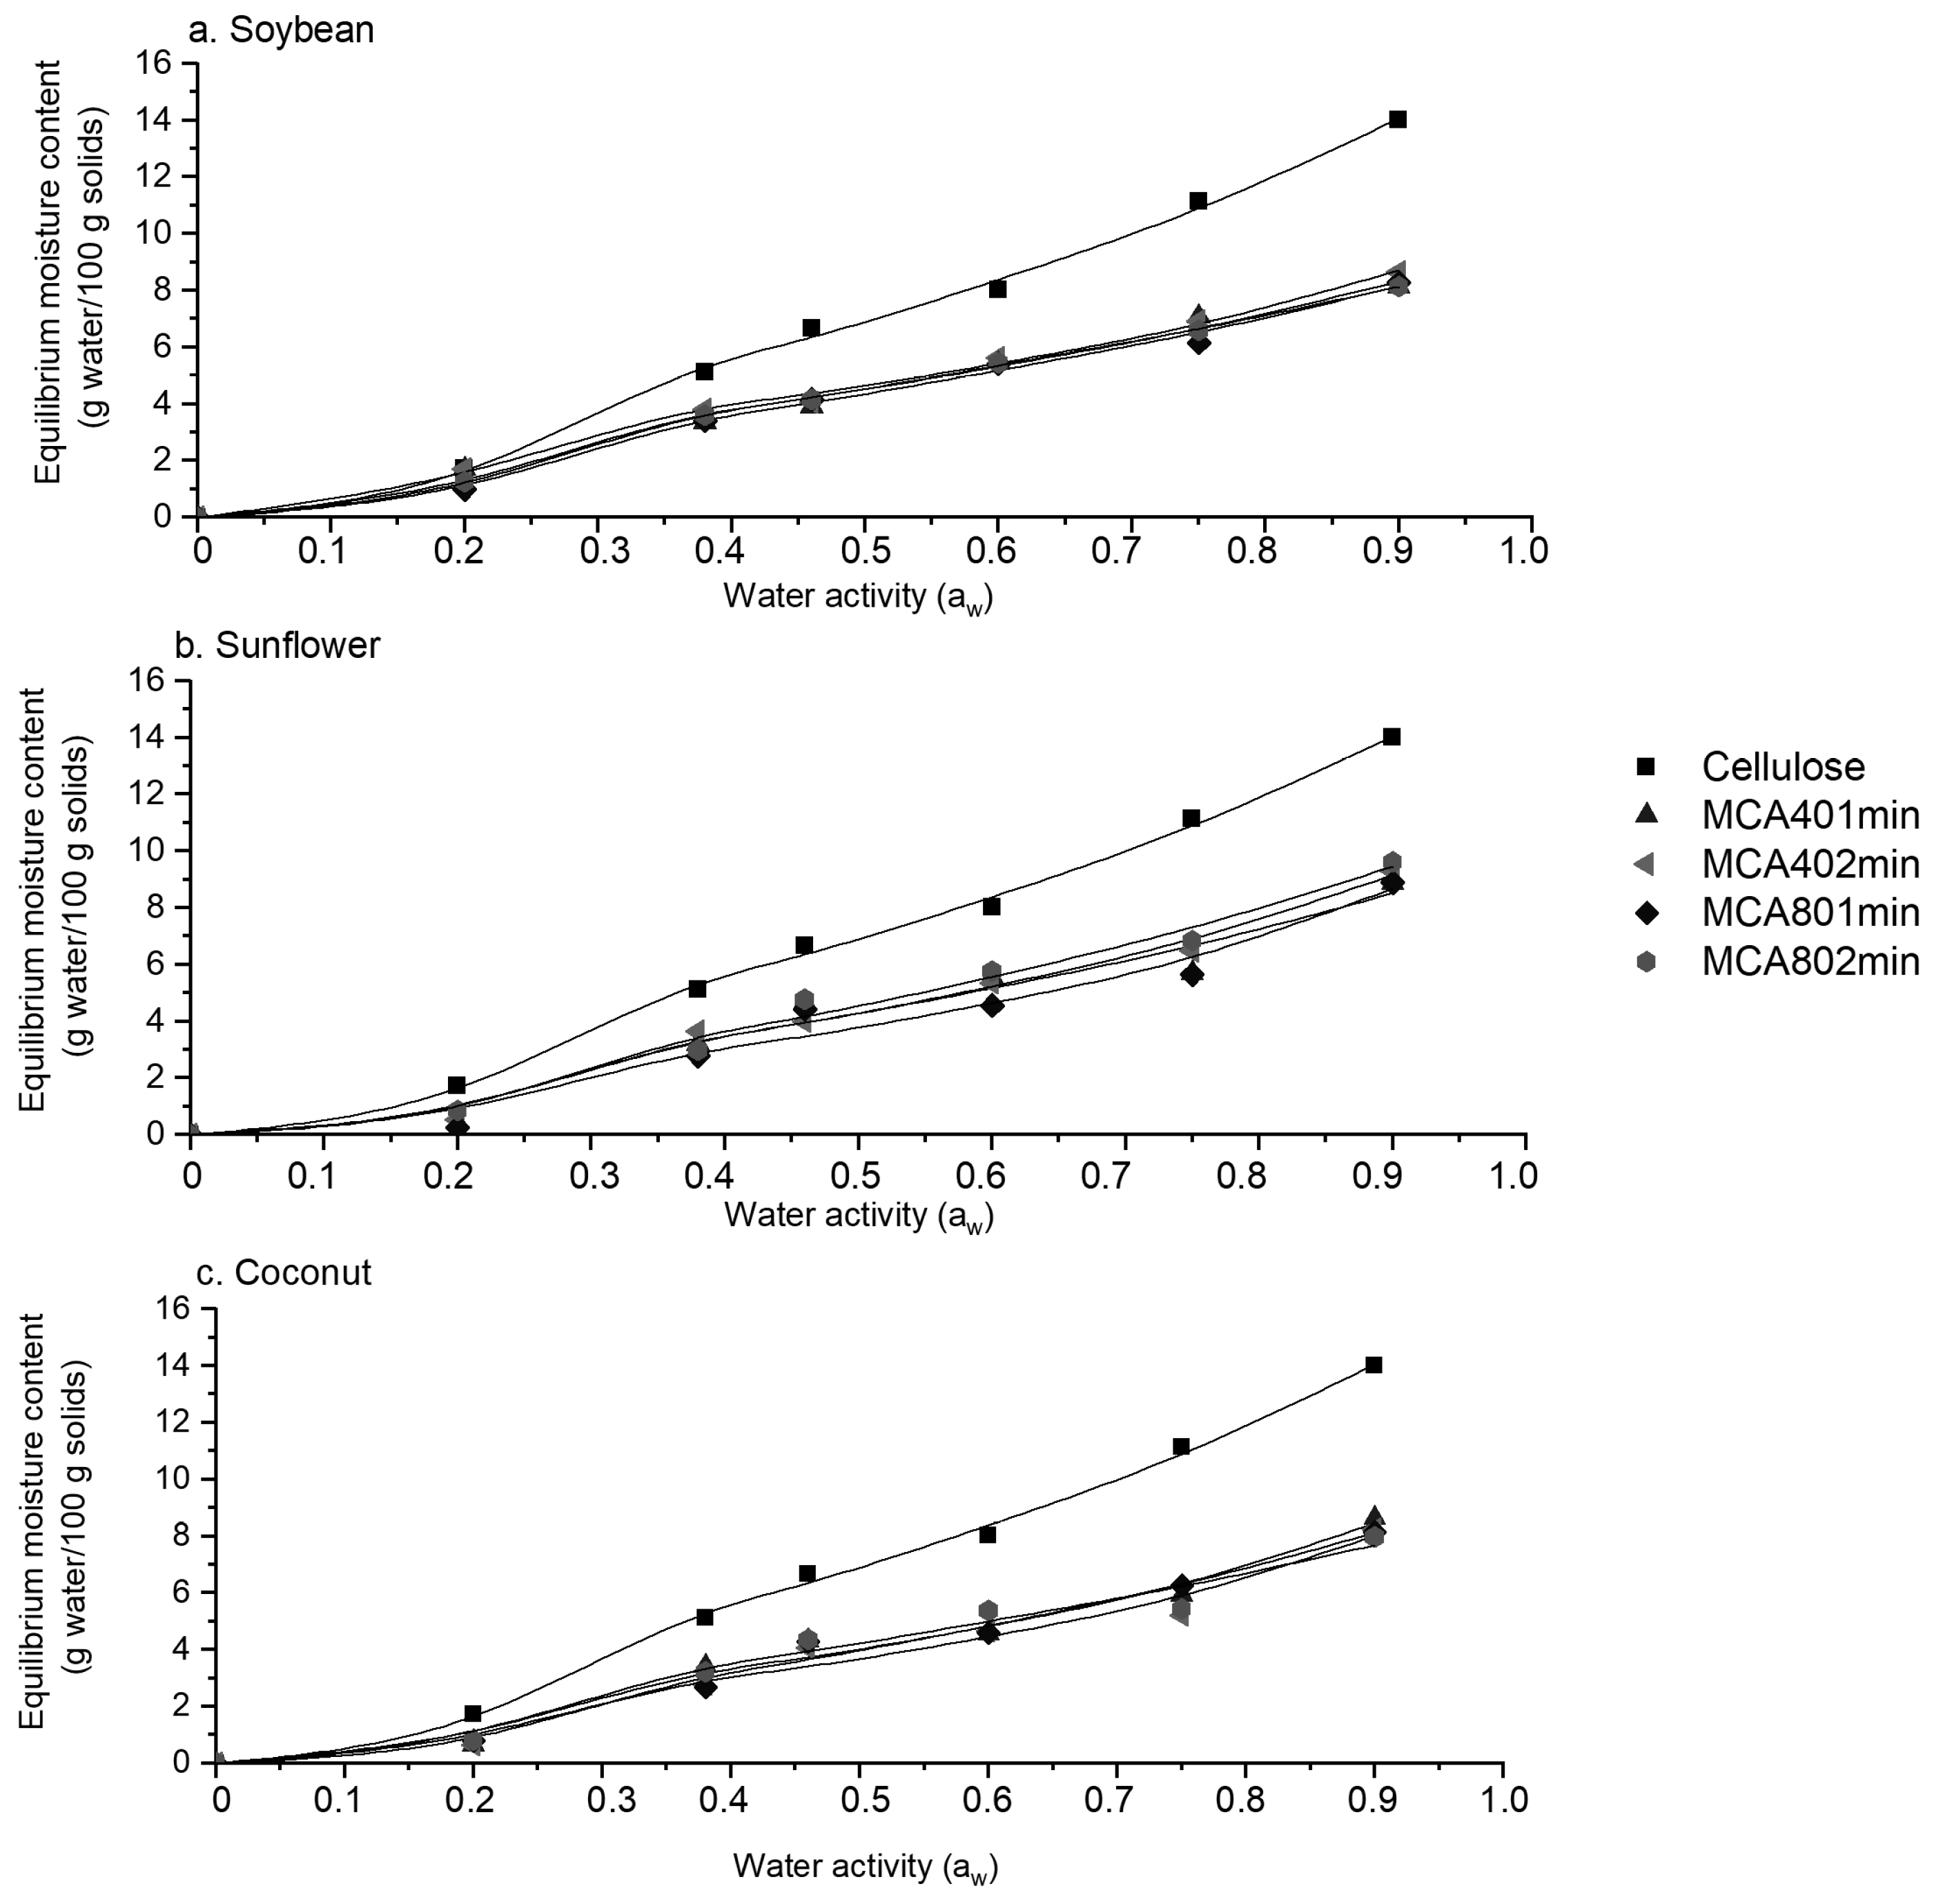
2.11. Moisture Adsorption Isotherms

Samples (0.25 g) were predried for 24 h in a ventilated oven at 50 °C (035 Marconi MA, São Paulo, Brazil). Subsequently, the samples were placed at 25 °C in desiccators containing different saturated solutions of salts providing a specific relative humidity (RH): lithium chloride (LiCl.H2O) 11% RH; magnesium chloride (MgCl2) 38% RH; potassium carbonate (K2CO3) 46% RH; sodium bromide (NaBr) 60% RH; sodium chloride (NaCl) 75% RH; and barium chloride (BaCl2) 90% RH [33]. The equilibrium moisture content of each sample was calculated as the increase in the dry mass of the sample for each RH after 7 days, and it was determined by oven drying at 105 °C.
The equilibrium moisture content of each sample was plotted as a function of water activity (aw) (RH/100), and the experimental data were fitted according to the Guggenheim–Anderson–de Boer (GAB) model [34], determined by nonlinear regression using Statistica software 7.0 (Statsoft, Tulsa, OK, USA). The isotherm model of GAB can be expressed by Equation (4):
M = m 0 C K K a w ( 1 K a w )   ( 1 K a w + C K a w )
where M is the moisture content of the equilibrium at a given water activity (aw), m0 is the monolayer value (g water/g solids), and C and K are the GAB constants. The tests were performed in triplicate.

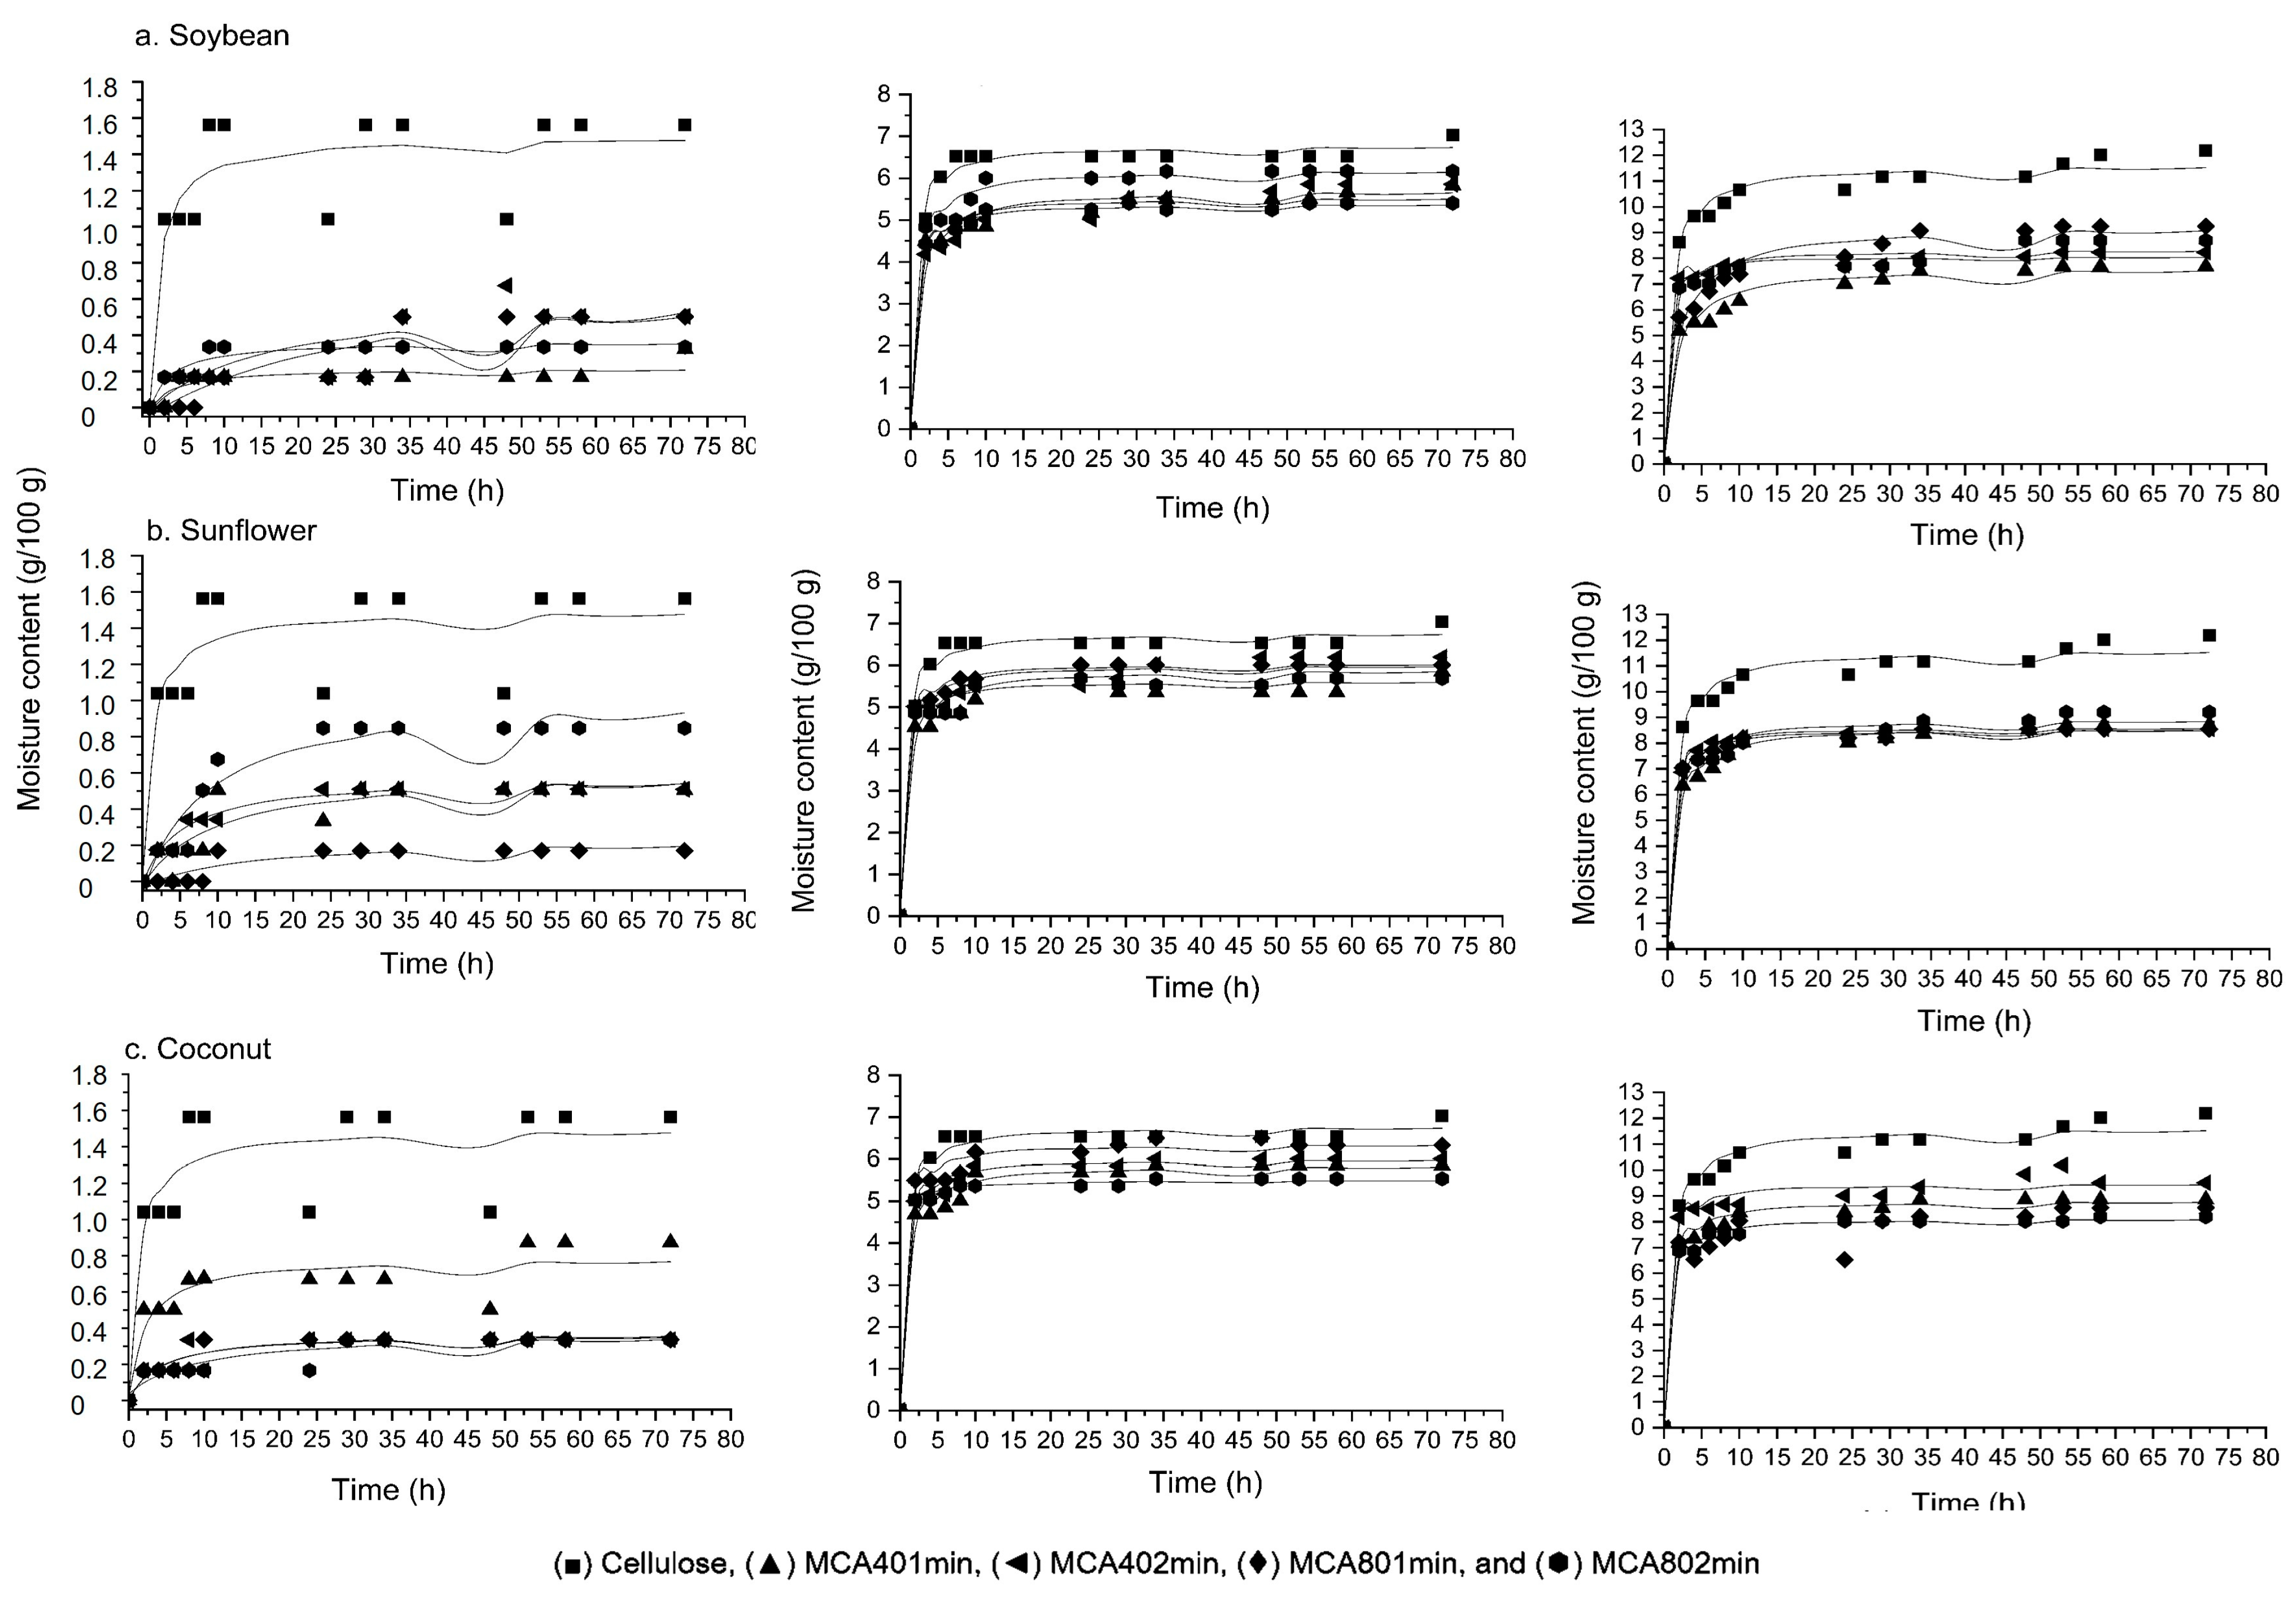
2.12. Moisture Adsorption Kinetics

Samples (0.20 g) were predried for 24 h in a ventilated oven at 50 °C (035 Marconi MA, Brazil) and then placed in desiccators containing different saturated solutions of salts (lithium chloride (LiCl. H2O) 20% RH; sodium bromide (NaBr) 60% RH; and barium chloride (BaCl2) 90% RH). Each sample was weighed at regular intervals every 2 h on the first day and subsequently at 24, 29, 34, 48, 53, 58, and 72 h. The moisture adsorption data were adjusted according to a mathematical model and estimation method proposed by Peleg [35] as follows:
M t = M 0 + t k 1 + k 2 t
where M(t) is the moisture at the end, M0 is the initial moisture, k1 is the rate constant Peleg (h/(g water/g solids)) and k2 is the constant of ability to Peleg (g water/g solids). All tests were performed in triplicate.

2.13. Statistical Analysis

To compare means, Tukey’s test was performed using Statistica software version 7.0 (StatSoft, USA) (p ≤ 0.05).

3. Results and Discussion

3.1. Cellulose Extracted Content

Initially, oat hull bleaching was performed with peracetic acid to produce pure cellulose. Our raw oat hulls comprise 26% cellulose, 30% hemicellulose, and 22% lignin. These numbers agree with Paschoal et al. [8] and Cardoso et al. [36].
After the bleaching process, the resulting sample contained 81% cellulose, 7% hemicellulose, and 3% lignin. This material was used to obtain modified cellulose (MC). The process yield was 33% (100 g of raw oat hulls/33 g of cellulose). The same starting material was employed by Gil-Giraldo et al. [4] for studying the surface modification of cellulose from oat hull with citric acid using ultrasonication and reactive extrusion assisted processes; these authors observed that the hydrophobicity of cellulose increased through esterification with citric acid.
Marim et al. [37] reported that peracetic acid can successfully be used as an oxidizing bleaching agent for extracting cellulose from lignocellulosic residues. The effluent from this process was non-toxic, especially compared to conventional bleaching processes that use chlorinated reagents, minimizing the negative impacts of conventional processes.

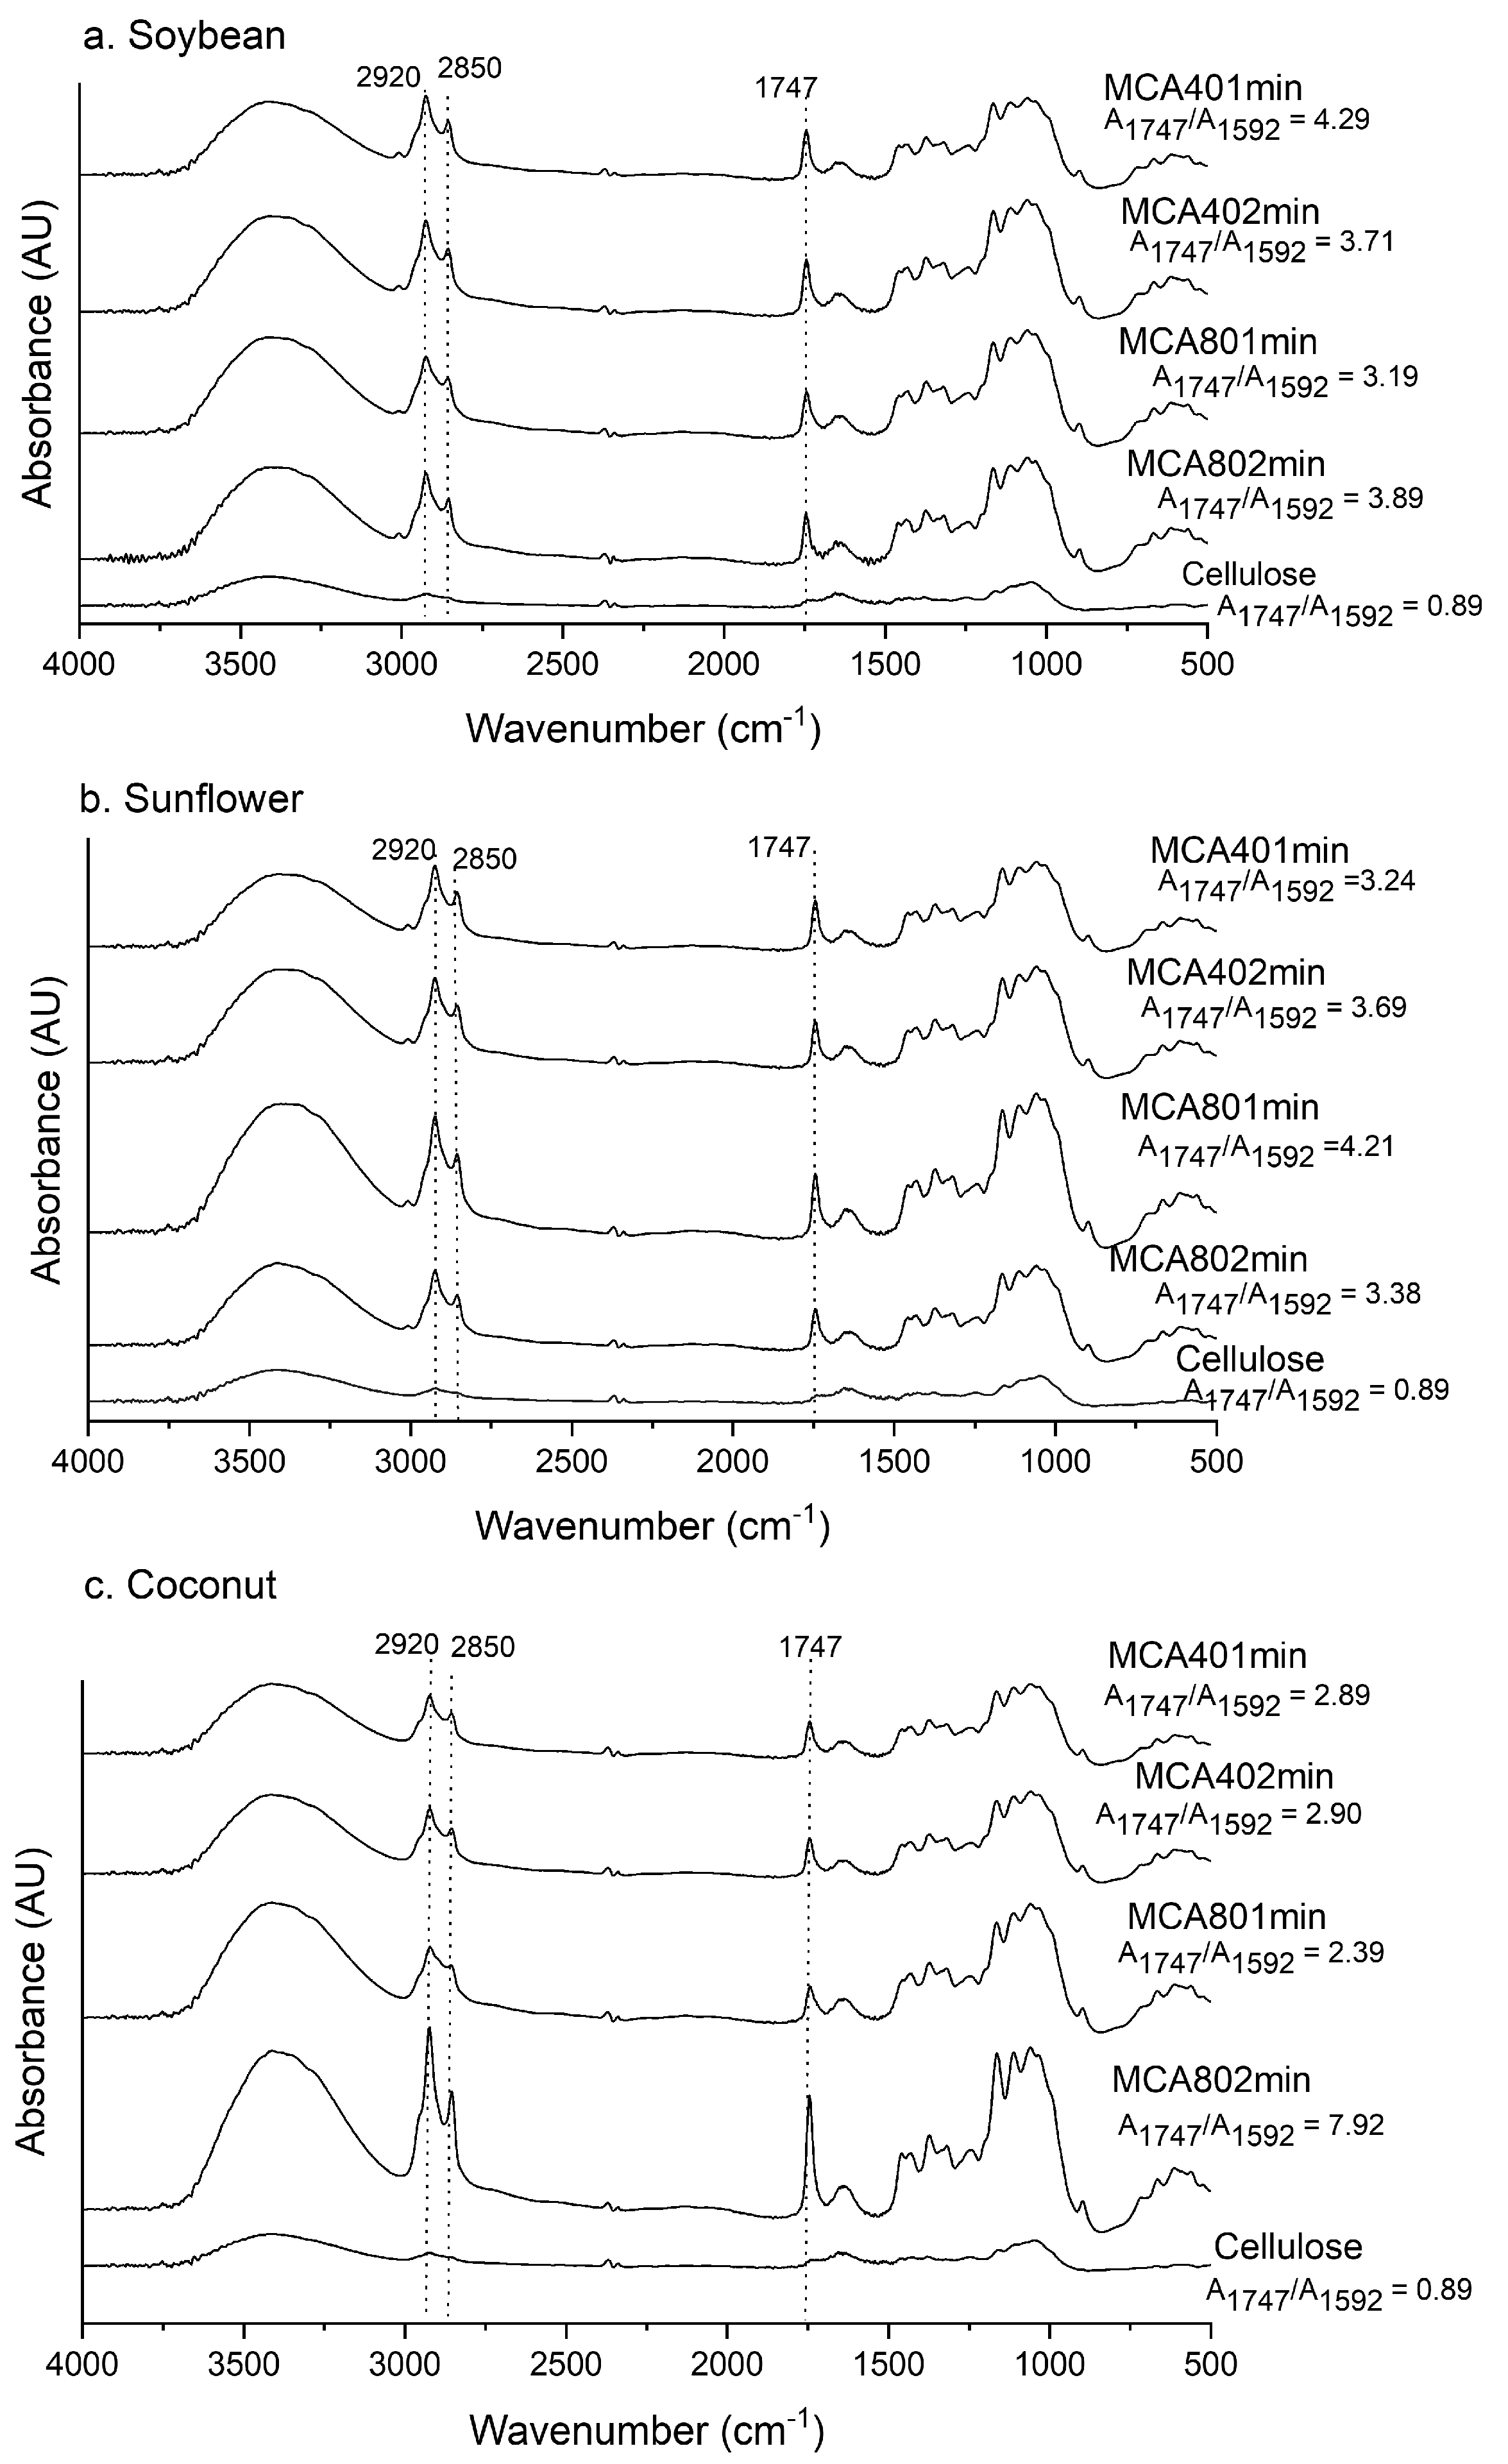
3.2. Fourier-Transform Infrared Spectroscopy (FTIR)

Figure 1 shows the FTIR spectra of the samples, which were used to identify the functional groups of cellulose and MC.
Certain variations detected in the FTIR spectra can be used to evaluate the success of the esterification reaction. A new band appeared with higher intensity at 1747 cm−1 in the spectra of all MC samples. For MCA401min, MCA402min, MCA801min, and MCA802min, which were modified with all oil sources, this band did not appear in the cellulose before modification. The band at 1747 cm−1 can be attributed to the C=O stretching of carbonyl in the ester bonds, which is evidence that esterification occurred. These outcomes align with those presented by Dankovich and Hsieh [23], Dong et al. [24], Shang et al. [38], and Adewuyi and Pereira [39]. They reported similar data, with the appearance of new bands in their modified material at 1746 cm−1, 1745 cm−1, 1700 cm−1, and 1745 cm−1, respectively, confirming cellulose esterification in all cases.
MC obtained under all conditions also showed important bands at 2920 and 2850 cm−1, which appeared in the cellulose sample with a much lower intensity when compared to the samples modified with fatty acids from vegetable oils. These bands were associated with the symmetrical C-H stretching of the CH3, CH2, and CH groups attributed to the alkyl chains of the vegetable oil fatty ester [38]. Kale et al. [25] observed the same band when they modified microcrystalline cellulose using rice bran oil, and they also reported that the new bands at 1745 and 2923 cm−1 mean that esterification was carried out successfully.
The extent of the esterification was calculated from the ratio between the absorbance intensity of the ester carbonyl (C=O) stretching vibrations band at 1747 cm−1 and the absorbance intensity of the band at 1592 cm−1. The same approach has been used in other studies to indicate esterification in cellulosic derivatives [4,29,40]. The A1747/A1592 ratios of the MC samples are presented in Figure 1, and it can be observed that the higher value (7.92) corresponded to the sample prepared with coconut oil at 80% amplitude for 2 min. All modified samples had higher values than the cellulose sample (A1747/A1592 = 0.89), indicating that the intensity of the 1747 cm−1 band increased between 3 and 9 times compared to the unmodified sample. These results suggest that the esterification occurred in the modified samples; cellulose can react with triglycerides from vegetable oils, and each glucose unit has three free hydroxyl groups at C–2, C–3, and C–6, which can be partially or fully substituted by an esterification reaction with the long acyl chains from triglycerides, forming a covalently bonded network, resulting in hydrophobic cellulose [27].
Samples modified with soybean and sunflower oils showed less variation in their A1747/A1592 ratio (Figure 1); however, as observed below, the other properties of MC were not affected by the different treatments or oil sources.

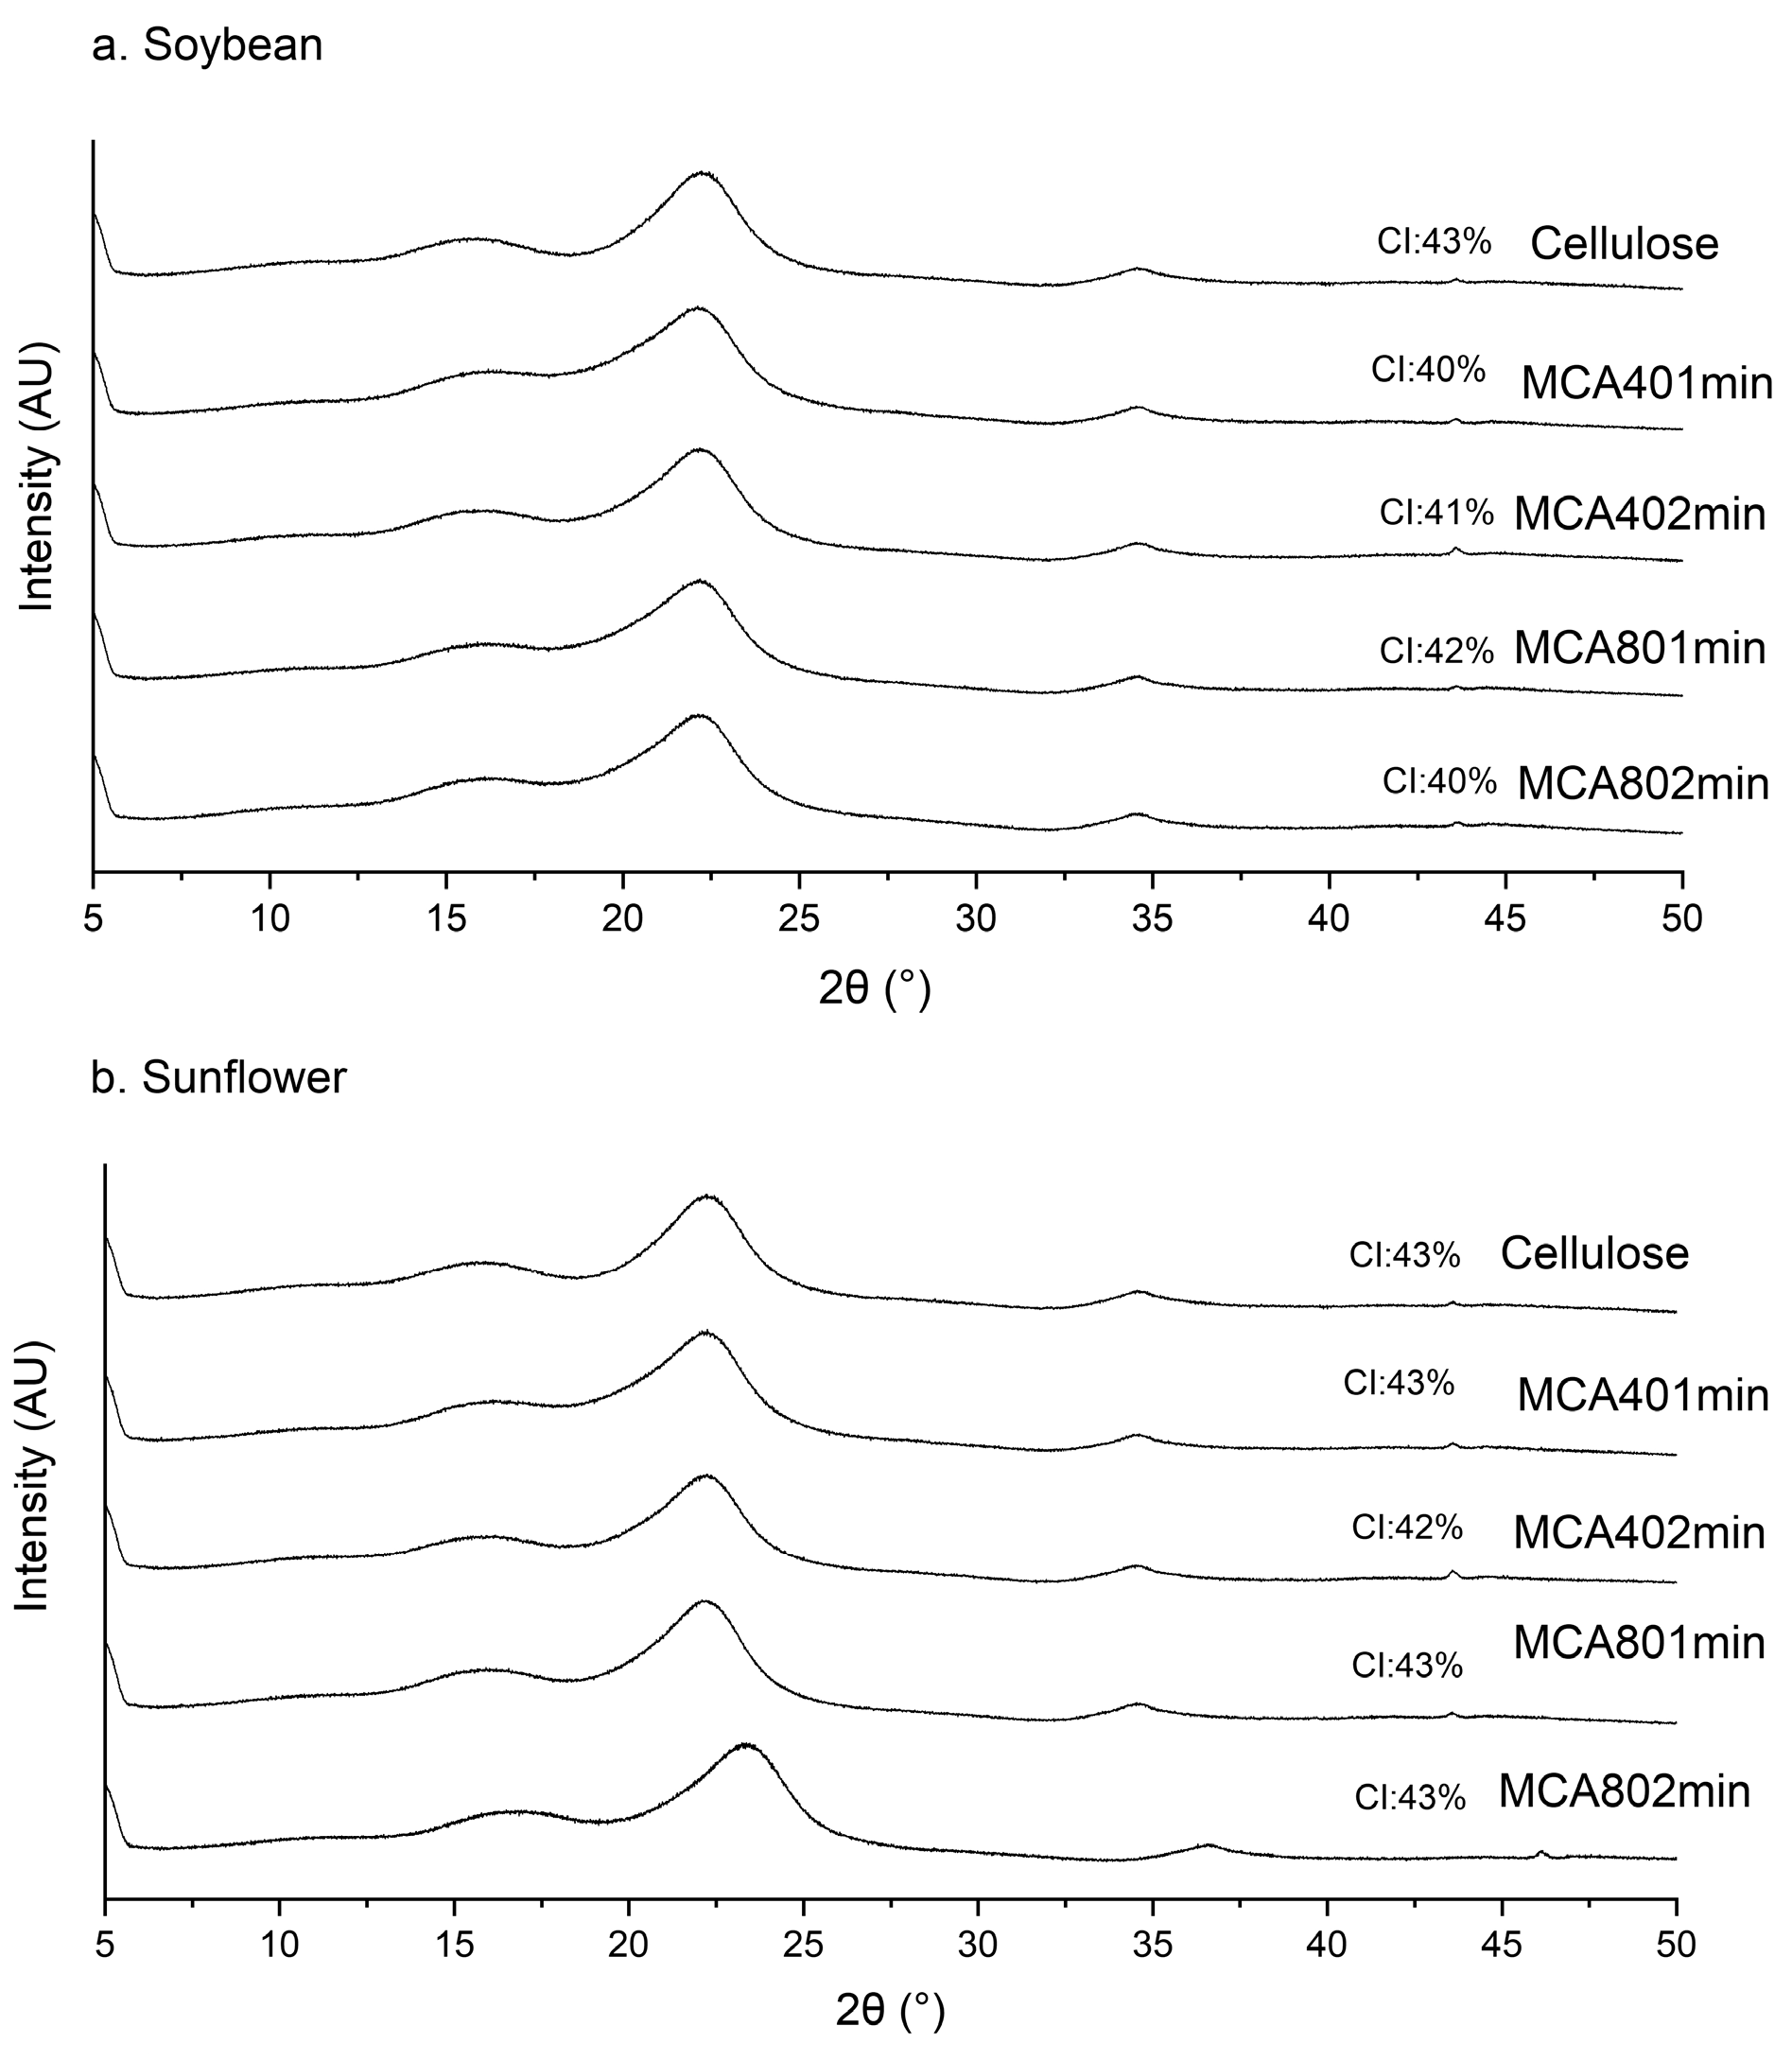
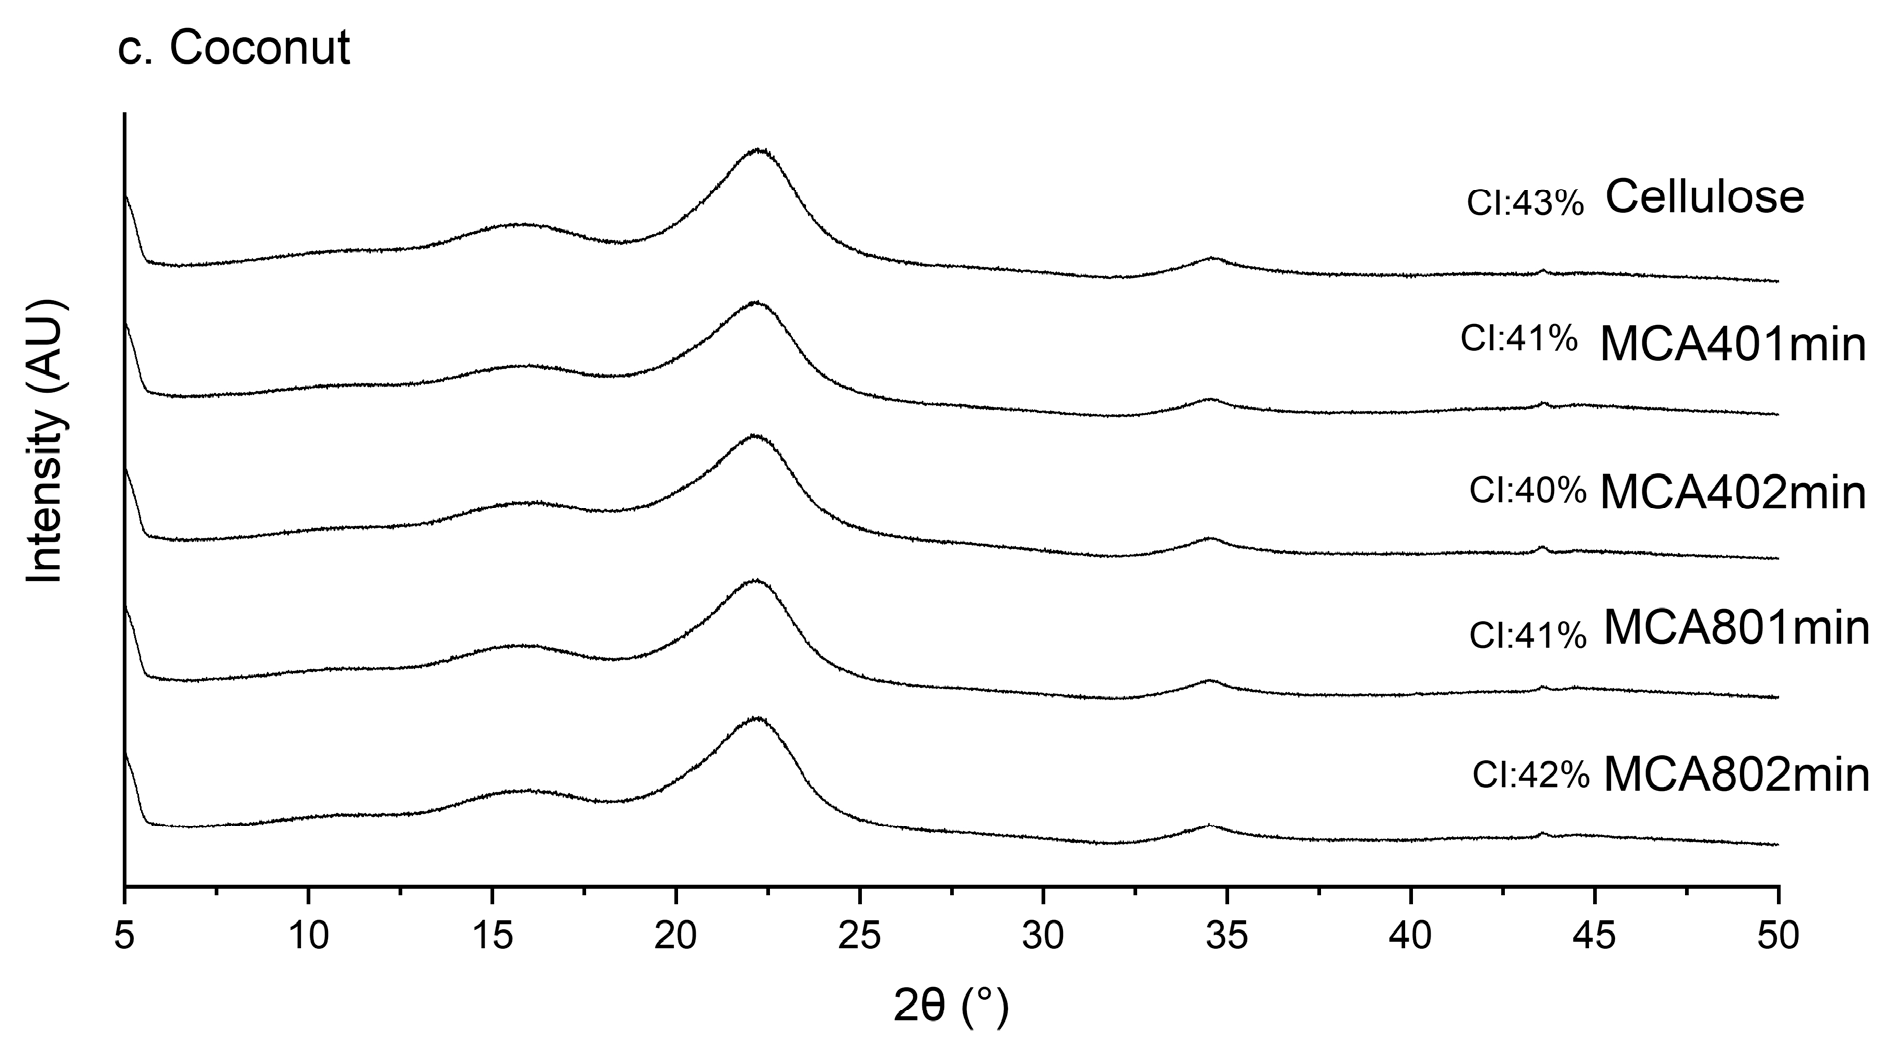
3.3. X-ray Diffraction (XRD)

Figure 2 shows the XRD pattern of the cellulose and MC samples. In all samples, a similar scattering with peaks compatible with cellulose type I can be seen, namely, peaks at 2θ = 16°, 22°, and 34.5°. Cardoso et al. [36], Debiagi et al. [5], and De Oliveira et al. [41] also reported characteristic peaks of cellulose type I at 2θ = 22, 15, and 34°.
The cellulose and MC samples showed crystallinity indices (CI) similar to each other (Figure 2), ranging from 40 to 43%, proving that the crystalline structure of the samples was not affected by modification with vegetable oils. Our results are consistent with Dong et al. [24], who modified microcrystalline cellulose with soybean oil. Bohrer et al. [17] reported that higher crystallinity values in cellulose derivatives can be an interesting characteristic, indicating that the material does not completely dissolve in water.
Esterification of cellulose should decrease its crystallinity compared to native cellulose [42]. Introducing ester groups can disrupt the hydrogen bonding network that maintains cellulose’s crystalline structure [43]. In this study, most substitutions probably occurred on the cellulose surface, which did not alter the material’s crystallinity.

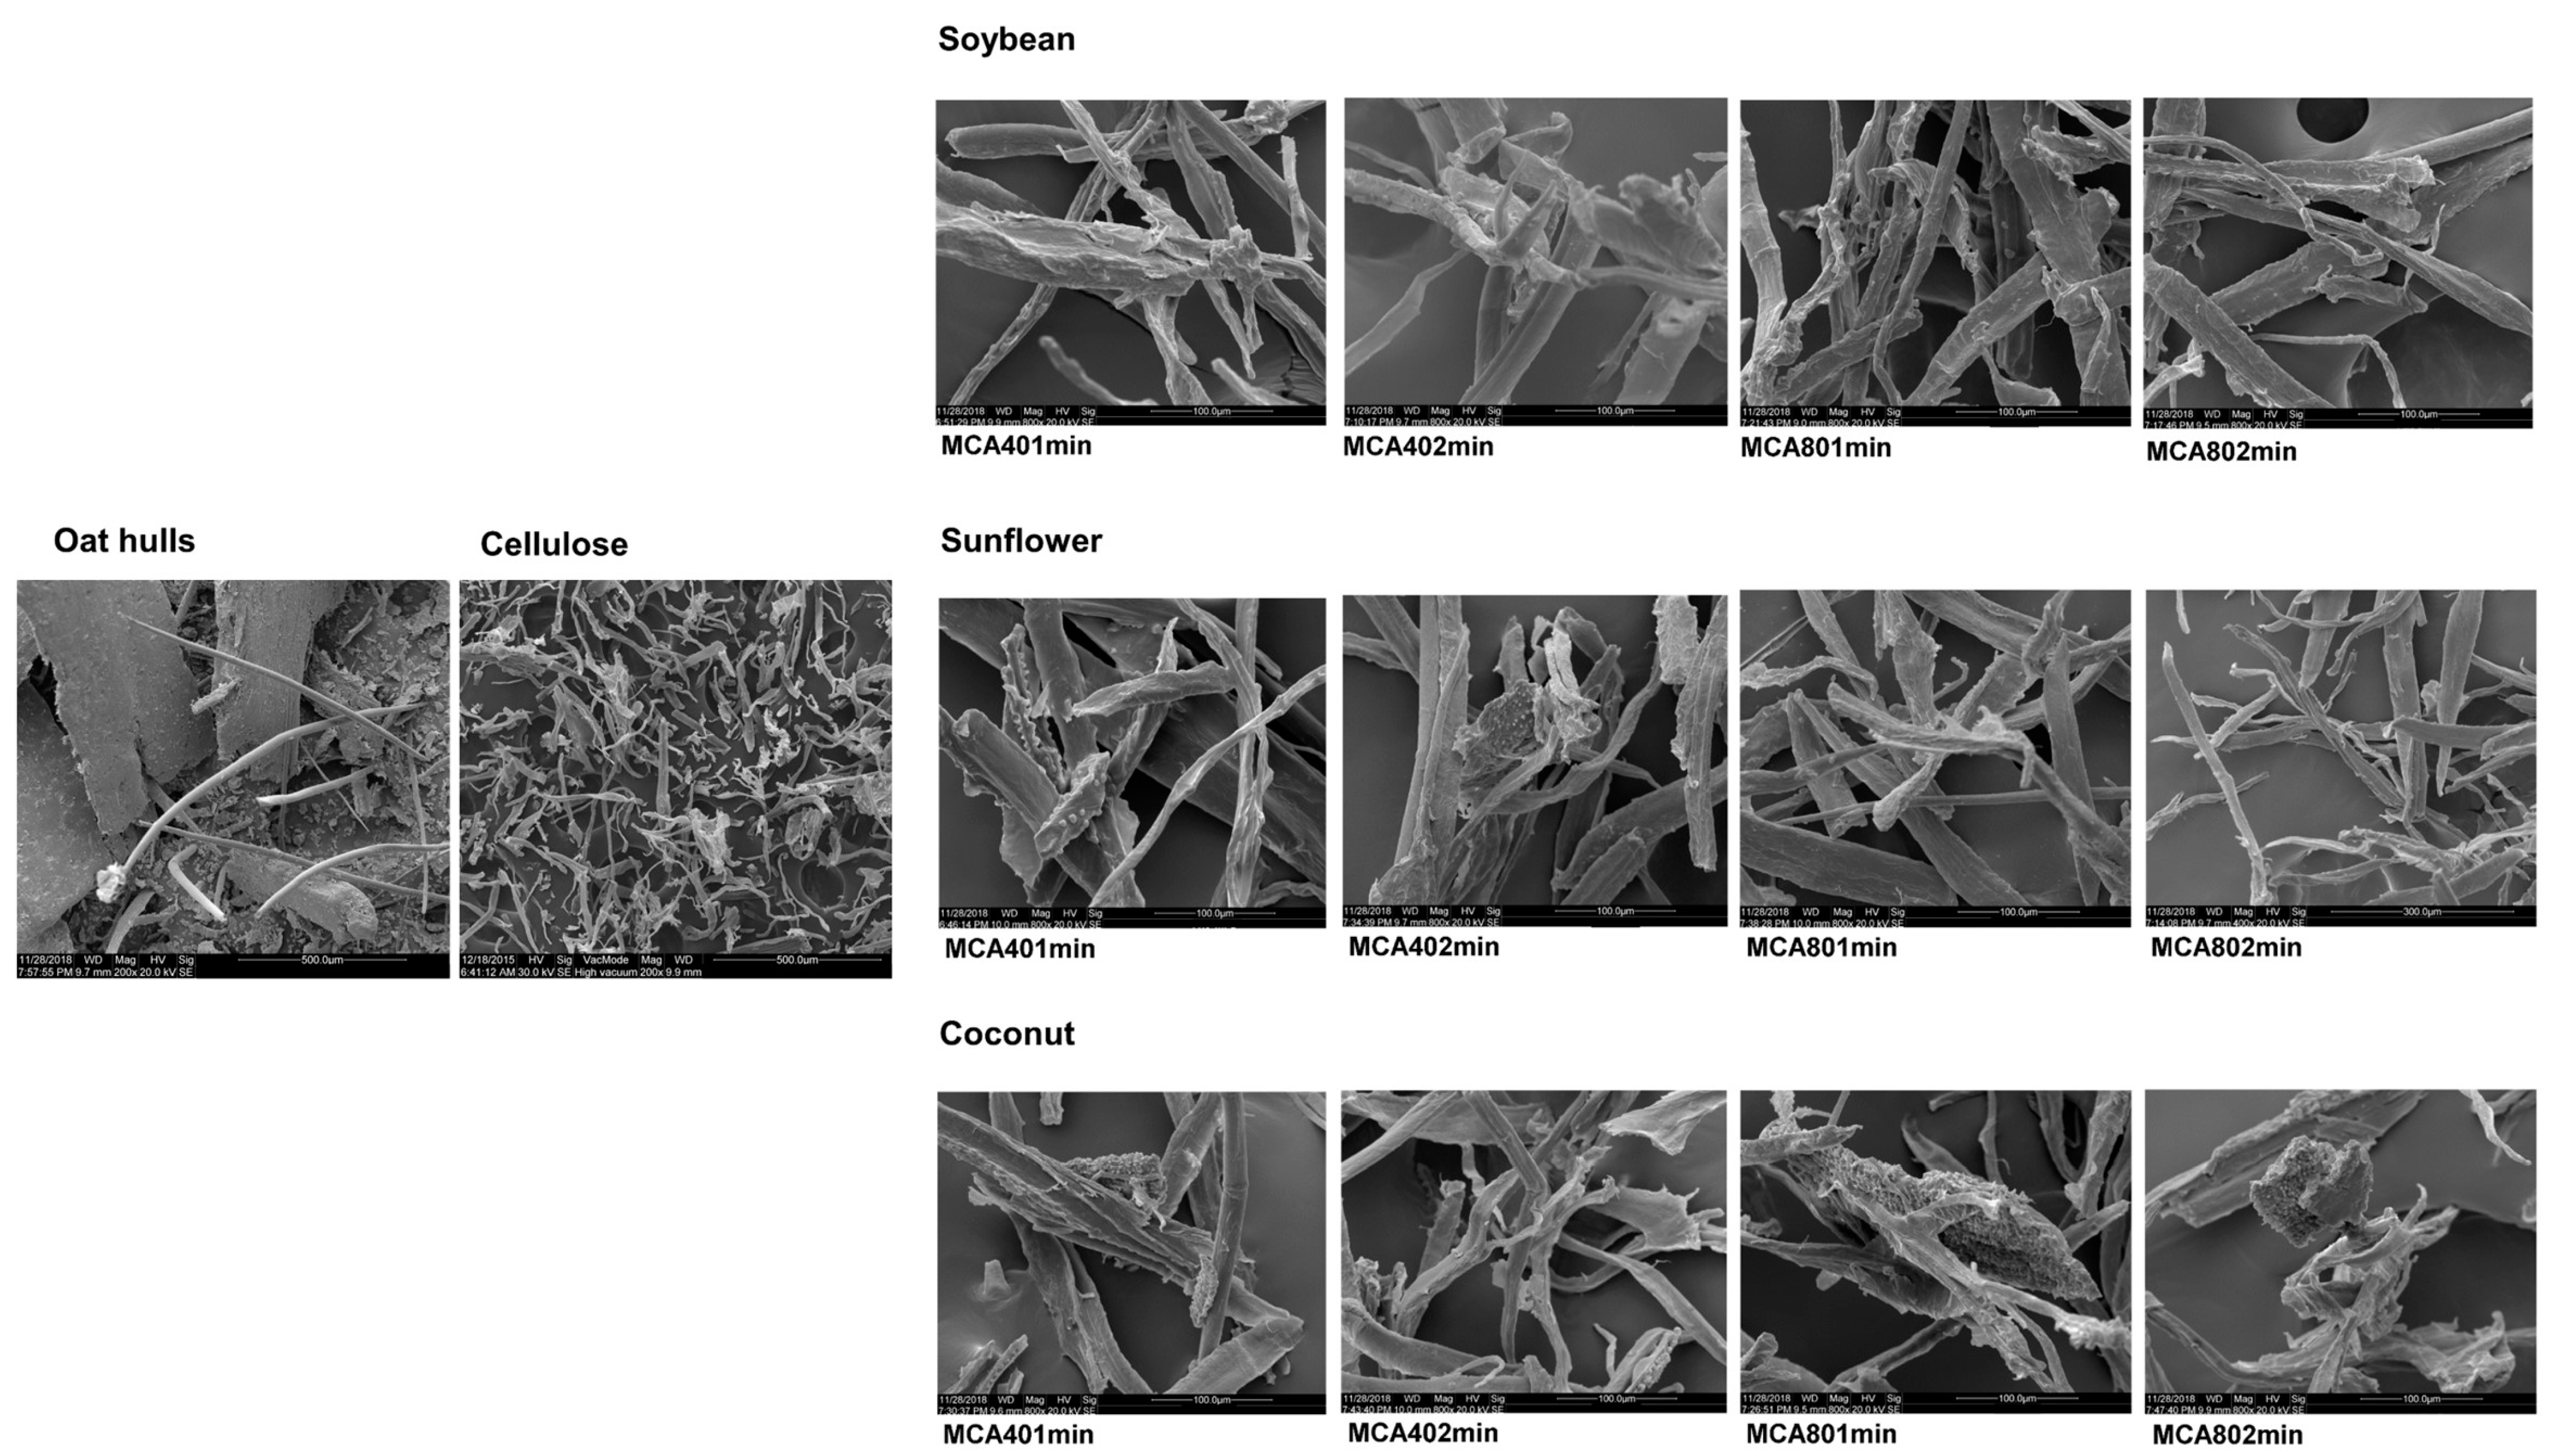
3.4. Scanning Electron Microscopy (SEM)

Figure 3 shows the raw oat hull morphology as a compact and rigid structure, typical of a lignocellulosic material where hemicellulose and lignin cover the cellulose fibers.
After the bleaching process, in which the lignin and hemicellulose were removed, the cellulose samples presented a very different morphology; in this sample, cellulose fibers could be observed due to the removal of the noncellulosic material (hemicellulose and lignin). These results were consistent with those presented by Agu et al. [21], Paschoal et al. [8], Gil-Giraldo et al. [4], and Debiagi et al. [5].
The morphology of the modified samples (Figure 3) was observed as individualized bundles without differences when compared to unmodified cellulose or among samples modified by employing different ultrasound conditions or oil types. It can be observed that the modification process did not affect the fiber morphology, indicating that the modification occurred mainly on the fiber surface, agreeing with the XRD results reported in this study.

3.5. Wettability

Wettability is one of the parameters used in determining the physicochemical and functional properties of polymers due to the tendency for a solvent to spread on a polymer surface in the presence of one or more immiscible solvents [31]. In the wettability test, the dispersion phenomenon was observed in the immiscible solvent system of water/dichloromethane. In Figure 4, it can be observed that after stirring, unmodified cellulose was unable to migrate into the dichloromethane (located at the bottom of the container) due to its higher affinity for water, which can be credited to the presence of the hydroxyl groups located on its surface. These groups have a high capacity for rearranging the water molecules in their surroundings.
All MC samples were able to migrate into the dichloromethane after stirring (Figure 4) because the hydroxyl groups located on the cellulose surface were replaced by nonpolar molecules, resulting in more hydrophobic surfaces, suggesting a lower polar nature. These results are similar to those presented by Dong et al. [24], Namazi and Dadkhah [31], Sai et al. [44], and Shang et al. [38]. These authors reported that changes in its wettability pattern can be observed after cellulose hydrophobization.
Regardless of the treatment employed in this study, an increased affinity for dichloromethane was observed, which was consistent with the FTIR data. This behavior is interesting for several applications, improving the applicability of cellulose for food processing, including its use as a food-grade gelator in oleogels systems [19,20] or as an ingredient in low-fat processed meat systems [17].

3.6. Water and Oil Absorption Capacities

The water and oil absorption capacities are shown in Table 1. The water and oil absorption capacities were significantly different (Tukey test, p ≤ 0.05) between cellulose and MC (Table 1), where water absorption decreased and oil adsorption increased in all MC samples.
These results can be attributed to the addition of nonpolar molecules to the cellulose surface, confirming that in the MC samples, a change in their hydrophilic character occurred, reducing their water retention capacity by 6 to 9-fold for all treatments. In accordance with these results, the oil retention capacity in the MC increased 3 times for all treatments, indicating an improved hydrophobicity of MC relative to cellulose.
The different treatments and oil sources did not significantly affect (Tukey test, p ≤ 0.05) the water and oil absorption capacities of the MC samples (Table 1). Adewuyi and Pereira [39] reported similar results by modifying cellulose with sebacic acid, and the authors reported a 6-fold decrease and a 2-fold increase in water and oil absorption capacities, respectively. Dankovich and Hsieh [23] reported a 3-fold reduction in the water absorption capacity of cellulose modified with vegetable oils, and they stressed that fatty acids present in vegetable oils have a greater capacity for crosslinking in hydrophobic networks, decreasing water access through the cellulose surface due to its compact structure.
In this study, OAC increased from 1.92 (unmodified cellulose) to 4.99–6.06 g/g (modified samples), which means an OAC ranging from 499 to 606% (Table 1). According to Zheng et al. [20], OAC indicates the capacity of a material to retain liquid oil in its three-dimensional network, being an important property to obtain cellulose-based oleogels that could be used as an alternative to replacing hydrogenated vegetable oils in high-fat food products. Boher et al. [17] reported that cellulose derivatives could be used as potential fat replacers in meat systems, including methylcellulose, carboxymethyl cellulose, and microcrystalline cellulose, which presented OAC values of 4.58, 3.08, and 4.00 g/g, respectively.

3.7. Moisture Sorption Isotherms

Table 2 and Figure 5 show the moisture sorption isotherms and parameters of the GAB model, respectively. The monolayer value (m0) indicates the maximum amount of water that can be adsorbed on a single layer per gram of dry matter. In this sense, cellulose showed the highest m0 value (8.72 g of water/100 g of solids) among all samples, indicating that modification with vegetable oils decreased the cellulose hygroscopicity. Among the modified samples, the lowest m0 was 3.36 g water/100 g solids obtained for MCA402minC (processed at 40% amplitude for 2 min, with coconut oil), and the highest value was 6.6 g water/100 g solids for MCA802minSF (processed at 80% amplitude for 2 min, with sunflower oil) (Table 2). However, among the MC samples, it was impossible to establish a relationship between the oil source or processing conditions with the m0 value variation.
In general, all MC samples showed similar isothermal patterns, increasing the equilibrium moisture content with increasing aw; however, the increases were higher in the cellulose sample compared to all MC samples under all aw conditions (Figure 5), confirming the increase.

3.8. Moisture Adsorption Kinetics

The moisture adsorption kinetics are shown in Figure 6.
For all samples and at all RH conditions, water adsorption occurred faster during the initial stages of storage, in the first 15 h of the assay, until reaching a plateau, when the maximum level of humidity remained stable. In addition, regardless of the conditions applied, in all cases, the cellulose showed a higher water absorption compared to the MC samples (Figure 6), corroborating the obtainment of cellulose with increased hydrophobicity.
The storage RH affected the moisture equilibrium behavior, and samples stored at 90% RH needed more time to reach equilibrium and adsorbed more water than samples stored at 20 and 60% RH. To understand the water adsorption behavior, the data obtained were adjusted using the Peleg model [35], and the results are shown in Table 3, where k1 is related to mass transfer. The lower k1 is, the higher the initial water adsorption rate; k2 is associated with the maximum water adsorption capacity, and the lower k2 is, the higher the adsorption capacity of the sample [45].
Cellulose had lower k1 and k2 values when compared to MC samples (Table 3), indicating its greater hygroscopic capacity. The reduction of free hydroxyl groups on the MC surface resulted in samples that adsorbed less water with a lower adsorption rate. These results are compatible and consistent with the data obtained from the water adsorption isotherms.

4. Conclusions

Cellulose obtained from oat hulls was modified with vegetable oils, resulting in esterified samples that showed increased hydrophobicity. The success of the cellulose modification was demonstrated by a new pronounced band associated with ester carbonyl groups (1747 cm−1) in the FTIR spectra and by the change in the wettability of all of the modified samples, confirming the binding of soybean, sunflower, and coconut oils to the cellulose skeleton without affecting its crystalline structure or surface morphology.
The different operational conditions employed in the modification and the different oil sources did not affect the main properties of the modified samples. After modification, all samples presented higher affinity for nonpolar solvents, higher oil absorption, and lower water absorption capacities. Modified samples stored at different RH conditions (20, 60, and 90% RH) adsorbed lower water amounts at lower adsorption rates.
The ultrasonication-assisted process employed in this work was effective in modifying cellulose by esterification with vegetable oils. It is an eco-friendly and simple strategy to obtain modified cellulose without synthetic or toxic reagents, expanding the industrial applications of these materials.

Author Contributions

Conceptualization, methodology, validation and writing—original draft preparation, G.A.G.-G.; formal analysis, J.O.F.K. and B.M.M.; investigation, G.A.G.-G.; writing—review and editing, N.C.L.B.; supervision, J.M. and S.M.; project administration, J.M. and S.M. All authors have read and agreed to the published version of the manuscript.

Funding

This research was funded by CAPES-DS-Brazil (doctorate grants of Gina Alejandra Gil-Giraldo, Janaina Mantovan, and Beatriz M. Marim) and FINEP (01.21.0126.00–REF. 0128/2021).

Institutional Review Board Statement

Not applicable.

Data Availability Statement

The raw data supporting the conclusions of this article is contained within the article, further inquiries can be directed to the corresponding author.

Acknowledgments

We thank the Laboratory of Spectroscopy (ESPEC), Laboratory of Electronic Microscopy and Microanalysis (LMEM), and Laboratory of X-ray Analysis (LARX) of the State University of Londrina for the analyses.

Conflicts of Interest

The authors declare no conflicts of interest. The funders had no role in the design of the study; in the collection, analyses, or interpretation of data; in the writing of the manuscript; or in the decision to publish the results.

References

  1. Wang, Y.; Wang, X.; Xie, Y.; Zhang, K. Functional nanomaterials through esterification of cellulose: A review of chemistry and application. Cellulose 2018, 25, 3703–3731. [Google Scholar] [CrossRef]
  2. Debiagi, F.; Faria-Tischer, P.C.S.; Mali, S. Nanofibrillated cellulose obtained from soybean hull using simple and eco-friendly processes based on reactive extrusion. Cellulose 2020, 27, 1975–1988. [Google Scholar] [CrossRef]
  3. Kumar, S.M.; Rajini, N.; Alavudeen, A.; Siengchin, S.; Rajulu, V.A.; Ayrilmis, N. Development and analysis of completely biodegradable cellulose/banana peel powder composite films. J. Nat. Fibers. 2021, 18, 151–160. [Google Scholar]
  4. Gil-Giraldo, G.A.; Mantovan, J.; Marim, B.M.; Kishima, J.O.F.; Mali, S. Surface modification of cellulose from oat hull with citric acid using ultrasonication and reactive extrusion assisted processes. Polysaccharides 2021, 2, 218–233. [Google Scholar] [CrossRef]
  5. Debiagi, F.; Madeira, T.B.; Nixdorf, S.L.; Mali, S. Pretreatment efficiency using autoclave high-pressure steam and ultrasonication in sugar production from liquid hydrolysates and access to the residual solid fractions of wheat bran and oat hulls. Appl. Biochem. Biotechnol. 2019, 190, 166–181. [Google Scholar] [CrossRef]
  6. Debiagi, F.; Faria-Tischer, P.C.S.; Mali, S. A Green approach based on reactive extrusion to produce nanofibrillated cellulose from oat hull. Waste Biomass. Valor. 2021, 12, 1051–1060. [Google Scholar] [CrossRef]
  7. Gulvady, A.A.; Brown, R.C.; Bell, J.A. Oat Nutrition and Chemistry: Nutritional Comparison of Oats and Other Commonly Consumed Whole Grains, in Oats Nutrition and Technology; Quaker Oats Center of Excellence, PepsiCo R&D Nutrition: Barrington, IL, USA, 2014. [Google Scholar]
  8. Paschoal, G.B.; Muller, C.M.O.; Carvalho, G.M.; Tischer, C.A.; Mali, S. Isolation and characterization of nanofibrillated cellulose from oat hulls. Quim. Nova 2015, 38, 478–482. [Google Scholar] [CrossRef]
  9. Mishra, D.K.; Kumar, S.; Sukla, R.S. Furfuryl alcohol—A promissing plataform chemical. In Biomass, Biofuels, Biochemicals: Recent Advances in Developing of Plataform Chemicals; Saravanamurugan, S., Pandey, A., Li, H., Riisagen, A., Eds.; Elsevier Science Publishers: Oxford, UK, 2020; pp. 323–345. [Google Scholar]
  10. Zuin, V.G.; Ramin, L.Z. Green and sustainable separation of natural products from agroindustrial waste: Challenges, potentialities, and perspectives on emerging approaches. Top. Curr. Chem. 2018, 3, 229–282. [Google Scholar]
  11. Agrawal, C.M.; Ong, J.L.; Appleford, M.R.; Mani, G. Natural biomaterials. In Introduction to Biomaterials—Basic Theory with Engineering Application; Saltzman, M.W., Chien, S., Eds.; Cambrigde University Press: Cambridge, UK, 2014; pp. 198–232. [Google Scholar]
  12. Klemm, D.; Heublein, B.; Fink, H.P.; Bohn, A. Cellulose: Fascinating biopolymer and sustainable raw material. Angew. Chem. Int. Edit. 2005, 44, 3358–3393. [Google Scholar] [CrossRef]
  13. Ngwabebhoh, F.A.; Ermem, A.; Yildiz, U.A. A design optimization study on synthesized nanocrystalline cellulose, evaluation and surface modification as a potential biomaterial for prospective biomedical applications. Int. J. Biol. Macromol. 2018, 114, 536–546. [Google Scholar] [CrossRef]
  14. Singh, P.; Duarte, H.; Alves, L.; Antunes, F.; Moigne, N.L.; Dormanns, J.; Duchemin, B.; Staiger, M.P.; Medronho, B. From cellulose dissolution and regeneration to added value applications—Synergism between molecular understanding and material development. In Cellulose—Fundamental Aspects and Current Trends; Poletto, M., Ornaghi, H.L., Jr., Eds.; IntechOpen: Rijeka, Croatia, 2015; pp. 1–45. [Google Scholar]
  15. Liyanage, S.; Acharya, S.; Parajuli, P.; Shamshina, J.L.; Abidi, N. Production and surface modification of cellulose bioproducts. Polymers 2021, 13, 3433. [Google Scholar] [CrossRef] [PubMed]
  16. Asim, N.; Badiei, M.; Mohammad, M. Recent advances in cellulose-based hydrophobic food packaging. Emergent Mater. 2022, 5, 703–718. [Google Scholar] [CrossRef]
  17. Bohrer, B.; Izadifar, M.; Barbut, S. Structural and functional properties of modified cellulose ingredients and their application in reduced-fat meat batters. Meat Sci. 2023, 195, 109011. [Google Scholar] [CrossRef] [PubMed]
  18. Gao, Z.; Zhang, C.; Li, Y.; Wu, Y.; Deng, Q.; Ni, X. Edible oleogels fabricated by dispersing cellulose particles in oil phase: Effects from the water addition. Food Hydrocoll. 2023, 134, 108040. [Google Scholar] [CrossRef]
  19. Wang, Q.; Espert, M.; Larrea, V.; Quiles, A.; Salvador, A.; Sanz, T. Comparison of different indirect approaches to design edible oleogels based on cellulose ethers. Food Hydrocoll. 2023, 134, 108007. [Google Scholar] [CrossRef]
  20. Zheng, L.; Zhong, J.; Liu, X.; Wang, Q.; Qin, X. Physicochemical properties and intermolecular interactions of a novel diacylglycerol oil oleogel made with ethyl cellulose as affected by γ-oryzanol. Food Hydrocoll. 2023, 138, 108484. [Google Scholar] [CrossRef]
  21. Agu, O.S.; Tabil, L.G.; Dumonceaux, T. Microwave-assisted alkali pre-treatment, densification and enzymatic saccharification of canola straw and oat hull. Bioengineering 2017, 4, 25. [Google Scholar] [CrossRef]
  22. Gorade, V.G.; Kotwal, A.; Chaudhary, B.U.; Kale, R.D. Surface modification of microcrystalline cellulose using rice bran oil: A bio-based approach to achieve water repellency. J. Polym. Res. 2019, 26, 217. [Google Scholar] [CrossRef]
  23. Dankovich, T.A.; Hsieh, Y.L. Surface modification of cellulose with plant triglycerides for hydrophobicity. Cellulose 2007, 14, 469–480. [Google Scholar] [CrossRef]
  24. Dong, X.; Dong, Y.; Jiang, M.; Wang, L.; Tong, J.; Zhou, J. Modification of microcrystalline cellulose by using soybean oil for surface hydrophobization. Ind. Crop. Prod. 2013, 46, 301–303. [Google Scholar] [CrossRef]
  25. Kale, D.; Gorade, V.G.; Madye, M.; Chaudhary, B.; Bangde, P.S.; Dandekar, P.P. Preparation and characterization of biocomposite packaging film from poly(lactic acid) and acylated microcrystalline cellulose using rice bran oil. Int. J. Biol. Macromol. 2018, 118, 1090–1102. [Google Scholar] [CrossRef] [PubMed]
  26. Mantovan, J.; Gil-Giraldo, G.A.; Marim, B.M.; Kishima, J.O.F.; Mal, S. Valorization of orange bagasse through one-step physical and chemical combined processes to obtain a cellulose-rich material. J. Sci. Food Agric. 2021, 101, 2362–2370. [Google Scholar] [CrossRef]
  27. Van Soest, P.J. Symposium on factors influencing the voluntary intake of herbage by ruminants: Voluntary intake in relation to chemical composition and digestibility. J. Anim. Sci. 1965, 24, 834–843. [Google Scholar] [CrossRef]
  28. Tappi Test Method T222 om-88, Acid-Insoluble Lignin in Wood and Pulp, in Tappi Test Methods; Tappi Press: Atlanta, GA, USA, 1999.
  29. Coma, V.; Sebti, I.; Pardon, P.; Pichavant, F.H.; Deschamps, A. Film properties from crosslinking of cellulosic derivatives with a polyfunctional carboxylic acid. Carbohydr. Polym. 2003, 51, 265–271. [Google Scholar] [CrossRef]
  30. Segal, L.; Creely, J.J.; Martin, A.E.; Conrad, C.M. An empirical method for estimating the degree of crystallinity of native cellulose using the X-ray diffractometer. Text. Res. J. 1959, 29, 786–794. [Google Scholar] [CrossRef]
  31. Namazi, H.; Dadkhah, A. Convenient method for preparation of hydrophobically modified starch nanocrystals with using fatty acids. CarbohydR. Polym. 2010, 79, 731–737. [Google Scholar] [CrossRef]
  32. Lu, H.; Gui, Y.; Zheng, L.; Liu, X. Morphological, crystalline, thermal and physicochemical properties of cellulose nanocrystals obtained from sweet potato residue. Food. Res. Int. 2013, 50, 121–128. [Google Scholar] [CrossRef]
  33. Rockland, L.B. Saturated salt solutions for static control of relative humidity between 5° and 40 °C. Anal. Chem. 1960, 32, 1375–1376. [Google Scholar] [CrossRef]
  34. Bizot, H. Using the GAB model to construct sorption isotherms. In Physical Properties of Foods; Jowitt, R., Escher, F., Hallistrom, B., Meffert, H.F.T., Spiess, W.W.L., Vos, G., Eds.; Applied Science Publishers: London, UK, 1984; pp. 27–41. [Google Scholar]
  35. Peleg, M. An empirical model for the description of moisture sorption curves. J. Food. Sci. 1988, 53, 1216–1219. [Google Scholar] [CrossRef]
  36. Cardoso, M.A.P.; Carvalho, G.M.; Yamashita, F.; Mali, S.; Eiras, D.; Demiate, I.M.; Grossmann, M.V.E. Oat hull fibers bleached by reactive extrusion with alkaline hydrogen peroxide in thermoplastic starch/poly (butylene adipate-co-terephthalate) composites. Polym. Compos. 2018, 39, 950–1958. [Google Scholar] [CrossRef]
  37. Marim, B.M.; Mantovan, J.; Giraldo, G.A.; Mali, S. Environmentally friendly process based on a combination of ultrasound and peracetic acid treatment to obtain cellulose from orange bagasse. J. Chem. Technol. Biotechnol. 2021, 96, 630–638. [Google Scholar] [CrossRef]
  38. Shang, W.; Huang, J.; Luo, H.; Chang, P.R.; Feng, J.; Xie, G. Hydrophobic modification of cellulose nanocrystal via covalently grafting of castor oil. Cellulose 2013, 20, 179–190. [Google Scholar] [CrossRef]
  39. Adewuyi, A.; Pereira, F.V. Surface modification of cellulose isolated from Sesamun indicum underutilized seed: A means of enhancing cellulose hydrophobicity. J. Sci. Adv. Mater. Devices 2017, 2, 326–332. [Google Scholar] [CrossRef]
  40. Demitri, C.; Del Sole, R.; Scalera, F.; Sannino, A.; Vasapollo, G.; Maffezzoli, A.; Nicolais, L. Novel superabsorbent cellulose-based hydrogels crosslinked with citric acid. J. Appl. Polym. Sci. 2008, 110, 2453–2460. [Google Scholar] [CrossRef]
  41. De Oliveira, J.P.; Bruni, G.P.; El-Halal, M.S.L.; Bertoldi, F.C.; Guerra-Dias, A.R.; Da Rosa-Zavareze, E. Cellulose nanocrystals from rice and oat husks and their application in aerogels for food packaging. Int. J. Biol. Macromol. 2019, 124, 175–184. [Google Scholar] [CrossRef] [PubMed]
  42. Chen, Z.; Zhang, J.; Xiao, P.; Tian, W.; Zhang, J. Novel thermoplastic cellulose esters containing bulky moieties and soft segments. ACS Sustain. Chem. Eng. 2018, 6, 4931–4939. [Google Scholar] [CrossRef]
  43. David, G.; Gontard, N.; Guerin, D.; Heux, L.; Lecomte, J.; Molina-Boisseau, S.; Angellier-Coussy, H. Exploring the potential of gas-phase esterification to hydrophobize the surface of micrometric cellulose particles. Eur. Polym. J. 2019, 115, 138–146. [Google Scholar] [CrossRef]
  44. Sai, H.; Fu, R.; Xin, L.; Xiang, J.; Li, Z.; Li, F.; Zhang, T. Surface modification of bacterial cellulose aerogels’ web-like skeleton for oil/water separation. ACS Appl. Mater. Inter. 2015, 7, 7373–7381. [Google Scholar] [CrossRef]
  45. Mali, S.; Sakanaka, L.S.; Yamashita, F.; Grossmann, M.V.E. Water sorption and mechanical properties of cassava starch films and their relation to plasticizing effect. Carbohydr. Polym. 2005, 60, 283–289. [Google Scholar] [CrossRef]
Figure 1. FTIR spectra of cellulose and MC samples modified with (a) soybean oil, (b) sunflower oil, and (c) coconut oil.
Polysaccharides 05 00029 g001
Figure 2. X-ray diffractograms of cellulose and MC samples modified with (a) soybean oil, (b) sunflower oil, and (c) coconut oil.
Polysaccharides 05 00029 g002aPolysaccharides 05 00029 g002b
Figure 3. SEM images of cellulose and MC samples modified with soybean oil, sunflower oil, and coconut oil.
Polysaccharides 05 00029 g003
Figure 4. Dispersions of cellulose and MC samples modified with soybean, sunflower, and coconut oils in a water/dichloromethane system.
Polysaccharides 05 00029 g004
Figure 5. Moisture sorption isotherms and parameters of the GAB of cellulose and modified cellulose with (a) soybean, (b) sunflower, and (c) coconut oils. Lines are derived from the GAB model.
Polysaccharides 05 00029 g005
Figure 6. Moisture adsorption kinetics of cellulose and MC samples modified with (a) soybean, (b) sunflower, and (c) coconut oils.
Polysaccharides 05 00029 g006
Table 1. Water and oil absorption capacities of cellulose and MC samples modified with soybean (S), sunflower (SF), and coconut (C) oils.
SampleWAC (g/g)OAC (g/g)
Cellulose10.20 ± 0.00 a1.92 ± 0.22 b
MCA401mimS1.87 ± 0.05 b6.06 ± 1.14 a
MCA402minS1.78 ± 0.03 b4.99 ± 0.42 a
MCA801minS1.33 ± 0.34 b5.24 ± 0.59 a
MCA802minS1.89 ± 0.13 b5.62 ± 0.49 a
MCA401minSF1.57 ± 0.24 b5.03 ± 0.45 a
MCA402minSF1.15 ± 0.63 b5.38 ± 0.39 a
MCA801minSF1.71 ± 0.14 b5.22 ± 0.30 a
MCA802minSF1.44 ± 0.54 b5.19 ± 0.37 a
MCA401minC1.70 ± 0.29 b5.02 ± 0.22 a
MCA402minC1.60 ± 0.25 b5.36 ± 0.68 a
MCA801minC1.57 ± 0.12 b5.17 ± 0.60 a
MCA802minC1.74 ± 0.32 b5.53 ± 0.52 a
Different letters in the same column indicate significant differences (p ≤ 0.05) between means (Tukey test).
Table 2. GAB model* parameters for cellulose and MC modified with soy (S), sunflower (SF), and coconut oils (C).
Samplem0CKr2
Cellulose8.723.190.570.99
MCA401minS4.865.160.560.99
MCA402minS4.057.680.640.99
MCA801minS5.444.010.530.99
MCA802minS5.884.350.490.99
MCA401minSF5.473.310.560.98
MCA402minSF4.883.290.630.99
MCA801minSF3.693.640.700.99
MCA802minSF6.622.610.550.99
MCA401minC3.694.960.680.99
MCA402minC3.364.720.690.99
MCA801minC5.572.820.550.98
MCA802minC5.304.280.510.98
* M = m0CKaw/(1 − Kaw) (1 − Kaw + CKaw), where M is the equilibrium moisture content at a water activity aw, m0 is the monolayer value (g water/100 g solids), and C and K are the constants.
Table 3. PELEG model* parameters for cellulose and MC samples with soy (S), sunflower (SF), and coconut (C) oils.
Sample20% RH60% RH90% RH
k1k2r2k1k2r2k1k2r2
Cellulose0.810.670.800.080.150.990.070.090.99
MCA401minS14.164.350.700.130.180.990.200.130.98
MCA402minS24.461.600.700.190.180.990.040.120.99
MCA801minS37.371.240.800.120.160.990.200.110.98
MCA802minS7.932.710.900.110.190.990.070.120.98
MCA401minSF14.911.600.800.150.170.990.110.120.99
MCA402minSF9.011.700.950.100.170.980.060.120.99
MCA801minSF45.863.730.800.090.170.990.060.120.99
MCA802minSF7.510.900.900.090.180.990.090.110.98
MCA401minC2.941.300.850.130.170.990.070.110.99
MCA402minC11.602.790.850.090.170.990.050.110.99
MCA801minC12.322.720.900.070.160.990.060.120.97
MCA802minC27.022.950.800.040.180.990.060.120.99
* M(t) = M0 + (t/(k1 + k2t)), k1 in h/(g water/g solids) and k2 in g solid/g water.
Disclaimer/Publisher’s Note: The statements, opinions and data contained in all publications are solely those of the individual author(s) and contributor(s) and not of MDPI and/or the editor(s). MDPI and/or the editor(s) disclaim responsibility for any injury to people or property resulting from any ideas, methods, instructions or products referred to in the content.

