
Relationship between Non-Alcoholic Fatty Liver Disease and Visceral Fat Measured by Imaging-Based Body Composition Analysis: A Systematic Review


Abstract
:1. Introduction
2. Materials and Methods
2.1. Data Sources
2.2. Study Selection
2.3. Quality Assessment and Data Extraction
3. Results
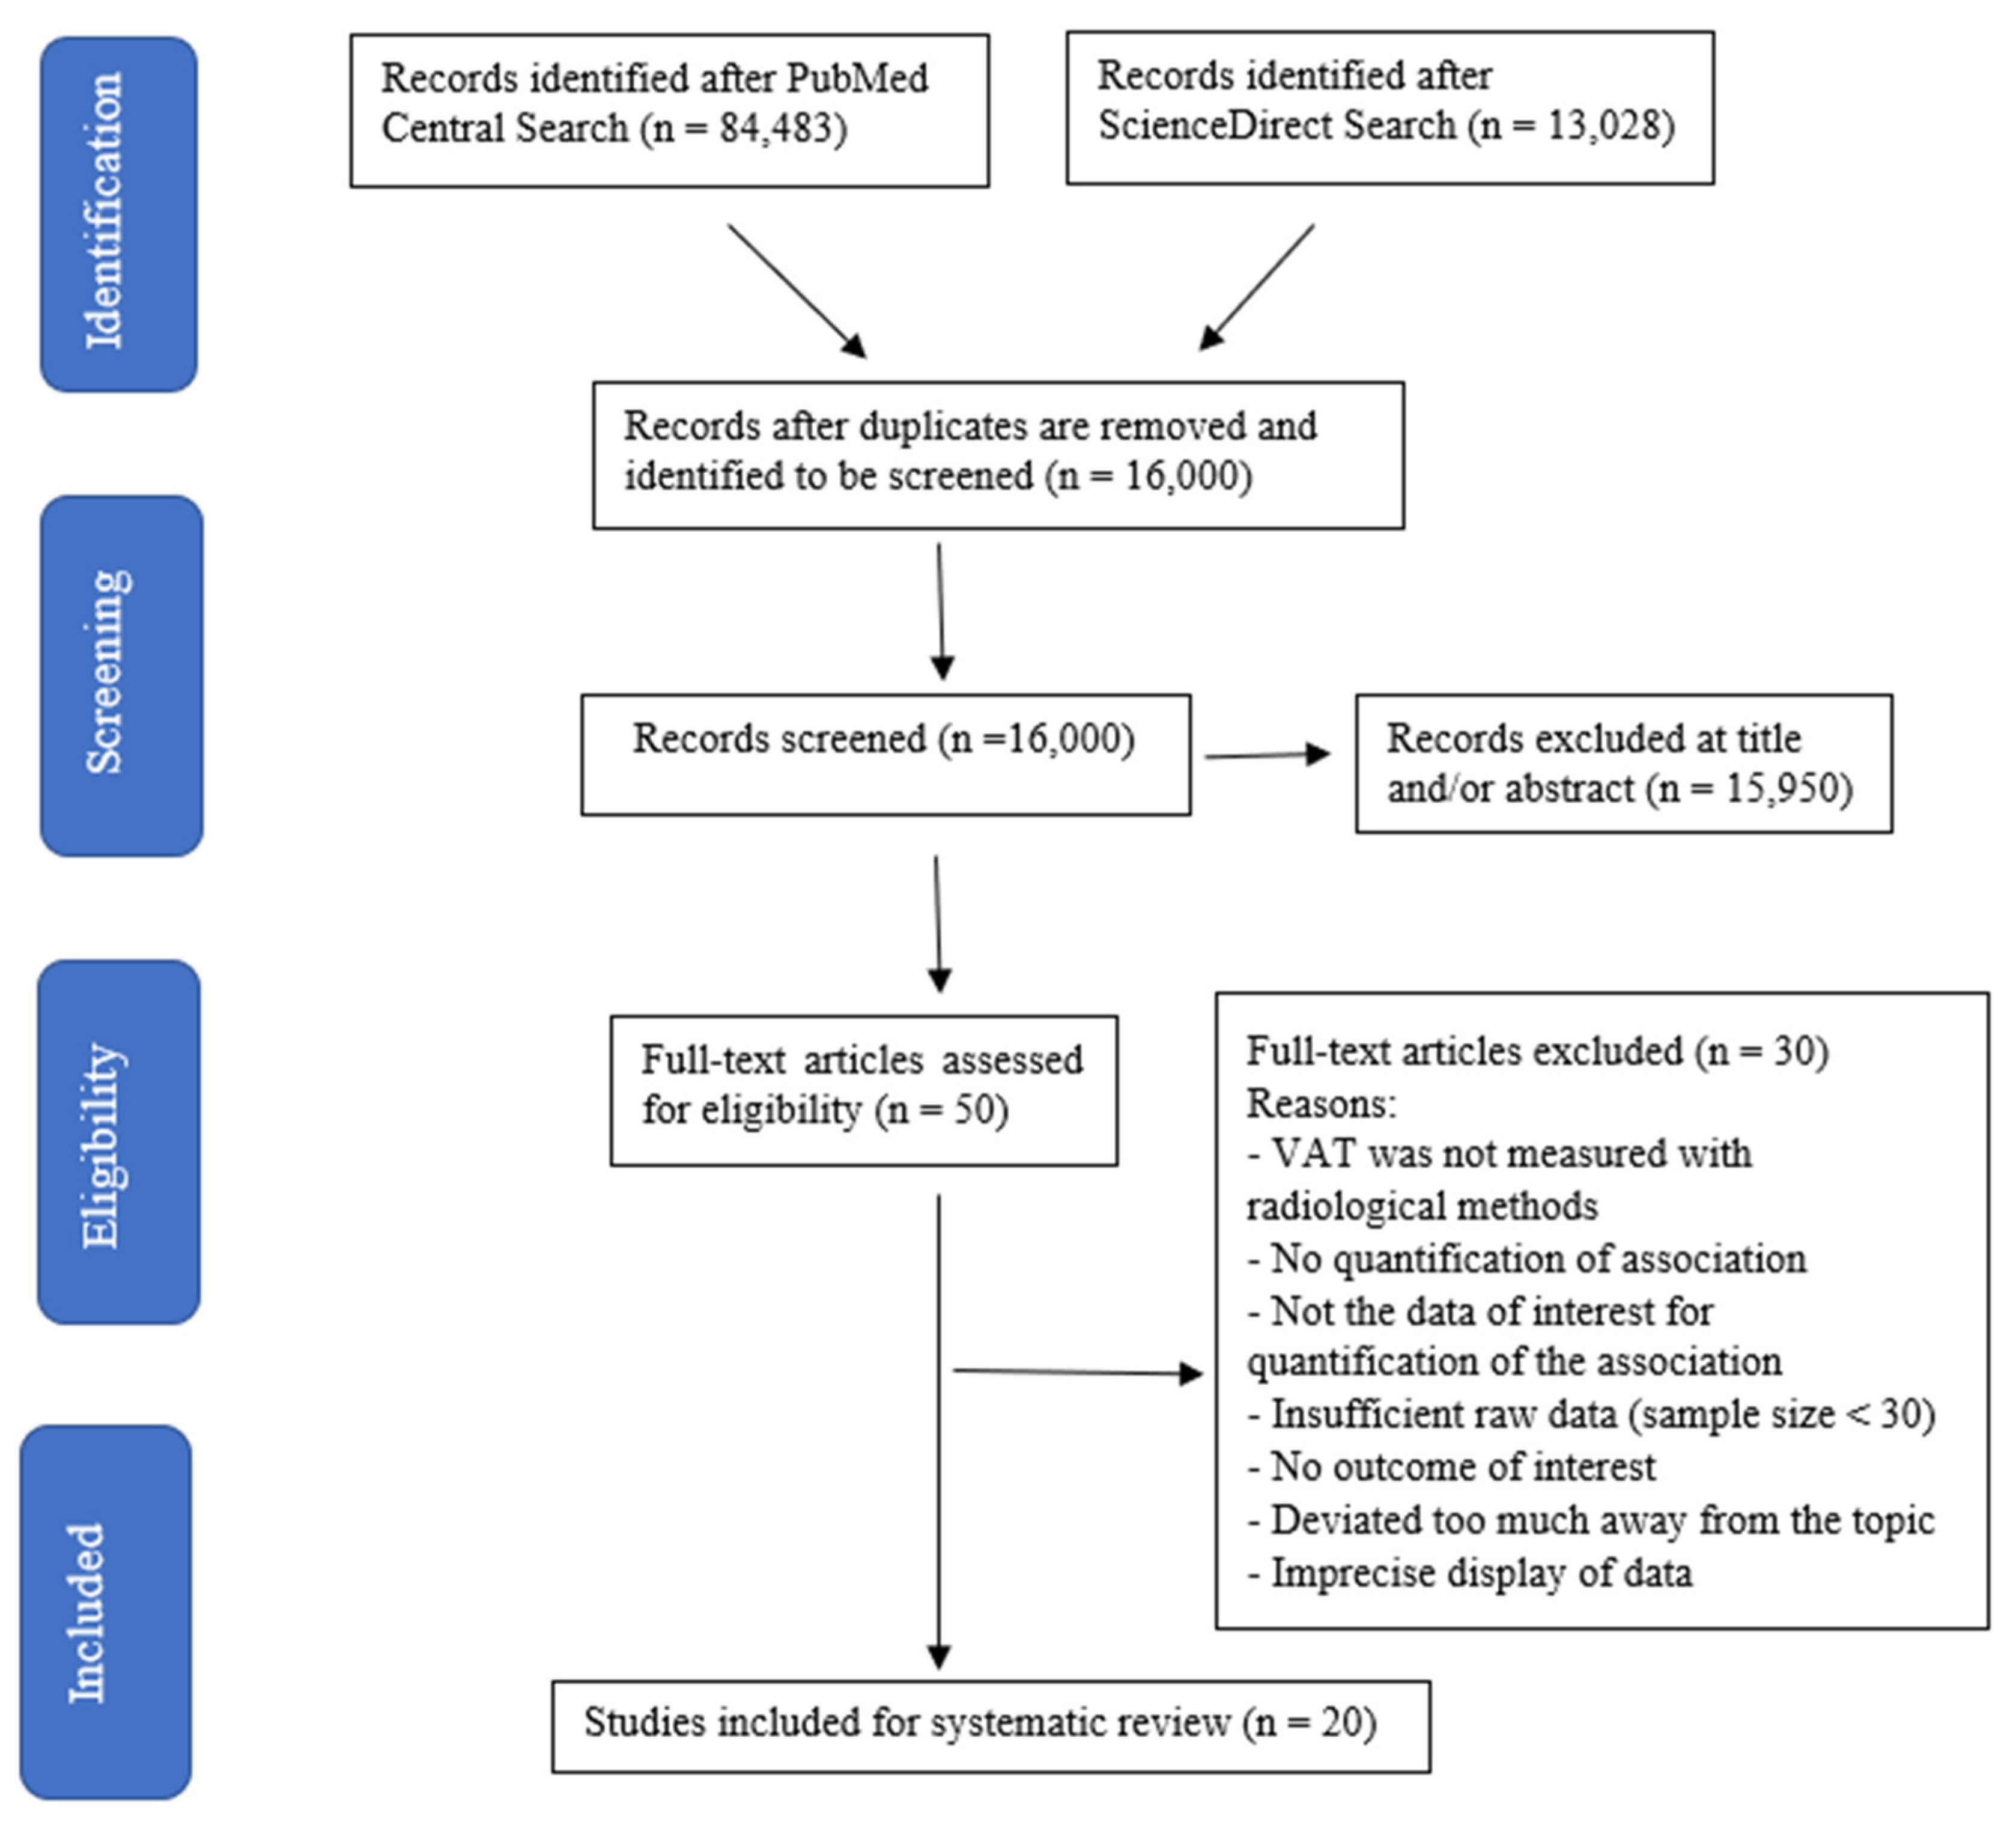
3.1. Search Results
3.2. The Relationship between VAT with NAFLD
3.3. The Relationship between VAT with Hepatic Steatosis
4. Discussion
5. Conclusions
Author Contributions
Institutional Review Board Statement
Informed Consent Statement
Data Availability Statement
Acknowledgments
Conflicts of Interest
References
- Lonardo, A.; Leoni, S.; Alswat, K.A.; Fouad, Y. History of Nonalcoholic Fatty Liver Disease. Int. J. Mol. Sci. 2020, 21, 5888. [Google Scholar] [CrossRef] [PubMed]
- Juanola, O.; Martínez-López, S.; Francés, R.; Gómez-Hurtado, I. Non-Alcoholic Fatty Liver Disease: Metabolic, Genetic, Epigenetic and Environmental Risk Factors. Int. J. Environ. Res. Public Health 2021, 18, 5227. [Google Scholar] [CrossRef] [PubMed]
- Francque, S.M.; Marchesini, G.; Kautz, A.; Walmsley, M.; Dorner, R.; Lazarus, J.V.; Zelber-Sagi, S.; Hallsworth, K.; Busetto, L.; Frühbeck, G.; et al. Non-alcoholic fatty liver disease: A patient guideline. JHEP Rep. Innov. Hepatol. 2021, 3, 100322. [Google Scholar] [CrossRef] [PubMed]
- Mitra, S.; De, A.; Chowdhury, A. Epidemiology of non-alcoholic and alcoholic fatty liver diseases. Transl. Gastroenterol. Hepatol. 2020, 5, 16. [Google Scholar] [CrossRef] [PubMed]
- Lazarus, J.V.; Mark, H.E.; Villota-Rivas, M.; Palayew, A.; Carrieri, P.; Colombo, M.; Ekstedt, M.; Esmat, G.; George, J.; Marchesini, G.; et al. The Global NAFLD Policy Review and preparedness index: Are countries ready to address this silent public health challenge? J. Hepatol. 2022, 76, 771–780. [Google Scholar] [CrossRef]
- Xiao, J.; Ng, C.H.; Chan, K.E.; Fu, C.; Tay, P.; Yong, J.N.; Lim, W.H.; Tan, D.J.; Syn, N.; Wong, Z.Y.; et al. Hepatic, extra-hepatic outcomes and causes of mortality in NAFLD—An umbrella overview of systematic review of meta-analysis. J. Clin. Exp. Hepatol. 2022, 13, 656–665. [Google Scholar] [CrossRef]
- Vancells Lujan, P.; Viñas Esmel, E.; Sacanella Meseguer, E. Overview of Non-Alcoholic Fatty Liver Disease (NAFLD) and the Role of Sugary Food Consumption and Other Dietary Components in its Development. Nutrients 2021, 13, 1442. [Google Scholar] [CrossRef]
- Rinella, M.E. Nonalcoholic Fatty Liver Disease: A Systematic Review. JAMA 2015, 313, 2263–2273. [Google Scholar] [CrossRef]
- Xu, R.; Pan, J.; Zhou, W.; Ji, G.; Dang, Y. Recent advances in lean NAFLD. Biomed. Pharmacother. 2022, 153, 113331. [Google Scholar] [CrossRef]
- Albhaisi, S.; Chowdhury, A.; Sanyal, A.J. Non-alcoholic fatty liver disease in lean individuals. JHEP Rep. Innov. Hepatol. 2019, 1, 329–341. [Google Scholar] [CrossRef]
- Machado, M.V. Nonalcoholic fatty liver disease in lean subjects: Is it all metabolic-associated fatty liver disease? Hepatoma Res. 2020, 6, 84. [Google Scholar] [CrossRef]
- Pietiläinen, K.; Kaye, S.; Karmi, A.; Suojanen, L.; Rissanen, A.; Virtanen, K. Agreement of bioelectrical impedance with dual-energy X-ray absorptiometry and MRI to estimate changes in body fat, skeletal muscle and visceral fat during a 12-month weight loss intervention. Br. J. Nutr. 2013, 109, 1910–1916. [Google Scholar] [CrossRef] [PubMed]
- Xu, Z.; Liu, Y.; Yan, C.; Yang, R.; Xu, L.; Guo, Z.; Yu, A.; Cheng, X.; Ma, L.; Hu, C.; et al. Measurement of visceral fat and abdominal obesity by single-frequency bioelectrical impedance and CT: A cross-sectional study. BMJ Open 2021, 11, e048221. [Google Scholar] [CrossRef] [PubMed]
- Lu, H.-K.; Chen, Y.-Y.; Yeh, C.; Chuang, C.-L.; Chiang, L.-M.; Lai, C.-L.; Casebolt, K.M.; Huang, A.-C.; Lin, W.-L.; Hsieh, K.-C. Discrepancies between leg-to-leg bioelectrical Impedance analysis and computerized tomography in abdominal visceral fat measurement. Sci. Rep. 2017, 7, 9102. [Google Scholar] [CrossRef]
- Chaudry, O.; Grimm, A.; Friedberger, A.; Kemmler, W.; Uder, M.; Jakob, F.; Quick, H.H.; Stengel, S.; Engelke, K. Magnetic Resonance Imaging and Bioelectrical Impedance Analysis to Assess Visceral and Abdominal Adipose Tissue. Obesity 2020, 28, 277–283. [Google Scholar] [CrossRef] [PubMed]
- Lazarus, J.V.; Colombo, M.; Cortez-Pinto, H.; Huang, T.T.; Miller, V.; Ninburg, M.; Schattenberg, J.M.; Seim, L.; Wong, V.W.; Zelber-Sagi, S. NAFLD—Sounding the alarm on a silent epidemic. Nat. Rev. Gastroenterol. Hepatol. 2020, 17, 377–379. [Google Scholar] [CrossRef] [PubMed]
- Wang, H.; Chen, Y.E.; Eitzman, D.T. Imaging Body Fat: Techniques and Cardiometabolic Implications. Arterioscler. Thromb. Vasc. Biol. 2014, 34, 2217–2223. [Google Scholar] [CrossRef]
- Rolfe, E.D.; Sleigh, A.; Finucane, F.M.; Brage, S.; Stolk, R.P.; Cooper, C.; Sharp, S.J.; Wareham, N.J.; Ong, K.K. Ultrasound measurements of visceral and subcutaneous abdominal thickness to predict abdominal adiposity among older men and women. Obesity 2010, 18, 625–631. [Google Scholar] [CrossRef]
- Van Dijk, D.P.; Bakens, M.J.; Coolsen, M.M.; Rensen, S.S.; van Dam, R.M.; Bours, M.J.; Weijenberg, M.P.; Dejong, C.H.; Olde Damink, S.W. Low skeletal muscle radiation attenuation and visceral adiposity are associated with overall survival and surgical site infections in patients with pancreatic cancer. J. Cachexia Sarcopenia Muscle 2017, 8, 317–326. [Google Scholar] [CrossRef]
- Richards, C.H.; Roxburgh, C.S.; MacMillan, M.T.; Isswiasi, S.; Robertson, E.G.; Guthrie, G.K.; Horgan, P.G.; McMillan, D.C. The Relationships between Body Composition and the Systemic Inflammatory Response in Patients with Primary Operable Colorectal Cancer. PLoS ONE 2012, 7, e41883. [Google Scholar] [CrossRef]
- Zhou, Z.; Xiong, Z.; Shen, Y.; Li, Z.; Hu, X.; Hu, D. Magnetic resonance imaging-based body composition is associated with nutritional and inflammatory status: A longitudinal study in patients with Crohn’s disease. Insights Imaging 2021, 12, 178. [Google Scholar] [CrossRef] [PubMed]
- Grąt, K.; Grąt, M.; Rowiński, O. Usefulness of Different Imaging Modalities in Evaluation of Patients with Non-Alcoholic Fatty Liver Disease. Biomedicines 2020, 8, 298. [Google Scholar] [CrossRef]
- Zhang, Y.N.; Fowler, K.J.; Hamilton, G.; Cui, J.Y.; Sy, E.Z.; Balanay, M.; Hooker, J.C.; Szeverenyi, N.; Sirlin, C.B. Liver fat imaging—A clinical overview of ultrasound, CT, and MR imaging. Br. J. Radiol. 2018, 91, 20170959. [Google Scholar] [CrossRef] [PubMed]
- Schwenzer, N.F.; Springer, F.; Schraml, C.; Stefan, N.; Machann, J.; Schick, F. Non-invasive assessment and quantification of liver steatosis by ultrasound, computed tomography and magnetic resonance. J. Hepatol. 2009, 51, 433–445. [Google Scholar] [CrossRef] [PubMed]
- Moher, D.; Liberati, A.; Tetzlaff, J.; Altman, D.G.; PRISMA Group. Preferred reporting items for systematic reviews and meta-analyses: The PRISMA statement. PLoS Med. 2009, 6, e1000097. [Google Scholar] [CrossRef]
- Hong, Q.N.; Fàbregues, S.; Bartlett, G.; Boardman, F.; Cargo, M.; Dagenais, P.; Gagnon, M.-P.; Griffiths, F.; Nicolau, B.; O’Cathain, A.; et al. The Mixed Methods Appraisal Tool (MMAT) version 2018 for information professionals and researchers. Educ. Inf. 2018, 34, 285–291. [Google Scholar] [CrossRef]
- Hong, Q.N.; Pluye, P.; Fàbregues, S.; Bartlett, G.; Boardman, F.; Cargo, M.; Dagenais, P.; Gagnon, M.-P.; Griffiths, F.; Nicolau, B.; et al. Improving the content validity of the mixed methods appraisal tool: A modified e-Delphi study. J. Clin. Epidemiol. 2019, 111, 49–59.E1. [Google Scholar] [CrossRef]
- Bouchi, R.; Takeuchi, T.; Akihisa, M.; Ohara, N.; Nakano, Y.; Nishitani, R.; Murakami, M.; Fukuda, T.; Fujita, M.; Minami, I.; et al. Increased visceral adiposity with normal weight is associated with the prevalence of non-alcoholic fatty liver disease in Japanese patients with type 2 diabetes. J. Diabetes Investig. 2016, 7, 607–614. [Google Scholar] [CrossRef]
- Dâmaso, A.R.; do Prado, W.L.; de Piano, A.; Tock, L.; Caranti, D.A.; Lofrano, M.C.; Carnier, J.; Cristofalo, D.J.M.; Lederman, H.; Tufik, S.; et al. Relationship between nonalcoholic fatty liver disease prevalence and visceral fat in obese adolescents. Dig. Liver Dis. 2008, 40, 132–139. [Google Scholar] [CrossRef]
- Jeong, S.K.; Kim, Y.K.; Park, J.W.; Shin, Y.J.; Kim, D.S. Impact of Visceral Fat on the Metabolic Syndrome and Nonalcoholic Fatty Liver Disease. J. Korean Med. Sci. 2008, 23, 789–795. [Google Scholar] [CrossRef]
- Kim, H.J.; Cho, M.H.; Park, J.S.; Nam, J.S.; Kang, E.S.; Ahn, C.W.; Cha, B.S.; Lee, E.J.; Lim, S.K.; Kim, K.R.; et al. Visceral Fat Thickness Predicts Fatty Liver in Koreans with Type 2 Diabetes Mellitus. J. Korean Med. Sci. 2008, 23, 256–261. [Google Scholar] [CrossRef] [PubMed]
- Ducluzeau, P.-H.; Manchec-Poilblanc, P.; Roullier, V.; Cesbron, E.; Lebigot, J.; Bertrais, S.; Aubé, C. Distribution of abdominal adipose tissue as a predictor of hepatic steatosis assessed by MRI. Clin. Radiol. 2010, 65, 695–700. [Google Scholar] [CrossRef]
- Grotti Clemente, A.P.; Molin Netto, B.D.; di Ganen, A.; Tock, L.; Arisa Caranti, D.; de Mello, M.T.; Tufik, S.; Dâmaso, A.R. Cut-Off Values of Visceral Adiposity to Predict NAFLD in Brazilian Obese Adolescents. J. Nutr. Metab. 2013, 2013, 724781. [Google Scholar] [CrossRef] [PubMed]
- Kim, D.; Chung, G.E.; Kwak, M.-S.; Seo, H.B.; Kang, J.H.; Kim, W.; Kim, Y.J.; Yoon, J.-H.; Lee, H.-s.; Kim, C.Y. Body Fat Distribution and Risk of Incident and Regressed Nonalcoholic Fatty Liver Disease. Clin. Gastroenterol. Hepatol. 2016, 14, 132–138. [Google Scholar] [CrossRef] [PubMed]
- Lee, H.W.; Kim, K.J.; Jung, K.S.; Chon, Y.E.; Huh, J.H.; Park, K.H.; Chung, J.B.; Kim, C.O.; Han, K.H.; Park, J.Y. The relationship between visceral obesity and hepatic steatosis measured by controlled attenuation parameter. PLoS ONE 2017, 12, e0187066. [Google Scholar] [CrossRef]
- Lee, S.; Kuk, J.L. Visceral fat is associated with the racial differences in liver fat between black and white adolescent boys with obesity. Pediatr. Diabetes 2017, 18, 660–663. [Google Scholar] [CrossRef] [PubMed]
- Choi, M.H.; Choi, J.-I.; Park, M.Y.; Rha, S.E.; Oh, S.N.; Jung, S.E.; Byun, J.Y.; Kannengiesser, S.; Son, Y. Validation of intimate correlation between visceral fat and hepatic steatosis: Quantitative measurement techniques using CT for area of fat and MR for hepatic steatosis. Clin. Nutr. 2018, 37, 214–222. [Google Scholar] [CrossRef]
- Kim, D.; Chung, G.E.; Kwak, M.-S.; Kim, Y.J.; Yoon, J.-H. Effect of longitudinal changes of body fat on the incidence and regression of nonalcoholic fatty liver disease. Dig. Liver Dis. 2018, 50, 389–395. [Google Scholar] [CrossRef]
- Simon, T.G.; Van Der Sloot, K.W.J.; Chin, S.B.; Joshi, A.D.; Lochhead, P.; Ananthakrishnan, A.N.; Xavier, R.; Chung, R.T.; Khalili, H. IRGM Gene Variants Modify the Relationship between Visceral Adipose Tissue and NAFLD in Patients with Crohn’s Disease. Inflamm. Bowel Dis. 2018, 24, 2247–2257. [Google Scholar] [CrossRef]
- Kure, T.; Mawatari, S.; Imamura, Y.; Oda, K.; Kumagai, K.; Hiramine, Y.; Miyahara, H.; Kanmura, S.; Moriuchi, A.; Uto, H.; et al. Nonalcoholic fatty liver disease is associated with both subcutaneous and visceral adiposity. Medicine 2019, 98, e17879. [Google Scholar] [CrossRef]
- Zhang, W.; Huang, R.; Wang, Y.; Rao, H.; Wei, L.; Su, G.L.; Lok, A.S. Fat Accumulation, Liver Fibrosis, and Metabolic Abnormalities in Chinese Patients with Moderate/Severe Versus Mild Hepatic Steatosis. Hepatol. Commun. 2019, 3, 1585–1597. [Google Scholar] [CrossRef]
- Hu, L.; Shao, X.; Qiu, C.; Shao, X.; Wang, X.; Niu, R.; Wang, Y. Hepatic steatosis is associated with abnormal hepatic enzymes, visceral adiposity, altered myocardial glucose uptake measured by 18F-FDG PET/CT. BMC Endocr. Disord. 2020, 20, 75. [Google Scholar] [CrossRef] [PubMed]
- Chiyanika, C.; Wong, V.W.; Wong, G.L.; Chan, H.L.; Hui, S.C.N.; Yeung, D.K.W.; Chu, W.C.W. Implications of Abdominal Adipose Tissue Distribution on Nonalcoholic Fatty Liver Disease and Metabolic Syndrome: A Chinese General Population Study. Clin. Transl. Gastroenterol. 2021, 12, e00300. [Google Scholar] [CrossRef] [PubMed]
- Kang, M.K.; Baek, J.H.; Kweon, Y.O.; Tak, W.Y.; Jang, S.Y.; Lee, Y.R.; Hur, K.; Kim, G.; Lee, H.W.; Han, M.H.; et al. Association of Skeletal Muscle and Adipose Tissue Distribution with Histologic Severity of Non-Alcoholic Fatty Liver. Diagnostics 2021, 11, 1061. [Google Scholar] [CrossRef]
- Igarashi, Y.; Tanaka, M.; Okada, H.; Hashimoto, Y.; Kumagai, M.; Yamaoka, M.; Nishimura, H.; Fukui, M. Visceral adipose tissue quality was associated with nonalcoholic fatty liver disease, independent of its quantity. Nutr. Metab. Cardiovasc. Dis. 2022, 32, 973–980. [Google Scholar] [CrossRef]
- Lee, S.; Kim, K.W.; Lee, J.; Park, T.; Koo, K.; Song, G.-W.; Lee, S.-G. Visceral Fat Area Is an Independent Risk Factor for Overweight or Obese Nonalcoholic Fatty Liver Disease in Potential Living Liver Donors. Transplant. Proc. 2022, 54, 702–705. [Google Scholar] [CrossRef] [PubMed]
- Baek, J.; Jung, S.J.; Shim, J.S.; Jeon, Y.W.; Seo, E.; Kim, H.C. Comparison of Computed Tomography-Based Abdominal Adiposity Indexes as Predictors of Non-Alcoholic Fatty Liver Disease among Middle-Aged Korean Men and Women. J. Prev. Med. Public Health 2020, 53, 256–265. [Google Scholar] [CrossRef]
- ROBINS-E Development Group. Risk of Bias in Non-Randomized Studies—Of Exposure (ROBINS-E). Launch Version, 20 June 2023. Available online: https://www.riskofbias.info/welcome/robins-e-tool (accessed on 31 July 2023).
- Hanlon, C.L.; Yuan, L. Nonalcoholic fatty liver disease: The Role of Visceral Adipose Tissue. Clin. Liver Dis. 2022, 19, 106–110. [Google Scholar] [CrossRef]
- Denkmayr, L.; Feldman, A.; Stechemesser, L.; Eder, S.K.; Zandanell, S.; Schranz, M.; Strasser, M.; Huber-Schönauer, U.; Buch, S.; Hampe, J.; et al. Lean Patients with Non-Alcoholic Fatty Liver Disease Have a Severe Histological Phenotype Similar to Obese Patients. J. Clin. Med. 2018, 7, 562. [Google Scholar] [CrossRef]
- Finelli, C.; Tarantino, G. What is the role of adiponectin in obesity related non-alcoholic fatty liver disease? World J. Gastroenterol. 2013, 19, 802–812. [Google Scholar] [CrossRef]
- Chung, G.E.; Kim, D.; Kwark, M.S.; Kim, W.; Yim, J.Y.; Kim, Y.J.; Yoon, J.H. Visceral Adipose Tissue Area as an Independent Risk Factor for Elevated Liver Enzyme in Nonalcoholic Fatty Liver Disease. Medicine 2015, 94, e573. [Google Scholar] [CrossRef]
- Hernández-Conde, M.; Llop, E.; Carrillo, C.F.; Tormo, B.; Abad, J.; Rodriguez, L.; Perelló, C.; Gomez, M.L.; Martínez-Porras, J.L.; Puga, N.F.; et al. Estimation of visceral fat is useful for the diagnosis of significant fibrosis in patients with non-alcoholic fatty liver disease. World J. Gastroenterol. 2020, 26, 6658–6668. [Google Scholar] [CrossRef]
- Miyake, T.; Miyazaki, M.; Yoshida, O.; Kanzaki, S.; Nakaguchi, H.; Nakamura, Y.; Watanabe, T.; Yamamoto, Y.; Koizumi, Y.; Tokumoto, Y.; et al. Relationship between body composition and the histology of non-alcoholic fatty liver disease: A cross-sectional study. BMC Gastroenterol. 2021, 21, 170. [Google Scholar] [CrossRef] [PubMed]
- Cimini, F.A.; Barchetta, I.; Carotti, S.; Bertoccini, L.; Baroni, M.G.; Vespasiani-Gentilucci, U.; Cavallo, M.G.; Morini, S. Relationship between adipose tissue dysfunction, vitamin D deficiency and the pathogenesis of non-alcoholic fatty liver disease. World J. Gastroenterol. 2017, 23, 3407–3417. [Google Scholar] [CrossRef] [PubMed]
- Vaidya, A.; Williams, J.S.; Forman, J.P. The Independent Association Between 25-Hydroxyvitamin D and Adiponectin and Its Relation with BMI in Two Large Cohorts: The NHS and the HPFS. Obesity 2012, 20, 186–191. [Google Scholar] [CrossRef] [PubMed]
- Roffe-Vazquez, D.N.; Huerta-Delgado, A.S.; Castillo, E.C.; Villarreal-Calderón, J.R.; Gonzalez-Gil, A.M.; Enriquez, C.; Garcia-Rivas, G.; Elizondo-Montemayor, L. Correlation of Vitamin D with Inflammatory Cytokines, Atherosclerotic Parameters, and Lifestyle Factors in the Setting of Heart Failure: A 12-Month Follow-Up Study. Int. J. Mol. Sci. 2019, 20, 5811. [Google Scholar] [CrossRef] [PubMed]
- Seo, J.A.; Eun, C.R.; Cho, H.; Lee, S.K.; Yoo, H.J.; Kim, S.G.; Choi, K.M.; Baik, S.H.; Choi, D.S.; Yim, H.J.; et al. Low Vitamin D Status is Associated with Nonalcoholic Fatty Liver Disease Independent of Visceral Obesity in Korean adults. PLoS ONE 2013, 8, e75197. [Google Scholar] [CrossRef]
- Choi, D.H.; Jung, C.H.; Mok, J.O.; Kim, C.H.; Kang, S.K.; Kim, B.Y. Nonalcoholic Fatty Liver Disease and Abdominal Fat Accumulation According to Vitamin D Status in Patients with Type 2 Diabetes. J. Obes. Metab. Syndr. 2018, 27, 53–60. [Google Scholar] [CrossRef]
- Liu, B.; Fan, D.; Yin, F. The Relationship between Vitamin D Status and Visceral Fat Accumulation in Males with Type 2 Diabetes. J. Nutr. Sci. Vitaminol. 2020, 66, 396–401. [Google Scholar] [CrossRef]
- Nauli, A.M.; Matin, S. Why Do Men Accumulate Abdominal Visceral Fat? Front. Physiol. 2019, 10, 1486. [Google Scholar] [CrossRef]
- Jaruvongvanich, V.; Sanguankeo, A.; Riangwiwat, T.; Upala, S. Testosterone, Sex Hormone-Binding Globulin and Nonalcoholic Fatty Liver Disease: A Systematic Review and Meta-Analysis. Ann. Hepatol. 2017, 16, 382–394. [Google Scholar] [CrossRef] [PubMed]
- Palmisano, B.T.; Zhu, L.; Stafford, J.M. Role of Estrogens in the Regulation of Liver Lipid Metabolism. Adv. Exp. Med. Biol. 2017, 1043, 227–256. [Google Scholar] [CrossRef] [PubMed]
- Summart, U.; Thinkhamrop, B.; Chamadol, N.; Khuntikeo, N.; Songthamwat, M.; Kim, C.S. Gender differences in the prevalence of nonalcoholic fatty liver disease in the Northeast of Thailand: A population-based cross-sectional study. F1000Research 2017, 6, 1630. [Google Scholar] [CrossRef]
- Ballestri, S.; Nascimbeni, F.; Baldelli, E.; Marrazzo, A.; Romagnoli, D.; Lonardo, A. NAFLD as a Sexual Dimorphic Disease: Role of Gender and Reproductive Status in the Development and Progression of Nonalcoholic Fatty Liver Disease and Inherent Cardiovascular Risk. Adv. Ther. 2017, 34, 1291–1326. [Google Scholar] [CrossRef] [PubMed]


| Authors (Year) | Journal Title | Aim | Study Design | MMAT Score | n (Males: Females) | Median or Mean Age (Range) | Location |
|---|---|---|---|---|---|---|---|
| Damaso et al. (2008) [29] | Relationship between non-alcoholic fatty liver disease prevalence and visceral fat in obese adolescents | Determine the prevalence of NAFLD in obese adolescents according to visceral adipose tissue quartiles obtained by using an ultrasonography measurement protocol. | N.R. | N.A. | 181 (68:113) | 16.69 ± 1.58 (15–19) | Sao Paulo, Brazil |
| Jeong et al. (2008) [30] | Impact of visceral fat on the metabolic syndrome and non-alcoholic fatty liver disease |
| Cross-sectional | 3 | 224 (78:146) | 43.8 ± 7.2 (30–59) | Jeonbuk, Republic of Korea |
| Kim et al. (2008) [31] | Visceral fat thickness predicts fatty liver in Koreans with type 2 diabetes mellitus | Evaluate whether visceral adiposity is a predictor of diabetic fatty liver in Koreans with type 2 diabetes. | N.R. | N.A. | 1898 (944:954) | 53.7 ± 10.6 to 58.3 ± 9.3 among different subgroups | Seoul, Republic of Korea |
| Ducluzeau et al. (2010) [32] | Distribution of abdominal adipose tissue as a predictor of hepatic steatosis assessed by MRI | Evaluate the relationship between the distribution of VAT and subcutaneous adipose tissue (SAT) and hepatic steatosis using MRI. | N.R. | N.A. | 65 (46:19) | 57 ± 9.5 (N.R.) | Angers, France |
| Grotti Clemente et al. (2013) [33] | Cut-off values of visceral adiposity to predict NAFLD in Brazilian obese adolescents | Determine cut-off points of visceral fat to predict NAFLD and analyze metabolic disorders of obese adolescents in both genders. | Cross-sectional | 4 | 165 (49:116) | N.R. (15–19) | Sao Paulo, Brazil |
| Kim et al. (2016) [34] | Body fat distribution and risk of incident and regressed non-alcoholic fatty liver disease | Evaluate the relationship between body fat distribution and the incidence and regression of NAFLD, adjusting for risk factors for NAFLD in a large population-based cohort. | Large cohort longitudinal prospective | 4 | 2017 (1206:811) | 51.0 ± 8.2 to 53.8 ± 10.0 among different subgroups | Seoul, Republic of Korea |
| Bouchi et al. (2016) [28] | Increased visceral adiposity with normal weight is associated with the prevalence of non-alcoholic fatty liver disease in Japanese patients with type 2 diabetes | Investigate the impact of increased visceral adiposity with normal weight (OB[−]VA[+]) on the prevalence of NAFLD in type 2 diabetic patients. | Cross-sectional | 5 | 140 (78:62) | 65 ± 11 (N.R.) | Tokyo, Japan |
| Lee et al. (2017) [35] | The relationship between visceral obesity and hepatic steatosis measured by controlled attenuation parameter | Evaluate the relationship between controlled attenuation parameters (CAP) and VFA (quantitative indicators of hepatic steatosis and central obesity, respectively), together with other clinical factors. | Prospective | 5 | 304 (165:139) | 56.5 ± 10.7 (N.R.) | Seoul, Republic of Korea |
| Lee and Kuk (2017) [36] | Visceral fat is associated with the racial differences in liver fat between black and white adolescent boys with obesity | Examine whether racial differences in liver fat in obese black versus white adolescents are attributed to differences in total and regional body fat distribution, including visceral fat, or cardiorespiratory fitness (CRF). | N.R. | N.A. | 57 (57:0) | N.R. (12–18) | Pittsburgh, PA, USA |
| Choi et al. (2018) [37] | Validation of intimate correlation between visceral fat and hepatic steatosis: Quantitative measurement techniques using CT for area of fat and MR for hepatic steatosis | Investigate the relationship between degree of fatty infiltration of the liver measured by magnetic resonance spectroscopy (MRS) and body composition measured from CT images. | Retrospective | 3 | 95 (58:37) | 35.9 ± 12.9 (17–69) | Seoul, Republic of Korea |
| Kim et al. (2018) [38] | Effect of longitudinal changes in body fat on the incidence and regression of non-alcoholic fatty liver disease | Evaluate the effects of VAT and SAT on the incidence or regression of NAFLD by adjusting for traditional metabolic risk factors and to investigate the interaction of gender and changes in VAT and SAT on incident NAFLD. | Cohort study | 4 | 956 (606:350) | 51.3 ± 8.2 to 54.4 ± 10.0 among different subgroups | Seoul, Republic of Korea |
| Simon et al. (2018) [39] | IRGM gene variants modify the relationship between visceral adipose tissue and NAFLD in patients with Crohn’s disease | Explore the relationship between VAT volume, previously characterized genetic variants that govern the autophagy pathway, and NAFLD risk in patients with Crohn’s disease. | Cross-sectional | 4 | 462 (216:246) | 40 ± 15 (≥18) | Boston, MA, USA |
| Kure et al. (2019) [40] | Non-alcoholic fatty liver disease is associated with both subcutaneous and visceral adiposity | Clarify the association between the subcutaneous fat area (SFA) as determined by CT and fatty liver as determined by ultrasonography in the Japanese population. | Cross-sectional | 5 | 3197 (1723:1474) | Men: 55.2 ± 11.2 (22–74) Women: 58.6 ± 9.4 (28–74) | Kagoshima, Japan |
| Zhang et al. (2019) [41] | Fat accumulation, liver fibrosis, and metabolic abnormalities in Chinese patients with moderate/severe versus mild hepatic steatosis |
| Prospective | 3 | 160 (73:87) | 46.5 (IQR 35.3–58.0) | Beijing, China |
| Hu et al. (2020) [42] | Hepatic steatosis is associated with abnormal hepatic enzymes, visceral adiposity, altered myocardial glucose uptake measured by 18F-FDG PET/CT | Investigate the association between hepatic steatosis and glucose metabolic abnormality in a variety of organs/tissues assessed by using 18F-FDG PET/CT in a population-based cohort. | Population-based cohort, retrospective | 4 | 191 (129:62) | 48.8 ± 9.0 (N.R.) | Jiangsu, China |
| Chiyanika et al. (2021) [43] | Implications of abdominal adipose tissue distribution on non-alcoholic fatty liver disease and metabolic syndrome: A Chinese general population study | Evaluate the association of abdominal adipose distribution with fatty liver infiltration and MetS development in the lean, overweight, and obese adult populations using a chemical shift-encoded MRI method. | Secondary analysis of a prospective trial | 4 | 625 (238:387) | 48 ± 10 (19–70) | Hong Kong, China |
| Kang et al. (2021) [44] | Association of skeletal muscle and adipose tissue distribution with histologic severity of non-alcoholic fatty liver | Investigate the association between the histologic features, skeletal muscle mass, and adipose tissue distribution using CT scans in patients with NAFLD. | Cross-sectional | 4 | 178 (86:92) | 53.5 (38–64) | Daegu, Republic of Korea |
| Igarashi et al. (2022) [45] | Visceral adipose tissue quality was associated with non-alcoholic fatty liver disease, independent of its quantity | Investigate the association between VAT quantity and quality and the prevalence or incidence of NAFLD in middle-aged Japanese subjects. | Cross-sectional, retrospective cohort | 3 | 627 (349:278) | 45.2 ± 9.4 to 56.3 ± 10.7 (N.R.) | Kyoto, Japan |
| Lee et al. (2022) [46] | Visceral fat area is an independent risk factor for overweight or obese non-alcoholic fatty liver disease in potential living liver donors | Evaluate the correlation between hepatic steatosis, determined by biopsy, and visceral adiposity, measured by CT, in overweight or obese potential living liver donors, and to investigate the risk factors for overweight or obese NAFLD. | Retrospective | 4 | 375 (273:102) | 30.4 ± 9.5 | Seoul, Republic of Korea |
| Baek et al. (2020) [47] | Comparison of computed tomography-based abdominal adiposity indexes as predictors of non-alcoholic fatty liver disease among middle-aged Korean men and women | The associations of three CT-based abdominal NAFLD among middle-aged Korean men and women. | Cross-sectional | 5 | 3846 (1366:2480) | N.R. (30–64) | Seoul, Republic of Korea |
| Authors (Year) | Visceral Fat Measurement Modality | Machine Model and/or Brand | Landmark for Visceral Measurement | Liver Feature Assessment Method | Machine Model and/or Brand |
|---|---|---|---|---|---|
| Damaso et al. (2008) [29] | Ultrasound | 3.5 MHz multifrequency transducer (broad band) | Distance between the internal face of the same muscle and the anterior wall of the aorta. | Ultrasound | 3.5 MHz multifrequency transducer (broad band) |
| Jeong et al. (2008) [30] | Ultrasound | 3.5 MHz convex probe (Sequoia, Siemens Medical Solutions, Mountain View, CA, USA) | Between the posterior aspect of the anterior abdominal wall and the anterior line of the abdominal aorta, at the mid-point between the transverse portion of the duodenum and the iliac bifurcation of the aorta. | Ultrasound | 3.5 MHz convex probe (Sequoia, Siemens Medical Solutions, Mountain View, CA, USA) |
| Kim et al. (2008) [31] | Ultrasound | SA 9900, Medison, Seoul, Republic of Korea | 1 cm above the umbilicus. | Ultrasound | SA 9900, Medison, Seoul, Republic of Korea |
| Ducluzeau et al. (2010) [32] | MRI | 1.5 T clinical MRI system (Excite, GE Healthcare, Milwaukee, WI, USA) | At the level of the 3rd and 4th lumbar vertebra. | MRI | 1.5 T clinical MRI system (Excite, GE Healthcare, Milwaukee, WI, USA) |
| Grotti Clemente et al. (2013) [33] | Ultrasound | 3.5 MHz multifrequency transducer (broad band) | The distance between the internal face of the same muscle and the anterior wall of the aorta. | Ultrasound | 3.5 MHz multifrequency transducer (broad band) |
| Kim et al. (2016) [34] | CT | 16-detector row CT scanner (Somatom Sensation 16, Siemens Medical Solutions, Forchheim, Germany) | N.R. | Ultrasound | Acuson, Sequoia 512, Siemens, Mountain View, CA |
| Bouchi et al. (2016) [28] | CT | Aquilion PRIME, Toshiba Medical Systems, Tochigi, Japan | N.R. | CT | Aquilion PRIME, Toshiba Medical Systems, Tochigi, Japan |
| Lee et al. (2017) [35] | CT | Somatom Plus, Siemens, Germany | At the level of the 2nd and 3rd lumbar vertebra. | Ultrasound, with CAP being assessed with Transient Elastography (TE) | Liver FibroScan® (Echosens, Paris, France) M probe |
| Lee and Kuk (2017) [36] | MRI | 3T MR system (Siemens, Tim Trio, Erlangen, Germany) | At the level of 4th/5th lumbar vertebrae. | MRS | 3T MR system (Siemens, Tim Trio, Erlangen, Germany) |
| Choi et al. (2018) [37] | CT | 64-detector CT (Somatom Sensation 64/Definition AS+, Siemens Healthcare, Erlangen, Germany, or Discovery CT750HD, GE Healthcare, Milwaukee, WI, USA) | At the level of the 3rd lumbar vertebral body transverse processes. | MRS | 3-T system (MAGNETOM Verio, Siemens Healthcare, Erlangen, Germany) |
| Kim et al. (2018) [38] | CT | 16-detector row CT scanner (Somatom Sensation 16, Siemens Medical Solutions, Forchheim, Germany) | The area at the umbilicus level. | Ultrasound | Acuson, Sequoia 512, Siemens, Mountain View, CA, USA |
| Simon et al. (2018) [39] | CT | 64-slice CT scanner (Siemens Medical Solutions, Andover, MA, USA) | From the 11th thoracic vertebra to the 5th sacral vertebra. | CT | 64-slice CT scanner (Siemens Medical Solutions, Andover, MA, USA) |
| Kure et al. (2019) [40] | CT | N.R. | At an umbilical slice. | Ultrasound | N.R. |
| Zhang et al. (2019) [41] | CT | N.R. | At the level of 2nd lumbar vertebrae. | CT | N.R. |
| Hu et al. (2020) [42] | CT | German Siemens Biograph mCT (64) PET/CT instrument | The anterior vertebral body was delineated from the first sacrum up to the abdominal wall muscles and the VAT volumes were divided into 25 consecutive layers with a total length of 125 mm. | CT | German Siemens Biograph mCT (64) PET/CT instrument |
| Chiyanika et al. (2021) [43] | MRI | 3.0 T scanner (Achieva, Philips Medical Systems, Best, the Netherlands) | N.R. | Proton MRS | 3.0 T scanner (Achieva, Philips Medical Systems, Best, the Netherlands) |
| Kang et al. (2021) [44] | CT | N.R. | At the level of 3rd lumbar vertebrae. | Ultrasound-guided percutaneous liver biopsy | N.R. |
| Igarashi et al. (2022) [45] | CT | Activation 16 CT Scanner (Toshiba Medical Systems, Japan) | At the level of 3rd lumbar vertebrae. | Ultrasound | N.R. |
| Lee et al. (2022) [46] | CT | 128-slice multidetector-row CT scanner (Definition AS+ or Edge, Siemens, Erlangen, Germany). | At the level of 3rd lumbar vertebrae. | Ultrasound-guided percutaneous liver biopsy | N.R. |
| Baek et al. (2020) [47] | CT | Aquarius iNtuition Viewer (version 4.4.12; TeraRecon, Foster City, CA, USA) | At the level of the 4th and 5th lumbar vertebrae. | NAFLD liver fat score (NAFLD-LFS) which was developed from MRS | N.R. |
| Authors (Year) | Output Variable (Liver Indicator) of Interest | Statistical Analysis Method | Visceral Quantification | Correlation | Conclusions |
|---|---|---|---|---|---|
| Damaso et al. (2008) [29] | NAFLD |
| Visceral Fat in cm | Only visceral fat remained statistically significant. Every 1 cm increase in visceral fat was associated with an increased risk of 1.97 (95% CI 1.06–3.66, p = 0.03)-fold and 2.08 (95% CI 1.38–3.13, p = 0.0003)-fold in boys and girls, respectively, to develop NAFLD. Positive correlation between visceral fat and steatosis degree was found (r = 0.537). | Visceral fat was a determining factor to increase NAFLD prevalence and steatosis degree. |
| Jeong et al. (2008) [30] | NAFLD | Multivariate logistic regression: to determine the independent association with NAFLD for those independent variables that showed differences of more than borderline significance (p < 0.1). | Visceral fat thickness (VFT) in cm | VFT increased significantly according to the severity of NAFLD in both genders (p < 0.001). After adjustment for all potential confounders, NAFLD was independently and positively associated with VFT (OR 1.10, 95% CI 1.01–1.19, p = 0.015). VFT was independently associated with NAFLD (OR 1.10, 95% CI 1.02–1.19) in subjects with more than two components of the MetS. | VFT was significantly associated with both the severity of hepatic steatosis in NAFLD and the addition of components of the MetS. An increased visceral fat content could be not only biological markers but also therapeutic targets in the treatment of NAFLD and MetS. |
| Kim et al. (2008) [31] | NAFLD | Multiple logistic regression: to evaluate risk factors of fatty liver in male and female type 2 diabetic patients. | Visceral fat thickness (VFT) in mm | High VFT was independently associated with fatty liver in both male and female type 2 diabetic patients. The OR of high VFT for fatty liver showed the highest values (OR 3.14, 95% CI: 2.24–4.39, p = 0.00) and (OR 2.84, 95% CI: 2.04–3.93, p = 0.00) in males and females, respectively. | VFT of all metabolic indices showed the strongest predictive value for fatty liver and that even in centrally non-obese male subjects with a waist circumference < 90 cm but with high visceral fat accumulation, fatty liver is implicated. |
| Ducluzeau et al. (2010) [32] | Hepatic steatosis | Spearman rank correlation: to assess the univariate relationships with steatosis as some variables were not normally distributed. | Visceral adipose tissue (VAT) in cm2 | There was a significant correlation between the percentage of liver steatosis and the abdominal distribution of adipose tissue when calculated with VAT surface (r = 0.307, p = 0.014). | The distribution of adipose tissue is more relevant than total fat mass when assessing the possibility of liver steatosis in overweight subjects. |
| Grotti Clemente et al. (2013) [33] | NAFLD | Logistic regression analysis: to compare individuals with NAFLD as well as individuals with NAFLD and non-NAFLD to determine the predictor variables in the final model. | Visceral Fat in cm. | NAFLD patients had significantly higher values for visceral fat when compared with non-NAFLD obese patients in both genders. In the logistic regression analysis, visceral fat was found to be one of the independent predictors of NAFLD (β-coefficient: 1.606, p = 0.014). In the correlation, visceral-to-subcutaneous ratio has r = 0.771 with non-NAFLD but presented with higher r = 0.790 with NAFLD patients. | Visceral fat cut-off point for the prediction of NAFLD adolescents in both genders was reported. However, the cut-off point cannot be generalized to other populations. |
| Kim et al. (2016) [34] | NAFLD | Cox proportional hazard models: to analyze the HRs and 95% CI for the incident and regressed NADLF per 1-SD increase in VAT and SAT area for each quintile or quartile of VAT and SAT area, while controlling for potential confounders. | Visceral adipose tissue (VAT) in cm2 | In the age-, sex-, and BMI-adjusted models, when the subjects in quintile 5 were compared with those in quintile 1 of the VAT area there was (HR 2.94, 95% CI 1.78–4.86, p < 0.001) for incident NAFLD. After further adjusting for all possible confounding factors including smoking status, diabetes, hypertension, soft drink consumption, physical activity, SAT area, cholesterol, TG, and serum HDL cholesterol levels, the association between the highest and lowest quintile for developing NAFLD was (HR 2.23, 95% CI 1.28–3.89, p = 0.005; HR 1.36, 95% CI 1.16–1.59, per 1-SD, p < 0.001). In the age-, sex-, and BMI-adjusted models, VAT to subcutaneous fat (SAT) ratio has (HR 1.80, 95% CI 1.27–2.57, p = 0.001) for incident NAFLD. After further adjusting for all possible confounding factors including smoking status, diabetes, hypertension, soft drink consumption, physical activity, SAT area, cholesterol, TG, and serum HDL cholesterol levels, the association for VAT/SAT ratio to develop NAFLD was (HR 1.51, 95% CI 1.03–2.19, p = 0.033). | An increased VAT area at baseline independently predicted incident NAFLD in a healthy general population. Visceral obesity was the most important target for future interventions in the treatment of NAFLD. |
| Bouchi et al. (2016) [28] | NAFLD | Linear and logistic regression: to assess the cross-sectional association of each manifestation of VFA and the entire body weight with LAI. | Visceral fat area (VFA) in cm2, where >100 cm2 would means increased visceral adiposity. | NAFLD in this study is defined by liver-spleen attenuation index (LAI) < 0.9. LAI was calculated as follows: the mean attenuation value of eight different sites in the liver (two ROIs each in Couinaud hepatic segments, V, VI, VII and VIII) divided by that of three different sites in the spleen (the upper, middle and lower third of the spleen). The lower the LAI, the greater the lipid accumulation Patients with or without obesity but with high visceral fat remained significant as a risk factor for LAI < 0.9. The OR was found to be 6.79 (95% CI 1.24–36.88, p = 0.027) and 5.88 (95% CI 1.03–33.52, p = 0.046) for patients with and without obesity, respectively. Compared with those with BMI < 23.0 kg/m2 and VFA < 100 cm2, patients with BMI < 23.0 kg/m2 and VFA ≥ 100 cm2 had a significantly increased risk for lower LAI; whereas patients with BMI ≥ 23.0 kg/m2 and VFA < 100 cm2 did not show increased risk for lower LAI. | Increased visceral adiposity with normal weight is a strong predictor for the prevalence of NAFLD in Japanese patients with type 2 diabetes. Moreover, normal BMI patients with high visceral fat present with almost similar risks to those with high BMI patients. |
| Lee et al. (2017) [35] | Significant hepatic steatosis | Univariate and subsequent multivariate binary logistic regression analyses: to identify independent factors related to significant hepatic steatosis. | Visceral fat area (VFA) in cm2. | VFA was identified as an independent risk factor for significant hepatic steatosis (OR 1.010, 95% CI 1.001–1.019, p = 0.028). VFA was the only independent risk factor for significant hepatic steatosis in males (OR 1.008, 95% CI 1.001–1.011, p = 0.045), whereas VFA was one of the independent risk factors for females (OR 1.029, 95% CI 1.010–1.048, p = 0.002). | VFA was significantly correlated with hepatic steatosis measured by CAP and therefore, patients with NAFLD should rely on parameters indicative of central obesity, and not only BMI. |
| Lee and Kuk (2017) [36] | NAFLD | Logistic regression: to assess the simple and independent associations between fatty liver and the body composition factors and CRF adjusting for age and race. | Visceral fat in cm2 | Liver fat was associated with visceral fat r = 0.62, p ≤ 0.05) after adjusting for age and race. Only waist circumference and visceral fat were associated with higher odds of fatty liver (p < 0.05). In a model with age, ethnicity, total body fat, total FFM, visceral fat, ASAT, and CRF, only visceral fat was independently associated with increased odds of having fatty liver (OR 1.12, 95% CI 1.04–1.21, p = 0.003). | Visceral fat was associated with an increased propensity to NAFLD independent of race. It also explained that the racial disparities in liver fat between obese black versus white are in part due to the differences in visceral fat. |
| Choi et al. (2018) [37] | Hepatic steatosis | Pearson’s correlation: to investigate the relationship between hepatic fat amount measured by MRS and various factors associated with body composition. | Visceral fat area (VFA) in cm2. | The highest Pearson correlation coefficient was found between hepatic steatosis and the area of visceral fat for the significant correlation. Overall: r = 0.569, p < 0.001 Male: r = 0.576, p < 0.001 Female: r = 0.473, p = 0.003. | Visceral fat area correlated most highly to hepatic steatosis in males and had the most intimate correlation to hepatic steatosis among all significantly correlated parameters associated with body habitus. |
| Kim et al. (2018) [38] | NAFLD | Cox proportional hazards models: to analyze the adjusted HR and 95% CI for the incident and regressed NAFLD for each tertile of difference in the VAT and SAT area after controlling for potential confounders. | Visceral adipose tissue (VAT) area in cm2. | An increased VAT area was associated with a higher incidence of NAFLD (HR 2.45, 95% CI 1.56–3.85, p < 0.001) after adjusting for VAT and SAT area at baseline. Subjects with a 10% increase in VAT during follow-up had a 15% greater hazard of incident NAFLD (95% CI 1.09–1.22). The addition of longitudinal change in liver enzymes, total cholesterol, TG, and fasting glucose levels to the final model did not significantly reduce the HRs for change in VAT area on incident NAFLD. An increasing change in VAT area was inversely associated with the regression of NAFLD (HR 0.40, 95% CI 0.20–0.80, p = 0.008). | An increase in VAT area over time independently predicted the incident NAFLD. Additionally, temporal decrease in VAT area in patients with NAFLD had a protective effect and led to a regression of NAFLD. |
| Simon et al. (2018) [39] | NAFLD | Logistic regression: to evaluate the relationship between VAT volume and risk of NAFLD. | Visceral adipose tissue (VAT) Volume in cm3 | After adjusting for known NAFLD risk factors and variables associated with inflammatory bowel disease (IBD) severity, VAT quartile (OR 1.37, 95% CI 1.03–1.81, p = 0.012) is one of the factors that remained significantly associated with NAFLD. Increased VAT quartile was associated with a significantly increased risk of radiographic NAFLD (p = 0.032). | Increasing VAT volume was associated with a significantly increased risk of NAFLD and with markers of NAFLD severity in the cohort of Crohn’s disease patients. |
| Severe Steatosis | Although the number of patients was small (n = 13), there was a consistent relationship between increasing VAT quartile and risk of severe steatosis in age- and sex-adjusted analyses (OR 5.08, 95% CI 2.00–12.88, p = 0.0006). | ||||
| Kure et al. (2019) [40] | NAFLD | Logistic regression: to calculate the maximum likelihood of ORs for the risk of fatty liver and 95% CI. | Visceral fat area (VFA) in cm2. | The OR for the association between VFA and NFALD increased across from V-Q1 to V-Q4 for both men and women, even after adjusting for the age, SFA, presence of hypertension, dyslipidemia, and impaired glucose metabolism, and smoking status. OR of NAFLD for different VFA with p-value < 0.001: For men: V-Q1 (10.0–73.8 cm2): OR 1 (reference) V-Q2 (73.8–103.2 cm2): OR 3.51, 95% CI 2.40–5.12 V-Q3 (103.2–139.6 cm2): OR 5.61, 95% CI 3.81–8.27 V-Q4 (139.7–447.8 cm2): OR 8.20, 95% CI 5.38–12.5 For women: V-Q1 (2.7–44.1 cm2): OR 1 (reference) V-Q2 (44.1–67.3 cm2): OR 3.12, 95% CI 1.63–5.97 V-Q3 (67.3–94.2 cm2): OR 10.5, 95% CI 5.58–19.8 V-Q4 (94.2–346.0 cm2): OR 21.6, 95% CI 11.3–41.2. | NAFLD had an independent association with subcutaneous adiposity ab initio, which highlights a possible role of NAFLD in the development of obesity. |
| Zhang et al. (2019) [41] | Mild hepatic steatosis (liver Hounsfield unit (HOUNSFIELD UNIT) > 40) Severe hepatic steatosis (liver HOUNSFIELD UNIT < 40) |
| Visceral fat area (VFA) in cm2. | Hepatic steatosis measured by the liver HOUNSFIELD UNIT showed a moderate correlation with fat in the visceral compartment (r = −0.481, p < 0.001) Compared to patients with mild hepatic steatosis, those with moderate/severe hepatic steatosis had larger VFA and SFA, but after adjustment for BMI, only the ratio of VFA to BMI, but not SFA to BMI, was significantly higher (p = 0.001). Patients with moderate/severe hepatic steatosis also had a higher ratio of VFA to SFA (1.2) than those with mild steatosis (1.0), but this difference was not significant (p = 0.258). | NAFLD patients with moderate/severe steatosis had more visceral and subcutaneous fat as well as more fat infiltration in muscle. They also had more liver damage and a higher prevalence of MetS, which was not limited to patients with abnormal BMI but also those with normal BMI. |
| Hu et al. (2020) [42] | NAFLD |
| Visceral adipose tissue (VAT) volume in mm. | Compared with the non-NAFLD patients, patients with NAFLD had significantly increased abdominal fat, including VAT and SAT, volumes (p < 0.05). Univariate analysis showed that NAFLD had significant positive correlations with BMI, diabetes, insulin resistance, VAT, and SAT volumes, with the correlation coefficient r = 0.154–0.390 (p < 0.05). Logistic regression analyses of these factors showed that increased VAT volume was an independent risk factor for NAFLD (OR 1.002, 95% CI 1.001–1.003, p < 0.05). | Although BMI, abdominal fat volume, and SAT volume were significantly higher in NAFLD patients than in non-NAFLD subjects (p < 0.05), they were not independent correlation factors for NAFLD, suggesting that increased VAT volume was more clinically significant. VAT volume was an independent correlation factor for NAFLD. |
| Chiyanika et al. (2021) [43] | NAFLD |
| Visceral adipose tissue (VAT) in volume (L). | The incidence of fatty liver disease showed an increasing linear trend with an increase in VAT volume (p < 0.001). Fatty liver was increased by 2.53 (95% CI 2.04–3.12)-fold for a 1-SD increase in VAT volume. VAT also showed a significant association with fatty liver disease (r = 0.391, p < 0.001). VAT/SAT ratio also showed a significant association with fatty liver disease (r = 0.342, p < 0.001). Among all the subgroups, lean with fatty liver showed the highest VAT/SAT ratio (0.54) without a significant difference between the lean and obese with NAFLD (p = 0.127). | Regardless of the BMI, increased VAT volume and disproportional distribution of VAT/SAT may be vital drivers to the development of the MetS and NAFLD. |
| Kang et al. (2021) [44] | Hepatic steatosis |
| Visceral adipose tissue (VAT) index, which were defined as the body composition area (cm2) by height squared (m2). | The VAT index was not correlated with hepatic steatosis (rs = 0.13, p = 0.090). | The histologic severity of NAFLD was correlated with visceral adiposity, which was independently associated with advanced fibrosis in patients with NAFLD. |
| Igarashi et al. (2022) [45] | NAFLD |
| Visceral fat area (VFA) index, normalized in height squared (cm2/m2). | The VFA index was independently associated with the prevalence of NAFLD in males (OR 1.04, 95% CI 1.01–1.06, p = 0.0078, per 1.0 cm2/m2) and females (OR 1.11, 95% CI 1.05–1.18, p = 0.0003, per 1.0 cm2/m2), respectively. | VFA index and VFD had an interaction effect on the NAFLD prevalence. High VAT quantity or low VAT quality was independently associated with the prevalence of NAFLD. VAT quality might be more related to the incidence of NAFLD than VAT quantity. |
| Lee et al. (2022) [46] | NAFLD |
| Visceral fat area (VFA) in cm2 | VFA was an independent risk factor for overweight or obese NAFLD in men (OR 1.015, 95% CI 1.008–1.022, p < 0.001) and women (OR 1.029, 95% CI 1.011–1.047, p = 0.002), respectively. | Visceral adiposity was positively correlated with the degree of hepatic steatosis in overweight or obese potential living liver donors. Additionally, visceral adiposity may be an independent risk factor for overweight or obese NAFLD. |
| Hepatic steatosis | In men, the degree of hepatic steatosis was positively correlated with VFA (r = 0.307; p < 0.001). In women, the degree of hepatic steatosis was positively correlated with only VFA (r = 0.387; p < 0.001). | ||||
| Baek et al. (2020) [47] | NAFLD | Logistic regression: to evaluate the associations between the abdominal adiposity indexes and NAFLD. | Visceral fat area (VFA) in cm2. | Pearson’s correlation for VFA/SFA ratio with NAFLD for men and women is r = 0.031 (p < 0.001) and r = 0.162 (p < 0.001), respectively. | Measuring the amount of visceral fat from the abdomen can help in identifying probable NAFLD, with the best predictive indicators in men is VFA while in women is the visceral-to-subcutaneous ratio. |
| OR for each quintile increase in VFA with p < 0.001: For men: VFA Q1: 1.00 (reference) VFA Q2: 2.59 (95% 1.36–4.95) VFA Q3: 4.73 (95% 2.45–9.16) VFA Q4: 6.14 (95% 2.96–12.73). For women: VFA Q1: 1.00 (reference) VFA Q2: 2.99 (95% 1.19–7.51) VFA Q3: 6.65 (95% 2.72–16.23) VFA Q4: 17.84 (95% 7.12–44.71) | |||||
| OR for each quintile increase in VFA/SFA ratio: For men: (p = 0.003) VFA/SFA Q1: 1.00 (reference) VFA/SFA Q2: 1.39 (95% 0.88–2.20) VFA/SFA Q3: 1.91 (95% 1.20–3.03) VFA/SFA Q4: 1.99 (95% 1.22–3.26) For women: (p < 0.001) VFA/SFA Q1: 1.00 (reference) VFA/SFA Q2: 1.39 (95% 0.81–2.38) VFA/SFA Q3: 3.06 (95% 1.83–5.12) VFA/SFA Q4: 6.73 (95% 4.10–11.03) |
| Study | Unit of Measurement | Male | Female | Gender with Higher Association or Correlation |
|---|---|---|---|---|
| NAFLD | ||||
| Damaso et al. (2008) [30] | OR | 1.97 (95% CI 1.06–3.66, p = 0.03) | 2.08 (95% CI 1.38–3.13, p = 0.0003) | Female |
| Kim et al. (2008) [31] | 3.14, (95% CI: 2.24–4.39, p = 0.00) | 2.84 (95% CI: 2.04–3.93, p = 0.00) | Male | |
| Igarashi et al. (2022) [45] | 1.04 (95% CI 1.01–1.06, p = 0.0078) | 1.11 (95% CI 1.05–1.18, p = 0.0003) | Female | |
| Lee at al. (2022) [46] | 1.015 (95% CI 1.008–1.022, p < 0.001) | 1.029 (95%CI 1.011–1.047, p = 0.002) | Female | |
| Risk of NAFLD measured between largest visceral fat area group and reference group | ||||
| Kure et al. (2019) [40] | OR | 8.20 (95% CI 5.38–12.5, p < 0.001) | 21.6 (95% CI 11.3–41.2, p < 0.001) | Female |
| Baek et al. (2020) [47] | 6.14 (95% CI 2.96–12.73, p < 0.001) | 17.84 (95% CI 7.12–44.71, p < 0.001) | Female | |
| Hepatic Steatosis (Mild and Severe/Significant) | ||||
| Lee et al. (2017) [35] | OR | 1.008 (95% CI 1.001–1.011, p = 0.045) | 1.029 (95% CI, 1.010–1.048, p = 0.002) | Female |
| Choi et al. (2018) [37] | Correlation | r = 0.576, p < 0.001 | r = 0.473, p = 0.003 | Male |
| Lee et al. (2022) [46] | r = 0.307; p < 0.001 | r = 0.387; p < 0.001 | Female | |
Disclaimer/Publisher’s Note: The statements, opinions and data contained in all publications are solely those of the individual author(s) and contributor(s) and not of MDPI and/or the editor(s). MDPI and/or the editor(s) disclaim responsibility for any injury to people or property resulting from any ideas, methods, instructions or products referred to in the content. |
© 2023 by the authors. Licensee MDPI, Basel, Switzerland. This article is an open access article distributed under the terms and conditions of the Creative Commons Attribution (CC BY) license (https://creativecommons.org/licenses/by/4.0/).
Share and Cite
Seaw, K.M.; Henry, C.J.; Bi, X. Relationship between Non-Alcoholic Fatty Liver Disease and Visceral Fat Measured by Imaging-Based Body Composition Analysis: A Systematic Review. Livers 2023, 3, 463-493. https://doi.org/10.3390/livers3030033
Seaw KM, Henry CJ, Bi X. Relationship between Non-Alcoholic Fatty Liver Disease and Visceral Fat Measured by Imaging-Based Body Composition Analysis: A Systematic Review. Livers. 2023; 3(3):463-493. https://doi.org/10.3390/livers3030033
Chicago/Turabian StyleSeaw, Ker Ming, Christiani Jeyakumar Henry, and Xinyan Bi. 2023. "Relationship between Non-Alcoholic Fatty Liver Disease and Visceral Fat Measured by Imaging-Based Body Composition Analysis: A Systematic Review" Livers 3, no. 3: 463-493. https://doi.org/10.3390/livers3030033
APA StyleSeaw, K. M., Henry, C. J., & Bi, X. (2023). Relationship between Non-Alcoholic Fatty Liver Disease and Visceral Fat Measured by Imaging-Based Body Composition Analysis: A Systematic Review. Livers, 3(3), 463-493. https://doi.org/10.3390/livers3030033