Article

Understanding the Liver’s Role in the Clearance of Aβ40

by
Glen P. Lockwood
1,2,
Nicholas J. Hunt
1,2,
Maaike Kockx
2,3,
Sun Woo Sophie Kang
1,2,4,
David G. Le Couteur
1,2 and
Victoria C. Cogger
1,2,*
1
ANZAC Research Institute, Centre for Education and Research on Aging, Sydney Local Health District, Concord 2139, Australia
2
Faculty of Medicine and Health, The University of Sydney, Sydney 2006, Australia
3
Atherosclerosis Laboratory, ANZAC Research Institute, Sydney Local Health District, Concord 2139, Australia
4
Cell Biology and Imaging Section, Thoracic and Gastrointestinal Oncology Branch, National Cancer Institute, National Institutes of Health, Bethesda, MD 20892, USA
*
Author to whom correspondence should be addressed.
Livers 2024, 4(2), 253-267; https://doi.org/10.3390/livers4020018
Submission received: 27 February 2024 / Revised: 11 April 2024 / Accepted: 14 May 2024 / Published: 23 May 2024

Abstract

:
The clearance of peripheral beta amyloid (Aβ) is a potential target for the treatment of Alzheimer’s disease (AD). The liver has been implicated in the elimination of Aβ from the peripheral circulation. Here, the single-pass uptake of Aβ40 in perfused livers from young and old rats (6 to 10 rats per group) was investigated with the multiple indicator dilution technique. Aβ40 had volumes of distribution between those of the vascular marker Evans Blue and the extracellular marker sucrose. The hepatic extraction of Aβ40 was negligible, explained in part by the small permeability surface area products consistent with a high endothelial barrier to liver uptake. There were no substantial effects of age on any of these results. In vitro experiments with isolated hepatocytes and liver sinusoidal endothelial cells showed only very small amounts of Aβ uptake consistent with low intrinsic clearance. These results indicate that the hepatic clearance of Aβ is capacity-limited, explained by the low-permeability surface area products and hepatocyte uptake. However, this does not preclude an effect of aging in longer-term in vivo studies where age-related changes in liver blood flow and protein binding influence liver clearance.

1. Introduction

The liver, initially thought to be largely unaffected by aging, has more recently been found to be profoundly changed by the aging process. These changes are broad, including epigenetic instability, mitochondrial stress, and cellular senescence [1]. Aging is strongly associated with an increased risk of developing Alzheimer’s disease (AD) [2]. Currently, available treatments for AD are cholinesterase inhibitors, memantine and two recently approved anti-amyloid antibodies, aducanumab [3] and lecanemab [4], which have shown limited benefits in slowing disease progression [5]. The amyloid cascade hypothesis proposes that brain beta amyloid (Aβ) accumulation (particularly in the form of oligomers) is neurotoxic, and treatments that remove Aβ from the brain may reverse the disease [6].
Aβ is a peptide whose normal function is still unclear, although low levels of Aβ are thought to contribute towards maintaining normal brain function [7]. There are two main forms of Aβ: Aβ40 and Aβ42. The clearance of Aβ40 and Aβ42 from the brain and systemically has been proposed to be similar: they are both cleared from the brain across the blood–brain barrier by low-density lipoprotein receptor-related protein-1 (LRP-1) and then eliminated into the bile by the liver by LRP-1 [8]. This clearance has been demonstrated to be a relatively fast process where Aβ40 and Aβ42, after being removed from the brain, are then rapidly eliminated from the peripheral circulation with a half-life of 2–3 min [9,10]. In familial AD, the upregulation of several genes that cause the overproduction of Aβ have been identified [11]. In late onset, sporadic AD, it has been proposed that the production of Aβ is normal, while Aβ clearance is reduced [12]. It is this reduction in clearance that has been hypothesized to cause Aβ to accumulate and aggregate, eventually leading to neuronal death [13].
Enhancing the systemic clearance of Aβ reduces brain levels [14] and has been promoted as a therapeutic target for dementia and AD [15]. It has been proposed that the hepatic clearance of Aβ acts as a ‘sink’ that induces Aβ efflux from the brain [9,16]. Previous research links the liver to Aβ clearance including studies demonstrating that more than 50% of peripherally injected radioactively labelled Aβ40 was detected in the liver after 2 h [9]. This study also found 90% of radiation found in the liver, 10 min after a peripheral injection of 125I-Aβ40, could be localized in hepatocytes when cell types were separated. Further studies investigating the hepatocyte receptor and fragments of Aβ demonstrated LRP-1 as the hepatocyte receptor involved in its uptake [17]. Another study used sandwich cultures of hepatocytes to look at their interaction with Aβ40 in a system that modeled biliary excretion [18]. This study found that in this model, intact Aβ40 was excreted into bile ducts at a steady state, 30 min after exposure. A recent study found that 9% of Aβ40 was removed from the circulation per pass of the liver and suggested that aging reduced Aβ40 clearance [19].
Previously, it has been shown that structural changes in the liver vasculature occur in old age and that these can contribute to a significant impairment of hepatic function. These profound pathological changes were first observed in the context of liver-related conditions and diseases [20]. A reduction in fenestrations was observed during exposure to toxins [21], oxidative stress [22] and fibrosis [23]. Age-related sinusoidal changes have been termed “pseudocapillarization” [24]. We have reported that these changes lead to a reduction in the uptake and clearance of a number of substrates including small chylomicrons [25], medications [26,27,28] and, more recently, insulin [14], which is similar in size to Aβ40 (51 amino acids for insulin vs. 40 amino acids for Aβ40). There is only one publication which has reported the effects of aging on the hepatic clearance of Aβ; Mohamed et al. compared young and old rats (4 vs. 24 months) and found that the hepatic extraction of Aβ was reduced by 44% [10].
Here, we proposed to determine whether the hepatic metabolism of Aβ was facilitated by its transfer from blood to hepatocytes. This was investigated by establishing the direct first-pass metabolism of Aβ40 using MID methodology. We hypothesized that pseudocapillarization could contribute to an age-related impairment of the hepatic clearance of Aβ. Therapies that reverse or prevent age-related liver changes could potentially increase the efflux of Aβ from the brain and thus generate a new target for the treatment and/or prevention of AD. However, in contrast to previous studies, we observed that Aβ (when given as 3H-Aβ40 or Aβ40 alone), directly injected into the portal vein, was not taken up by the liver during first-pass metabolism. This absence of the liver extraction of Aβ40 was also observed in aged rats.

2. Materials and Methods

2.1. Animals

Young adult male (aged 8 to 9 weeks old, weighing 185 to 225 g) and old adult male (aged 74 to 89 weeks, weighing 350 to 466 g) Fisher 344 rats and adult male C57BL/6J mice (aged 20 to 87 weeks) were obtained from the Animal Research Centre in Perth, Western Australia. All animals were housed at the ANZAC Research Institute animal house on a 12 h light/dark cycle and provided with ad libitum access to a standard chow mouse diet, water, and enrichment. This study was approved by the Sydney Local Health District Animal Welfare Committee (AWC # 2019/010B).

2.2. Materials

3H-Aβ40 (ART2266, 0.1 mCi/mL) was obtained from American Radiolabeled Chemicals (St. Louis, MO, USA) and 14C-sucrose (S9934, 0.1 mCi/mL), 3H-H2O (W2885, 1 mCi/mL), 3H-oleic acid (O1508, 1 mCi/mL) and bovine serum albumin (BSA A7906) were obtained from Merck (Sydney, Australia). Unlabelled human Aβ1–40 (AS24236) was obtained from ANASPEC (Fremont, CA, USA) and was reconstituted and stored following the manufacturer’s guidelines to minimize aggregation. Carbanox gas (95% O2–5% CO2) was obtained from Coregas (Sydney, Australia). Evans Blue (10 mg/mL) was obtained from APS (Crown Scientific, Sydney, Australia). Purified anti-β-amyloid, 1–16 antibody (clone 6E10—cat. no. 803004) was obtained from BioLegend (San Diego, CA, USA). Other materials used for cell extractions included type 1 collagenase (Worthington, OH, USA cat. number LS004197) and the following items from Merck (Sydney, Australia): Roswell Park Memorial Institute 1640 medium (RPMI-1640), Dulbecco’s modified Eagle medium (DMEM), foetal calf serum (FCS), penicillin–streptomycin and Triton-X. Items used for cell staining included Fab mouse IgG and Fab anti-mouse labelled with Alexa 488 (cat. no. 115-007-003 and 115-547-003, Jackson, West Grove, PA, USA), Hoechst 33324 (cat. number 14533, Merck, Sydney, Australia) and 4% paraformaldehyde (ProSciTech, Kirwin, QLD, Australia). Materials used for Western blotting included Novex 16% tricine gels and iBlot polyvinylidene fluoride (PVDF) transfer stacks (Thermo Fisher Scientific, Melbourne, Australia), along with a peroxidase-conjugated donkey anti-mouse IgG secondary antibody from Jackson ImmunoResearch (cat. no. 711-035-152, West Grove, PA, USA) and mouse anti-α tubulin (T5168) from Merck (Sydney, Australia).

2.3. Multiple Indicator Dilution Method

The MID method was used to characterize the disposition of tritium labelled Aβ40 in the liver, based on the methods of Goresky [29]. Liver perfusion and MID experiments were performed as described previously [25]. In brief, F344 rats were anesthetized with an intraperitoneal injection of ketamine (75 mg/kg) and xylazine (10 mg/kg). The abdomen was opened with a midline incision. The portal vein was cannulated with an 18 G intravenous catheter (Livingstone International, Sydney, Australia), and the thoracic portion of the inferior vena cava (IVC) was canulated with a 10 cm length of PE200 tubing (Becton Dickinson, Sydney Australia). The liver was perfused in situ with Krebs–Henseleit bicarbonate buffer, containing 2% BSA that was oxygenated with Carbanox gas at 37 °C for 10 min prior to and during the experimentation. The perfusate was delivered by a Masterflex L/S Economy drive pump (Cole Parmer, Vernon Hills, IL, USA) in a single-pass mode at 1–1.5 mL/min/g of liver. Liver viability was assessed by macroscopic appearance.
The injectate used in this study contained 14C-sucrose (0.2 µCi), 3H-Aβ40 (0.2 µCi), and Evans Blue (20 µL) made up to a total of 100 µL volume with Krebs–Henseleit bicarbonate buffer containing 2% BSA. 14C-sucrose and Evans Blue were the non-extracted markers of the extracellular and vascular spaces, respectively [30]. The injectate was administered as a bolus injection into the portal vein catheter. Outflow samples were immediately collected using a fraction collector (LKB Bromma 2212 Helirac Fraction Collector, Vienna, Austria) every 2 s for a total of 60 s. Outflow samples were analysed for the absorbance of Evans Blue at 620 nm (FLUOstar Optima; Melbourne, Australia), and 10 µL of each sample was placed into scintillation fluid (Ultima Gold 2X, cat. no. 6013329, Perkin Elmer, Sydney, Australia) to measure 14C- and 3H-specific radioactivity counts (Tri-Carb T4910TR liquid scintillation analyser; Perkin Elmer, Sydney, Australia).

2.4. Molecular Kinetic Modelling

The outflow radioactivity or absorbance for each marker was calculated as a proportion of the injected activity per millilitre. This information was used to produce dose-normalized outflow time activity curves. The area under the curve (AUC) and the area under the moment of the curve (AUMC) were then determined. Because the outflow was collected for the entire time period and not at discreet time points, the AUMC and AUC were calculated using the rectangular rule [31]. Their ratio was further used to calculate the mean transit time (MTT). The MTT calculation used the estimated time of activity above background levels as a correction for the catheter and non-hepatic vessel transit time (t0). The AUC and flow (Q) were used to estimate recovery. Then, the flow rate (Q, mL/s) and the corrected MTT were used to calculate the apparent volume of distribution for Aβ40, sucrose, and Evans Blue.

2.5. Crone–Renkin Early Extraction

The permeability surface-area product (PS) was determined by further analysis of the outflow curves for Aβ40 across LSECs using the early extraction method of Crone–Renkin [32,33]. The analysis model assumes that at early time points, the deviation of the outflow curves of the diffusible indicator (Aβ40) from that of the vascular marker (Evans Blue) is due to the unidirectional transfer of the substrate into the liver [34]. This transfer was defined as the early extraction (E) ratio and was calculated by the following formula:
E = C E B C A β 40 C E B ,
where CEB is the fractional outflow concentration of Evans Blue and CAβ40 is the fraction outflow concentration of Aβ40 at each time point.
The early extraction (E) ratio of Aβ40 from the plateau of the extraction–time curve was used to calculate the PS product (mL/s/g) for the transfer of Aβ40 across the LSEC using the equation:
P S = Q · L n 1 E ,
where Q is the flow rate of the perfusate.

2.6. Hepatocyte and LSEC Isolation

The isolation of hepatocytes and liver sinusoidal endothelial cells (LSECs) have been previously reported in our method paper and other previous studies [35,36]. In brief, C57BL/6J mice were anesthetized with a mixture of 10 mg/kg xylazine and 100 mg/kg ketamine. The liver was then cannulated via the portal vein and perfused with buffer solution for 5 min at 7 mL/min, followed by collagenase solution for 7 min at 7 mL/min in situ. The liver was removed, and dissociated cells were filtered through a 70 µm cell strainer and collected. Hepatocytes were isolated by three 3 min centrifugations at 50×g. Non-viable hepatocytes were removed by collecting the cell pellet under 50% Percoll solution after 5 min of centrifugation at 50× g. LSECs were collected from the initial hepatocyte isolation supernatant. They were then purified by collecting cells between the layers of two-step Percoll gradient (25%, 45%) after centrifugation at 1350× g for 30 min. Kupffer cells were removed from the LSEC fraction by selective adherence to plastic using two 8 min incubations at 37 °C in RPMI-1640 media. LSECs were cultivated in serum-free RPMI-1640 media at 1.3 × 10⁵ cells/cm2 on fibronectin-coated 24-well tissue culture plates for 4 h at 37 °C prior to experimentation. Hepatocytes were cultivated in DMEM media with 10% FCS and penicillin/streptomycin added at 0.5 × 10⁵ cells/cm2 on rat tail collagen 1-coated 24-well tissue culture plates for 24 h at 37 °C prior to experimentation.

2.7. Hepatocyte Uptake of Radiolabelled Substances

Plated primary hepatocytes were treated with DMEM media containing 3H-Aβ40 and 14C-sucrose (5 min) or 3H-H2O (30 min) or 3H-oleic acid (30 min) in duplicate. A second set of plated primary hepatocytes were starved of FCS for 4 h by incubating in DMEM without FCS to maximize hepatocyte uptake before receiving identical treatments. Immediately after treatment, the media were removed and placed into scintillation fluid. Cells were then washed in DPBS, lysed with DMEM containing 0.2% Triton-X, scraped with a 1 mL pipette tip to remove them from the plate surface and placed into 5 mL of scintillation fluid. Media and cell samples were analysed for 14C- and 3H-specific activity (Tri-Carb T4910TR liquid scintillation analyser; Perkin Elmer, Sydney, Australia).

2.8. Liver Sinusoidal Endothelial Cell Uptake of Radiolabelled Substances

Plated primary LSEC were treated with RPMI-1640 media containing 3H-Aβ40 and 14C-sucrose (5 min) or 3H-H2O (30 min) or 3H-oleic acid (30 min) in duplicate. Immediately after treatment, the media were removed and placed into scintillation fluid. Cells were then washed in DPBS, lysed with RPMI-1640 containing 0.2% Triton-X, scraped with a 1 mL pipette tip to remove them from the plate surface and placed into 5 mL of scintillation fluid. Media and cell samples were analysed for 14C- and 3H-specific activity (Tri-Carb T4910TR liquid scintillation analyser; Perkin Elmer, Sydney, Australia).

2.9. Liver Uptake of Aβ40 via Direct Injection
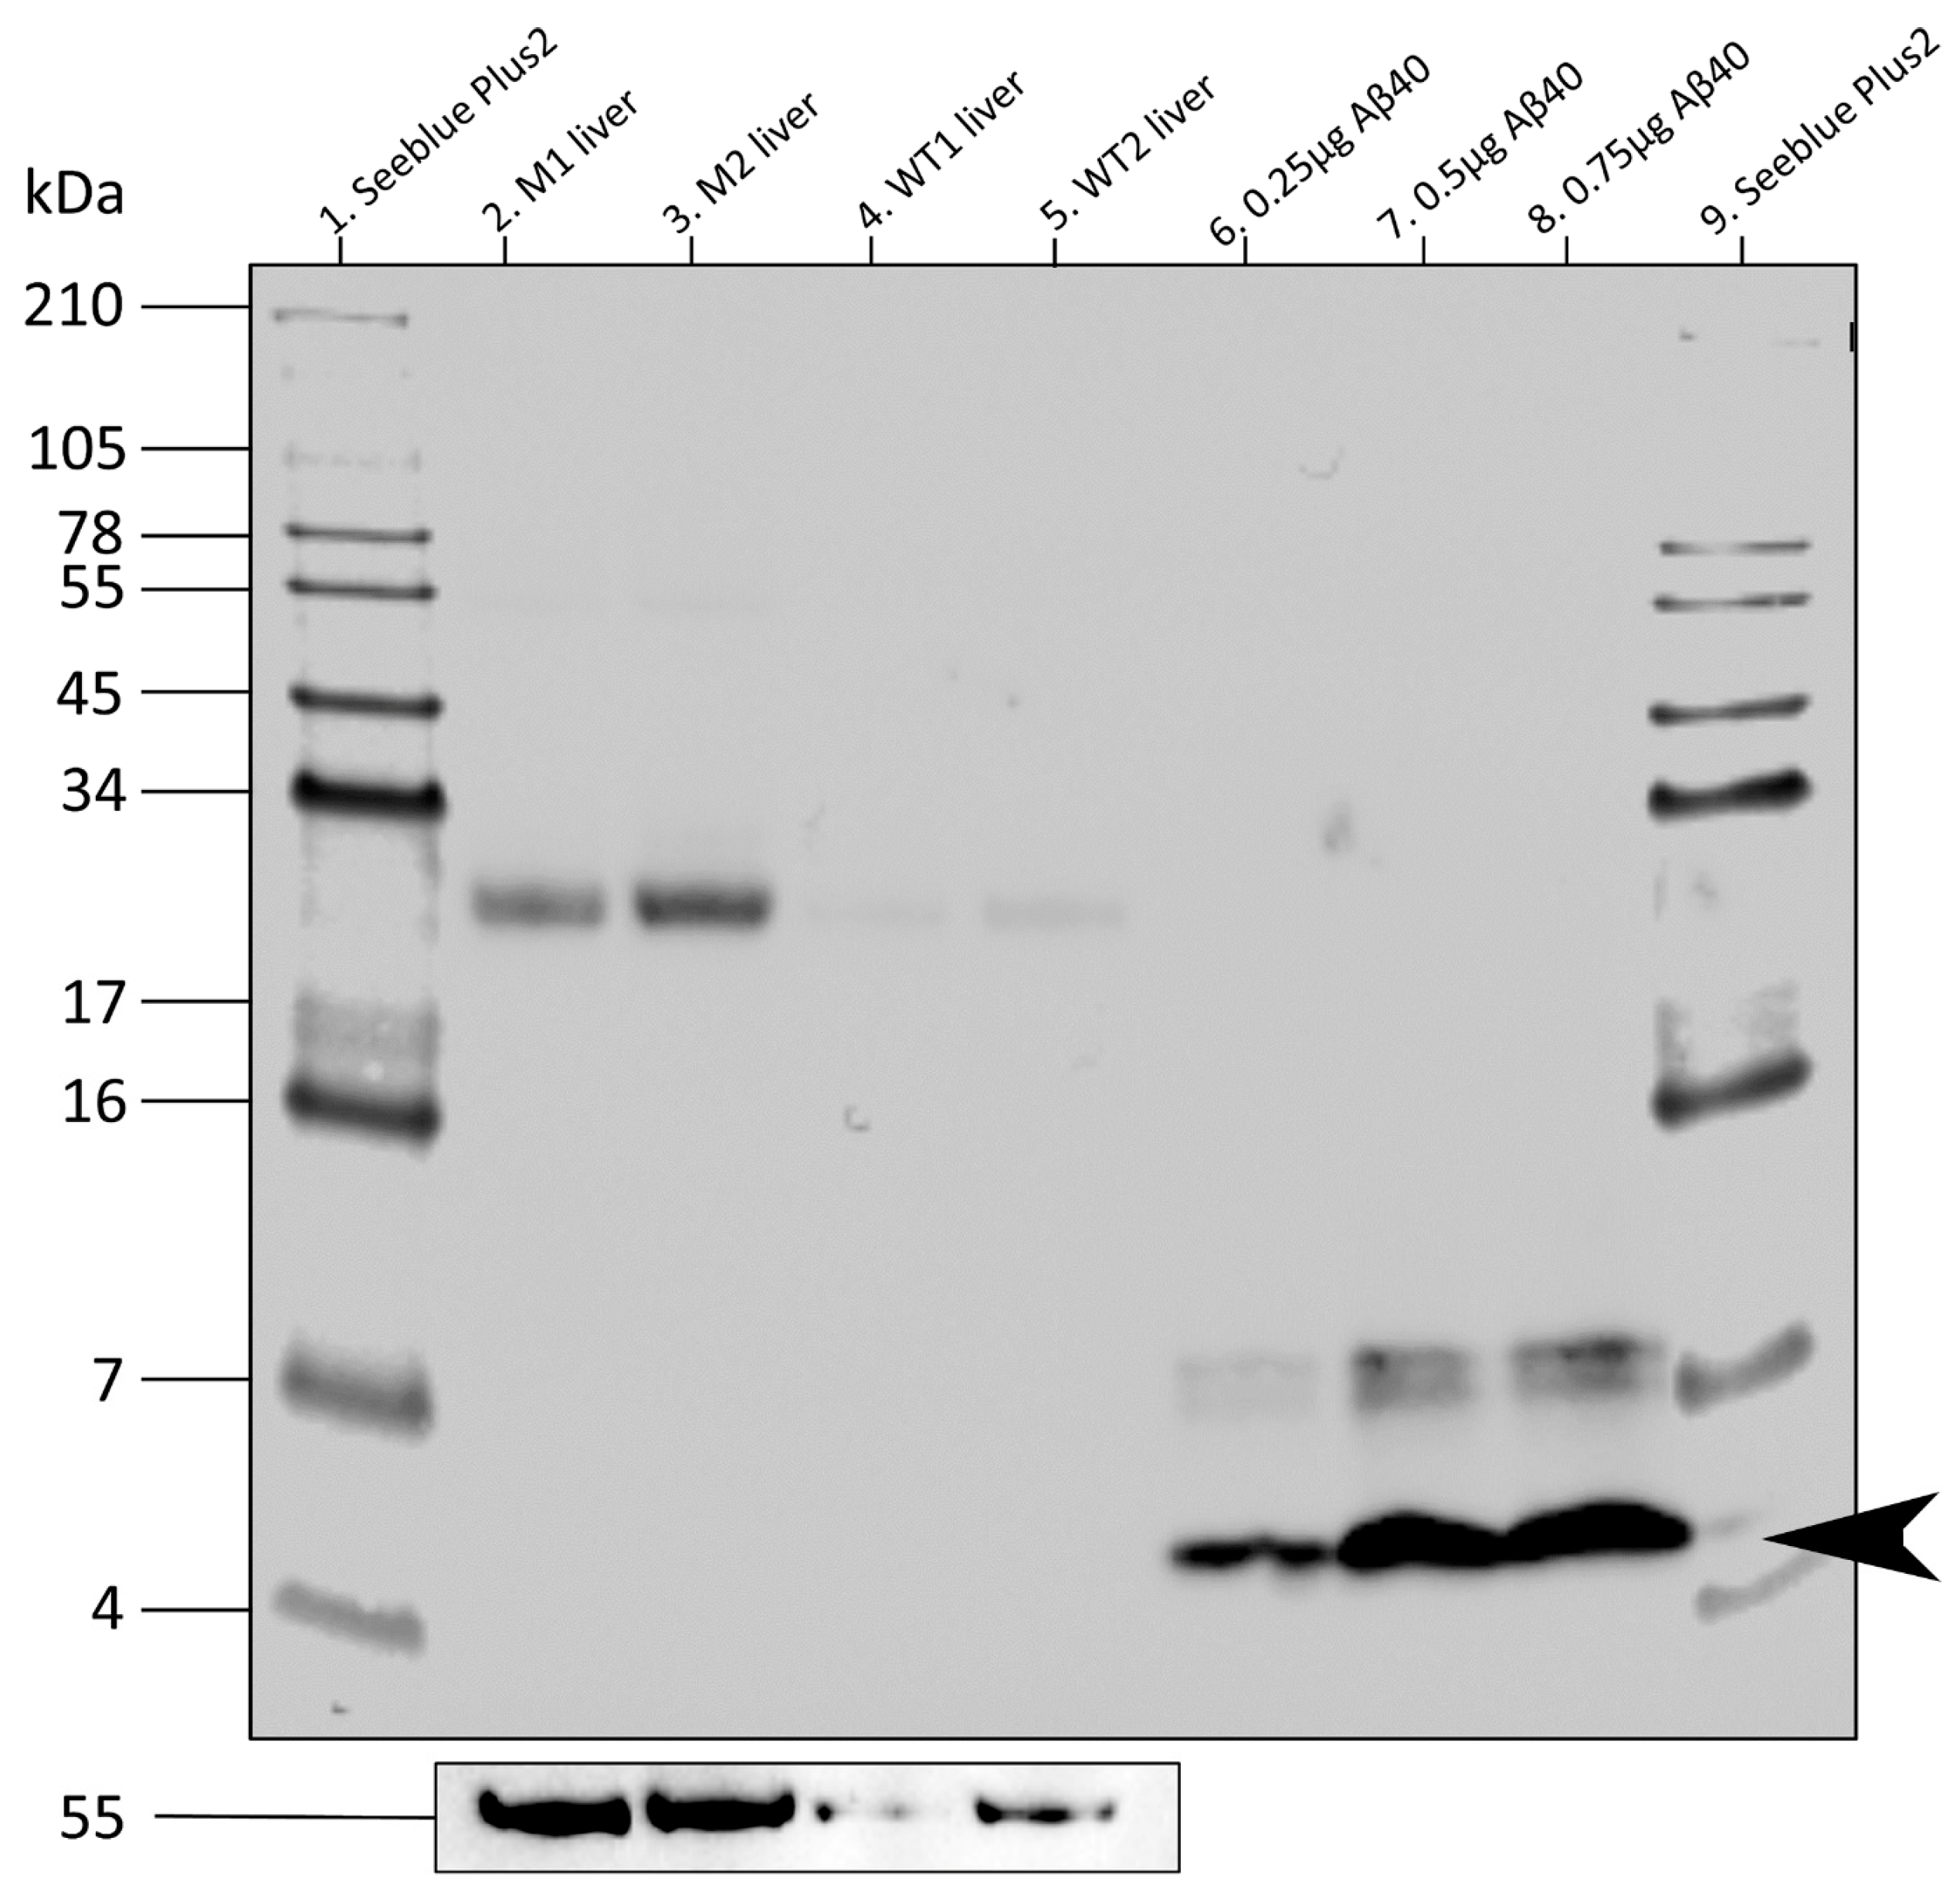
C57BL/6J mice were anesthetized with a mixture of 10 mg/kg xylazine and 100 mg/kg ketamine. The mouse was then opened via a midline incision and both the liver and IVC exposed. Sutures were then loosely placed around the hepatic artery, portal veins and hepatic veins. Then, 45 µg of unlabelled Aβ40 in a volume of 180 µL 1% NH4OH was injected directly into the IVC. Thirty seconds later, the circulation into and out of the liver was blocked by tying the previously placed sutures. Portions of the liver were snap frozen in liquid nitrogen for the subsequent total protein extraction and Western blotting to detect liver Aβ40 uptake.

2.10. Western Blots

Western blots were performed on the total protein extracted from livers of mice injected with Aβ40 via an IVC injection and untreated C57BL/6J liver tissue, along with raw samples of 3H-Aβ40 and unlabelled Aβ40 standard. Liver tissue was lysed using a polytron homogenizer (PT1200E, Kinematica, Malters, Switzerland) with total protein extracted as previously described [37]. Moreover, 20 µg of extracted protein was loaded onto 16% tricine gels and electrophoresed for 110 min at 120 V to enable the separation of monomeric Aβ protein (4 kDa). After a 7 min rapid transfer to a PVDF membrane, the membrane was blocked in skim milk for 1 h and then incubated overnight at 4 °C with a primary antibody to human Aβ1−16 (BioLegend). This was followed by incubation with an anti-mouse secondary antibody for 1 h and membrane development using ECL-Plus chemiluminescence detection solution. The membrane was subsequently re-stained with an anti-α-tubulin antibody (Sigma) to visualize differences in protein loading. Images of the PVDF membrane were recorded using a ChemiDoc MP (Bio-Rad, Hercules, CA, USA).

2.11. Immunofluorescent Staining of Primary Hepatocyte Aβ40 Uptake

Primary C57BL/6J mouse hepatocytes (extracted as previously described) in DMEM with 10% FCS and penicillin/streptomycin were plated onto 2-well coverslip chamber slides for 24 h and then treated with DMEM media containing 44 µg per well of unlabelled Aβ40 at 4 °C for 2 h. Cells were subsequently fixed in 4% paraformaldehyde for 20 min and, after blocking using a Fab antibody system, stained with 1:1000 6E10 anti-β-amyloid (BioLegend) overnight at 4 °C. Then a secondary antibody Fab goat anti-mouse conjugated to Alexa 488 (Jackson) at a dilution of 1:500 was used to visualize Aβ40. Finally, Hoechst 3342 (1:500) was used as a nuclear counterstain. Stained slides were examined and images captured on a Leica SP8 confocal microscope (Leica Microsystems, Sydney, Australia).

2.12. Whole Body Uptake of 3H-Aβ40 in Mice

Unattached tritium was removed by diluting 50 µL of 3H-Aβ40 in 450 µL of d.H2O and placing it into 3.5 k snakeskin dialysis tubing (Thermo Fisher Scientific, Melbourne, Australia). This was dialysed in 500 mL of d.H2O with water changes at 2 h, then a further 4 h, and then finally after a further 12 h. Moreover, 500 µL of dialysis water was tested in 5 mL in scintillation fluid (Ultima Gold 2X, cat. no. 6013329, Perkin Elmer, Sydney Australia) to determine that unattached radiation was being progressively removed.
Furthermore, 3 male C57Bl6 mice were each injected via the tail vein with 100 µL of dialysed 3H-Aβ40. Moreover, 10 µL of 3H-Aβ40 was also placed into 5 mL of scintillation fluid at the same time as each injection to determine the total amount of radiation injected. Additionally, 10 µL of blood was collected via a tail snip at 5 and 15 min after each injection and placed into 10 mL of scintillation fluid. After 30 min, blood was collected from each mouse via cardiac puncture along with weighed samples of liver, kidney, spleen, lung, peritoneal fat, left quadricep, tail (injection site), small bowel, colon, the 1st pellet of faeces from the colon, bladder, and brain. Tissue samples were placed in 1 mL of Solvable (Perkin Elmer, Sydney, Australia) and incubated in shaker for 4 h at 60 °C. Then, 200 µL or 400 µL of hydrogen peroxide from Merck (cat. no. 18312, Bayswater, Australia) was added. Samples were then left to settle at room temperature for 1 h. Then, 10 mL of scintillation fluid was added, and each sample was analysed for 3H-specific radioactivity counts by a Tri-Carb T4910TR liquid scintillation analyser (Perkin Elmer, Sydney, Australia). Tritium counts were normalised to control counts from matched samples of untreated mice.

3. Results

Representative dose-normalized outflow curves of young and old rats for MID experiments with Aβ40 are shown in Figure 1A and Figure 1B, respectively. In both graphs, the sucrose curve is slightly shifted to the right of the Evans Blue curve, indicating a slower transit of sucrose through the liver due to its distribution into the extravascular space. Evans Blue distributes into a relatively smaller liver volume, consistent with the albumin space. This is confirmed by the faster transit through the liver shown by its dose outflow curve. The curves for Aβ40 are delayed compared to Evans Blue, indicating that it enters the extravascular space to a greater degree than Evans Blue, although the positioning of the curve to the left of the sucrose curve indicates Aβ40 does not enter the extravascular space to the same degree as sucrose. The AUC of Aβ40 was not significantly different to those of sucrose or Evans Blue, indicating that it was not extracted by the liver during these single-pass procedures. This was the same in both young and old rats; therefore, no change in the liver extraction of Aβ40 due to aging could be identified. This does not in any way exclude the presence of other well-established aging changes between the experimental groups.
The recoveries of Aβ40, sucrose and Evans Blue are shown in Table 1. The recovery of Aβ40 was significantly lower in old rats compared with young rats (0.99 ± 0.03, young; 0.86 ± 0.08 old, p < 0.005). However, as the recoveries of sucrose and Evans Blue were similarly reduced, the ratio of recovery for Aβ40 to sucrose and Aβ40 to Evans Blue were not significantly different between young and old rats. The volumes of distribution of Aβ40, sucrose and Evans Blue are shown in Table 2. The volume of distribution for sucrose, Evans Blue, and Aβ40 was unchanged between the age groups.
Also shown in Table 2 are the results of the Crone–Renkin analysis to determine the permeability surface-area products for Aβ40. These values were low, consistent with a substantial barrier to uptake and not influenced by age.
To further investigate the uptake of Aβ by cells of the liver, primary mouse hepatocytes and primary mouse LSECs were incubated with 3H-Aβ40, 14C-sucrose, 3H-H2O and 3H-oleic acid and the uptake of these molecules measured (Figure 2). A subset of hepatocytes was grown in serum-free media for 4 h prior to experimentation to control for the known effects of FCS on primary hepatocyte metabolism as an influence on Aβ uptake. Oleic acid was utilized as a positive control as it is readily internalized by both hepatocytes and LSECs. There was very little uptake of water and sucrose by hepatocytes or LSECs during this experiment, while oleic acid was taken up readily. There was a very small amount of uptake of Aβ40 by hepatocytes and LSECs.
Western blots of the total protein from livers directly injected with unlabelled monomeric human Aβ40 were performed (Figure 3). No Aβ40-specific bands (monomeric or oligomeric) could be detected in the liver of injected mice. Control unlabelled Aβ40 was detected at concentrations between 0.25 and 0.75 µg, showing the specificity and sensitivity of the Western blot. Unidentified blurry bands were detected at around 25 kDa in IVC-injected liver samples. However, after taking total protein loading into account, bands of equivalent strengths were also present in the control, non-Aβ40 injected liver, indicating that these bands were non-specific.
The results of Western blotting to confirm the presence and oligomeric state of the radiolabelled 3H-Aβ40 used in MID and cell uptake experiments are shown in Figure S1. This confirmed the presence of both monomeric and dimeric 3H-Aβ40 bands in similar positions to unlabelled human monomeric Aβ40 less than 10 kDA in size. A radioactive analysis of the Western blot membrane, performed by cutting the lane into pieces according to the ladder sizing and placing it into scintillation fluid, showed that 96% of total tritium radiation found in 3H-Aβ40 western blot lane was in the size range of 0-10kDa where monomeric and dimeric bands were present on the blot. This indicates that the 3H radioactive label is still attached to the Aβ protein.
The incubation of primary mouse hepatocytes with Aβ40 at 4 °C was performed to determine the hepatocyte surface binding of Aβ40. Representative immunofluorescent images of Aβ40 detected by the same antibody used in Western blots, paired with an Alexa 488 labelled secondary antibody, are shown in Figure 4. There is a small amount of staining, consistent with surface binding. The experiment was performed at 4 °C because these conditions prevent the internalization and rapid elimination of Aβ40 that is thought to occur at higher temperatures [9]. However, as a direct fluorescently labelled antibody was not available, this excluded performing a competitive binding experiment to confirm the specificity of the staining that was observed. After demonstrating the liver elimination could not be observed, the total body Aβ40 distribution was investigated by injecting 3H-Aβ40 into the tail vein of C57Bl6 mice and observing the distribution of 3H-Aβ40 after 30 min. Radiation counts for each compartment, normalized to the non-injected control mice, are shown in Figure 5. No definitive route(s) of elimination from the bloodstream were observed; however, the kidney, small bowel and liver compartments contained the highest amount of radiation beyond the tail injection site and serum samples.
Total body Aβ40 distribution was investigated by injecting 3H-Aβ40 into the tail vein of C57Bl6 mice and observing the distribution of 3H-Aβ40 after 30 min. Radiation counts for each compartment, normalized to non-injected control mice, are shown in Figure 5. No definitive routes of elimination from the bloodstream were observed; however, the kidney, small bowel and liver compartments contained the highest amount of radiation beyond the tail injection site and serum samples.

4. Discussion

There are reports that human Aβ40 is quickly removed from peripheral circulation in vivo with a half-life of 1.5 to 3.5 min [9,38,39,40,41,42]. Our MID and in vitro data were more consistent with the conclusion that the hepatic clearance of Aβ40 is capacity-limited (i.e., low hepatic extraction) because of a substantial endothelial barrier to uptake and low intrinsic clearance by hepatocytes. The difference between our result and others are likely because (1) our experiments were performed in vitro where other factors influencing hepatic clearance such as blood flow, protein binding and the hepatic synthesis of Aβ will influence results, and (2) our experiments were performed in a single-pass perfused liver, and only the short-term pharmacokinetics were studied. An important therapeutic corollary of our observation that hepatic clearance of Aβ is capacity-limited is that any intervention that improves hepatic clearance by a small absolute amount will have a substantial relative effect on elimination. Therefore, we conclude (like others) that the liver could be a potential therapeutic target for Aβ clearance.
Our initial studies used MID-based experiments; a technique that allows the study of the molecular dynamics for substances taken up by the liver. The experiments did not reveal any age-related changes which may be because the extraction we detected was very low. While this methodology has not been previously used to examine Aβ40 uptake, both our laboratory and others have previously successfully validated the uptake of insulin and other small molecules and their changes with aging, using this technique [24,25,26,27,31]. This result does not exclude the presence of other well-established aging changes between young and old experimental groups, including reduced porosity. However, changes in porosity between groups were not examined after the we were unable to detect changes in 3H-Aβ40 uptake. These current experiments were designed to detect the uptake of trace amounts of radiolabelled Aβ40 by the isolated, intact liver in a single pass. The subsequent experiments examining the liver uptake of Aβ40 including IV injection and the multi-tissue analysis and uptake of isolated hepatocytes and LSECs did not support the proposition that the liver is a site of direct rapid Aβ40 uptake in the body. These findings were further confirmed by a Western blot evaluation of the liver following the direct IV injection of unlabelled Aβ40 (Figure 3).
The systemic injection of 125I-Aβ40 and unlabelled Aβ40 into mice has previously shown some evidence for the rapid uptake of Aβ40 by the liver and other organs [9,10,17,19,41,43]. These studies have involved a variety of different techniques and methods, and this factor may explain the differences and inconsistencies in the reports of Aβ40 liver uptake.
There have been differing reports regarding the level of 125I-Aβ40 detectable in the liver 2 h after peripheral injection. Although some have detected significant uptake, others are only able to show Aβ within the liver by binding it to iodine 125 labelled with a tyramine cellobiose (TC) adduct [9,15]. This sugar adduct cannot be degraded by mammalian cells, trapping the radioactive iodine after its uptake. This greatly increases the amount of 125I-Aβ40 detectable in the liver after to around 50% of the injected radiation, and this study also subsequently used the same TC adduct to identify hepatocytes as the liver cell type that takes up Aβ40 [9]. This study was influential in our choosing to look at Aβ40 uptake over a single pass through the liver with a shorter timeframe, rather than looking at longer time periods without the use of a TC adduct.
Previous work has shown the liver uptake in vivo of unlabelled Aβ40 via Western blotting [39]. Our Western blots of livers exposed in vivo to unlabelled Aβ40 did not show any uptake. The timeframe for our experiment was only 30 s in contrast to the previous study’s significantly longer 90 min endpoint. However, our shorter timepoint would be likely to capture a point of liver uptake if it was rapidly clearing Aβ40, resulting in its half-life of 1.5 to 3 min in plasma as previously reported [9,38,40]. However, these results indicated little liver uptake using unlabelled Aβ40 in agreement with 3H-Aβ40 experimental results. There was also no indication that the tritiation of Aβ40 changed its uptake by the liver.
Several previous studies, which showed the rapid liver uptake of Aβ40 by peripheral injection, used a method to calculate uptake called the liver uptake index method (LUI%) which calculates the unidirectional liver uptake of 125I-Aβ40 relative to 3H-H2O as a reference molecule [8,10,17,18]. While the indicator dilution methodology used by our study does not allow us to calculate LUI% to directly compare results, both MID and LUI% techniques were originally used in brain uptake studies which produced comparable results [44]. Nevertheless, the little rapid liver uptake of Aβ40 was detected via our MID experiments.
Our investigation of how Aβ40 is distributed in different tissues of the body after IV injection found that most injected 3H-Aβ40 could not be detected after 30 min. This indicates that it is rapidly removed or degraded while in the bloodstream in agreement with previous studies. The highest amounts of 3H-Aβ40 were detected in the kidney, small bowel, and liver (Figure 5), which does not eliminate any of these previously suggested potential elimination mechanisms. However, these results were unable to show that the liver is primarily responsible for removing Aβ40 from the bloodstream. There have been several different systems and mechanisms of Aβ40 peripheral elimination proposed, like uptake by other tissues or enzymatic degradation, that are not directly via the liver. These include uptake by the kidney [9,15,41,45], gastrointestinal tract (GIT) [9,15], lymph nodes [46] and skin [9,15] or degradation facilitated by binding to erythrocytes [47,48] and monocytes [49] or through enzymatic degradation in plasma [50]. There is recent evidence that the kidney could particularly be involved in peripheral Aβ elimination. A recent study found evidence that the kidney clears Aβ and that changing the level of kidney function changes the rate of cognitive decline in mouse models of AD [45]. There is also the possibility that the binding of Aβ40 by other molecules in the peripheral circulation may be necessary for its liver uptake. Circulating proteins like albumin [51], soluble circulating LRP [52], insulin [8] or apolipoproteins like apolipoprotein E [39] have been suggested as binding to Aβ to facilitate its liver uptake and elimination.
Maintaining or increasing the peripheral elimination of Aβ as people age could still be a viable target as AD therapy for sporadic disease. Other strategies that target systemic elimination like peritoneal dialysis [11], haemodialysis [53] and plasma exchange [54] have shown potential in reducing levels of brain amyloid. Mouse parabiosis experiments that join the circulatory systems of two animals have shown that increasing the amount of peripheral circulation can reduce the brain’s Aβ40 level [15].
While we could find no evidence of substantial amounts of Aβ40 uptake by the liver, this also does not exclude a role of the liver in producing peripheral Aβ. This is illustrated by recent investigations suggesting that, independent of any ability to eliminate peripheral Aβ40, the liver may be involved in the production of Aβ40 itself, and that this production of Aβ by the liver may help it to maintain sinusoidal permeability and prevent fibrosis [50].
Another recent study has shown that AD mutations expressed only in the liver are capable of increasing brain Aβ levels, causing brain plaques and vascular damage during aging that is like that seen in AD [55].
Our data show that the liver uptake of Aβ is low and capacity-limited, most likely secondary to the high endothelial barrier to uptake and low hepatocyte intrinsic clearance. Although we did not find any aging change in hepatic disposition in vitro, this does not preclude aging changes in vivo where other factors that influence clearance such as blood flow and protein binding will have an impact. Because small absolute changes in the clearance of low extraction substrates such as Aβ will have a large relative effect on systemic elimination, the hepatic clearance of Aβ is a potential target for increasing Aβ elimination in AD.

Supplementary Materials

The following supporting information can be downloaded at: https://www.mdpi.com/article/10.3390/livers4020018/s1, Figure S1: Western blot of Aβ40.

Author Contributions

Conceptualization, V.C.C., D.G.L.C. and G.P.L.; methodology, V.C.C., D.G.L.C., G.P.L. and M.K.; investigation, G.P.L., V.C.C., N.J.H. and S.W.S.K.; writing—original draft, G.P.L. and V.C.C.; writing—review and editing, V.C.C., D.G.L.C., N.J.H., S.W.S.K. and G.P.L. All authors have read and agreed to the published version of the manuscript.

Funding

The research has been funded by the National Health and Medical Research Council of Australia (1141234) and the McKnight Bequest to the Medical Foundation of the University of Sydney. N.H. is supported by the Australian Diabetes Society ECR Fellowship and the University of Sydney SOAR prize.

Institutional Review Board Statement

The study was approved by the Sydney Local Health District Animal Welfare Committee (AWC # 2019/010B).

Informed Consent Statement

Not applicable.

Data Availability Statement

The data supporting the findings of this study are available on request from the corresponding author.

Acknowledgments

Thanks to the Ingrid Gelissen from the University of Sydney for her assistance in amyloid Western blotting techniques.

Conflicts of Interest

The authors declare no conflicts of interest.

References

  1. Hunt, N.J.; Kang, S.W.S.; Lockwood, G.P.; Le Couteur, D.G.; Cogger, V.C. Hallmarks of Aging in the Liver. Comput. Struct. Biotechnol. J. 2019, 17, 1151–1161. [Google Scholar] [CrossRef]
  2. Sengoku, R. Aging and Alzheimer’s disease pathology. Neuropathology 2020, 40, 22–29. [Google Scholar] [CrossRef] [PubMed]
  3. Musiek, E.S.; Bennett, D.A. Aducanumab and the “post-amyloid” era of Alzheimer research? Neuron 2021, 109, 3045–3047. [Google Scholar] [CrossRef] [PubMed]
  4. Van Dyck, C.H.; Swanson, C.J.; Aisen, P.; Bateman, R.J.; Chen, C.; Gee, M.; Kanekiyo, M.; Li, D.; Reyderman, L.; Cohen, S.; et al. Lecanemab in Early Alzheimer’s Disease. N. Engl. J. Med. 2023, 388, 9–21. [Google Scholar] [CrossRef] [PubMed]
  5. Winblad, B.; Amouyel, P.; Andrieu, S.; Ballard, C.; Brayne, C.; Brodaty, H.; Cedazo-Minguez, A.; Dubois, B.; Edvardsson, D.; Feldman, H.; et al. Defeating Alzheimer’s disease and other dementias: A priority for European science and society. Lancet Neurol. 2016, 15, 455–532. [Google Scholar] [CrossRef] [PubMed]
  6. Hardy, J.; Allsop, D. Amyloid deposition as the central event in the aetiology of Alzheimer’s disease. Trends Pharmacol. Sci. 1991, 12, 383–388. [Google Scholar] [CrossRef] [PubMed]
  7. Morley, J.E.; Farr, S.A.; Nguyen, A.D.; Xu, F. Editorial: What is the Physiological Function of Amyloid-Beta Protein? J. Nutr. Health Aging 2019, 23, 225–226. [Google Scholar] [CrossRef] [PubMed]
  8. Tamaki, C.; Ohtsuki, S.; Terasaki, T. Insulin Facilitates the Hepatic Clearance of Plasma Amyloid β-Peptide (1–40) by Intracellular Translocation of Low-Density Lipoprotein Receptor-Related Protein 1 (LRP-1) to the Plasma Membrane in Hepatocytes. Mol. Pharmacol. 2007, 72, 850–855. [Google Scholar] [CrossRef] [PubMed]
  9. Ghiso, J.; Shayo, M.; Calero, M.; Ng, D.; Tomidokoro, Y.; Gandy, S.; Rostagno, A.; Frangione, B. Systemic catabolism of Alzheimer’s Abeta40 and Abeta42. J. Biol. Chem. 2004, 279, 45897–45908. [Google Scholar] [CrossRef] [PubMed]
  10. Mohamed, L.A.; Qosa, H.; Kaddoumi, A. Age-Related Decline in Brain and Hepatic Clearance of Amyloid-Beta is Rectified by the Cholinesterase Inhibitors Donepezil and Rivastigmine in Rats. ACS Chem. Neurosci. 2015, 6, 725–736. [Google Scholar] [CrossRef]
  11. Jin, W.S.; Shen, L.L.; Bu, X.L.; Zhang, W.W.; Chen, S.H.; Huang, Z.L.; Xiong, J.X.; Gao, C.Y.; Dong, Z.; He, Y.N.; et al. Peritoneal dialysis reduces amyloid-beta plasma levels in humans and attenuates Alzheimer-associated phenotypes in an APP/PS1 mouse model. Acta Neuropathol. 2017, 134, 207–220. [Google Scholar] [CrossRef]
  12. Mawuenyega, K.G.; Sigurdson, W.; Ovod, V.; Munsell, L.; Kasten, T.; Morris, J.C.; Yarasheski, K.E.; Bateman, R.J. Decreased Clearance of CNS β-Amyloid in Alzheimer’s Disease. Science 2010, 330, 1774. [Google Scholar] [CrossRef]
  13. Liu, Y.H.; Wang, Y.R.; Xiang, Y.; Zhou, H.D.; Giunta, B.; Manucat-Tan, N.B.; Tan, J.; Zhou, X.F.; Wang, Y.J. Clearance of amyloid-beta in Alzheimer’s disease: Shifting the action site from center to periphery. Mol. Neurobiol. 2015, 51, 1–7. [Google Scholar] [CrossRef]
  14. Mohamad, M.; Mitchell, S.J.; Wu, L.E.; White, M.Y.; Cordwell, S.J.; Mach, J.; Solon-Biet, S.M.; Boyer, D.; Nines, D.; Das, A.; et al. Ultrastructure of the liver microcirculation influences hepatic and systemic insulin activity and provides a mechanism for age-related insulin resistance. Aging Cell 2016, 15, 706–715. [Google Scholar] [CrossRef]
  15. Xiang, Y.; Bu, X.L.; Liu, Y.H.; Zhu, C.; Shen, L.L.; Jiao, S.S.; Zhu, X.Y.; Giunta, B.; Tan, J.; Song, W.H.; et al. Physiological amyloid-beta clearance in the periphery and its therapeutic potential for Alzheimer’s disease. Acta Neuropathol. 2015, 130, 487–499. [Google Scholar] [CrossRef]
  16. Wang, Y.R.; Wang, Q.H.; Zhang, T.; Liu, Y.H.; Yao, X.Q.; Zeng, F.; Li, J.; Zhou, F.Y.; Wang, L.; Yan, J.C.; et al. Associations Between Hepatic Functions and Plasma Amyloid-Beta Levels-Implications for the Capacity of Liver in Peripheral Amyloid-Beta Clearance. Mol. Neurobiol. 2017, 54, 2338–2344. [Google Scholar] [CrossRef]
  17. Tamaki, C.; Ohtsuki, S.; Iwatsubo, T.; Hashimoto, T.; Yamada, K.; Yabuki, C.; Terasaki, T. Major involvement of low-density lipoprotein receptor-related protein 1 in the clearance of plasma free amyloid beta-peptide by the liver. Pharm. Res. 2006, 23, 1407–1416. [Google Scholar] [CrossRef]
  18. Mohamed, L.A.; Kaddoumi, A. In vitro investigation of amyloid-beta hepatobiliary disposition in sandwich-cultured primary rat hepatocytes. Drug Metab. Dispos. 2013, 41, 1787–1796. [Google Scholar] [CrossRef]
  19. Cheng, Y.; He, C.-Y.; Tian, D.-Y.; Chen, S.-H.; Ren, J.-R.; Sun, H.-L.; Xu, M.-Y.; Tan, C.-R.; Fan, D.-Y.; Jian, J.-M.; et al. Physiological β-amyloid clearance by the liver and its therapeutic potential for Alzheimer’s disease. Acta Neuropathol. 2023, 145, 717–731. [Google Scholar] [CrossRef]
  20. Braet, F.; Wisse, E. Structural and functional aspects of liver sinusoidal endothelial cell fenestrae: A review. Comp. Hepatol. 2002, 1, 1. [Google Scholar] [CrossRef]
  21. Straub, A.C.; Stolz, D.B.; Ross, M.A.; Hernández-Zavala, A.; Soucy, N.V.; Klei, L.R.; Barchowsky, A. Arsenic stimulates sinusoidal endothelial cell capillarization and vessel remodeling in mouse liver. Hepatology 2007, 45, 205–212. [Google Scholar] [CrossRef] [PubMed]
  22. Cogger, V.C.; Muller, M.; Fraser, R.; McLean, A.J.; Khan, J.; Le Couteur, D.G. The effects of oxidative stress on the liver sieve. J. Hepatol. 2004, 41, 370–376. [Google Scholar] [CrossRef] [PubMed]
  23. Steffan, A.M.; Pereira, C.A.; Bingen, A.; Valle, M.; Martin, J.P.; Koehren, F.; Royer, C.; Gendrault, J.L.; Kirn, A. Mouse hepatitis virus type 3 infection provokes a decrease in the number of sinusoidal endothelial cell fenestrae both in vivo and in vitro. Hepatology 1995, 22, 395–401. [Google Scholar] [CrossRef] [PubMed]
  24. Le Couteur, D.G.; Cogger, V.C.; Markus, A.M.; Harvey, P.J.; Yin, Z.L.; Ansselin, A.D.; McLean, A.J. Pseudocapillarization and associated energy limitation in the aged rat liver. Hepatology 2001, 33, 537–543. [Google Scholar] [CrossRef] [PubMed]
  25. Hilmer, S.N.; Cogger, V.C.; Fraser, R.; McLean, A.J.; Sullivan, D.; Le Couteur, D.G. Age-related changes in the hepatic sinusoidal endothelium impede lipoprotein transfer in the rat. Hepatology 2005, 42, 1349–1354. [Google Scholar] [CrossRef] [PubMed]
  26. Mitchell, S.J.; Huizer-Pajkos, A.; Cogger, V.C.; McLachlan, A.J.; Le Couteur, D.G.; Jones, B.; de Cabo, R.; Hilmer, S.N. Age-related pseudocapillarization of the liver sinusoidal endothelium impairs the hepatic clearance of acetaminophen in rats. J. Gerontol. A Biol. Sci. Med. Sci. 2011, 66, 400–408. [Google Scholar] [CrossRef] [PubMed]
  27. Mitchell, S.J.; Huizer-Pajkos, A.; Cogger, V.C.; McLachlan, A.J.; Le Couteur, D.G.; Jones, B.; De Cabo, R.; Hilmer, S.N. The Influence of Old Age and Poloxamer-407 on the Hepatic Disposition of Diazepam in the Isolated Perfused Rat Liver. Pharmacology 2012, 90, 233–241. [Google Scholar] [CrossRef] [PubMed]
  28. Mitchell, S.J.; Kane, A.E.; Hilmer, S.N. Age-related changes in the hepatic pharmacology and toxicology of paracetamol. Curr. Gerontol. Geriatr. Res. 2011, 2011, 624156. [Google Scholar] [CrossRef] [PubMed]
  29. Goresky, C.A. A linear method for determining liver sinusoidal and extravascular volumes. Am. J. Physiol. 1963, 204, 626–640. [Google Scholar] [CrossRef] [PubMed]
  30. Goresky, C.A. Kinetic interpretation of hepatic multiple-indicator dilution studies. Am. J. Physiol. 1983, 245, G1–G12. [Google Scholar] [CrossRef]
  31. Hilmer, S.N.; Cogger, V.C.; Muller, M.; Le Couteur, D.G. The hepatic pharmacokinetics of doxorubicin and liposomal doxorubicin. Drug Metab. Dispos. 2004, 32, 794–799. [Google Scholar] [CrossRef] [PubMed]
  32. Crone, C. Capillary permeability to small solutes. In Handbook of Physiology. The Cardiovascular System. Microcirculation, Section 2; American Physiological Society: Rockville, MD, USA, 1984; pp. 411–466. [Google Scholar]
  33. Crone, C. The Permeability of Capillaries in Various Organs as Determined by Use of the ‘Indicator Diffusion’ Method. Acta Physiol. Scand. 1963, 58, 292–305. [Google Scholar] [CrossRef]
  34. Le Couteur, D.G.; Yin, Z.L.; McLean, A.J.; Rivory, L.P. Wash-In Methodology and Modeling to Determine Hepatocellular D-Glucose Transport in the Perfused Rat Liver. Jpn. J. Physiol. 2004, 54, 421–429. [Google Scholar] [CrossRef] [PubMed]
  35. Hunt, N.J.; Lockwood, G.P.; Warren, A.; Mao, H.; McCourt, P.A.G.; Le Couteur, D.G.; Cogger, V.C. Manipulating fenestrations in young and old liver sinusoidal endothelial cells. Am. J. Physiol. Gastrointest. Liver Physiol. 2019, 316, G144–G154. [Google Scholar] [CrossRef] [PubMed]
  36. Cogger, V.C.; O'Reilly, J.N.; Warren, A.; Le Couteur, D.G. A standardized method for the analysis of liver sinusoidal endothelial cells and their fenestrations by scanning electron microscopy. J. Vis. Exp. 2015, 98, e52698. [Google Scholar]
  37. Kang, S.W.S.; Cogger, V.C.; Le Couteur, D.G.; Fu, D. Multiple cellular pathways regulate lipid droplet homeostasis for the establishment of polarity in collagen sandwich-cultured hepatocytes. Am. J. Physiol. Cell Physiol. 2019, 317, C942–C952. [Google Scholar] [CrossRef] [PubMed]
  38. Poduslo, J.F.; Curran, G.L.; Haggard, J.J.; Biere, A.L.; Selkoe, D.J. Permeability and residual plasma volume of human, Dutch variant, and rat amyloid beta-protein 1-40 at the blood-brain barrier. Neurobiol. Dis. 1997, 4, 27–34. [Google Scholar] [CrossRef]
  39. Hone, E.; Martins, I.J.; Fonte, J.; Martins, R.N. Apolipoprotein E influences amyloid-beta clearance from the murine periphery. J. Alzheimer’s Dis. 2003, 5, 1–8. [Google Scholar] [CrossRef]
  40. Ghersi-Egea, J.F.; Gorevic, P.D.; Ghiso, J.; Frangione, B.; Patlak, C.S.; Fenstermacher, J.D. Fate of cerebrospinal fluid-borne amyloid beta-peptide: Rapid clearance into blood and appreciable accumulation by cerebral arteries. J. Neurochem. 1996, 67, 880–883. [Google Scholar] [CrossRef]
  41. Kandimalla, K.K.; Curran, G.L.; Holasek, S.S.; Gilles, E.J.; Wengenack, T.M.; Poduslo, J.F. Pharmacokinetic analysis of the blood-brain barrier transport of 125I-amyloid beta protein 40 in wild-type and Alzheimer’s disease transgenic mice (APP,PS1) and its implications for amyloid plaque formation. J. Pharmacol. Exp. Ther. 2005, 313, 1370–1378. [Google Scholar] [CrossRef]
  42. Marques, M.A.; Kulstad, J.J.; Savard, C.E.; Green, P.S.; Lee, S.P.; Craft, S.; Watson, G.S.; Cook, D.G. Peripheral amyloid-beta levels regulate amyloid-beta clearance from the central nervous system. J. Alzheimers Dis. 2009, 16, 325–329. [Google Scholar] [CrossRef]
  43. Horn, T.; Henriksen, J.H.; Christoffersen, P. The sinusoidal lining cells in “normal” human liver: A scanning electron microscopic investigation. Liver 1986, 6, 98–110. [Google Scholar] [CrossRef] [PubMed]
  44. Pardridge, W.M.; Mietus, L.J. Transport of protein-bound steroid hormones into liver in vivo. Am. J. Physiol. 1979, 237, E367–E372. [Google Scholar] [CrossRef]
  45. Tian, D.Y.; Cheng, Y.; Zhuang, Z.Q.; He, C.Y.; Pan, Q.G.; Tang, M.Z.; Hu, X.L.; Shen, Y.Y.; Wang, Y.R.; Chen, S.H.; et al. Physiological clearance of amyloid-beta by the kidney and its therapeutic potential for Alzheimer’s disease. Mol. Psychiatry 2021, 26, 6074–6082. [Google Scholar] [CrossRef]
  46. Pappolla, M.; Sambamurti, K.; Vidal, R.; Pacheco-Quinto, J.; Poeggeler, B.; Matsubara, E. Evidence for lymphatic Abeta clearance in Alzheimer’s transgenic mice. Neurobiol. Dis. 2014, 71, 215–219. [Google Scholar] [CrossRef]
  47. Brubaker, W.D.; Crane, A.; Johansson, J.U.; Yen, K.; Garfinkel, K.; Mastroeni, D.; Asok, P.; Bradt, B.; Sabbagh, M.; Wallace, T.L.; et al. Peripheral complement interactions with amyloid beta peptide: Erythrocyte clearance mechanisms. Alzheimers Dement. 2017, 13, 1397–1409. [Google Scholar] [CrossRef] [PubMed]
  48. Braet, F.; Bomans, P.H.; Wisse, E.; Frederik, P.M. The observation of intact hepatic endothelial cells by cryo-electron microscopy. J. Microsc. 2003, 212 Pt 2, 175–185. [Google Scholar] [CrossRef] [PubMed]
  49. Chen, S.H.; Tian, D.Y.; Shen, Y.Y.; Cheng, Y.; Fan, D.Y.; Sun, H.L.; He, C.Y.; Sun, P.Y.; Bu, X.L.; Zeng, F.; et al. Amyloid-beta uptake by blood monocytes is reduced with ageing and Alzheimer’s disease. Transl. Psychiatry 2020, 10, 423. [Google Scholar] [CrossRef] [PubMed]
  50. Buniatian, G.H.; Weiskirchen, R.; Weiss, T.S.; Schwinghammer, U.; Fritz, M.; Seferyan, T.; Proksch, B.; Glaser, M.; Lourhmati, A.; Buadze, M.; et al. Antifibrotic Effects of Amyloid-Beta and Its Loss in Cirrhotic Liver. Cells 2020, 9, 452. [Google Scholar] [CrossRef]
  51. Biere, A.L.; Ostaszewski, B.; Stimson, E.R.; Hyman, B.T.; Maggio, J.E.; Selkoe, D.J. Amyloid beta-peptide is transported on lipoproteins and albumin in human plasma. J. Biol. Chem. 1996, 271, 32916–32922. [Google Scholar] [CrossRef]
  52. Deane, R.; Sagare, A.; Zlokovic, B.V. The role of the cell surface LRP and soluble LRP in blood-brain barrier Abeta clearance in Alzheimer’s disease. Curr. Pharm. Des. 2008, 14, 1601–1605. [Google Scholar] [CrossRef]
  53. Kitaguchi, N.; Kawaguchi, K.; Sakai, K. Removal of blood amyloid as a therapeutic strategy for Alzheimer’s disease: The influence of smoking and nicotine. In Nicotinic Acetylcholine Receptor Signaling in Neuroprotection; Springer: Singapore, 2018; pp. 173–191. [Google Scholar]
  54. Boada, M.; Lopez, O.L.; Olazaran, J.; Nunez, L.; Pfeffer, M.; Paricio, M.; Lorites, J.; Pinol-Ripoll, G.; Gamez, J.E.; Anaya, F.; et al. A randomized, controlled clinical trial of plasma exchange with albumin replacement for Alzheimer’s disease: Primary results of the AMBAR Study. Alzheimers Dement. 2020, 16, 1412–1425. [Google Scholar] [CrossRef]
  55. Lam, V.; Takechi, R.; Hackett, M.J.; Francis, R.; Bynevelt, M.; Celliers, L.M.; Nesbit, M.; Mamsa, S.; Arfuso, F.; Das, S.; et al. Synthesis of human amyloid restricted to liver results in an Alzheimer disease-like neurodegenerative phenotype. PLoS Biol. 2021, 19, e3001358. [Google Scholar] [CrossRef]
Figure 1. Representative dose-normalized outflow curves for Aβ40, sucrose and Evans Blue from MID experiments in perfused rat livers from young (A) (n = 6) and old (B) rats (n = 10).
Livers 04 00018 g001
Figure 2. Uptake of radiolabelled molecules by (A) FCS-starved and non-starved primary mouse hepatocytes and (B) primary mouse liver sinusoidal endothelial cells. Results are normalized per 100,000 cells for hepatocytes and per 250,000 cells for LSEC. Cells from a total of three mice shown.
Livers 04 00018 g002
Figure 3. Western blot of C57BL/6J mouse livers stained with anti-Aβ1−16 antibody. Lanes 1 and 9 contain 5 µL of SeeBlue Plus2 Pre-Stained Protein Standard. Lanes 2 and 3 are total protein extracts from mouse livers (n = 2) after IVC injection of 45 µg of Aβ40. Lanes 4 and 5 (n = 2) are total protein extracts from non-injected mouse livers. Lanes 6 to 8 are Aβ40 standards. Arrow indicates monomeric Aβ40 band. Bottom inset is α-tubulin stain of lanes 2 to 5 showing total protein loading.
Livers 04 00018 g003
Figure 4. (A) Representative low- and high-magnification images of 24 h cultured primary hepatocytes (n = 1), and white arrows indicate membrane staining after exposure to Aβ40 for 2 h at 4 °C and stained with 1:1000 anti-Aβ1−16 clone 6E10. (B) Representative low- and high-magnification images of 24 h cultured primary hepatocytes (n = 1) without exposure to Aβ40 stained with 1:1000 anti-Aβ1−16 clone 6E10.
Livers 04 00018 g004
Figure 5. Distribution of 3H-Aβ40 in compartments at 30 min after tail vein injection in mice (n = 3). Distribution in blood is also measured at 5 and 15 min.
Livers 04 00018 g005
Table 1. The effect of age on the recovery of Aβ40, Evans Blue and sucrose. Data presented as mean ± SD.
Young Rat (n = 6)Old Rat (n = 10)
Fractional recovery
   Aβ400.99 ± 0.030.86 ± 0.08 **
   Evans Blue1.02 ± 0.040.85 ± 0.09 **
   Sucrose0.98 ± 0.030.85 ± 0.13 *
Ratio of recovery
   Aβ40/Evans Blue0.97 ± 0.041.01 ± 0.07 ns
   Aβ40/sucrose1.01 ± 0.031.02 ± 0.06 ns
   Evans Blue/sucrose1.05 ± 0.021.01 ± 0.04 ns
ns = not significant; * p < 0.05 young versus old; ** p < 0.005 young versus old.
Table 2. The effect of age on the apparent volume of distribution and permeability surface-area products (Aβ40/Evans Blue only) of Aβ40, Evans Blue and sucrose. Data presented as mean ± SD.
Young Rat (n = 6)Old Rat (n = 10)
Apparent volume of distribution
   Aβ40 (mL/g)0.16 ± 0.020.19 ± 0.05 ns
   Evans Blue (mL/g)0.15 ± 0.020.16 ± 0.04 ns
   Sucrose (mL/g)0.17 ± 0.030.20 ± 0.05 ns
Ratio of apparent volume of distribution
   Aβ40/Evans Blue1.05 ± 0.041.19 ± 0.17 ns
   Aβ40/Sucrose0.91 ± 0.050.92 ± 0.05 ns
   Evans Blue/Sucrose0.87 ± 0.050.79 ± 0.13 ns
Permeability Surface area product
   Aβ40/Evans Blue (mL/s/g liver)0.004 ± 0.0010.008 ± 0.009 ns
ns = not significant.
Disclaimer/Publisher’s Note: The statements, opinions and data contained in all publications are solely those of the individual author(s) and contributor(s) and not of MDPI and/or the editor(s). MDPI and/or the editor(s) disclaim responsibility for any injury to people or property resulting from any ideas, methods, instructions or products referred to in the content.

