Abstract
For the first time, High-Resolution Magic Angle Nuclear Magnetic Resonance spectroscopy (NMR-HRMAS) was applied to directly identify specific metabolites from a Spanish raw ewe’s milk and enzymatic coagulation pressed-curd cheese (Protected Geographical Indication: Castellano) manufactured by two procedures (traditional/artisanal vs. industrial) and including the ewe’s raw milk. The NMR parameters were optimized to study the complex matrixes of this type of cheese. In addition, conventional overcrowded 1H-NMR-HRMAS spectra were selectively simplified by a Carr–Purcell–Meiboom–Gill (CPMG) sequence or a stimulated echo pulse sequence by bipolar gradients (DIFF), thus modulating spin–spin relaxation times and diffusion of molecular components, respectively. 1H-NMR-HRMAS spectroscopy displayed important information about cheese metabolites, which can be associated with different manufacturing processes (industrial vs. traditional) and ripening times (from 2 to 90 days). These results support that this spectroscopy is a useful technique to monitor the ripening process, from raw milk to commercial ripened cheese, using a minimum intact sample, implying the absence of time-consuming sample pretreatments.
1. Introduction
Nuclear magnetic resonance (NMR) spectroscopy is a fast and accurate alternative for the study of biological matrices. This technique, thanks to the High-Resolution Magic Angle Spinning (HRMAS) probe, allows direct analysis of semi-solid samples and high-resolution spectra. 1H-NMR-HRMAS provides, in a single experiment, both fat-soluble and water-soluble compounds present in each sample, without the need for prior manipulation, which reduces analysis time and avoids possible losses or contamination derived from extraction and separation procedures. This technique requires small amounts of sample for the analysis, about 15 mg, which will depend on the size of the rotor, which allows, in heterogeneous systems, the study of each of the portions that make it up or analyze different parts of the same sample that provide information on the dispersion of its composition [1].
In the last decade, the 1H-NMR HRMAS technique has been applied to the study of different food matrices, including different types of cheese, such as Mozzarella [2] or Fiore Sardo [3], meat [4] and meat products [5], fish [6], tomato [7], citrus fruits [8], peppers [9], garlic [10], and even microalgae [11].
Ewe’s milk cheeses are highly valued for their quality and nutritional profile as well as for their flavor, including nuances from mild and sweet to strong and sharp, depending on the type of processing and the region of origin [12,13]. In general, ewe milk is characterized by a higher fat and protein content than cow milk [14,15], which contributes to the richness and creaminess of these cheeses. There is a considerable variety of this type of cheese that has been an integral part of the diet of rural communities in regions such as the Mediterranean area, Spain and Portugal, and South America. The artisanal methods to make ewe’s milk cheeses have been passed down from generation to generation. The production process involves milk coagulation, followed by curd formation, cutting curd, and ripening in caves, cellars or ripening chambers, depending on the variety. Among the best-known sheep cheeses are Pecorino Romano from Italy, the blue cheese produced in Roquefort-sur-Soulzon, France, and Feta from Greece [13].
In Spain, several enzymatic coagulation pressed-curd sheep cheeses are produced including the Manchego cheese (with Protected Designation of Origin, PDO, REGULATION (EC) 1107/96) [16], which is internationally known and has been widely studied. However, Castellano cheese (with recent Protected Geographical Indication, PGI, REGULATION (EU) 2020/247) [17] has a firm texture and mild flavor and is highly valued by consumers, but only a few relevant studies have been carried out on its microbiota, volatile compound profile, texture, and other sensory characteristics [13,15].
More specifically, sheep Castellano cheese (CL) is produced in the north-western region of Spain (Castilla y León), from ewe’s milk (Chura and Castellana breeds), and either traditionally (artisanal) or industrially produced. Traditional (T) cheese is manufactured from raw milk in small local cheeseries. In contrast, industrial (I) cheese is manufactured either from raw or pasteurized milk at a factory level, thus implying strictly controlled manufacturing conditions. For T-CL, ovine rennet is used.
The composition of different types of cheese (Manchego, Roncal, Idiazábal, Cheddar, Dubliner, Zamorano) has been already studied by analytical techniques such as high-performance liquid (HPLC), gas (GC) or ionic chromatography, and by mass spectrometry [18,19,20]. Most of these analyses were focused on a determined group of compounds and required a sample pre-treatment, sometimes long and tedious extraction procedures, not avoiding the risk of sample alteration. Nowadays, environment-friendly approaches are mandatory, thus implying a reduction in waste and consumption of solvents, reagents, and time. Enabling analyses on intact samples, HRMAS NMR spectroscopy has emerged as an innovative analytical technique for semi-solid foods and tissues, since it can provide a highly detailed profile of intrinsic metabolites [1,21].
As a minimally invasive technique, 1H-NMR HRMAS spectroscopy offers considerable advantages. The present work aimed to characterize the metabolite fingerprint related to the production process of traditional and industrial Castellano cheese using 1H-NMR HRMAS spectroscopy for the first time and was carried out from milk to three months of ripening. As a first step, acquisition parameters had to be optimized to obtain high-quality spectra and to establish standard analysis conditions that could be used for the study of enzymatic coagulation pressed-curd cheeses of similar characteristics.
2. Materials and Methods
2.1. Experimental Design and Sampling
Castellano cheese (CL) from two different production systems; traditional/artisanal (T-CL) and industrial (I-CL) were analyzed on day 2 and day 90 of the ripening process. According to the Castellano PGI [17], in Table S1, the characteristics of both manufacture procedures are shown. Five cheeses from each production system were analyzed at each sampling time. From each of them, for the sample to be representative, excluding the rind (1 cm from the outside) and the center (1 cm), ten different points were sampled with a biopsy syringe (biopsy punch, Stiefel, Ø 3 mm) and pooled.
Seven samples of raw sheep’s milk (Castellana and Churra breeds) used for the T-CL production in a small local cheesery were taken for subsequent analysis. The milk was refrigerated (4 °C) and under stirring for no longer than 10 h.
2.2. 1H-NMR HRMAS Spectroscopy
For each sample, 8 ± 1 mg of cheese or 35 µL of raw milk were packed into a 50 µL HRMAS rotor insert, and 20 µL of a 3-(trimethylsilyl) propionic-2,2,3,3-d4 acid sodium salt (TSP) 1 mM solution in D2O were added. The inserts were placed in a Zirconium rotor and 1H-NMR HRMAS analyses were carried out on a 500 MHz (11.7 T or 500.13 MHz) spectrometer Bruker AMX500 (Bruker GmBH, Rheinstetten, Germany) equipped with an HRMAS probe.
Temperature, spectral width, and spinning frequency values were optimized, and the effect of three types of 1D experiments was studied: 1D-Noesypr (1D-NOESY), T2 filter or Carr–Purcell–Meiboom–Gill (CPMG) sequence [90°-(t-180°-t)n–acquisition], and Diffusion filter (DIFF).
The working ranges for each parameter were as follows: temperature (between 4 and 25 °C), spectral width (from 16.7 to 25.0 ppm), spinning frequency (between 4 and 6 kHz), magnetic field gradient intensity (diffusion filter, between 5% and 95%), and echo time (T2 filter, CPMG, between 0.01 and 0.3 s) (Table S2). The starting values were previously described [6].
Each spectrum was data reduced individually over a 10.00–0.70 ppm range. Assignment of resonances in the 1H-NMR spectra from raw milk and cheeses was based on both the spin connectivity information obtained from 2D experiments: (i) 1H,1H-COSY-HRMAS (correlated spectroscopy): water presaturation during 1 s relaxation delay to determine the quality of the resulting spectrum (signal-to-noise ratio), a spectral width of 8333 Hz in both dimensions, an acquisition matrix with 2048 data points in f2 and 384 increments in f1. An unshifted sinusoidal window function and zero filling in f1 in both dimensions were applied before the Fourier transformation. (ii) 1H,1H-TOCSY-HRMAS (total correlated spectroscopy): carried out in TPPI mode with the same acquisition parameters as above and a 70 ms mixing time.
This was accompanied by the use, as guidelines, of both the data reported in the literature [5,6,22] and the data obtained from HMDB [Human Metabolite Data Base http://www.hmdb.ca/ (last accessed on 25 January 2024)].
A baseline correction was applied to all mono- and bi-dimensional spectra, and the frequency axes were calibrated by associating 1H signals of TSP to 0 ppm. D2O was used to obtain the lock signal, which ensures the stability of the magnetic field of the spectrometer.
A total of 83 selected regions corresponding to the main metabolites identified were integrated. The integral of each of them was normalized to the sum of all the integrals of the spectrum. Since in ewe’s milk, most of the metabolites remain constant, although small variations may occur, for the semi-quantitative study of metabolite evolution along the cheese ripening process, the relative signal intensity (arbitrary units) was considered as the ratio between the integral of the NMR signal and the sum of all observed NMR signal integrals [6,23]. All spectra were processed by using both Bruker Topspin Software (v.4.3) and MestReC NMR Processing Software (v.4.9.9.9).
2.3. Data Treatment and Statistics
To check the normal distribution, the Shapiro–Wilk’s test was applied. When samples did not fit a normal distribution, the Kruskal–Wallis’ test was used to determine the null hypothesis, that the medians of the variable within each of the sample levels were the same. When samples fitted a normal distribution, statistical analyses were carried out using SAS 9.4 (SAS, 2018). PROC GLM was performed to determine the effects of ripening time and elaboration process. Duncan’s test for multiple mean comparisons procedure was used to determine which means were significantly different from others (95% confidence level). Two different elaboration processes and five different ripening times were considered, and data were presented as mean values and their standard deviation (SD). Multivariate statistical analysis was conducted on NMR data. Spectra were subjected to principal component analysis (PCA) using AMIX software (version 3.9.11, Bruker BioSpin).
3. Results
3.1. Optimization of NMR Spectroscopy Parameters
Regarding temperature of acquisition, in Figure 1, spectra acquired at 4, 10, and 25 °C of CL cheese are shown. Acquisition at 25 °C allowed for the lowest disturbance on the closest signals, corresponding to triglycerides (TAG).
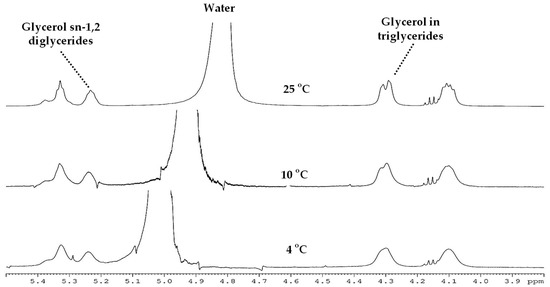
Figure 1.
1H-NMR HRMAS spectra acquired at 500 MHz with 90° pulse at different temperatures of Castellano cheese of industrial manufacturing (I-CL) from 90 days of ripening time.
Attending to spinning frequency (Table S2), 6 kHz avoided the presence of artifacts within the spectral range (Figure 2).
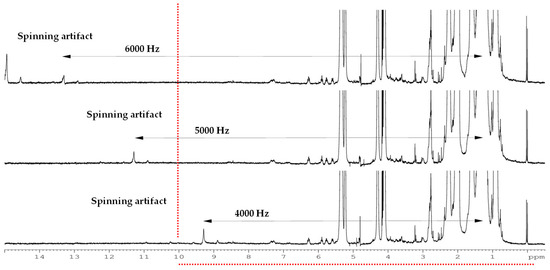
Figure 2.
1H-NMR HRMAS spectra acquired at 500 MHz with different spinning speeds with 1D-Noesypr experiments of Castellano cheese of industrial manufacturing (I-CL) from 90 days of ripening time.
Spectral width (SW) was optimized to 25 ppm (Table S2), since spinning artifacts appeared in the studied range (0–10 ppm) when 17 ppm SW was considered (Figure 3).
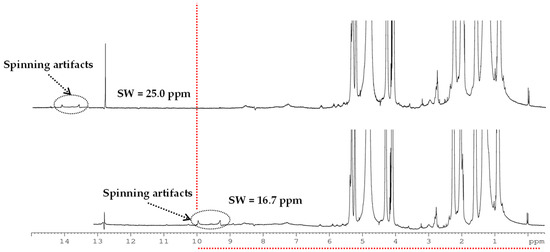
Figure 3.
1H-NMR HRMAS spectra acquired at 500 MHz with different spectral widths (SW) at 4000 Hz spinning frequency of Castellano cheese of industrial manufacturing (I-CL) from 90 days of ripening time.
Regarding the use of specific pulse sequences (CPMG and DIFF), gradient strength optimization was developed. Starting from 53.5 G/cm (100% gradient intensity), different studies were carried out varying such intensity between 5% and 95%. The first study with 5%, 25%, 50%, 75%, and 95% showed that signals of low-weight metabolites were observed in 50% and lower values but not in 75% nor 95% intensity. A more detailed study within the range of 50–75% allowed to establish 60% (32.1 G/cm) as the targeted value. Regarding CPMG, echo time was optimized by considering 500, 750, and 950 number of experiments, thus implying 0.01, 0.25, and 0.3 s as values of echo time, respectively. The best spectra were obtained by using 0.25 s. Illustrative examples can be observed in Figure 4: (a) T2 filter (CPMG), (b) diffusion filter (DIFF), and (c) 1D-Noesypr.
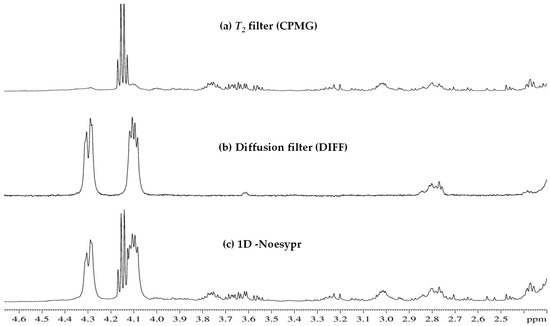
Figure 4.
1H-NMR HRMAS 1D spectra (2.3 to 4.7 ppm) of Castellano cheese of industrial manufacturing (I-CL) from 90 days of ripening time, obtained through experiments with (a) T2 filter (CPMG), (b) diffusion filter (DIFF), and (c) 1D-Noesypr.
3.2. Study of Raw Milk
The ewe’s raw milk from authorized breeds for the elaboration of Castellano cheese was studied as the first step in the analysis of metabolite changes linked to cheese manufacturing. Figure 5 shows an enlargement of the 0.5–5.5 ppm section of a 1H-NMR HRMAS spectrum. The 0.9, 1.3, 1.6, 2.1, 2.3 and 5.3 ppm signals were assigned to the free fatty acids, whereas related signals to citric acid were in the spectral range of 2.5–2.7 ppm. The signals of lactose were 4.4 ppm to α and 3.3 and 4.6 ppm to β-lactose isomers whereas signals related to building monomers α and β-glucose and galactose were within the 3.25–4.00 ppm range. Moreover, signals at 4.1 and 4.3 ppm were associated with the glycerol from the TAG present in the matrix of raw milk.
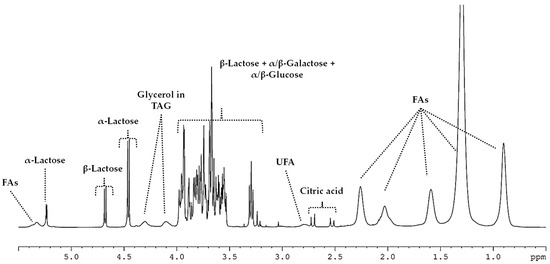
Figure 5.
1H-NMR HRMAS spectrum (0.5–5.5 ppm) from ewe’s raw milk.
FA = fatty acid; TAG = triacylglyceride; UFA = unsaturated fatty acid.
3.3. Cheese
Figure 6 shows an enlargement of the aliphatic (0–5.5 ppm) and the aromatic (5.5–9.0 ppm) sections of a spectrum of I-CL cheese.
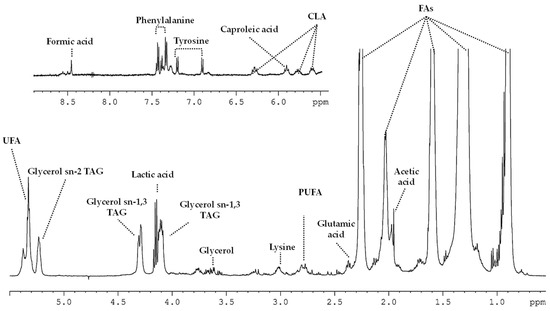
Figure 6.
1H-NMR HRMAS spectrum from Castellano cheese of industrial manufacturing (I-CL) from 90 days of ripening time.
CLA = conjugated linoleic acid; FA = fatty acid; TAG = triacylglyceride; UFA = unsaturated fatty acid; PUFA = polyunsaturated fatty acid.
3.3.1. Carbohydrates, Organic Acids, and Ethanol
When comparing the milk (Figure 5) to the cheese (Figure 6 and Figure S1) spectra, significant changes in the carbohydrate-related signals were visually noticeable; a high hydrolysis of lactose was detected. A decrease in the intensity of lactose signals between milk and cheese day 2 was observed together with the lack of such signals on cheese day 90. Relatedly, the presence of conforming monomers of lactose (α/β-galactose and α/β-glucose) was detected at day 90 of elaboration (Figure 6). Nevertheless, no remarkable differences were observed between manufacturing procedures (I-CL and T-CL).
Formic, citric, acetic, and lactic acids, together with ethanol, were also identified as components of the Castellano cheese (Figure 6, Table 1). Regarding lactic acid, I-CL values were 13.2% higher than T-CL (p < 0.0001). In both the I-CL and T-CL types of cheese, a decrease in the signal intensity of lactic acid was detected along with maturation. Nevertheless, the change was found to be higher in T-CL than in I-CL (10.1% vs. 7.5% difference, respectively; p < 0.001 for the type × time interaction). During the 90 days of ripening, an increase in the signal intensity of formic and acetic acids was detected (p < 0.0001). However, whereas I-CL presented a higher formic acid relative signal intensity than T-CL on day 2 of processing (2-fold; p < 0.001), on day 90 of ripening, no significant differences were found, which is consistent with the statistical interaction detected since T-CL presented a greater increase with time than I-CL (71.4% vs. 42.9% of the difference, respectively; p < 0.01; Table 1).

Table 1.
Relative signal intensity 1 of formic acid, citric acid, acetic acid, lactic acid, and ethanol from 1H-NMR HRMAS spectra of Castellano cheeses.
Regarding acetic acid, I-CL presented a lower relative signal intensity than T-CL on day 2, and the increase with time was also different with the elaboration process with T-CL suffering 46.0% and I-CL 22.3%, reaching, at the end, T-CL almost double the acetic acid relative signal intensity than I-CL (p < 0.01; Table 1).
The evolution of citric acid with RT showed opposite behavior between elaboration processes. Although of small magnitude, while a decrease in signal intensity was detected for I-CL, an increase was observed for T-CL (p < 0.05; Table 1).
Both types of cheese (I-CL and T-CL) showed a slight decrease in the intensity of the ethanol signal with ripening (p < 0.05). In Table 1, it can also be observed that T-CL showed higher values than I-CL.
3.3.2. Fatty Acids and Glycerol
The effect of the elaboration process on conjugated linoleic (CLA, 6.27 ppm), caproleic (5.76 ppm), linoleic (2.85 ppm), linolenic (2.78 ppm) and butyric (0.94 ppm) fatty acids, and glycerol (4.08 ppm) is depicted in Table 2. In addition, it was also possible to detect the evolution of unspecific saturated (0.87 and 1.60 ppm) and unsaturated cis and trans FAs (2.05, 5.31 and 5.40 ppm, Figure 6).
Table 2.
Relative signal intensity 1 of butyric acid, caproleic acid, linoleic acid, conjugated linoleic acid (CLA) and glycerol from 1H-NMR HRMAS spectra of Castellano cheeses.
The associated signals to caproleic acid resulted in a statistical tendency to a higher signal intensity value in T-CL than in I-CL and a tendency to an increase in RT but only for T-CL (p = 0.0617, 18% difference and p = 0.0693 for the interaction, 12% difference, respectively).
Regarding CLA, the signal intensity of T-CL resulted a 35% higher than I-CL. But no change associated with RT was observed.
Linoleic and butyric acids showed higher signal intensity in I-CL than in T-CL (81% and 62% difference, respectively; p < 0.001, Table 2). However, in the case of butyric acid, while a 4.1% increase was observed for T-CL with RT, a 4.9% decrease was detected for I-CL. No significant change with RT was detected for linoleic acid I-CL, and a 5.7% increase was detected for T-CL.
Regarding linolenic acid, only statistical tendencies for T-CL values to be higher than I-CL and values at day 90 higher than at day 2 were detected (p = 0.0609 and p = 0.0001, respectively).
Glycerol showed higher signal intensity in I-CL than in T-CL at day 2 of ripening (28% difference; p < 0.001). However, while a 54.0% increase with RT for T-CL was detected, the signal intensity for I-CL only increased a 2.1% (Table 2).
3.3.3. Amino Acids
Remarkably, all the detected amino acids showed a different behavior related to the elaboration procedure (p < 0.0001). Overall, for each amino acid at the same RT, higher relative signal intensity was detected for T-CL than for I-CL.
Related to the RT (from 2 to 90 days), an intensity increase in all the signals of amino acids was observed (p < 0.0001) (Table 3). The relative signal intensity of the aliphatic amino acids (glycine, alanine, valine, leucine, and isoleucine) showed an increase between 29.1% (alanine) and 43.5% (valine) in T-CL, whereas in I-CL, between 6.8% (alanine) and 30% (valine). However, regarding the aromatic amino acids, an increase in the relative signal intensity higher than 77% was observed for tryptophan and higher than 88% for phenylalanine and tyrosine (Table 3). In fact, the increase with RT in the relative signal intensity of the total amino acid was 21.8% for I-CL vs. 45.2% for T-CL.
Table 3.
Relative signal intensity 1 of the detected amino acids from 1H-NMR HRMAS spectra of Castellano cheeses.
4. Discussion
The Castellano cheese (PGI [17]) has a great economic importance for the region and a flourishing international market due to its high sensory quality. In this area of Spain, all the ewe’s milk produced (99.94%) is used to make cheese with similar manufacturing procedure and characteristics.
4.1. Establishing the NMR Standard Analytical Conditions for Castellano Cheese
To obtain 1H-NMR HRMAS spectra of the Castellano cheese metabolites, a study of the effect of the acquisition parameters in the spectrum quality was carried out, aiming to establish the standard conditions of analysis. The values were stated as those which the lowest signal interference and the highest resolution for this type of samples (Table S2).
These conditions of analysis were applied to the study of Castellano cheese (2 types of manufacturing, I- and T-, and 2 RT: days 2 and 90) resulting, in all cases, in high-quality 1H-NMR HRMAS spectra.
Although the analysis of the raw sheep milk is usually carried out by a liquid probe, in this study, the suitability of the HRMAS probe was proven, thus avoiding sample manipulation, hence allowing a comparative analysis from the raw material (sheep milk) to ripened cheese.
It is essential to adapt the acquisition NMR parameters to maximize the potential of the use of an advanced technology, such as HRMAS spectroscopy, in new and complex matrixes. In this study, the acquisition temperature was established to avoid the signal overlapping of the main metabolites with the water signal (4.82 ppm). Acquisition at 25 °C allowed for the lowest disturbance on the closest signals, corresponding to TAGs.
Regarding the spinning frequency, 6 kHz was selected. In general, 5 kHz has been used by several authors [2,24] for different food matrixes. However, to carry out this study, it was considered that the higher the spinning frequency, the higher the signal intensity, but, as Jensen and Bertram [25] stated, avoiding disruption and disintegration of the sample or any degradation process would imply an unrealistic picture of the sample metabolic fingerprint.
Due to the complex composition of the studied matrixes, overcrowded and overlapped 1H-NMR HRMAS spectra were obtained. In fact, it was described that samples with a high-lipid content led to broad signals in the 1H-NMR spectra that can obscure the aliphatic region and preclude identification of other metabolites. A SW lower than 17 ppm caused the spin artifacts produced by the intense fatty acid signals to be in the study region (between 0.5 and 10 ppm), while the use of a SW of 25 ppm caused the same artifacts to be located outside the chemical shift range studied. This value of 25 ppm SW was therefore selected for the analysis.
To simplify, specific pulse sequences were used: 1D-NOESY and CPMG and DIFF, modulating spin–spin relaxation times and diffusion of molecular components, respectively. 1D-NOESY (presat) is a standard sequence to show all the metabolites, a whole picture, significantly suppressing the water signal but being unable to completely suppress the signals of “faraway water”, and is highly sensitive to ionic effects. CPMG suppresses all signals of slow-moving molecules, such as lipidic metabolites. Molecular mobility and dimension are inversely proportional; thus, the NMR spin–spin relaxation time (T2) decreases with increasing molecular size. The signals of comparatively large molecules, linked to shorter T2, are selectively suppressed by applying the CPMG with sufficient spin echo repetitions. Despite a partial reduction in signal intensity and, occasionally, J-coupling resolution, this simplification enables clearer observation of the peaks (and multiplicity) of relatively faster-moving molecules, such as amino acids, organic acids, carbohydrates, and alcohols. In parallel, molecular diffusivity and hydrodynamic radius are also inversely proportional. Signals from molecules with low hydrodynamic radius are suppressed by DIFF, whereas for larger molecules, visibility increases [26,27,28].
Despite the partial loss of resolution and intensity of multiplets resonating between 3.9 and 4.2 ppm in the DIFF spectrum, attributable to glycerol methylenes, this pulse sequence allowed the clarification of signals in comparison to the conventional 1H-NMR-HRMAS spectrum.
4.2. Ewe’s Raw Milk Analysis Using a HRMAS Probe
Sheep milk is mainly used for cheese manufacture due to its high total solids content and is an excellent source of nutrients. Similar metabolite profiles of sheep milk have been previously described in the literature [14,29,30,31], together with the characteristic high-fat level compared to cow milk [14,32].
The presence of macromolecules, such as sugars, lipids, and proteins, in milk generates broad signals in NMR spectra, thus interfering with the identification of low-concentration metabolites. Therefore, in studies focusing on secondary milk metabolites, macromolecules are typically removed through sample preparation methods. Commonly, proteins and lipoproteins are precipitated with methanol and ethanol and lipids with chloroform. Although detailed protocols for fractionation of dairy samples into their components have been described in the literature, our study is further evidence that the use of HRMAS together with different sequences/filters allows similar results to be obtained using the whole sample, avoiding fractioning, although the detection limit and analysis times of HRMAS still need to be improved [31,33,34].
A major challenge for dairy processors is to understand the performance of milk throughout the processing stages and supply chain over the production season. To date, several studies have highlighted the presence of important biomarkers of milk techno-functionality. Therefore, further research could provide predictive tools for decision making around suitability of milks for certain processing conditions, increasing its processability and efficiency and maintaining the quality of the final product. In addition, metabolomics is a powerful tool for the authentication of milk and dairy products depending on a variety of animal production traits, such as species, PDO/PGI, animal diet (grass-fed), etc. [34,35].
4.3. Castellano Cheese Characterization Using a HRMAS Probe
During the ripening process of pressed-curd cheeses with enzymatic coagulation, significant changes occur because of the simultaneous transformations undergone by the milk components (mainly lactose, proteins, and lipids). These modifications are mainly due to hydrolytic processes which result in the typical characteristics for each degree of maturation. The changes that occur can be summarized mainly in three processes: glycolysis, produced mainly by the action of lactic acid bacteria (LAB), which starts in the coagulation of the milk-producing lactic acid; proteolysis, with an important role in the flavor and texture of the cheeses; and lipolysis, especially involved in the development of the aroma and flavor of ripened cheeses [13,15,36,37].
4.3.1. Carbohydrates, Organic Acids, and Ethanol
Lactose hydrolysis is an inherent reaction of cheese production. Concurrently, analyses by NMR spectroscopy allowed the identification of the same monosaccharides in Mozzarella and Fiore Sardo cheese [2,3]. From our results, the decrease in the relative signal intensity of lactose and its conforming monomers along the ripening process implied an active metabolism of lactose. Garde et al. [38], in Manchego, and Piras et al. [3], in Fiore Sardo cheese, described the same behavior at the stages of the ripening process.
Formic, citric, acetic, and lactic acids, together with ethanol, are related to the control of the growth of bacteria and, consequently, microbiota activity, as well as partially involved in the development of taste and aroma [39]. In agreement with our results, the evolution of lactic acid with RT was similar in other types of cheese [40,41]. Differences related to the elaboration process could be associated with the fact that the metabolic route of lactose in cheese production depends on the presence of different types of LAB. Lactic homofermentative bacteria (Streptococcus, Enterococcus, Lactococcus, Lactobacillus, etc.) metabolize most of the glucose content into lactic acid. Furthermore, lactic heterofermentative bacteria (Leuconostoc and some Lactobacillus) produce small quantities of lactate, ethanol, acetate, and CO2 when glucose is metabolized [2,3,15,36].
The increase in relative signal intensity of formic acid could be associated with the presence of Streptococcus thermophilus, which produces formic acid, pyruvic acid, and CO2 from lactose [42]. Lombardi et al. [43] in Reggianito but Califano and Bevilacqua in Mozzarella [44] and Gouda [45] cheeses observed similar behavior at such maturation times.
A similar performance of acetic acid was previously observed in Cheddar cheese by Lues and Bekker [46] and St-Gelais et al. [47]. Related, Upreti et al. [48] attributed the variations in acetic acid to its involvement in several routes of lactose degradation since Lactococcus predominates at the beginning stages of cheese ripening [36,37].
Attending to citric acid, Lombardi et al. [43] observed a decrease in the citric acid amount in Reggianito cheese. The citric acid amount has been described to depend on the presence of citrate-positive strains as Lactococcus lactis, specific strains of Leuconostoc and/or other non-starter lactic acid bacteria (NSLAB) as Lactobacillus plantarum [49]. Gore et al. [39] described a great dependence of citrate presence on the composition of NSLAB in raw milk cheese and, mainly, artisanal. Citrate metabolism is related to the formation of eyes or holes and related to opened textures or structures because of the production of CO2 [49]. Ballesteros et al. [50] associated the behavior of I-CL with both the composition of NSLAB and the possible inclusion of citric acid, sometimes not declared, as a conservator by the industry.
A direct contribution of ethanol has been described in the taste and aroma of cheese or by the formation of FA esters [51,52]. Additionally, Buffa et al. [40] described a direct relationship between citric acid and ethanol amounts and stated ethanol as one of the different metabolites used as predictors of RT. These appreciations are related to the evolution of the relative intensity of the ethanol signal in the Castellano cheeses studied and could be associated with their sensory quality.
4.3.2. Fatty Acids (FAs) and Glycerol
Such a signal assignment of the lipid fraction was very similar to the one carried out by Scano et al. [22] in Pecorino Sardo cheese. Remarkably, these authors worked with a lipid extract, whereas the present results corresponded to a direct analysis of cheese, without a previous manipulation thus being an added value.
Recent studies described a dependence of the FA profile on the NSLAB composition and a direct relationship between the manufacturing process and the NSLAB profile together with a direct relationship between the volatile aroma compounds and the FA profile [36,53,54]. In this line, the differences in the relative intensity of the signals of each FA observed in the I-CL vs. T-CL comparison are undoubtedly a reflection of the different microbiota associated with the ripening process of each cheese variety.
It is described that lipolytic processes do not surpass 2% of present TAGs in most types of cheese [22,49]. Different lipolytic behavior might be a consequence of the thermal treatment in I-CL but not in T-CL, thus implying an increase in the hydrolysis velocity due to the temperature increase but a quicker inactivation of enzymes. In addition, these results might be related to the positional distribution within the TAG molecule, thus being short-chain FAs mainly in sn-1 and/or sn-3 position, together with the activity, even at low concentrations, of the native lipoprotein-lipase of milk, thus being the TAG sn-1 and/or sn-3 position hydrolysis both kinetically and thermodynamically facilitated [55,56,57].
In line with our results, Luna et al. [57] and Ali et al. [58] found that the CLA content was different among types of cheese, but it remained almost constant with RT. Therefore, the cheese CLA content highly directly depends on the amount in the original milk and poorly relies on the starter culture and ripening.
The CLA signals appear in the olefinic region of the spectrum at a chemical shift without overlapping, thus allowing an accurate assignation and precise integration. As previously mentioned, the studied matrixes present a complex composition, thus leading to overcrowded spectra and signal overlapping. For this reason, a parameter optimization is necessary, and in addition, 2D-NMR experiments are often used to elucidate chemical structures. Relatedly, it is worth mentioning that the dependence on animal species and breed, diet, and seasonality, etc. of CLA concentration has been deeply characterized [59,60], thus implying a high specificity of the presence of CLA.
4.3.3. Amino Acids
A similar profile of free amino acids was also found in other types of Spanish ewe’s milk cheeses such as Manchego type [49,50] or those from Mahón origin [61].
Proteolysis is considered a very important factor contributing to cheese matrix variations. The main proteolytic mediators are natural milk proteases, curd coagulating enzymes, and peptidases and proteases released by starter and non-starter cultures [58].
Differences between the elaboration processes are highly related to the development of the texture and flavor of each type of cheese [3,39]. In fact, the proteolysis pathways for each bacterium and the enzymatic processes and their repercussion on the changes during RT and the interaction with the elaboration procedure are continuously studied [58,59,60,61,62,63,64,65,66,67,68].
From our results, in general, a higher increase in the relative signal intensity of free amino acids was detected in T-CL than in I-CL. Such a dependence on the elaboration procedure could be associated with, on one side, the use of different starter cultures, being commercial cultures connected to lower proteolysis than native microbiota [36,58]. For the traditional manufacturing (T-CL), the use of milk from local dairy farms, seasonality of the production, and the use of natural rennet, together with the availability of facilities with a low or non-existent level of automatization, would allow the persistence of an autochthonous and specific microbiota of each artisanal cheesery. On the contrary, industrial manufacturing (I-CL) is oriented to both the control of the native microbiota and the achievement of a high uniform production of cheese attending to a high homogeneity of the quality parameters. On the other side, although both the studied types of cheese (I-CL and T-CL) were elaborated with raw milk, a heat treatment (68 °C for 15 s) is a standard procedure in industrial manufacturing (I-CL) to minimize the growth of psychrotrophic bacteria during the milk storage (4 °C). Such a procedure is not commonly used in small cheeseries (T-CL) in which the same milk is simply kept under refrigeration and used within 2 or 3 days. Both the thermal treatment together with the differences in microbiota might be determinant in the explanation of the detected differences between I-CL and T-CL cheeses observed [3,36,58].
Amino acid increment differences during ripening are directly related to their content in the milk caseins [58]. Tyrosine, phenylalanine, and tryptophan are related to the development of the aroma of cheese [62,63]. Concordantly, this would be related to the high aromatic development of Castellano cheeses at the end of ripening, in which an increase in relative signal intensity has been observed at 90 days of ripening, especially in T-CL.
The same behavior was shown by glutamic acid, which has been used as an indicator of maturation time and, not in vain, is considered as a producer of the umami taste [64,65]. Together, several authors linked glycine, alanine, proline, and threonine with a sweet flavor, whereas arginine, leucine, isoleucine, and lysine with a bitter one [50,64,66], thus contributing to the different sapid and aromatic features of the cheeses. Again, as mentioned above, these findings support the intensity of flavor and aroma shown by the ripened Castellano cheeses, coinciding with our results of a clear increase in the signals corresponding to amino acids at 90 days of ripening; particularly, in artisanal cheeses. In this line, Gómez-Ruiz et al. [67] and Ballesteros et al. [50] evaluated the intensity of odor and taste, respectively, of cheeses from industrial and traditional elaboration. In general, values of sensory attributes (odor, intensity, and persistence of taste and nuances of sheep milk, acid, spicy, and bitter tastes) were higher in traditional than in industrially elaborated pieces [68].
5. Conclusions
Carefully adjusting parameters such as temperature, spinning frequency, spectral width, repetition and echo times, pulse power, and relaxation filters is fundamental to obtaining reliable and reproducible results. Standardizing these parameters not only enhances data quality but also facilitates comparison across different experiments and laboratories. In addition, it minimizes artifacts and maximizes method sensitivity, thereby contributing to the robustness and validity of NMR analyses.
The analysis of Castellano cheeses with the HRMAS probe allows the monitoring of the maturation process from raw milk to cheese of both traditional and industrial elaboration. This technology offers the possibility to analyze simultaneously the evolution of different metabolites (carbohydrates, fatty acids, amino acids), thus allowing to differentiate, in a first phase, between two manufacturing procedures (artisanal and industrial) and the beginning and end of the ripening process. In addition, an NMR filter makes it possible to differentiate the lipidic part of the sample from the aqueous part, avoiding the tedious and error-source sample processing.
With the proper optimization, 1H-NMR HRMAS spectroscopy is a potent tool for the fingerprint profile obtention of sheep cheese of complex structure.
Supplementary Materials
The following supporting information can be downloaded at: https://www.mdpi.com/article/10.3390/analytica5020011/s1, Table S1: Manufacture characteristics of the studied Spanish sheep cheese; Table S2: Studied range and selected values for the optimization of the NMR parameters. Figure S1: Example of a 1H,1H-COSY spectrum for the structural elucidation of metabolites.
Author Contributions
Conceptualization, M.I.C.; software, D.C., P.V. and M.E.F.-V.; validation, V.R. and K.P.C.-D.; formal analysis, D.C. and J.S.; investigation, K.P.C.-D., V.R., D.C., P.V., M.I.C. and M.E.F.-V.; data curation, D.C., M.E.F.-V., P.V. and K.P.C.-D.; writing—original draft preparation, J.S. and M.I.C.; writing—review and editing, J.S., V.R., M.I.C. and D.C.; visualization, M.I.C., J.S. and K.P.C.-D.; supervision, M.I.C., M.D.R.d.Á. and D.C.; project administration, M.I.C. and M.D.R.d.Á.; funding acquisition, M.I.C. All authors have read and agreed to the published version of the manuscript.
Funding
This research received financial support from the project PID2019-107542RB-C22 funded by the Spanish Ministry of Science, Innovation and Universities.
Data Availability Statement
Data available upon request.
Acknowledgments
The authors gratefully acknowledge the support and in-kind contribution of samples, facilities, and people received from Fábrica de Quesos Pablo Alonso Martín, Zamora (Spain).
Conflicts of Interest
The authors declare no conflicts of interest. The funders had no role in the design of the study; in the collection, analyses, or interpretation of data; in the writing of the manuscript; or in the decision to publish the results.
References
- Sundekilde, U.K.; Eggers, N.; Bertram, H.C. NMR-based Metabolomics of food. In NMR Based Metabolomics: Methods and Protocols, 1st ed.; Gowda, G., Raftery, D., Eds.; Humana: New York, NY, USA, 2019; Volume 2037, pp. 335–344. [Google Scholar]
- Mazzei, P.; Piccolo, A. 1H HRMAS-NMR metabolomic to assess quality and traceability of Mozzarella cheese from Campania buffalo milk. Food Chem. 2012, 132, 1620–1627. [Google Scholar] [CrossRef] [PubMed]
- Piras, C.; Marincola, F.C.; Savorani, F.; Engelsen, S.B.; Cosentino, S.; Viale, S.; Pisano, M.B. A NMR metabolomics study of the ripening process of the Fiore Sardo cheese produced with autochthonous adjunct cultures. Food Chem. 2013, 141, 2137–2147. [Google Scholar] [CrossRef] [PubMed]
- Ritota, M.; Casciani, L.; Failla, S.; Valentini, M. HRMAS-NMR spectroscopy and multivariate analysis meat characterisation. Meat Sci. 2012, 92, 754–761. [Google Scholar] [CrossRef] [PubMed]
- García-García, A.B.; Lamichhane, S.; Castejón, D.; Cambero, M.I.; Bertram, H.C. 1H HR-MAS NMR-based metabolomics analysis for dry-fermented sausage characterization. Food Chem. 2018, 240, 514–523. [Google Scholar] [CrossRef] [PubMed]
- Castejón, D.; Villa, P.; Calvo, M.M.; Santa-Maria, G.; Herraiz, M.; Herrera, A. 1H-HRMAS NMR study of smoked Atlantic salmon (Salmo salar). Magn. Reson. Chem. 2010, 48, 693–703. [Google Scholar] [CrossRef]
- Sánchez Pérez, E.M.; García López, J.; Iglesias, M.J.; López Ortiz, F.; Toresano, F.; Camacho, F. HRMAS-nuclear magnetic resonance spectroscopy characterization of tomato “flavor varieties” from Almería (Spain). Food Res. Int. 2011, 44, 3212–3221. [Google Scholar] [CrossRef]
- Mucci, A.; Parenti, F.; Righi, V.; Schenetti, L. Citron and lemon under the lens of HR-MAS NMR spectroscopy. Food Chem. 2013, 141, 3167–3176. [Google Scholar] [CrossRef]
- Ritota, M.; Cozzolino, S.; Marconi, S.; Sequi, P.; Valentini, M.; Marini, F. Metabolic profiling of sweet pepper (Capsicum annuum L.) by means of HRMAS-NMR spectroscopy. Acta Hortic. 2012, 932, 279–284. [Google Scholar] [CrossRef]
- Ritota, M.; Casciani, L.; Han, B.Z.; Cozzolino, S.; Leita, L.; Sequi, P.; Valentini, M. Traceability of Italian garlic (Allium sativum L.) by means of HRMAS-NMR spectroscopy and multivariate data analysis. Food Chem. 2012, 135, 684–693. [Google Scholar] [CrossRef]
- Caprara, C.D.C.; Mathias, T.K.; Santos, M.D.C.; D’Oca, M.G.M.; D’Oca, C.D.M.; Roselet, F.; Abreu, P.C.; Ramos, D.F. Application of 1H HR-MAS NMR-based metabolite fingerprinting of marine microalgae. Metabolites 2023, 13, 202. [Google Scholar] [CrossRef]
- Bertram, H.C. NMR-based metabolomics: Quality and authenticity of milk and meat. In Modern Magnetic Resonance, 2nd ed.; Webb, G.A., Ed.; Springer International Publishing: Cham, Switzerland, 2018; pp. 1729–1741. [Google Scholar] [CrossRef]
- Medina, M.; Nuñez, M. Cheeses from ewe and goat milk. In Cheese, 4th ed.; McSweeney, P.L.H., Fox, P.F., Cotter, P.D., Everett, D.W., Eds.; Academic Press: San Diego, CA, USA, 2017; pp. 1069–1091. [Google Scholar]
- Kalyankar, S.D.; Sarode, A.R.; Khedkar, C.D.; Deosarkar, S.S.; Pawshe, R.D. Sheep: Milk. In Encyclopedia of Food and Health; Caballero, B., Finglas, P.M., Toldrá, F., Eds.; Academic Press: Oxford, UK, 2016; pp. 758–763. [Google Scholar]
- Fernández, D.; Arenas, R.; Ferrazza, R.E.; Tornadijo, M.E.; Baro, J.M.F. Zamorano cheese. In Handbook of Animal-Based Fermented Good and Beverage Technology, 2nd ed.; Hui, Y.H., Evranuz, E.O., Eds.; CRC Press Taylor & Francis Group: Boca Ratón, FL, USA, 2012; Volume 2, pp. 397–415. [Google Scholar]
- Official Journal of the European Communities COMMISSION REGULATION (EC) No 1107/96 of 12 June 1996 on the Registration of Geographical Indications and Designations of Origin under the Procedure Laid down in Article 17 of Council Regulation (EEC) No 2081/92. Available online: https://eur-lex.europa.eu/legal-content/EN/ALL/?uri=CELEX%3A31996R1107 (accessed on 27 March 2024).
- Official Journal of the European Union. COMMISSION IMPLEMENTING REGULATION (EU) 2020/247 of 18 February 2020 Entering a Name in the Register of Protected Designations of Origin and Protected Geographical Indications [‘Queso Castellano’ (PGI)]. Available online: https://eur-lex.europa.eu/legal-content/EN/TXT/?uri=CELEX%3A32020R0247 (accessed on 27 March 2024).
- Abedini, A.; Salimi, M.; Mazaheri, Y.; Sadighara, P.; Alizadeh Sani, M.; Assadpour, E.; Jafari, S.M. Assessment of cheese frauds, and relevant detection methods: A systematic review. Food Chem. X 2023, 19, 100825. [Google Scholar] [CrossRef] [PubMed]
- Valdés, A.; Álvarez-Rivera, G.; Socas-Rodríguez, B.; Herrero, M.; Ibáñez, E.; Cifuentes, A. Foodomics: Analytical opportunities and challenges. Anal. Chem. 2022, 94, 366–381. [Google Scholar] [CrossRef]
- Fernández, D.; Combarros-Fuertes, P.; Renes, E.; Abarquero, D.; Fresno, J.M.; Tornadijo, M.E. Influence of the breed of sheep on the characteristics of Zamorano cheese. Dairy 2021, 2, 242–255. [Google Scholar] [CrossRef]
- Cardin, M.; Cardazzo, B.; Mounier, J.M.; Novelli, E.; Coton, M.; Coton, E. Authenticity and typicity of traditional cheeses: A review on geographical origin authentication methods. Foods 2022, 11, 3379. [Google Scholar] [CrossRef]
- Scano, P.; Anedda, R.; Melis, M.P.; Dessi’, M.A.; Lai, A.; Roggio, T. 1H- and 13C-NMR characterization of the molecular components of the lipid fraction of Pecorino Sardo cheese. J. Am. Oil Chem. Soc. 2011, 88, 1305–1316. [Google Scholar] [CrossRef]
- Zacharias, H.U.; Altenbuchinger, M.; Gronwald, W. Statistical analysis of NMR metabolic fingerprints: Established methods and recent advances. Metabolites 2018, 8, 47. [Google Scholar] [CrossRef]
- Shintu, L.; Caldarelli, S. Toward the determination of the geographical origin of Emmental(er) cheese via High Resolution MAS NMR: A preliminary investigation. J. Agric. Food Chem. 2006, 54, 4148–4154. [Google Scholar] [CrossRef] [PubMed]
- Jensen, H.M.; Bertram, H.C. The magic angle view to food: Magic-angle spinning (MAS) NMR spectroscopy in food science. Metabolomics 2019, 15, 44. [Google Scholar] [CrossRef]
- Giraudeau, P.; Silvestre, V.; Akoka, S. Optimizing water suppression for quantitative NMR-based metabolomics: A tutorial review. Metabolomics 2015, 11, 1041–1055. [Google Scholar] [CrossRef]
- Hassan, Q.; Dutta Majumdar, R.; Wu, B.; Lane, D.; Tabatabaei-Anraki, M.; Soong, R.; Simpson, M.J.; Simpson, A.J. Improvements in lipid suppression for 1H NMR-based metabolomics: Applications to solution-state and HR-MAS NMR in natural and in vivo samples. Magn. Reson. Chem. 2019, 57, 69–81. [Google Scholar] [CrossRef]
- Singh, U.; Alsuhaymi, S.; Al-Nemi, R.; Emwas, A.-H.; Jaremko, M. Compound-specific 1D 1H NMR pulse sequence selection for metabolomics analyses. ACS Omega 2023, 8, 23651–23663. [Google Scholar] [CrossRef]
- Balthazar, C.F.; Pimentel, T.C.; Ferrão, L.L.; Almada, C.N.; Santillo, A.; Albenzio, M.; Mollakhalili, N.; Mortazavian, A.M.; Nascimento, J.S.; Silva, M.C.; et al. Sheep milk: Physicochemical characteristics and relevance for functional food development. Compr. Rev. Food Sci. Food Saf. 2017, 16, 247–262. [Google Scholar] [CrossRef] [PubMed]
- Balthazar, C.F.; Guimarães, J.d.T.; Rocha, R.S.; Pimentel, T.C.; Neto, R.P.C.; Tavares, M.I.B.; Graça, J.S.; Filho, E.G.A.; Freitas, M.Q.; Esmerino, E.A.; et al. Nuclear magnetic resonance as an analytical tool for monitoring the quality and authenticity of dairy foods. Trends Food Sci. Technol. 2021, 108, 84–91. [Google Scholar] [CrossRef]
- Sundekilde, U.K.; Larsen, L.B.; Bertram, H.C. NMR-Based milk metabolomics. Metabolites 2013, 3, 204–222. [Google Scholar] [CrossRef] [PubMed]
- Raynal-Ljutovac, K.; Lagriffoul, G.; Paccard, P.; Guillet, I.; Chilliard, Y. Composition of goat and sheep milk products: An update. Small Rumin. Res. 2008, 79, 57–72. [Google Scholar] [CrossRef]
- Rocchetti, G.; Becchi, P.P.; Salis, L.; Lucini, L.; Cabiddu, A. Impact of pasture-based diets on the untargeted metabolomics profile of Sarda sheep milk. Foods 2023, 12, 143. [Google Scholar] [CrossRef] [PubMed]
- Rocchetti, G.; O’Callaghan, T.F. Application of metabolomics to assess milk quality and traceability. Curr. Opin. Food Sci. 2021, 40, 168–178. [Google Scholar] [CrossRef]
- Eltemur, D.; Robatscher, P.; Oberhuber, M.; Scampicchio, M.; Ceccon, A. Applications of solution NMR spectroscopy in quality assessment and authentication of bovine milk. Foods 2023, 12, 3240. [Google Scholar] [CrossRef] [PubMed]
- Abarquero, D.; Bodelon, R.; Manso, C.; Rivero, P.; Fresno, J.M.; Tornadijo, M.E. Effect of autochthonous starter and non-starter cultures on the physicochemical, microbiological and sensorial characteristics of Castellano cheese. Int. J. Dairy Technol. 2023, 77, 234–245. [Google Scholar] [CrossRef]
- Sharma, H.; Ozogul, F.; Bartkiene, E.; Rocha, J.M. Impact of lactic acid bacteria and their metabolites on the techno-functional properties and health benefits of fermented dairy products. Crit. Rev. Food Sci. Nutr. 2023, 63, 4819–4841. [Google Scholar] [CrossRef]
- Garde, S.; Gaya, P.; Arias, R.; Núñez, M. Enhanced PFGE protocol to study the genomic diversity of Clostridium spp. isolated from Manchego cheeses with late blowing defect. Food Control 2012, 28, 392–399. [Google Scholar] [CrossRef]
- Gore, E.; Mardon, J.; Guerinon, D.; Lebecque, A. Exploratory study of acid-forming potential of commercial cheeses: Impact of cheese type. Int. J. Food Sci. Nutr. 2016, 67, 412–421. [Google Scholar] [CrossRef] [PubMed]
- Buffa, M.; Guamis, B.; Saldo, J.; Trujillo, A.J. Changes in organic acids during ripening of cheeses made from raw, pasteurized or high-pressure-treated goats’ milk. LWT-Food Sci. Technol. 2004, 37, 247–253. [Google Scholar] [CrossRef]
- Tormo, M.; Izco, J.M. Alternative reversed-phase high-performance liquid chromatography method to analyse organic acids in dairy products. J. Chromatogr. A 2004, 1033, 305–310. [Google Scholar] [CrossRef] [PubMed]
- Thomas, T.D.; McKay, L.L.; Morris, H.A. Lactate metabolism by pediococci isolated from cheese. Appl. Environ. Microbiol. 1985, 49, 908–913. [Google Scholar] [CrossRef]
- Lombardi, A.M.; Bevilacqua, A.E.; Califano, A.N. Variation in organic-acids content during ripening of Reggianito cheese in air-tight sealed bags. Food Chem. 1994, 51, 221–226. [Google Scholar] [CrossRef]
- Califano, A.N.; Bevilacqua, A.E. Freezing low moisture Mozzarella cheese: Changes in organic acid content. Food Chem. 1999, 64, 193–198. [Google Scholar] [CrossRef]
- Califano, A.N.; Bevilacqua, A.E. Multivariate analysis of the organic acids content of Gouda type cheese during ripening. J. Food Compost. Anal. 2000, 13, 949–960. [Google Scholar] [CrossRef]
- Lues, J.F.R.; Bekker, A.C.M. Mathematical expressions for organic acids in early ripening of a Cheddar cheese. J. Food Compost. Anal. 2002, 15, 11–17. [Google Scholar] [CrossRef]
- St-Gelais, D.; Doyon, G.; Rolland, J.R.; Goulet, J. Sugar and organic acid concentrations during ripening of Cheddar cheese-like products. Milchwiss.-Milk Sci. Int. 1991, 46, 288–291. [Google Scholar]
- Upreti, P.; McKay, L.L.; Metzger, L.E. Influence of calcium and phosphorus, lactose, and salt-to-moisture ratio on Cheddar cheese quality: Changes in residual sugars and water-soluble organic acids during ripening. J. Dairy Sci. 2006, 89, 429–443. [Google Scholar] [CrossRef] [PubMed]
- Silva, L.F.; Sunakozawa, T.N.; Monteiro, D.A.; Casella, T.; Conti, A.C.; Todorov, S.D.; Barretto Penna, A.L. Potential of cheese-associated lactic acid bacteria to metabolize citrate and produce organic acids and acetoin. Metabolites 2023, 13, 1134. [Google Scholar] [CrossRef] [PubMed]
- Ballesteros, C.; Poveda, J.M.; González-Vinas, M.A.; Cabezas, L. Microbiological, biochemical and sensory characteristics of artisanal and industrial Manchego cheeses. Food Control 2006, 17, 249–255. [Google Scholar] [CrossRef]
- Izco, J.M.; Torre, P. Characterisation of volatile flavour compounds in Roncal cheese extracted by the ‘purge and trap’ method and analysed by GC-MS. Food Chem. 2000, 70, 409–417. [Google Scholar] [CrossRef]
- Bintsis, T.; Robinson, R.K. A study of the adjunct cultures on the aroma compounds of feta-type cheese. Food Chem. 2004, 88, 435–441. [Google Scholar] [CrossRef]
- Ali, A.H.; Abd El-Wahed, E.M.; Abed, S.M.; Korma, S.A.; Wei, W.; Wang, X.G. Analysis of triacylglycerols molecular species composition, total fatty acids, and sn-2 fatty acids positional distribution in different types of milk powders. J. Food Meas. Charact. 2019, 13, 2613–2625. [Google Scholar] [CrossRef]
- Santamarina-García, G.; Amores, G.; Hernández, I.; Morán, L.; Barrón, L.J.R.; Virto, M. Relationship between the dynamics of volatile aroma compounds and microbial succession during the ripening of raw ewe milk-derived Idiazabal cheese. Curr. Res. Food Sci. 2023, 6, 100425. [Google Scholar] [CrossRef] [PubMed]
- Yener, S.; Pacheco-Pappenheim, S.; Heck, J.M.L.; van Valenberg, H.J.F. Seasonal variation in the positional distribution of fatty acids in bovine milk fat. J. Dairy Sci. 2021, 104, 12274–12285. [Google Scholar] [CrossRef]
- Fontecha, J.; Goudjil, H.; Ríos, J.J.; Fraga, M.J.; Juárez, M. Identity of the major triacylglycerols in ovine milk fat. Int. Dairy J. 2005, 15, 1217–1224. [Google Scholar] [CrossRef]
- Luna, P.; Juárez, M.; Ángel de la Fuente, M. Conjugated linoleic acid content and isomer distribution during ripening in three varieties of cheeses protected with designation of origin. Food Chem. 2007, 103, 1465–1472. [Google Scholar] [CrossRef]
- Ali, A.H.; Khalifa, S.A.; Gan, R.-Y.; Shah, N.; Ayyash, M. Fatty acids, lipid quality parameters, and amino acid profiles of unripened and ripened cheeses produced from different milk sources. J. Food Compos. Anal. 2023, 123, 105588. [Google Scholar] [CrossRef]
- Prandini, A.; Sigolo, S.; Piva, G. Conjugated linoleic acid (CLA) and fatty acid composition of milk, curd and Grana Padano cheese in conventional and organic farming systems. J. Dairy Res. 2009, 76, 278–282. [Google Scholar] [CrossRef] [PubMed]
- Meľuchová, B.; Blaško, J.; Kubinec, R.; Górová, R.; Dubravská, J.; Margetín, M.; Soják, L. Seasonal variations in fatty acid composition of pasture forage plants and CLA content in ewe milk fat. Small Rumin. Res. 2008, 78, 56–65. [Google Scholar] [CrossRef]
- Polo, C.; Ramos, M.; Sánchez, R. Free amino acids by High performance liquid chromatography and peptides by gel electrophoresis in Mahón cheese during ripening. Food Chem. 1985, 16, 85–96. [Google Scholar] [CrossRef]
- Irigoyen, A.; Ortigosa, M.; Juansaras, I.; Oneca, M.; Torre, P. Influence of an adjunct culture of Lactobacillus on the free amino acids and volatile compounds in a Roncal-type ewe’s-milk cheese. Food Chem. 2007, 100, 71–80. [Google Scholar] [CrossRef]
- Alves Bezerra, T.K.; de Oliveira Arcanjo, N.M.; Ribeiro de Araujo, A.R.; Meneses de Queiroz, A.L.; Gomes de Oliveira, M.E.; Pereira Gomes, A.M.; Madruga, M.S. Volatile profile in goat Coalho cheese supplemented with probiotic lactic acid bacteria. LWT-Food Sci. Technol. 2017, 73, 209–215. [Google Scholar] [CrossRef]
- Varming, C.; Andersen, L.T.; Petersen, M.A.; Ardö, Y. Flavour compounds and sensory characteristics of cheese powders made from matured cheeses. Int. Dairy J. 2013, 30, 19–28. [Google Scholar] [CrossRef]
- Andersen, L.T.; Ardo, Y.; Bredie, W.L.P. Study of taste-active compounds in the water-soluble extract of mature Cheddar cheese. Int. Dairy J. 2010, 20, 528–536. [Google Scholar] [CrossRef]
- Kuhfeld, R.F.; Eshpari, H.; Atamer, Z.; Dallas, D.C. A comprehensive database of cheese-derived bitter peptides and correlation to their physical properties. Crit. Rev. Food Sci. Nutr. 2023, 1–15. [Google Scholar] [CrossRef]
- Gómez-Ruiz, J.A.; Ballesteros, C.; Vinas, M.A.G.; Cabezas, L.; Martínez-Castro, I. Relationships between volatile compounds and odour in Manchego cheese: Comparison between artisanal and industrial cheeses at different ripening times. Lait 2002, 82, 613–628. [Google Scholar] [CrossRef][Green Version]
- Kochetkova, T.V.; Grabarnik, I.P.; Klyukina, A.A.; Zayulina, K.S.; Gavirova, L.A.; Shcherbakova, P.A.; Kachmazov, G.S.; Shestakov, A.I.; Kublanov, I.V.; Elcheninov, A.G. The bacterial microbiota of artisanal cheeses from the Northern Caucasus. Fermentation 2023, 9, 719. [Google Scholar] [CrossRef]
Disclaimer/Publisher’s Note: The statements, opinions and data contained in all publications are solely those of the individual author(s) and contributor(s) and not of MDPI and/or the editor(s). MDPI and/or the editor(s) disclaim responsibility for any injury to people or property resulting from any ideas, methods, instructions or products referred to in the content. |
© 2024 by the authors. Licensee MDPI, Basel, Switzerland. This article is an open access article distributed under the terms and conditions of the Creative Commons Attribution (CC BY) license (https://creativecommons.org/licenses/by/4.0/).