Proceeding Paper

Simultaneous Quantification of Four Principal NSAIDs through Voltammetry and Artificial Neural Networks Using a Modified Carbon Paste Electrode in Pharmaceutical Samples †

by
Guadalupe Yoselin Aguilar-Lira
1,
Prisciliano Hernandez
2,
Giaan Arturo Álvarez-Romero
1 and
Juan Manuel Gutiérrez
3,*
1
Laboratorio de Química Analítica, Área Académica de Química, Instituto de Ciencias Básicas e Ingeniería, Universidad Autónoma del Estado de Hidalgo, Carretera Pachuca-Tulancingo km. 4.5, Mineral de la Reforma 42076, Mexico
2
Laboratorio de Ingeniería y Energía, Área de Energía, Universidad Politécnica de Francisco I. Madero, Domicilio Conocido, Tepatepec 42640, Mexico
3
Sección de Bioelectrónica, Departamento de Ingeniería Eléctrica, Centro de Investigación y de Estudios Avanzados del I.P.N., Col San Pedro Zacatenco, Av. IPN 2508, Ciudad de Mexico 07360, Mexico
*
Author to whom correspondence should be addressed.
Presented at the 1st International Electronic Conference on Chemical Sensors and Analytical Chemistry, 1–15 July 2021; Available online: https://csac2021.sciforum.net/.
Chem. Proc. 2021, 5(1), 3; https://doi.org/10.3390/CSAC2021-10450
Published: 30 June 2021

Abstract

:
This work describes the development of a novel and low-cost methodology for the simultaneous quantification of four main nonsteroidal anti-inflammatory drugs (NSAIDs) in pharmaceutical samples using differential pulse voltammetry coupled with an artificial neural network model (ANN). The working electrode used as a detector was a carbon paste electrode (CPE) modified with multi-wall carbon nanotubes (MWCNT-CPE). The specific voltammetric determination of the drugs was performed by cyclic voltammetry (CV). Some characteristic anodic peaks were found at potentials of 0.446, 0.629, 0.883 V related to paracetamol, diclofenac, and aspirin. For naproxen, two anodic peaks were found at 0.888 and 1.14 V and for ibuprofen, an anodic peak was not observed at an optimum pH of 10 in 0.1 mol L−1 Britton–Robinson buffer. Since these drug’s oxidation process turned out to be irreversible and diffusion-controlled, drug quantification was carried out by differential pulse voltammetry (DPV). The Box Behnken design technique’s optimal parameters were: step potential of 5.85 mV, the amplitude of 50 mV, period of 750 ms, and a pulse width of 50 ms. A data pretreatment was carried out using the Discrete Wavelet Transform using the db4 wavelet at the fourth decomposition level applied to the voltammetric records obtained. An ANN was built to interpret the obtained approximation coefficients of voltammograms generated at different drug concentrations to calibrate the system. The ANN model’s architecture is based on a Multilayer Perceptron Network (MLP) that employed a Bayesian regularization training algorithm. The trained MLP achieves significant R values for the test data to simultaneous quantification of the four drugs in the presence of aspirin.

1. Introduction

Nonsteroidal anti-inflammatory analgesics NSAIDs are important drugs worldwide due to their low cost and easy accessibility. Most of these drugs can be purchased without a prescription; they are widely used to relieve pain, reduce inflammation and reduce high temperatures. Standing out from this large group of NSAIDs are paracetamol, diclofenac, naproxen, aspirin, and ibuprofen, which are the most frequently used. The pharmacological action of these drugs is that they block the enzyme cyclooxygenase and break down the prostaglandins produced by the cells of the body that increase inflammation, pain, and fever. Although NSAIDs are commonly used, they are not suitable for everyone and can sometimes cause adverse side effects if their use is constant: peptic ulceration, digestive disorders, temporary deafness. Recent studies mention that they may be related to heart attacks [1,2,3]. Due to the high demand for NSAIDs in pharmaceutical samples, many analytical methods have been proposed for their quantification, the most common being liquid chromatography (HPLC) [4]. This method has some disadvantages, such as the need for sample preparation by chemical reaction or extraction. Some cases include previous derivatization, long analysis times, and a high cost associated with the use and maintenance of the equipment.
An alternative to traditional analysis methods in areas such as the food industry, pharmaceuticals, and environmental monitoring is known as Electronic Tongues (ETs) [5,6]. These systems combine electrochemical techniques (e.g., potentiometry, voltammetry, and impedance spectroscopy) with sophisticated multivariate analysis tools to classify or quantify samples [7]. Their main advantage compared to traditional methods is that they allow quick and low-cost measurements, avoiding the pretreatment of samples in most cases. Although ETs using potentiometric and voltammetric techniques have been reported in the literature [8,9], voltammetric methods are usually the most widespread due to their advantages such as short analysis time and high sensitivity [10,11]. In addition to this, data processing techniques based on artificial neural networks (ANNs), principal component analysis (PCA), and partial least squares (PLS) are popular for decoding the acquired voltammograms of aqueous solutions containing mixtures of different chemical species giving results favorable in the quantification of these species [12,13]. In this work, a methodology based on voltammetric methods is proposed together with ANNs as a modeling and calibration tool to quantify NSAIDs simultaneously.

2. Methods and Materials

2.1. Instrumentation and Reagents

The chemical reagents used are of an analytical grade. All solutions used were prepared using high purity deionized water (18.2 MΩ cm). The experiments were carried out using a potentiostat Autolab PGSTAT302N (Metrohm, Utrecht, The Netherlands) connected to a computer. A three-electrode system was used consisting of a reference electrode with saturated Ag/AgCl (BASi), a graphite bar as the auxiliary electrode, and a carbon paste electrode (CPE) modified with multi-wall carbon nanotubes (MWCNT-CPE) OD × L 6–9 nm × 5 µm> 95% (Sigma-Aldrich, CAS 308068-56-6, Mexico) as working electrode. The pH measurements were performed on a Corning pH/Ion meter 450 digital pH meter. A Sartorius CPA224S brand analytical balance was used. All the potentials referred to in this work are referred to the Ag/AgCl electrode. Standard solutions of diclofenac sodium, naproxen sodium, paracetamol, aspirin, and ibuprofen (Sigma-Aldrich, México) were flushed with high purity nitrogen. A Britton–Robinson (BR) 0.1 mol·L−1 buffer solution was used in a range of pH 7–11. Buffer BR was prepared by mixing appropriate volumes of acids (phosphoric acid, boric acid, and acetic acid) and adjusted with concentrated NaOH to the desired pH.

2.2. Electrochemical Characterization

2.2.1. Electrode Preparation

The paste mixture for the proposed working electrode consisted of a 3:2 ratio for mineral oil and multi-walled carbon nanotube graphite powder (MWCNT). The graphite mix is made up of 30% graphite powder and 10% MWCNT. The paste obtained is placed with a spatula in a 1 mL syringe tube (30 mm long by 6 mm wide) and compacted with the syringe’s plunger, placing it on a flat surface until excess air is eliminated. At one end of the syringe with the paste, the electrical contact (copper wire) is placed. Finally, the working electrode is built.

2.2.2. Electrochemical Analysis of the NSAIDs in the Proposed Working Electrode

Cyclic voltammetry (CV) is performed for the supporting electrolyte (0.1 molL−1 BR buffer at pH 7) and the NSAIDs-BR system (5 × 10⁻⁴ mol·L−1 for each drug), starting at the zero-current potential, in anodic direction and cycling in a potential window from 0 to 1.3 V considering a scan rate of 0.1 Vs−1. At different scan rates, anodic and cathodic CV peaks were analyzed to determine the mechanism that controls the oxidative processes. Moreover, a pH study for the NSAIDs-BR system was performed to choose the maximum anodic current intensity for analytical quantification.
Quantification of the drug is carried out by DPV. The optimization of the parameters of the technique is carried out, with the Box Behnken (BBD) four-factor design, step potential “X1” (V), interval time “X2” (s), modulation time “X3” (s) y modulation amplitude “X4” (V) and three levels for each factor so that the highest intensity of the anodic current is obtained. The design matrix considers 27 experimental units at random that include the three replicas of the central point. Using a polynomial regression, the response variable was predicted as a function of the independent variables and their interactions. The prediction of the model is described in Equation (1).
Y = β 0 + i = 1 K β i X i + i = 1 k β i i X i 2 + i = 1 k j = 1 k β i j X i X j + ε ,
where Y is the response variable (maximum anode current intensity), Xi and Xj are coded independent variables, and β0, βi, βii, and βij are coefficients of intercept, linear, quadratic, and interaction terms, respectively. k is the number of independent variables (k = 4 in this study), ε is an experimental error [14]. Determination and regression coefficients were estimated using Minitab® Statistical software version 18.

2.3. Quantification of NSAIDs by ANN

2.3.1. Data Processing

Having the optimal parameters of the DPV, the DPV’s are carried out at different concentrations of the NSAIDs (ranging from 5 × 10⁻⁷ to 7 × 10⁻⁵ mol·L−1). A matrix of peak intensities of dimensions [189 × 27] (intensities x number of samples) was built with the recorded voltammogram records. The pretreatment of the data was carried out using the Discrete Wavelet Transform using the 4th level wavelet decomposition of a Daubechies function (db4). In this pretreatment, only approximation coefficients were chosen considering the degree of similarity between the original voltammogram and the one recovered with these coefficients [13]. Thus, the final input matrix to feed the ANN model has a dimension of [18 × 27] (approximation coefficients x number of samples). The ANN calibration model is based on a Multilayer Perceptron Network (MLP). The MLP input layer was established considering the number of approximation wavelet coefficients. In contrast, the output layer was defined using one neuron for each of the analytes to be quantified since it is associated with the matrix of concentrations of dimension [4 × 27] (i.e., paracetamol, diclofenac, naproxen, and ibuprofen), aspirin was not quantified in the model as it was considered only as an interferer. The hidden layers were established through a trial-and-error process, modifying the number of neurons in the layers until an appropriate number of neurons were found that favored obtaining a satisfactory linear regression coefficient. In this way, the final MLP model was 18 × 10 × 8 × 4 (18 input neurons, 10 neurons in the first hidden layer, 8 neurons in the second hidden layer and 4 output neurons).

2.3.2. ANN Modeling

The described data set of 27 samples, were selected for the training set. The testing set was conformed using an external set of 10 additional samples randomly generated within the concentration range described above. All data sets were normalized in the interval of [−1, 1] to favor the training process. The activation functions established were: purelin for the input layer, tansing for the two hidden layers, and purelin for the output layer. In the same way, the chosen training algorithm was Bayesian regularization, with a training error set at a value of 0.001, together with a learning rate of 0.01. The MLP models were programmed on the MATLAB® R2021a (MathWorks, Natick, MA, USA) platform using the Deep Learning and Wavelet Toolboxes.

3. Results and Discussion

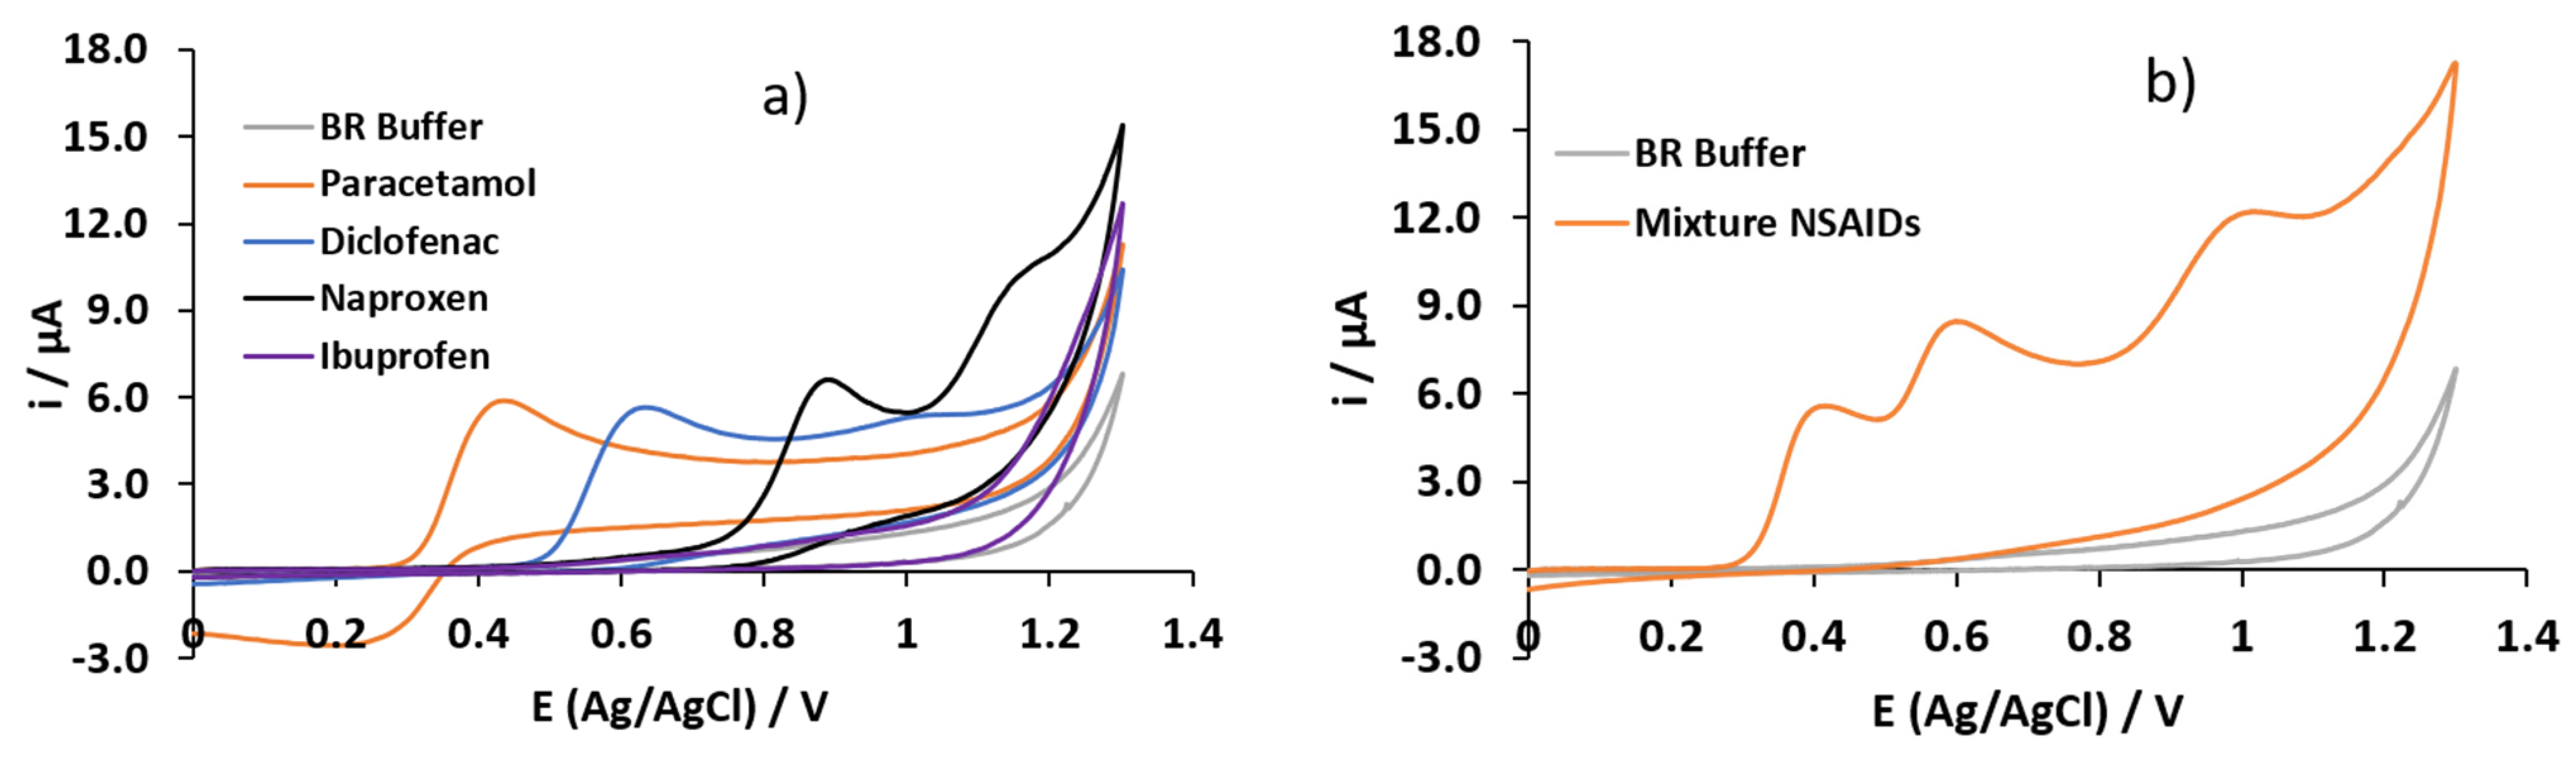
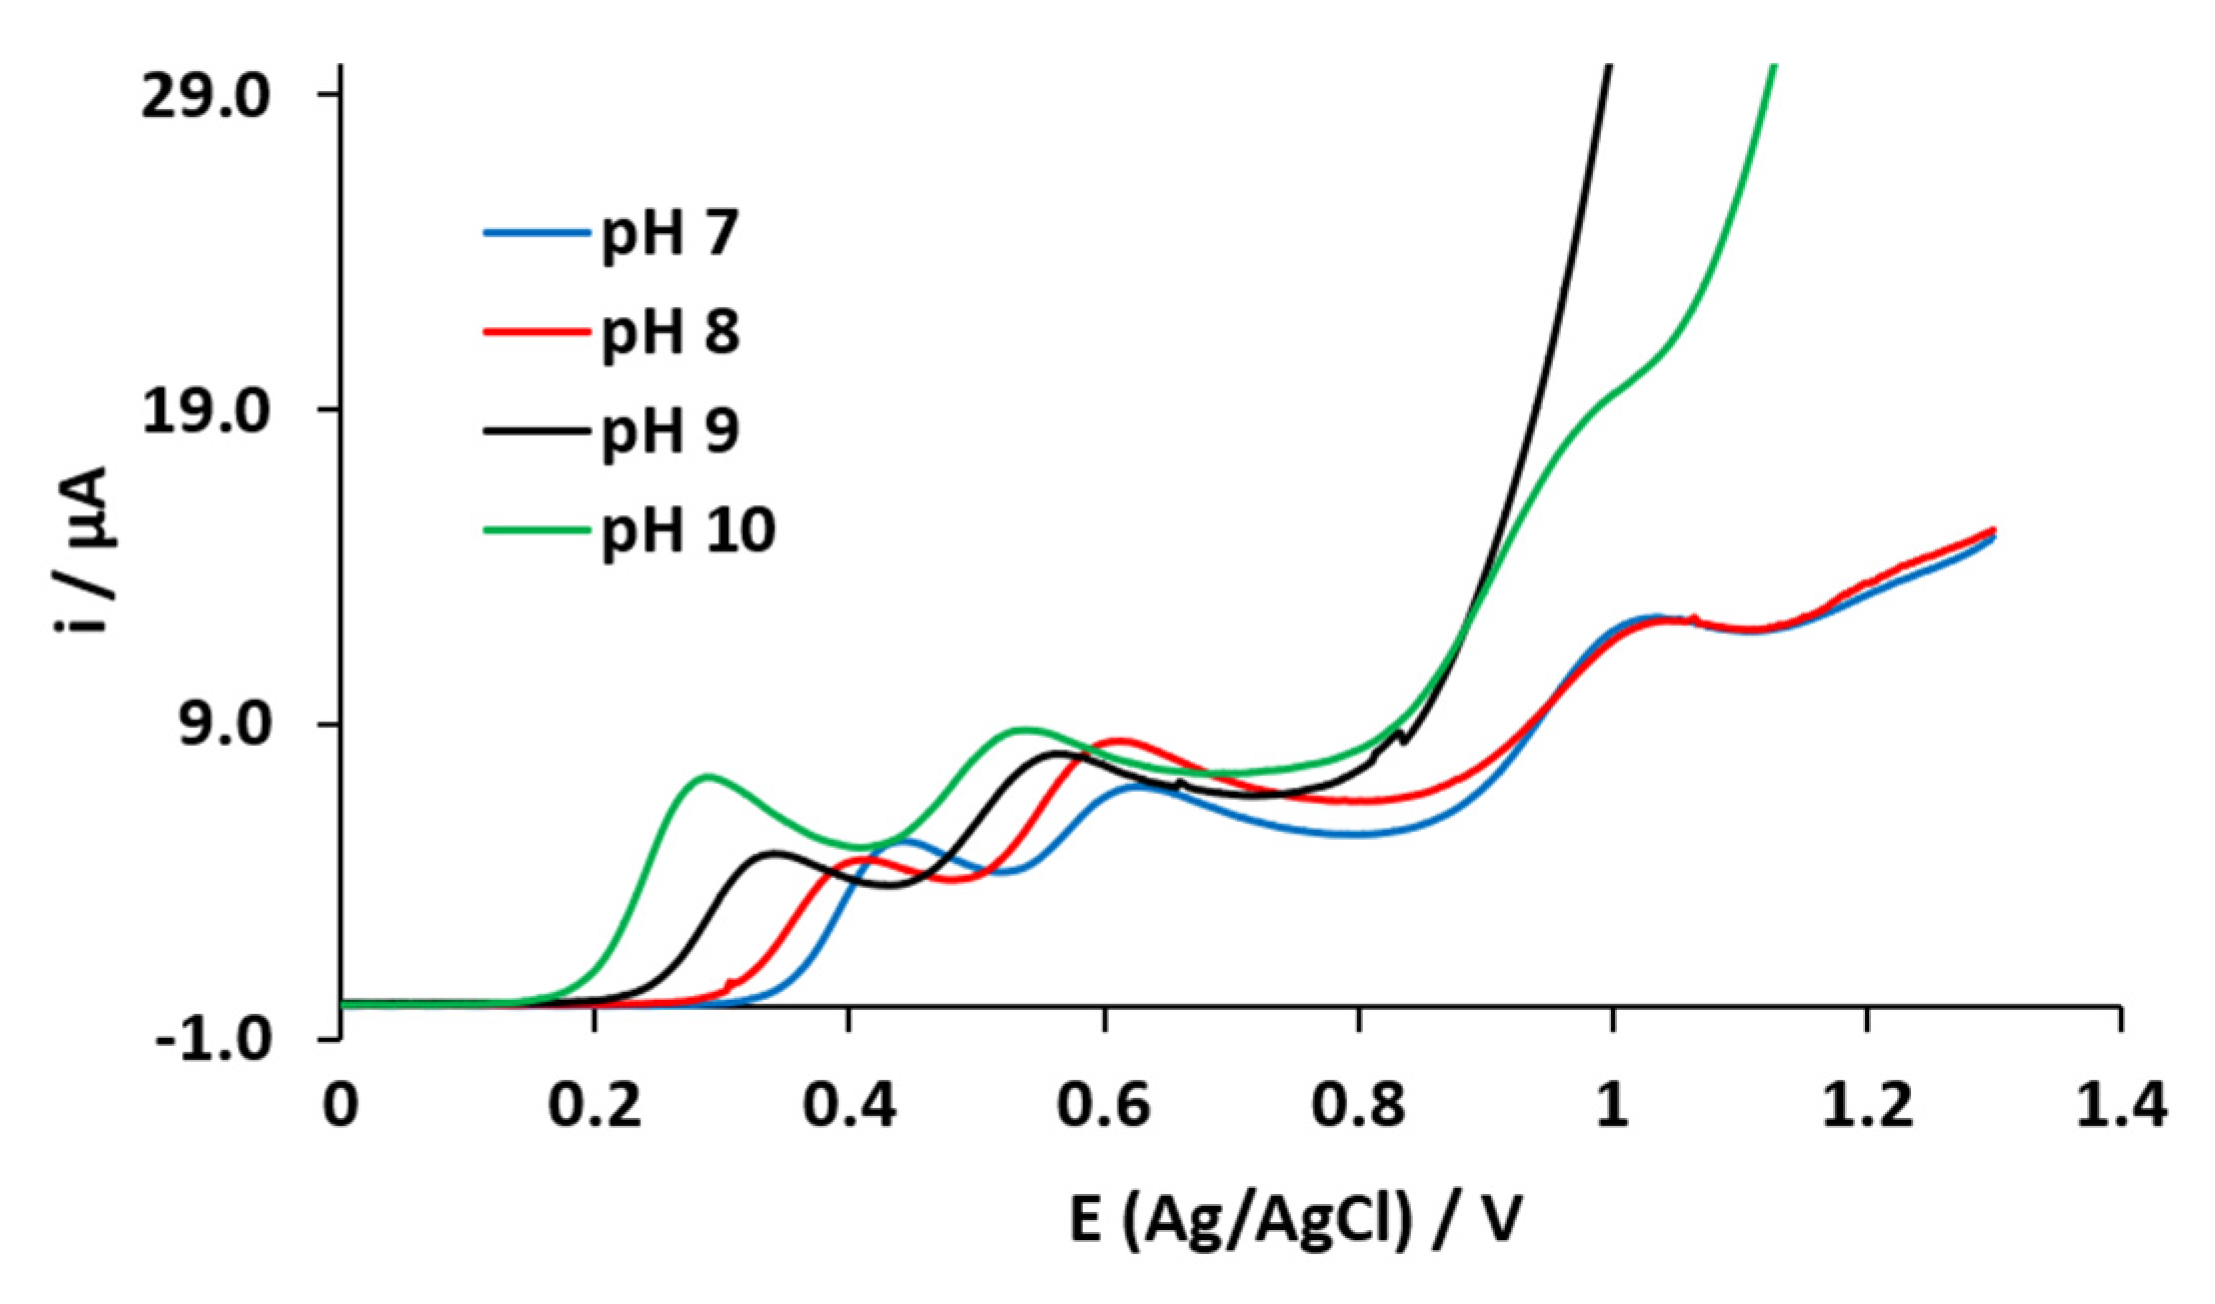
3.1. Electrochemical Characterization

The electrochemical study of the NSAIDs was carried out by CV in a solution of 4 × 10⁻⁴ mol·L−1 of the drug standards, in BR buffer at pH 7 (Figure 1a). In the window from 0 to 1.3 V in the first sweep in the anodic direction, the oxidation peak corresponding to paracetamol, diclofenac, at a potential of 0.446 and 0.629, respectively, was observed. Naproxen presented two oxidation peaks at a potential of 0.888 and 1.14 V. In the case of ibuprofen, no anodic signal was observed, but the baseline was modified compared to the blank, so we believe that if it is carried out by the oxidation of the drug. Reversing the sweep in the cathodic direction, only one reduction peak was observed with a maximum peak potential at 0.263 V, which corresponds to the reduction of paracetamol. Moreover, a CV was performed in a mixture of the five NSAIDS and the BR Buffer (blank) using the proposed working electrode (Figure 1b), under the same conditions of the systems shown in Figure 1a. In Figure 1b, only three oxidation peaks can be observed in the anodic sense, since some signals overlap in the drugs, and it should also be noted that in the cathodic sweep the reduction signal of paracetamol is not observed, and this could be because the product that was reduced reacted chemically with some oxidation products of the other drugs and the product is no longer electroactive in reduction.
Considering the anodic wave corresponding to the oxidation of the NSAIDs for the mixture of the drugs. A pH study was carried out by CV, in a 0.1 mol L−1 BR buffer with a concentration of 5 × 10⁻⁴ mol L−1 for each drug, in Figure 2 the anodic sweep is shown. It can be observed that the highest current intensity is obtained at pH 10 for the mixture of drugs; it can also be observed that as the pH increases the anodic peak potentials of the drugs shift to lower values. Different CV scan rates (10 to 300 mV·s−1) were studied, and the maximum anodic peak current was plotted vs. the square root of the scan rate for each NSAID. A correlation coefficient greater than 0.99 was obtained after the proper statistical analysis, which suggests that the diffusion of the electroactive species to the surface of the electrode governs the oxidation processes.
A BBD with three levels was used for the optimization of the four variables related to the DPV technique to maximize the anodic current peak of paracetamol (this NSAID has the highest peak current intensity). Twenty-seven experiments were carried out, generating the corresponding voltammograms of NSAIDs using the MWCNT-CPE at pH 10. The parameters of the DPV technique were chosen considering the capabilities of the potentiostat used. The proposed second-order model regression that correlates the current response and the DPV factors is shown in Equation (2).
Y = 1.747 + 0.22 X 1 + 0.352 X 2 0.935 X 3 + 1.082 X 4   0.476 X 2 2 0.431 X 2 2 0.308 X 3 2 0.012 X 4 2 0.309 X 1 X 2 + 0.211 X 1 X 3 + 0.209 X 1 X 4 + 0.297 X 2 X 3 + 0.66 X 2 X 4 + 1.507 X 3 X 4 .
Table 1 shows the theoretical response (Y) after the optimization of the DPV parameters, obtained by using the Response Optimizer function in the Minitab® V.18 software. The maximum anodic current for paracetamol was determined as 5.24 µA under optimal conditions.

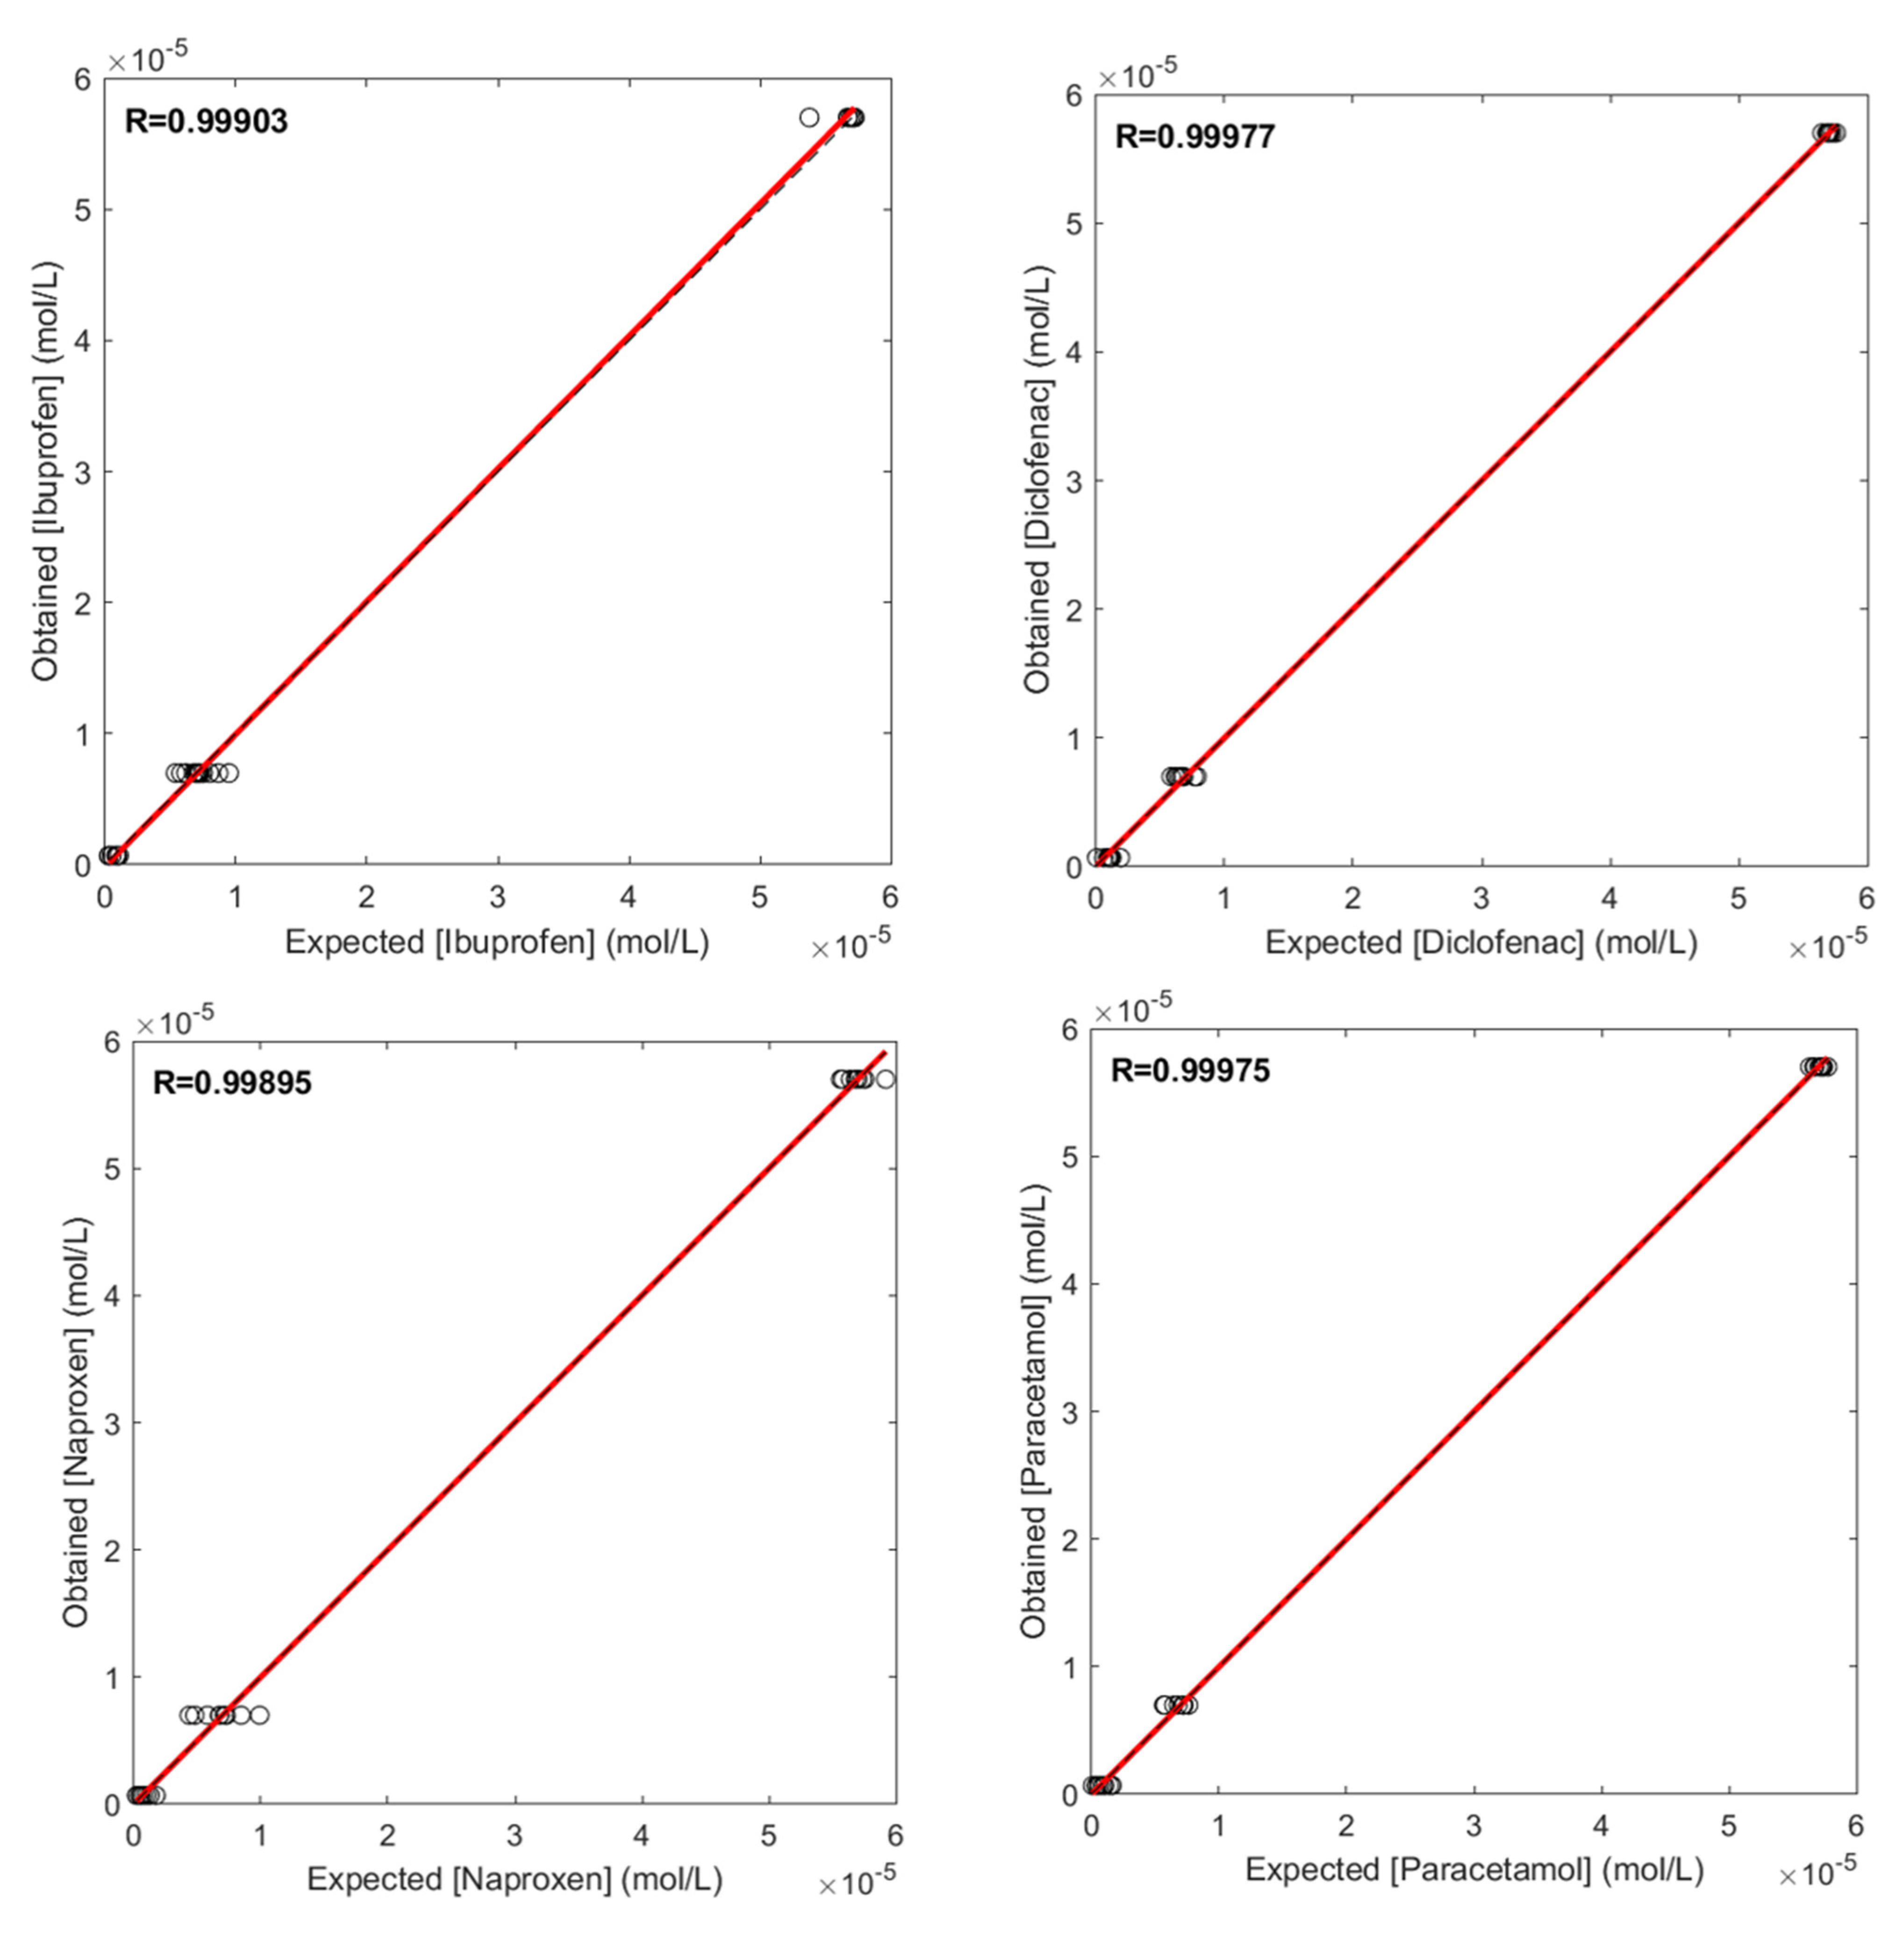
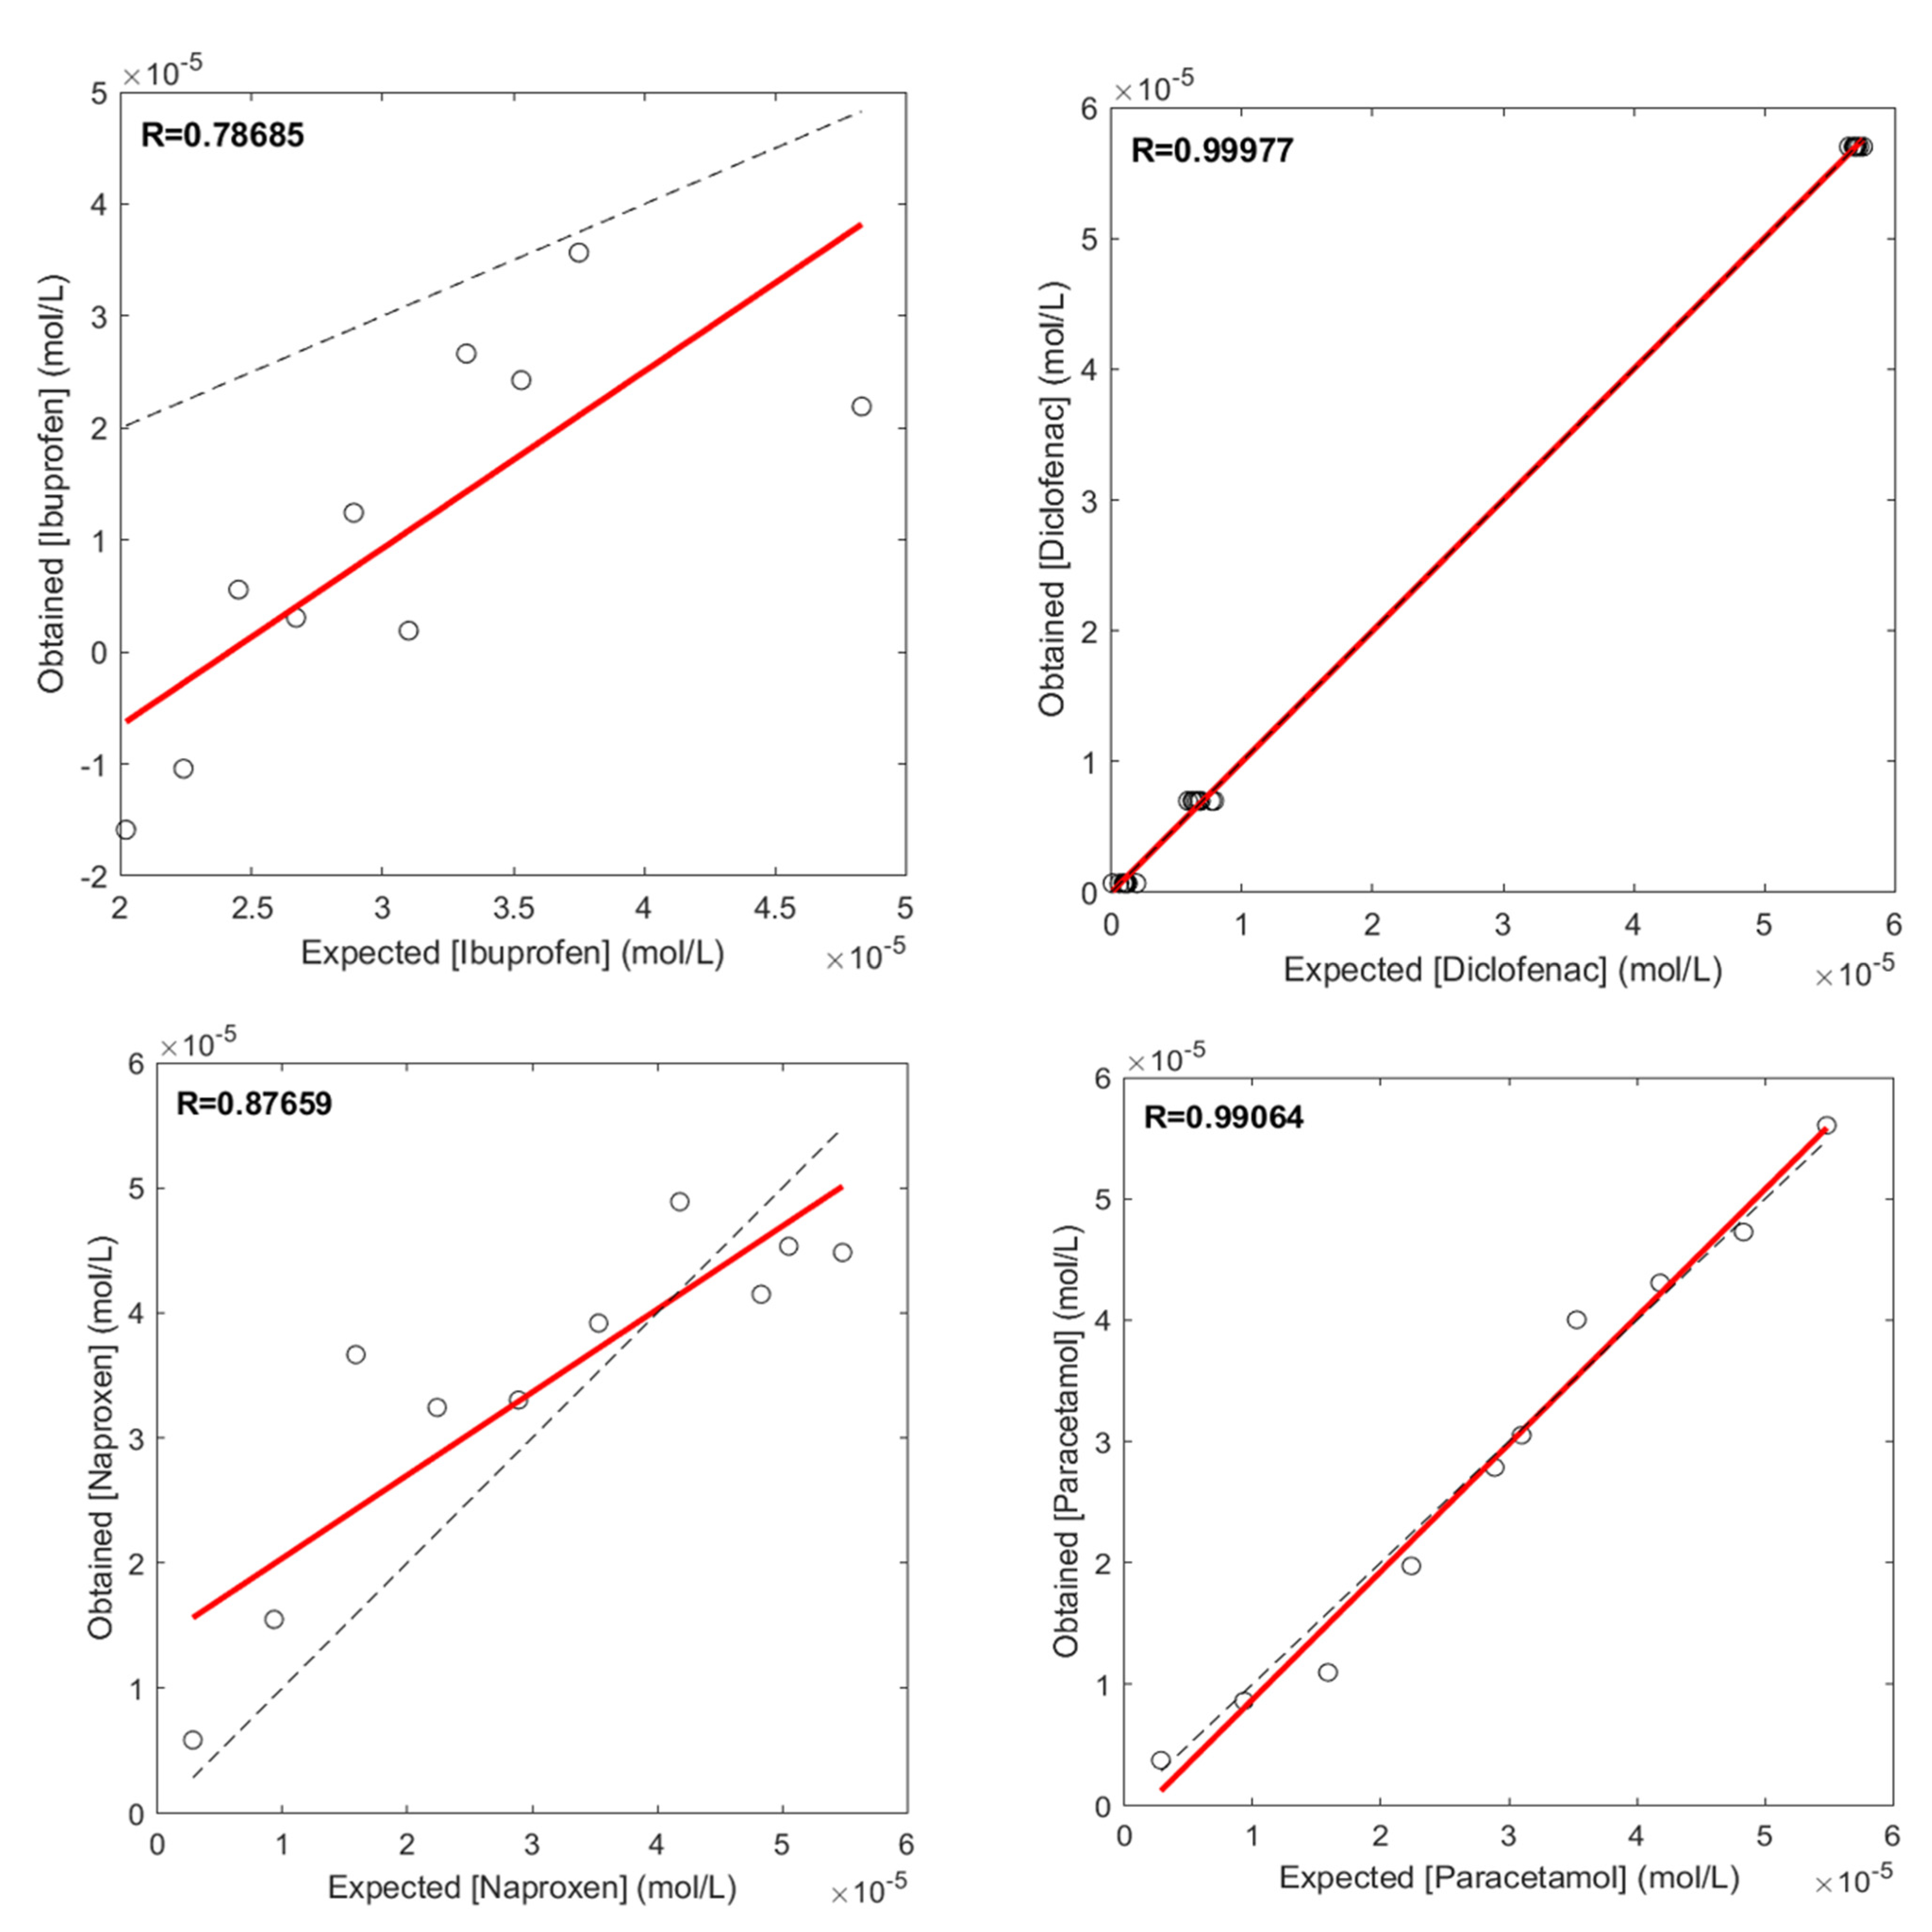
3.2. Quantification of NSAIDs Using ANN

Using the optimal parameters of the DPV to analyze the 27 samples considering different concentrations of the NSAIDs, and they were performed using a 35−2 fractional facto-rial design. The trained MLP was used to determine the performance in the quantification task of drugs and the relationship between the concentrations obtained and those expected was evaluated, both for the training and the test phases. In this sense, the linear regression obtained from the comparison was a measure of the model’s goodness. Given ideal conditions, the line must have a slope equal to 1 and its intersection equal to 0. The comparative graphs between the real concentrations of paracetamol, diclofenac, naproxen, and ibuprofen and those predicted with the MLP model for the training and test data set (Figure 3 and Figure 4, respectively). The high level of linearity allows a linear regression coefficient of the data obtained very close to one (R = 0.98) for paracetamol and diclofenac, while for the naproxen and ibuprofen, the correlation value was 0.87 and 0.78 respectively; aspirin was present as an interfering agent in the mixture.

4. Conclusions

In this work, a potential tool for voltammetric determination is presented. A combination of DPV and DWT-ANN allowed us to obtain satisfactory results for quantifying paracetamol, diclofenac, naproxen, and ibuprofen in the presence of aspirin. The use of DWT is helpful to compact voltammograms, preserving the analytical information of the original records. Multivariable models created with ANN correctly describe the complexity in voltammograms caused by overlapping peaks without the need for a pretreatment step on the samples. Finally, carbon paste electrodes with nanotubes are low-cost and easy-to-make devices that allow us to determine the drugs in the order of microgram per liter.

Supplementary Materials

The following are available online at https://www.mdpi.com/article/10.3390/CSAC2021-10450/s1.

Institutional Review Board Statement

Not applicable.

Informed Consent Statement

Not applicable.

Data Availability Statement

Not applicable.

Acknowledgments

The authors thank the Mexican National Council of Science and Technology for financial support through the National System of Researchers (SNI) and the distinction of their memberships.

Conflicts of Interest

The authors declare no conflict of interest.

References

  1. Villoria, C.M. Tratamiento de Dolor Crónico, Diagnóstico, Clínica y Tratamiento; Arán Ediciones, S.L.: Madrid, Spain, 2007. [Google Scholar]
  2. Aguilar-Lira, G.Y.; Rojas-Hernández, A.; Rodriguez, J.A.; Páez-Hernández, M.E.; Álvarez-Romero, G.A. Optimized quantification of naproxen based on DPV and a multiwalled MWCNT-carbon paste electrode. J. Electrochem. Soc. 2020, 167, 166510. [Google Scholar] [CrossRef]
  3. Sondergaard, K.B.; Weeke, P.; Wissenberg, M.; Olsen, A.-M.S.; Fosbol, E.L.; Lippert, F.K.; Torp-Pedersen, C.; Gislason, G.H.; Folke, F. Non-steroidal anti-inflammatory drug use is associated with increased risk of out-of-hospital cardiac arrest: A nationwide case–time–control study. Eur. Heart J. Cardiovasc. Pharmacother. 2017, 3, 100–107. [Google Scholar] [CrossRef] [PubMed] [Green Version]
  4. Aguilar-Arteaga, K.; Rodriguez, J.; Miranda, J.M.; Medina, J.; Barrado, E. Determination of non-steroidal anti-inflammatory drugs in wastewaters by magnetic matrix solid phase dispersion-HPLC. Talanta 2010, 80, 1152. [Google Scholar] [CrossRef] [PubMed]
  5. Alcañiz, M.; Vivancos, J.-L.; Masot, R.; Ibañez, J.; Raga, M.; Soto, J.; Martínez-Máñez, R. Design of an electronic system and its application to electronic tongues using variable amplitude pulse voltammetry and impedance spectroscopy. J. Food Eng. 2012, 111, 122–128. [Google Scholar] [CrossRef]
  6. Cosio, M.S.; Ballabio, D.; Benedetti, S.; Gigliotti, C. Evaluation of different storage conditions of extra virgin olive oils with an innovative recognition tool built by means of electronic nose and electronic tongue. Food Chem. 2007, 101, 485–491. [Google Scholar] [CrossRef]
  7. Vlasov, Y.G.; Legin, A.V.; Rudnitskaya, A.M.; D’Amico, A.; Natale, C.D. Sens. Actuators B 2000, 65, 235–236. [Google Scholar] [CrossRef]
  8. Martínez-Máñez, R.; Soto, J.; Garcia-Breijo, E.; Gil, L.; Ibáñez, J.; Llobet, E. An “electronic tongue” design for the qualitative analysis of natural waters. Sens. Actuators B 2005, 104, 302–307. [Google Scholar] [CrossRef]
  9. Lvova, L.; Martinelli, E.; Mazzone, E.; Pede, A.; Paolesse, R.; Natale, C.D.; D’Amico, A. Electronic tongue based on an array of metallic potentiometric sensors. Talanta 2006, 70, 833–839. [Google Scholar] [CrossRef] [PubMed]
  10. Bessant, C.; Saini, S. Simultaneous Determination of Ethanol, Fructose, and Glucose at an Unmodified Platinum Electrode Using Artificial Neural Networks. Anal. Chem. 1999, 71, 2806–28013. [Google Scholar] [CrossRef]
  11. Martina, V.; Ionescu, K.; Pigani, L.; Terzi, F.; Ulrici, A.; Zanardi, C.; Seeber, R. Development of an electronic tongue based on a PEDOT-modified voltammetric sensor. Anal. Bioanal. Chem. 2007, 387, 2101–2110. [Google Scholar] [CrossRef] [PubMed]
  12. Garcia, B.; Olguin, P.; Masot, P.; Alcañiz, F.; Martínez-Máñeza, R.; Soto, C. TNT detection using a voltammetric electronic tongue based on neural networks. Sens. Actuator A Phys. 2013, 192, 1–8. [Google Scholar] [CrossRef]
  13. Aguilar-Lira, G.Y.; Gutiérrez-Salgado, J.M.; Rojas-Hernández, A.; Rodríguez-Ávila, J.A.; Páez-Hernández, M.E.; Álvarez-Romero, G.A. Artificial neural network for the voltamperometric quantification of diclofenac in presence of other nonsteroidal anti-inflammatory drugs and some commercial excipients. J. Electroanal. Chem. 2017, 801, 527–535. [Google Scholar] [CrossRef]
  14. Montgomery, D.C. Design and Analysis of Experiments, 8th ed.; Wiley: Hoboken, NJ, USA, 2012. [Google Scholar]
Figure 1. CVs obtained for the systems containing the NSAIDs and the supporting electrolyte, using the proposed working electrode and in presence of aspirin. Potential window from 0 to 1.3 V and at a scan rate of 100 mVs−1, (a) individual for each NSAIDs, (b) mixture of the four NSAIDs.
Chemproc 05 00003 g001
Figure 2. CVs obtained for the NSAIDs mixture at different pHs (range of 7–10) in a 0.1 mol·L−1 BR buffer, using a potential window of 0 to 1.3 V and a scan rate of 100 mV·s−1, and a concentration of 4 × 10⁻⁴ mol·L−1 for the NSAIDs.
Chemproc 05 00003 g002
Figure 3. Comparison between the expected NSAIDs concentration and those obtained after MLP training phase.
Chemproc 05 00003 g003
Figure 4. Comparison between the expected NSAIDs concentration and those obtained during MLP test phase.
Chemproc 05 00003 g004
Table 1. Optimal DPV parameters found with the Box Behnken design.
X1 (V)X2 (s)X3 (s)X4 (V)Y (µA)
0.005850.750.050.055.24
Publisher’s Note: MDPI stays neutral with regard to jurisdictional claims in published maps and institutional affiliations.

