Proceeding Paper

Optical Investigation of PVA/PbTiO3 Composite for UV-Protective Approach Applications †

1
Housing and Building National Research Center, Building Physics Institute, Giza 1770, Egypt
2
Department of Physics, Faculty of Science, Cairo University, Giza 12613, Egypt
3
Department of Petroleum Applications, Egyptian Petroleum Research Institute (EPRI), Cairo 11727, Egypt
*
Author to whom correspondence should be addressed.
Presented at the 2nd International Electronic Conference on Applied Sciences, 15–31 October 2021; Available online: https://asec2021.sciforum.net/.
Eng. Proc. 2021, 11(1), 4; https://doi.org/10.3390/ASEC2021-11172
Published: 15 October 2021
(This article belongs to the Proceedings of The 2nd International Electronic Conference on Applied Sciences)

Abstract

:
Samples of a new-fangled polymer of poly (Vinyl Alcohol) (PVA) doped with various concentrations of Lead (II) Titanate (PbTiO3, PT) were prepared using the casting method. The prepared samples were identified by Attenuated Total Reflection–Fourier Transform Infrared (ATR-FTIR). Peaks characteristic of PVA at 3280, 2917, 1690, 1425, 1324, 1081, and 839 cm−1 appeared; a peak indicating the presence of PbTiO3 also appeared at 713 cm−1. The interaction between PVA and PbTiO3 was confirmed by observing the change in IR absorption intensity. Optical properties in the UV-Vis range were investigated using an Ultraviolet Visible technique (UV-Vis). An enhancement in absorption capacity by the increasing PbTiO3 concentration was observed. Optical properties such as band gap energy, Urbach energy, and extinction coefficient indicate that addition of PbTiO3 into the PVA polymer induced variance in internal states by increasing the ratio of PbTiO3. Obtaining a UV-protective material derived from a PVA/PbTiO3 composite is the aim of this paper.

1. Introduction

Polymeric nanocomposite materials have been receiving a lot of attention lately because of the expanded range of applications that these hybrid materials can be used for [1]. It is widely documented that polymers, as dielectric materials, are good host matrices for nanoparticles [2], and that this is true for both metal and ceramic nanoparticles. While doing so, these embedded particles within the polymer matrix also impact the physical properties of the host [3,4]. Polymer ceramic hybrid composites, in particular, are promising functional materials in a variety of disciplines, demonstrating useful optical, electrical, thermal, mechanical, and antibacterial characteristics [4].
Composites made of piezoelectric ceramics such as barium titanate (BT), lead titanate (PT), triglycine sulphate (TGS), lead zirconate titanate (PZT), etc. have been studied extensively [5]. Lead titanate (PbTiO3) is a ferroelectric ceramic included in the same perovskite family as barium titanate and lead zirconate titanate. All of these materials have one or more phase transitions within a particular temperature range. However, lead titanate exhibits the largest spontaneous polarization in the tetragonal phase (tetragonality factor c/a = 1.064), the lowest dielectric constant (≈200), and a high Curie temperature (≈490 °C) [6].
Polyvinyl Alcohol (PVA) is a polymer with good film-forming and physical properties, high hydrophilicity, processability, and biomaterial and biosensor capabilities [7,8]. PVA is a semicrystalline polymer (Cryo-Amorphous) composed of both crystalline and amorphous phases. When such a polymer is mixed with a suitable ceramic, it interacts either in the amorphous or crystalline fractions, affecting the physical qualities in both cases [9].
It is reported in this study that the preparation and investigation of the optical properties of PVA/PbTiO3 composite films were carried out because these films can combine the advantages of both polymer and ceramic components.

2. Experimental

Polyvinyl Alcohol (PVA) powder and Lead (II) Titanate (PbTiO3) powder were supplied from Sigma-Aldrich (St. Louis, MO, USA). PVA was dissolved in double-distilled water at 80 °C and stirred for 4 h to ensure uniform dispersion. To prepare PbTiO3/PVA composites, different weight percentages (0, 1, 5, and 10 wt.%) were added to the above solution of PVA in water and stirred for 1 h. The mixture was then cast in a glass dish, and the sample was left to dry for a week at room temperature. The dispersion state of the prepared samples was examined using a Field Emission Scanning Electron Microscope (FESEM Sigma 300 VP, Carl Zeiss, GmbH, Jena, Germany). Figure 1 shows the FESEM micrograph for 10 wt.% PbTiO3 in the PVA. The image demonstrates the absence of aggregation of PbTiO3 and its homogenous dispersion.
Alpha Bruker platinum Attenuated Total Reflection–Fourier Transform Infrared Spectroscopy (ATR-FTIR) with a wavenumber range of 600–4000 cm−1 was used to determine the characterization of the polymer composite. UV-Vis spectra were measured using a Jasco V-630 spectrophotometer.

3. Results and Discussion
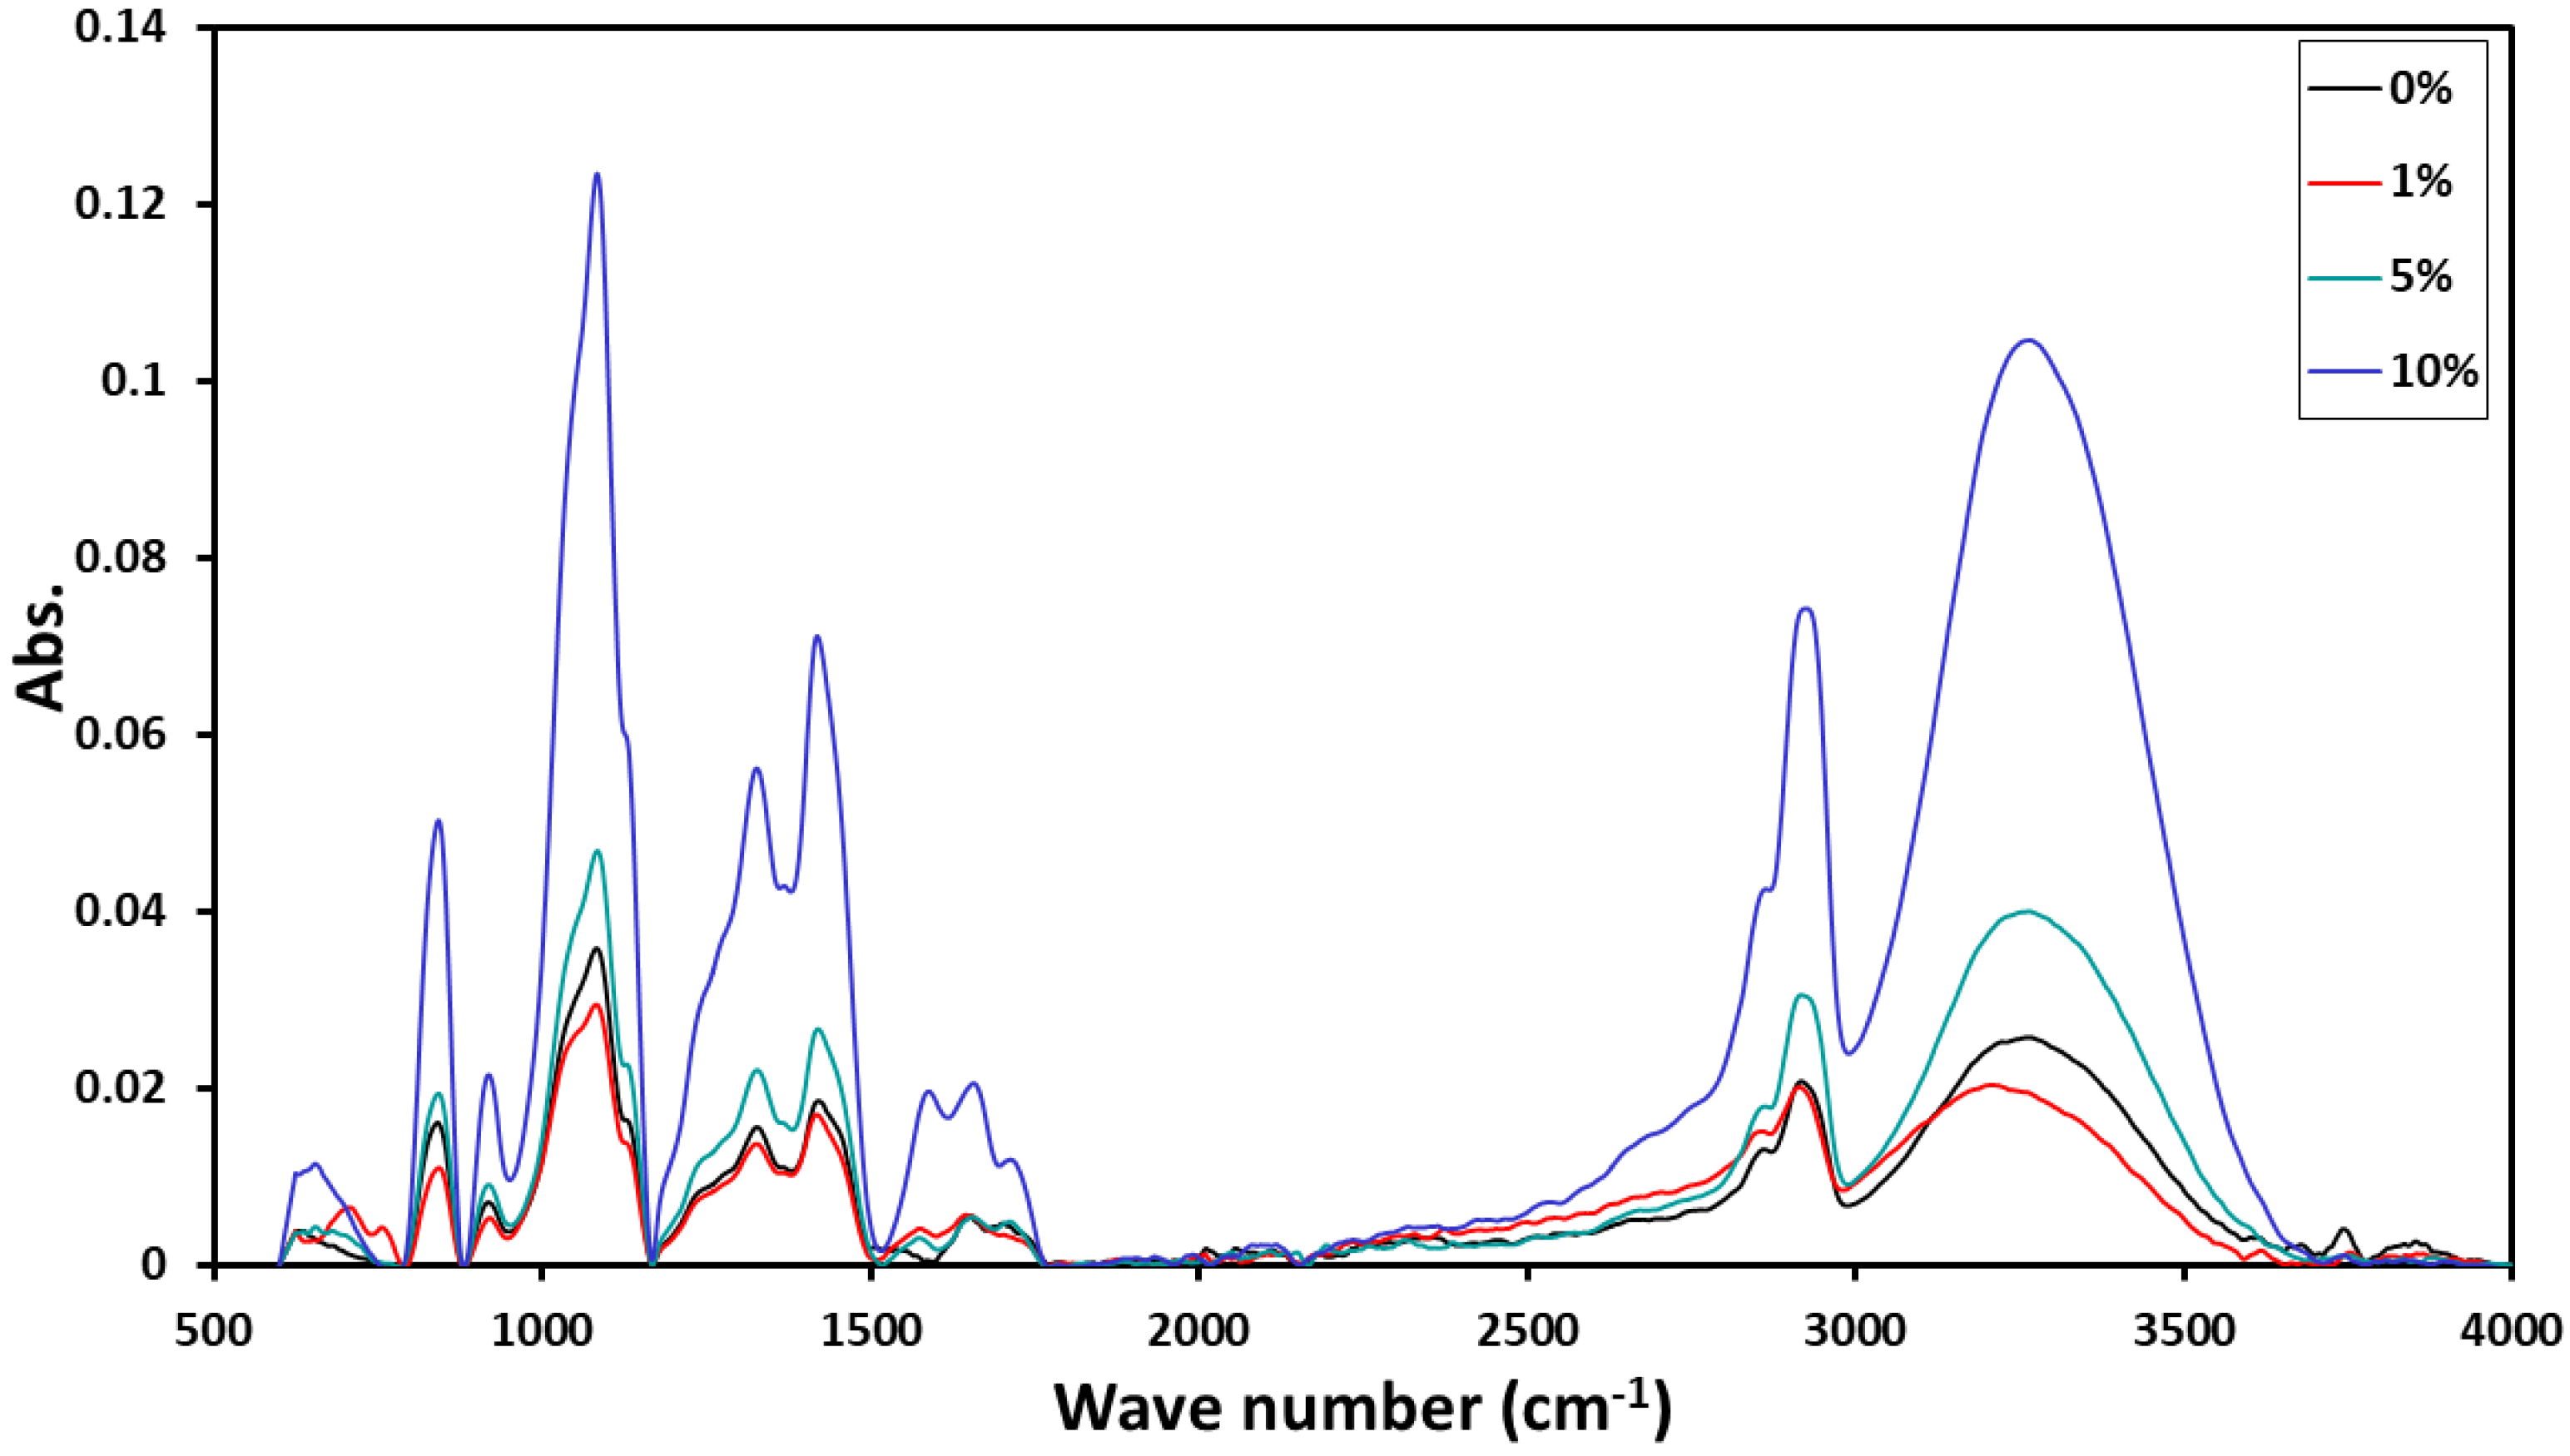
3.1. ATR-FTIR

ATR-FTIR spectroscopy represents a key approach for identifying and characterizing polymer composites. The PVA/PbTiO3 composite ATR-FTIR spectra with various PbTiO3 levels are illustrated in Figure 2. The major peaks of PVA were found at 3280 cm−1, indicating the presence of O-H stretching vibration of the hydroxyl group. The peak at 2917 cm−1 is linked with the existence of the asymmetrical deep vibration of CH. The peak at 1690 cm−1 corresponds to C=O carbonyl stretching. The peak at 1425 cm−1 corresponds to the bending vibration of CH2 [10]. The peaks at 839 cm−1, 1081 cm−1, and 1324 cm−1 are associated with C-C stretching vibration, C-O stretching vibration of acetyl groups, and the presence of C-H deformation [11]. For the PVA/PbTiO3 composite, several peaks could be observed, with a belt additive of 713 cm−1 indicating metal oxygen stretching, which in turn shows the presence of metal oxygen bonds.

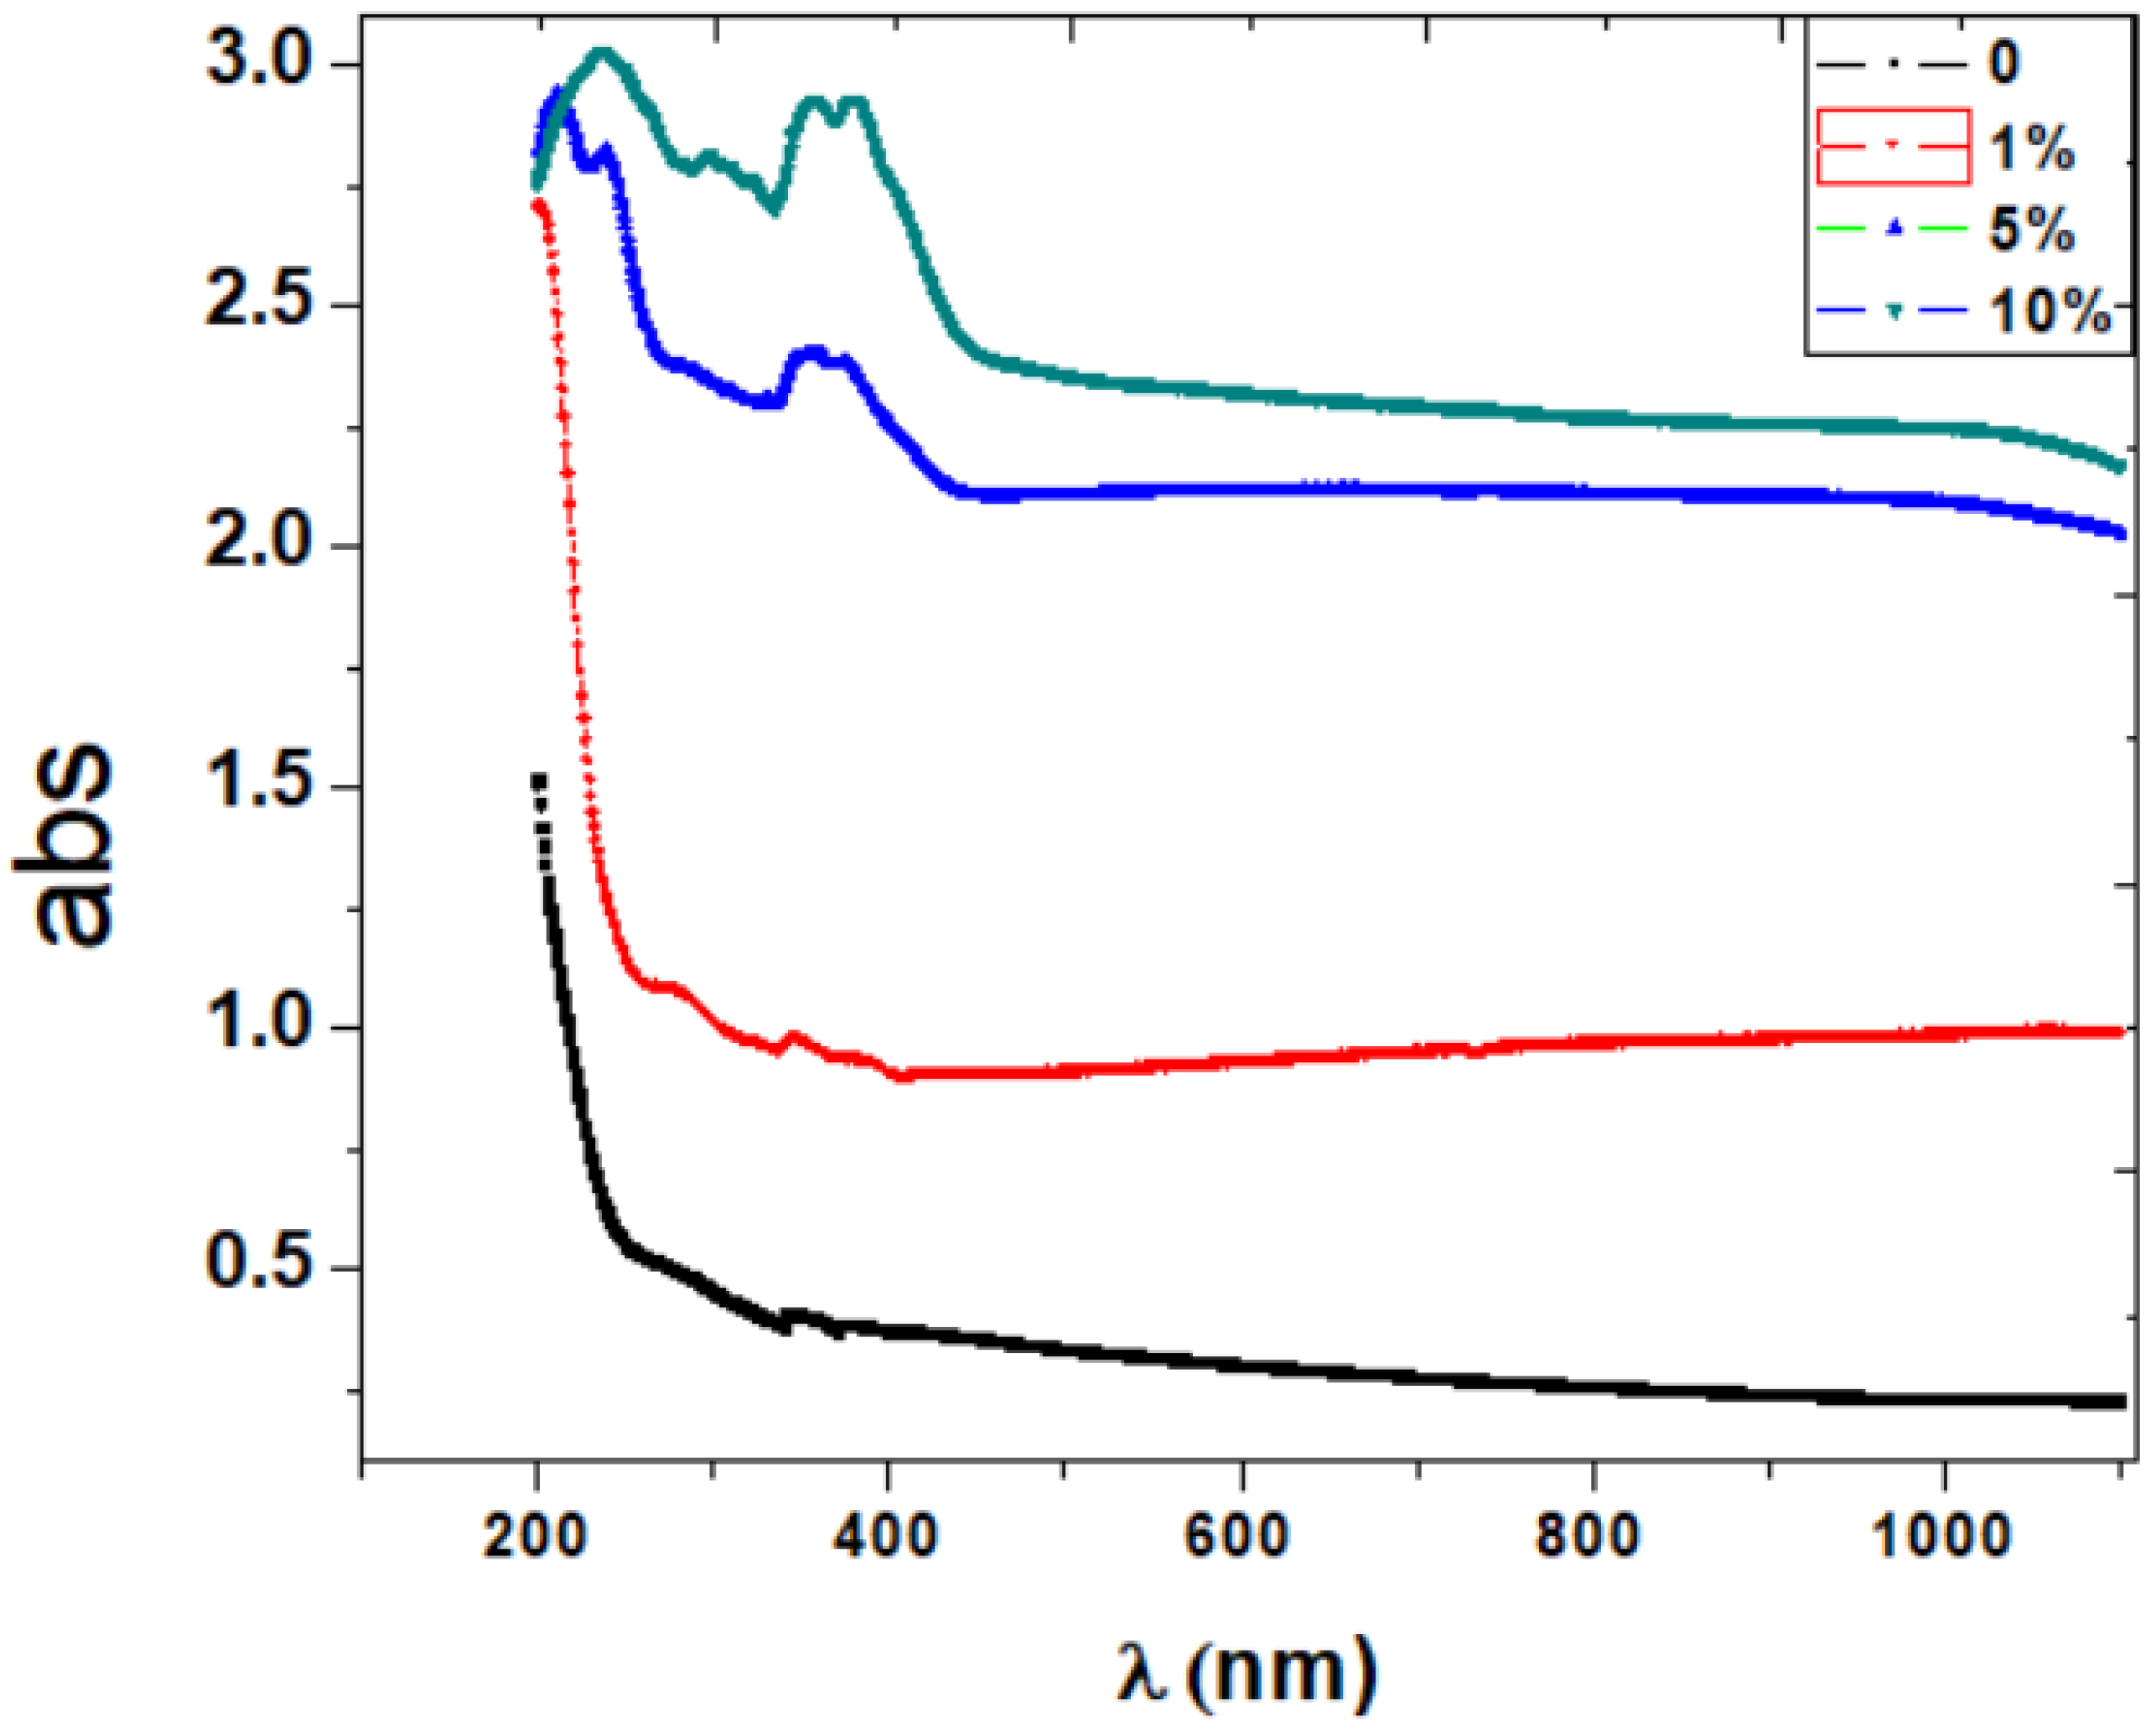
3.2. Optical Properties

Ultraviolet-visible spectroscopy is one the most prevalent mechanisms that can detect every molecule, identify functional groups, and confirm the concentration of analytes indicated by absorbance using Beer’s law. The UV-Vis absorption spectra of PVA/PbTiO3 with various PbTiO3 concentrations (0%, 1%, 5%, and 10%) are depicted in Figure 3. Absorption peaks obtained from 350 to 450 nm for 5% and 10% PbTiO3 can be observed due to the energy of the forbidden band conformable to O-2p→Ti-3d, while no peaks were obtained for neat PVA or a concentration of 1% PbTiO3. The intensity of absorption decreases with increasing wavelength for all samples. High absorption is obtained in the UV region for samples with 5% and 10% concentrations, qualifying them to be promising in UV-protective approaches.
In low and poor crystalline materials, disordered and amorphous material exponential tails appear near the optical edge, called Urbach tails, due to the localized states that the materials have. These localized states are prolonged in the band gap and can be described by the Urbach rule [12].
α = α o     e x p ( h γ E u )  
where α is the absorption coefficient, h γ is the photon energy, α o is a constant, and E u is the band tail energy (Urbach energy). The band tail energy is weakly temperature-dependent and interpreted as the band tail width due to the localized states within a bandgap; it is associated with low/poor crystalline materials and amorphous materials. Figure 4 depicts the relation between the absorption coefficient α and the photon energy E   ( h γ ) . It is essential to take the natural logarithm of Equation (1), as the slope of the straight line after taking this logarithm gives the Urbach energy ( E u ) [12]:
l n α = l n α o     + ( h γ E u )
l n α is plotted against the incident photon energy h γ in Figure 5.
Figure 4. The relation between α and E for the PVA/PbTiO3 composite.
Engproc 11 00004 g004
Figure 5. The relation between ln α and E for the PVA/PbTiO3 composite.
Engproc 11 00004 g005
Transition of electrons can take place in semiconductor materials between the valance band and conduction band. Spontaneous emission, absorption, and simulated emission can take place between the conduction band and valance band. Band gap energy can be determined by plotting (αhγ)1/k and , where k depends on the nature of the transition For direct transition (k = ½), the electron rising from the valance band to the conduction band changes only its potential, while for indirect transition (k = 2), the electron rising from the valance band to the conduction band changes potential and momentum. The following equation can describe the direct and indirect transition [13]:
( α h γ ) = B   ( h γ E g ) 1 / k
B is a constant that depends on the transition probability. Figure 6 shows the plot of ( α h γ ) 2   and ( α h γ ) 1 / 2   versus E ( h γ ) for the PVA/PbTiO3 composite. The presented values of direct and indirect band gap energies have been determined via the extrapolation of the linear portion of the curve along the x-axis. Table 1 indicates the values of absorption edges, band tail energies, and indirect (Ei) and direct (Ed) optical band gaps for composites. The absorption edge values and the band tail energies decrease with increasing PbTiO3 content. The values of direct and indirect band gaps decrease with increasing PbTiO3 content, indicating a variance in internal states. A composite with 10 wt.% PbTiO3 is promising for UV-protective applications.

4. Conclusions

PVA/PbTiO3 composites were prepared using the casting method. The absence of aggregations was examined by using FESEM. The peaks characteristic of PVA appeared when the composites were examined using ATR-FTIR. The absorption edge value and band tail energies decrease with increasing PbTiO3 content. Also, the values of direct and indirect bandgap decrease with increasing PbTiO3 content. A composite with 10 wt.% PbTiO3 is promising for UV-protective applications.

Author Contributions

Conceptualization, G.M.N., E.O.T. and A.S.E.-D.; methodology, M.A.A. and M.M.A.K.; writing—original draft, A.S.E.-D. and E.O.T.; Review and editing, E.O.T. and A.S.E.-D.; supervision, G.M.N. All authors have read and agreed to the published version of the manuscript.

Funding

This research received no external funding.

Conflicts of Interest

The authors declare no conflict of interest.

References

  1. Bailey, E.J.; Winey, K.I. Dynamics of polymer segments, polymer chains, and nanoparticles in polymer nanocomposite melts: A review. Prog. Polym. Sci. 2020, 105, 101242. [Google Scholar] [CrossRef]
  2. Ananth, A.N.; Umapathy, S.; Sophia, J.; Mathavan, T.; Mangalaraj, D. On the optical and thermal properties of in situ/ex situ reduced Ag NP’s/PVA composites and its role as a simple SPR-based protein sensor. Appl. Nanosci. 2011, 1, 87–96. [Google Scholar] [CrossRef] [Green Version]
  3. Ghanipour, M.; Dorranian, D. Effect of ag-nanoparticles doped in polyvinyl alcohol on the structural and optical properties of PVA films. J. Nanomater. 2013, 2013, 897043. [Google Scholar] [CrossRef]
  4. Sebastian, M.T. Polymer–Ceramic Composites of 0–3 Connectivity for Circuits in Electronics: A Review. Int. J. Appl. Ceram. Technol. 2010, 7, 415–434. [Google Scholar] [CrossRef]
  5. Uma, S.; Philip, J. Induction of electro-activity in polyvinyl alcohol with addition of nanocrystalline PZT ceramic. Int. J. Indian J. Pure Appl. Phys. 2013, 5, 717–723. [Google Scholar]
  6. Mir, M.; de Paula, C.C.; Garcia, D.; Kiminami, R.H.G.A.; Eiras, J.A.; Mascarenhas, Y.P. Microstructural characterization using the Rietveld method in lead lanthanum titanate ceramics. J. Eur. Ceram. 2007, 27, 3719–3721. [Google Scholar] [CrossRef]
  7. Kinadjian, N.; Achard, M.-F.; Julián-López, B.; Maugey, M.; Poulin, P.; Prouzet, E.; Backov, R. ZnO/PVA macroscopic fibers bearing anisotropic photonic properties. Adv. Funct. Mater 2012, 22, 3994–4003. [Google Scholar] [CrossRef]
  8. Taha, E.O.; Nasr, G.M. Dielectric and dynamic mechanical properties of Rochelle salt/PVA composites. In IOP Conference Series Materials Science and Engineering; IOP Publishing: Hurghada, Egypt, 2021; p. 12008. [Google Scholar]
  9. Shehap, A.M.; Akil, D.S. Structural and optical properties of TiO2 nanoparticles/PVA for different composites thin films. Int. J. Nanoelectron. Mater. 2016, 9, 17–36. [Google Scholar]
  10. Atta, M.M.; Taha, E.O.; Abdelreheem, A.M. Nitrogen plasma effect on the structural, thermal, and dynamic mechanical properties of PVA/starch/graphene oxide nanocomposite. Appl. Phys. A 2021, 127, 532. [Google Scholar] [CrossRef]
  11. Afzal, H.M.; Shehzad, F.; Zubair, M.; Bakather, O.Y.; Al-Harthi, M.A. Influence of microwave irradiation on thermal properties of PVA and PVA/graphene nanocomposites. J. Therm. Anal. Calorim. 2020, 139, 353–365. [Google Scholar] [CrossRef]
  12. Hassaan, M.Y.; Osman, H.M.; Hassan, H.H.; El-Deeb, A.S.; Al-Helal, M.A. Optical and electrical studies of borosilicate glass containing vanadium and cobalt ions for smart windows applications. Ceram. Int. 2017, 43, 1795–1801. [Google Scholar] [CrossRef]
  13. Aziz, S.B.; Rasheed, M.A.; Ahmed, H.M. Synthesis of polymer nanocomposites based on [methyl cellulose](1−x):(CuS)x (0.02 M ≤ x ≤ 0.08 M) with desired optical band gaps. Polymers 2017, 9, 194. [Google Scholar] [CrossRef] [PubMed]
Figure 1. FESEM of the 10 wt.% PbTiO3/PVA composite.
Engproc 11 00004 g001
Figure 2. ATR-FTIR spectra for the PVA/PbTiO3 composite.
Engproc 11 00004 g002
Figure 3. UV-Vis spectra of the PVA/PbTiO3 composite.
Engproc 11 00004 g003
Figure 6. Relation between ( α h γ ) 2 ( c m 1 eV ) 2 and ( α h γ ) 1 / 2 ( c m 1 eV ) 1 / 2 against h γ (eV) for the PVA/PbTiO3 composite.
Engproc 11 00004 g006
Table 1. Values of absorption edge, band tail, and indirect (Ei) and direct (Eg) optical band gap energy for the PVA/PbTiO3 Composite.
PVA/PbTiO3Absorption Edge (eV)Band Tail Eu (eV)Energy Gap (eV)
EiEd
0%4.61.125.35.2
1%4.4625.84.8
5%1.362.342.82.7
10%0.562.742.32.17
Publisher’s Note: MDPI stays neutral with regard to jurisdictional claims in published maps and institutional affiliations.

