Abstract
Over the past several decades, growing research on lipids and lipidomic technologies have shown the important role played by lipids in many different situations. A powerful technique used for lipids detection and characterization in biological tissues is Fourier Transform Infrared (FTIR) spectroscopy. The main goal of the present work is to exploit FTIR spectroscopy as a tool for monitoring lipid extraction efficiency by evaluating three different lipid extraction methods in murine liver tissues. In particular, infrared spectra have been obtained in the 4000–600 cm−1 wavenumber region and the contributions of different functional groups have been evidenced. The ratio values estimated using the absorbance of selected bands related to different liver constituents have been used for a quantitative comparison of the efficiency of the different extraction methods.
1. Introduction
Over the past several decades, growing research on lipids and lipidomic technologies have shown how the perception of lipids has changed. Lipids are functionally versatile molecules in plants, animals, and humans. They are certainly key components of the cell membranes and a source of energy, but they also play an essential role in physiology and pathophysiology, in signal transduction between cells and body metabolism and act as diagnostic and/or prognostic biomarkers of different diseases [1]. Many studies have shown the relationship between altered lipid metabolism and type 2 diabetes mellitus (T2DM) or metabolic disease such as Nonalcoholic fatty liver disease (NAFLD) or neurodegenerative disease such as Parkinson’s Disease or Atherosclerosis (a risk factor for ischemic stroke) [2,3,4]. Fourier Transform Infrared (FTIR) spectroscopy is a powerful technique used for lipids detection [5,6] and characterization in biological tissues [7]. Furthermore, using spectroscopy, it is also possible to study lipids dynamics in cellular membranes influencing protein structure and function [8]. The main goal of the present work is to exploit FTIR spectroscopy as a tool for monitoring lipid extraction efficiency by evaluating three different lipid extraction methods [9]. In particular, Folch, Bume and modified Bume methods have been adopted in murine liver tissues. The Folch method, one of the most commonly used methods for isolating lipids from biological samples, is based on the partitioning of lipids in a biphasic mixture of chloroform and methanol (2:1). Methanol disrupts hydrogen bonds between lipids and protein following the addition of an organic solvent such as chloroform. However, chloroform is a known carcinogen and lipids need to be recovered from the lower phase which means a possible contamination during the lipid collection [10]. The Bume method is a new rapid and simple chloroform-free method for total lipid extraction of animal tissue which is based on butanol/methanol mixture (BUME) for the initial extraction and acetic acid to induce phase separation. The Bume method allows overcoming the risk of sample contamination because lipids are recovered from the upper organic layer [11]. The Bume modified method is similar to the Bume method but this extraction procedure exploits lithium chloride solution to induce phase separation because some lipids are sensitive to acidic environments [12]. Following the example of Ref. [9] FT-IR spectroscopy has been employed for monitoring the efficiency of the different extraction methods. A ratiometric approach [13,14,15] has also been adopted for characterizing the differences among the infrared spectra obtained from the different samples. In fact, the ratio values estimated using the absorbance of selected bands related to different liver constituents can be especially advantageous for a quantitative comparison of the efficiency of the different extraction methods.
2. Materials and Methods
Murine liver tissues were used in the experiments. Animals were kept in standard temperature and humidity conditions. At sacrifice, the animals were deeply anesthetized by an overdose of Tanax (0.1 mL intrapulmonary). The tissues investigated (100 mg) were collected and immediately frozen at −20 C. All animal studies were carried out in accordance with the principles and procedures outlined in the National Institute of Health Guide for Care and Use of Laboratory Animals and approved by the Italian Ministry of Research and the Italian Ministry of Health.
All reagents, used in the following extraction procedures, are LC/MS grade, including water (ROMIL Ltd., Cambridge, UK, Residue < 0.00005%, Resistivity > 18 MOhm (T = 25 C), TOC < 2 ppb), methanol (Sigma-Aldrich, St. Louis, MO, USA, Assay > 99.9%, Residue < 0.0001%), chloroform (ROMIL-SpS, UK, Residue < 0.0001%, Assay > 99.9%), butanol (Carlo Erba, Residue on evaporation <= 20 ppm, Assay >= 99.0%), heptane 99% (Carlo Erba, Residue on evaporation <= 10 ppm, Assay >= 99.0%), ethyl acetate (Carlo Erba, Residue on evaporation <= 20 ppm, Assay >= 99.8%), acetic acid (Carlo Erba, Residue on evaporation <= 20 ppm, Assay >= 99.8%), Lithium Chloride (Sigma-Aldrich, 99%).
Extraction of lipid using the Folch method [10] was performed using frozen tissue collected into the test tube. A total of 4 mL of methanol was added to the test tube and the sample was homogenized for 3 min at 15,000 rpm. After the addition of 1.5 mL of chloroform, the solution was stirred for 10 min at room temperature. An amount of 3 mL of water was added to methanol/chloroform mixture and the sample was centrifuged at 2500 rpm for 5 min at 24 C. Then, the upper layer was removed, and the lower chloroform phase (containing lipids) was collected in a new test tube, dried with nitrogen, capped, and stored at −20 C.
For the Bume method [11], frozen tissue was collected into the test tube. A total of 500 L BUME mixture (butanol:methanol [3:1]) was added to the test tube and the solution was vortexed for one minute. After the addition of 500 L heptane:ethyl acetate [3:1] and 500 L 1% acetic acid (to induce phase separation), the sample was centrifuged for 10 min at 4000× g and then lipids were recovered from the organic (upper) phase. The upper organic layer was collected and placed into a new test tube. A second phase extraction was performed adding 500 L heptane:ethyl acetate [3:1] to water (lower) phase. After the addition of heptane: ethyl acetate, the solution mixture was vortexed and centrifuged at 4000× g for 10 min and the resulting upper organic layer was collected and combined with the previous organic layer. The lipid extract was dried with nitrogen, capped and stored at −20 C.
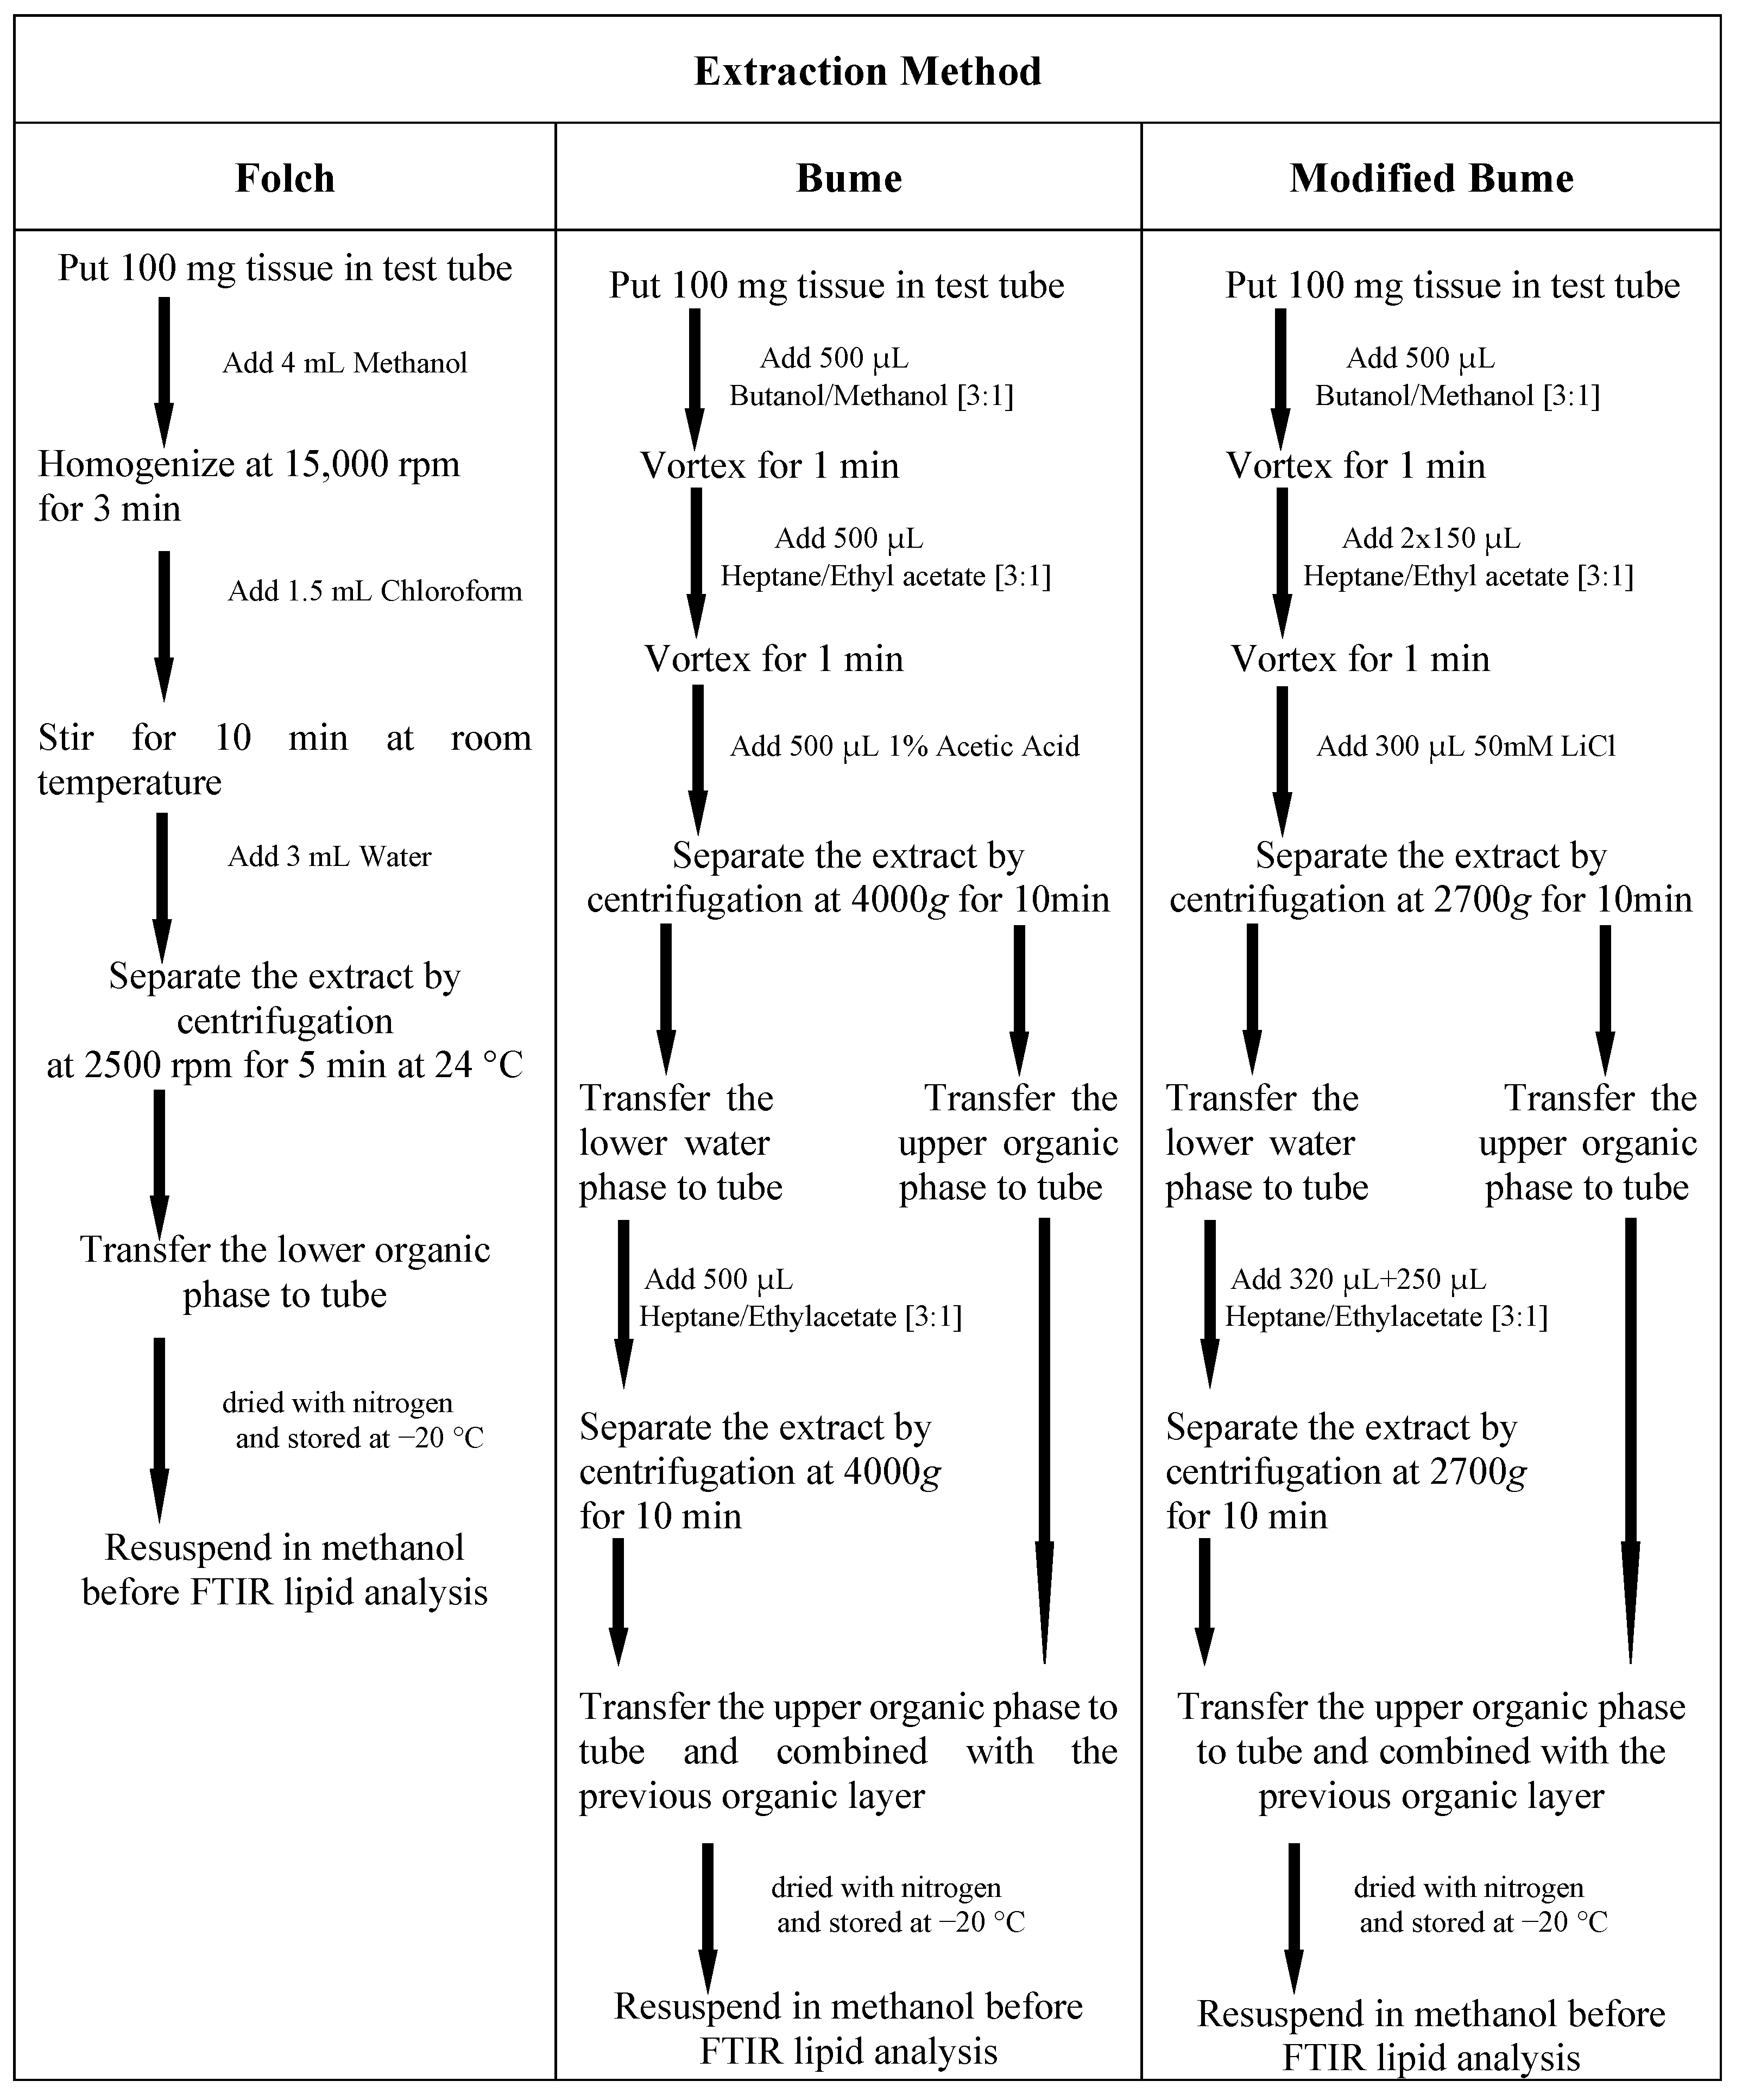
For modified Bume method [12], frozen tissue was collected into the test tube. Butanol/methanol (300 L, [3:1], v/v) was added to the test tube and the solution was vortexed for one minute. Heptane/Ethyl Acetate (150 L, [3:1], v/v) was added to the tube and the solution was vortexed again for another minute. Another 150 L heptane/Ethyl Acetate was added, and after vortexing for 1 min, 300 L of 50 mM LiCl was added to the test tube to induce phase separation. After this step, the resulting solution was vigorously vortexed for another minute. Then the solution was centrifuged at 2700× g for 10 min. The upper organic layer was collected and placed into a new test tube. The remaining aqueous layer was re-extracted twice, first with 320 L of heptane/Ethyl Acetate [3:1], then with 250 L of the same solvent. After each addition of heptane/Ethyl Acetate, the solution mixture was vortexed and centrifuged at 2700× g for 10 min, and the resulting upper organic layers were collected and combined with the previous organic layer. The lipid extract was dried with nitrogen, capped, and stored at −20 C. Scheme Scheme 1 summarizes all the details of the three adopted procedures.
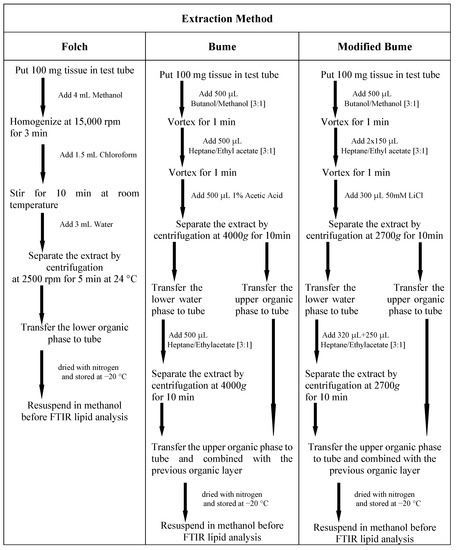
Scheme 1.
Details of the three methods adopted for extracting lipids from murine liver tissues.
For FT-IR spectral analysis, the lipid extracts were resuspended in methanol and drops of a few microliters were placed on metallic IR-reflective surface and left to dry and used for spectra acquisition. FTIR spectra were obtained using a Perkin Elmer Spectrum One spectrometer equipped with a Perkin Elmer Multiscope system infrared microscope. The background signal was acquired in a free region of the slide. All spectra were collected using 64 scans in the range from 4000 to 1000 cm−1 with a 4 cm−1 spectral resolution. The spectra were processed as reported in Ref. [13]. Additional quantitative information about the changes occurring in the infrared spectra related to the different extraction method can be obtained by evaluating the ratios between the absorbance of selected peaks (see Refs. [13,15]). In this preliminary analysis the ratio between the intensity of the peak ascribed to CH2 asymmetric stretching (related to lipid) and one of Amide A band (related to protein content) was evaluated for estimating the efficiency of the different extraction methods.
3. Results and Discussion
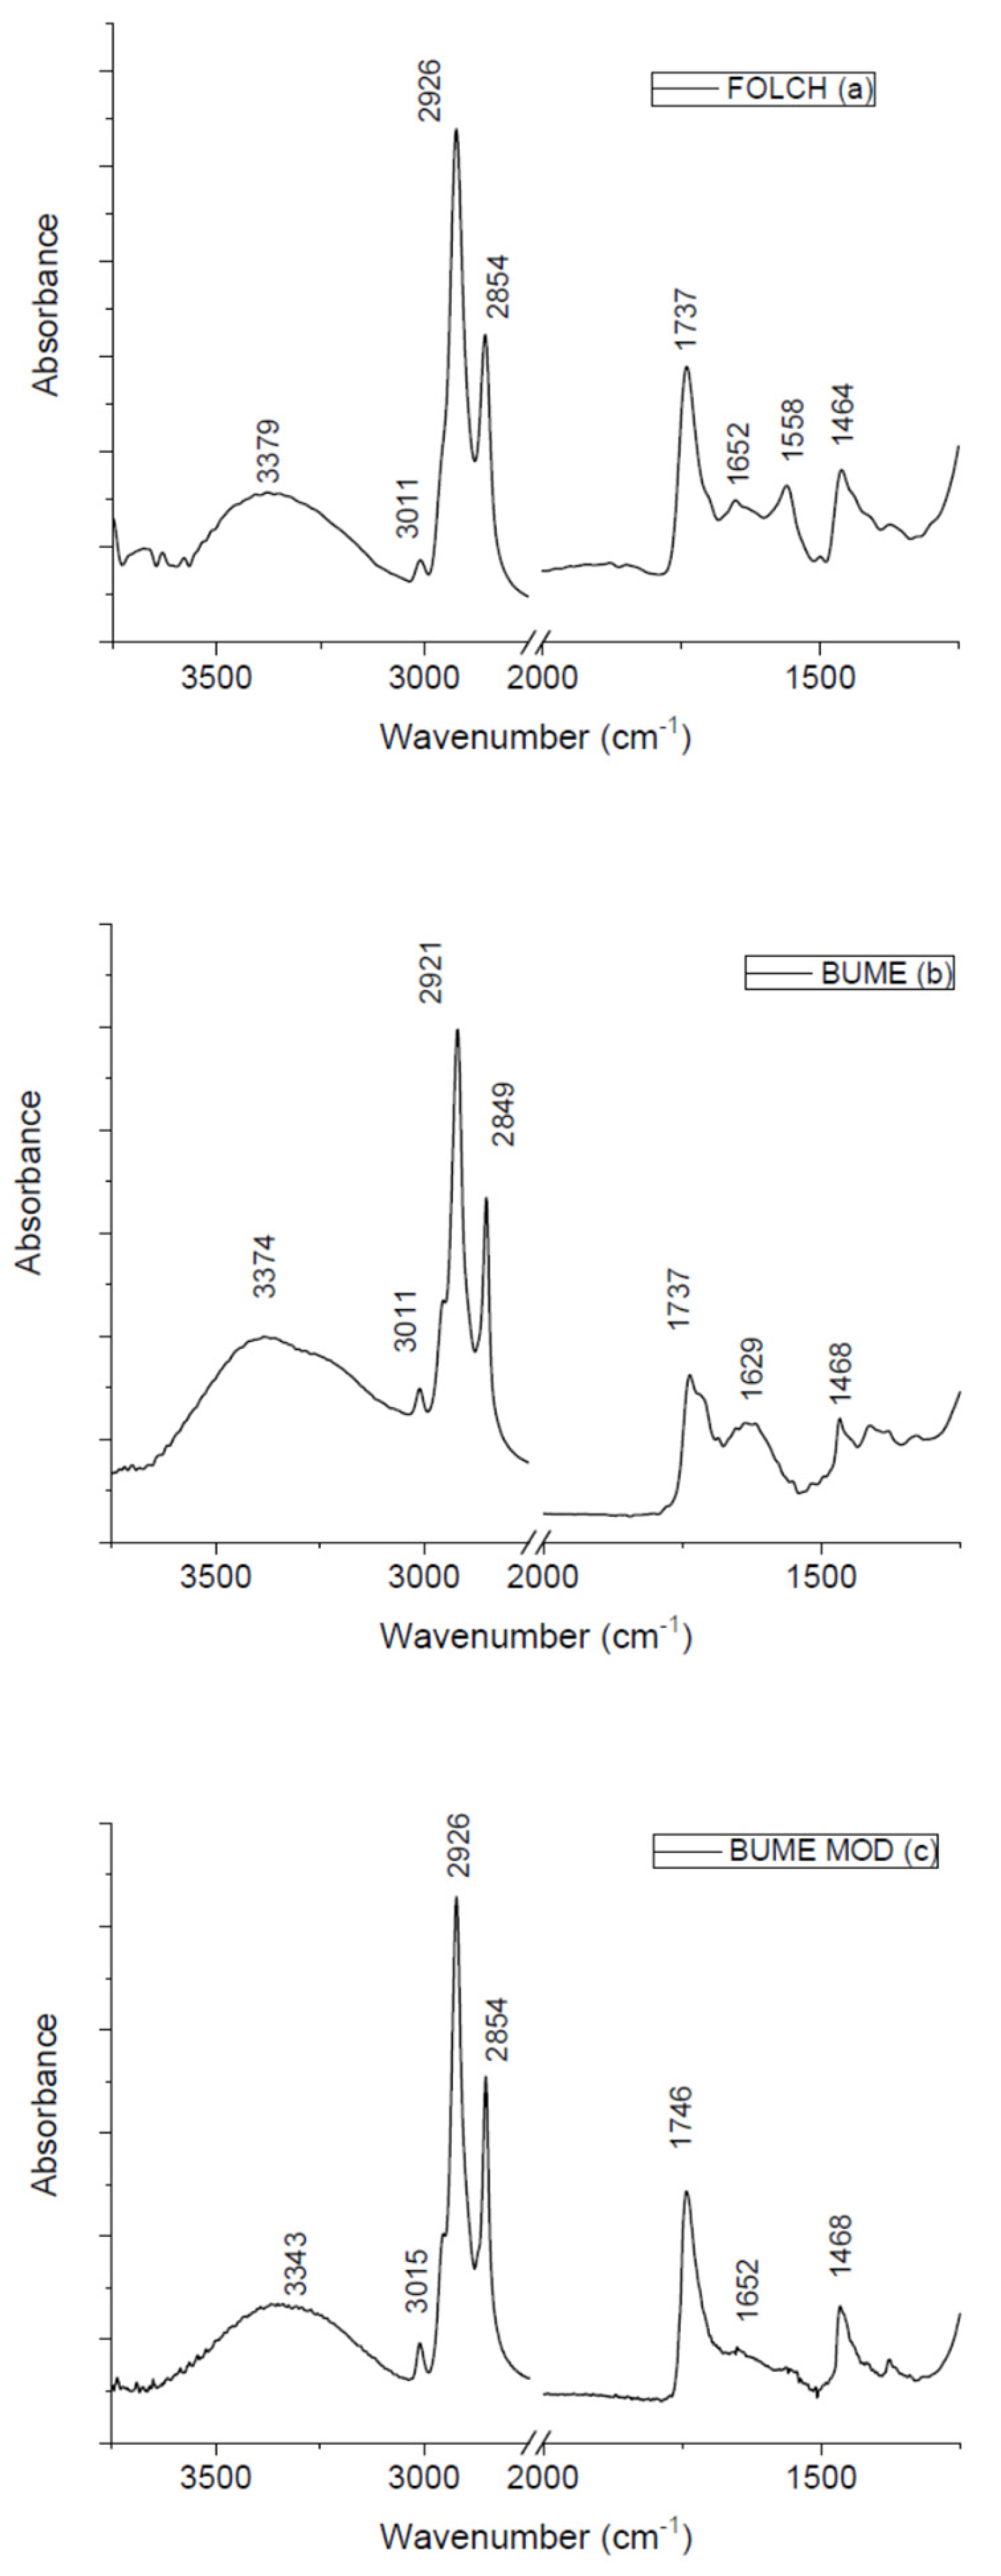
In Figure 1 the FTIR spectra of lipids obtained from the three different techniques are reported. They show similar profiles with some differences in shape and in the relative intensities of different peaks. The contributions due to functional groups related to lipids are clearly evident. In addition, some peaks ascribed to proteins are also present. In the high wavenumber region, the band related to Amide A contribution is positioned at 3379, 3374, and 3343 cm−1 for lipids extracted using Folch, Bume and Bume modified methods, respectively. Around 3011 cm−1 the contribution due to C-C unsaturated fatty acids is present for all the examined samples. The contribution of CH2 asymmetric stretching is located at 2926 cm−1 for samples extracted using Folch and Bume modified method and at 2921 cm−1 for samples obtained by using the Bume method. Around 2850 cm−1 the peak related to CH2 symmetric stretching is evidenced for the examined samples. At 1737 cm−1 there is the contribution from ester C-O stretching mode for Folch and Bume method-extracted samples. This contribution is located at 1746 cm−1 for samples extracted using Bume modified technique. The contribution from Amide I mode is located in the same position (1652 cm−1) for samples extracted by means of Folch and Bume modified methods and moved to 1629 cm−1 for samples produced by the Bume method. Only samples obtained by the Folch method presents a peak at 1558 cm−1 that can be ascribed to Amide II contribution. Around 1468 cm−1 a CH2 bending-related peak can also be evidenced for all the samples. It is worth noting that some differences in the peak positions due to the same vibrational modes for the samples extracted with different methods are not significant because they are within the spectral resolution of our system (4 cm−1). For the displacements that are larger than the experimental spectral resolution further studies are in progress for interpreting these changes. In Table 1, the assignments of all the main peaks present in the spectra are summarized.
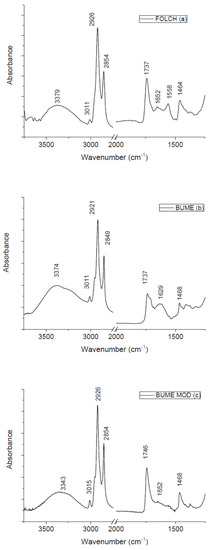
Figure 1.
FT-IR spectra of samples obtained with three different extraction methods.

Table 1.
Main peaks present in the spectra of Figure 1 and assignments according to Ref. [16] and references therein.
As is evident from the visual inspection of the spectra, all the three used methods are quite efficient in lipid extraction, even though changes in the peak intensities are evident. It is well-known that the direct use of the peak intensity can be affected by different artifacts and more robust quantitative information can be extracted from infrared spectra by estimating the ratio between the intensities of selected peaks [13]. For this reason, we performed a ratiometric analysis as proposed by different authors (see Refs. [13,14,15]). Preliminarily, the ratio between the intensity of the CH2 asymmetric stretching peak (located at ≈2926 cm−1 and related to lipid content) and the one of the Amide A peak (placed ≈3300 cm−1 and due to protein content) has been evaluated. This ratio assumes the values 2.75 ± 0.14, 2.5 ± 0.13 and 3.94 ± 0.20 for samples extracted using Folch, Bume and Bume modified methods, respectively. These values allow us to consider Bume modified method as the most efficient in lipid extraction from murine liver tissues. Additional information given by the ratio evaluated by considering other relevant peaks is currently being studied.
4. Conclusions
In the present paper, we investigated the efficiency in lipid extraction of three different methods by using FT-IR spectroscopy. All the three procedures show good performances. The evaluation of the ratio between the intensity of two peaks related to lipid and protein contributions indicates that the Bume modified method is characterized by the higher efficiency. Further investigations are in progress for confirming these results. Among the three different extraction systems used in this study, the Bume and Bume modified methods are superior to the Folch method in terms of simplicity, through-put, automation, solvent consumption, economy, health, and environment yet delivering lipid recoveries fully comparable to or better than the Folch method.
Author Contributions
Conceptualization, M.L. and N.D.; methodology, M.L. and S.E.; software, M.M. and S.E.; validation, sample preparation, M.M. and S.E.; investigation, M.M., S.E. and M.L.; writing—original draft preparation, M.M. and M.L.; writing—review and editing, M.M., S.E., N.D. and M.L. All authors have read and agreed to the published version of the manuscript.
Funding
This research received no external funding.
Institutional Review Board Statement
The study was conducted according with the rules of the European Union Guide for the Care and Use of Laboratory Animals.
Informed Consent Statement
Not applicable.
Data Availability Statement
Data are available on request.
Conflicts of Interest
The authors declare no conflict of interest.
References
- Bari, M.; Bisogno, T.; Battista, N. Bioactive Lipids in Health and Disease. Biomolecules 2020, 10, 1698. [Google Scholar] [CrossRef] [PubMed]
- Rhee, E.P.; Cheng, S.; Larson, M.G.; Walford, G.A.; Lewis, G.D.; McCabe, E.; Yang, E.; Farrell, L.; Fox, C.S.; O’Donnell, C.J.; et al. Lipid profiling identifies a triacylglycerol signature of insulin resistance and improves diabetes prediction in humans. J. Clin. Investig. 2011, 121, 1402–1411. [Google Scholar] [CrossRef]
- Yetukuri, L.; Katajamaa, M.; Medina-Gomez, G.; Seppanen-Laakso, T.; Vidal-Puig, A.; Oresic, M. Bioinformatics strategies for lipidomics analysis: Characterization of obesity related hepatic steatosis. BMC Syst. Biol. 2007, 1, 12. [Google Scholar] [CrossRef] [PubMed]
- Chan, R.B.; Oliveira, T.G.; Cortes, E.P.; Honig, L.S.; Duff, K.E.; Small, S.A.; Wenk, M.R.; Shui, G.; Di Paolo, G. Comparative lipidomic analysis of mouse and human brain with Alzheimer disease. J. Biol. Chem. 2012, 287, 2678–2688. [Google Scholar] [CrossRef] [PubMed]
- Derenne, A.; Claessens, T.; Conus, C.; Goormaghtigh, E. Infrared Spectroscopy of Membrane Lipids. In Encyclopedia of Biophysics; Roberts, G.C.K., Ed.; Springer: Berlin/Heidelberg, Germany, 2013. [Google Scholar]
- Jurowski, K.; Kochan, K.; Walczak, J.; Barańska, M.; Piekoszewski, W.; Buszewski, B. Analytical Techniques in Lipidomics: State of the Art. Crit. Rev. Anal. Chem. 2017, 47, 418–437. [Google Scholar] [CrossRef] [PubMed]
- Baker, M.J.; Trevisan, J.; Bassan, P.; Bhargava, R.; Butler, H.J.; Dorling, K.M.; Fielden, P.R.; Fogarty, S.W.; Fullwood, N.J.; Heys, K.A.; et al. Using Fourier transform IR spectroscopy to analyze biological materials. Nat. Protoc. 2014, 9, 1771–1791. [Google Scholar] [CrossRef] [PubMed]
- Kuang, L.; Fernandes, D.A.; O’Halloran, M.; Zheng, W.; Jiang, Y.; Ladizhansky, V.; Brown, L.S.; Liang, H. “Frozen” block copolymer nanomembranes with light-driven proton pumping performance. ACS Nano 2014, 8, 537–545. [Google Scholar] [CrossRef] [PubMed]
- Forfang, K.; Zimmermann, B.; Kosa, G.; Kohler, A.; Shapaval, V. FTIR Spectroscopy for Evaluation and Monitoring of Lipid Extraction Efficiency for Oleaginous Fungi. PLoS ONE 2017, 12, e0170611. [Google Scholar] [CrossRef] [PubMed]
- Ulmer, C.Z.; Jones, C.M.; Yost, R.A.; Garrett, T.J.; Bowden, J.A. Optimization of Folch, Bligh-Dyer, and Matyash sample-to-extraction solvent ratios for human plasma-based lipidomics studies. Anal. Chim. Acta 2018, 1037, 351–357. [Google Scholar] [CrossRef] [PubMed]
- Löfgren, L.; Forsberg, G.-B.; Ståhlman, M. The BUME method: A new rapid and simple chloroform-free method for total lipid extraction of animal tissue. Science 2016, 6, 27688. [Google Scholar] [CrossRef] [PubMed]
- Cruz, M.; Wang, M.; Frisch-Daiello, J.; Han, X. Improved Butanol-Methanol (BUME) Method by Replacing Acetic Acid for Lipid Extraction of Biological Samples. Lipids 2016, 51, 887–896. [Google Scholar] [CrossRef] [PubMed]
- Kumar, S.; Verma, T.; Mukherjee, R.; Ariese, F.; Somasundaram, K.; Umapathy, S. Raman and infrared microspectroscopy: Towards quantitative evaluation for clinical research by ratiometric analysis. Chem. Soc. Rev. 2016, 45, 1879–1900. [Google Scholar] [CrossRef] [PubMed]
- Gautam, R.; Chandrasekar, B.; Deobagkar-Lele, M.; Rakshit, S.; Umapathy, S.; Nandi, D. Identification of early biomarkers during acetaminophen-induced hepatotoxicity by Fourier transform infrared microspectroscopy. PLoS ONE 2012, 7, e45521. [Google Scholar]
- Ricciardi, V.; Portaccio, M.; Manti, L.; Lepore, M. An FT-IR microspectroscopy ratiometric approach for monitoring X-ray irradiation effects on SH-SY5Y human neuroblastoma cells. Appl. Sci. 2020, 10, 2974. [Google Scholar] [CrossRef]
- Errico, S.; Portaccio, M.; Nicolucci, C.; Meccariello, R.; Chianese, R.; Scafuro, M.; Lepore, M.; Diano, N. A novel experimental approach for liver analysis in rats exposed to Bisphenol A by means of LC-mass spectrometry and infrared spectroscopy. J. Pharm. Biomed. Anal. 2019, 165, 207–212. [Google Scholar] [CrossRef] [PubMed]
Publisher’s Note: MDPI stays neutral with regard to jurisdictional claims in published maps and institutional affiliations. |
© 2021 by the authors. Licensee MDPI, Basel, Switzerland. This article is an open access article distributed under the terms and conditions of the Creative Commons Attribution (CC BY) license (https://creativecommons.org/licenses/by/4.0/).