
Modelling the Electric Field Distribution in Polyethylene Nano-Composite to Investigate Electrical Treeing Initiation Using Finite Element Method †


Abstract
:1. Introduction
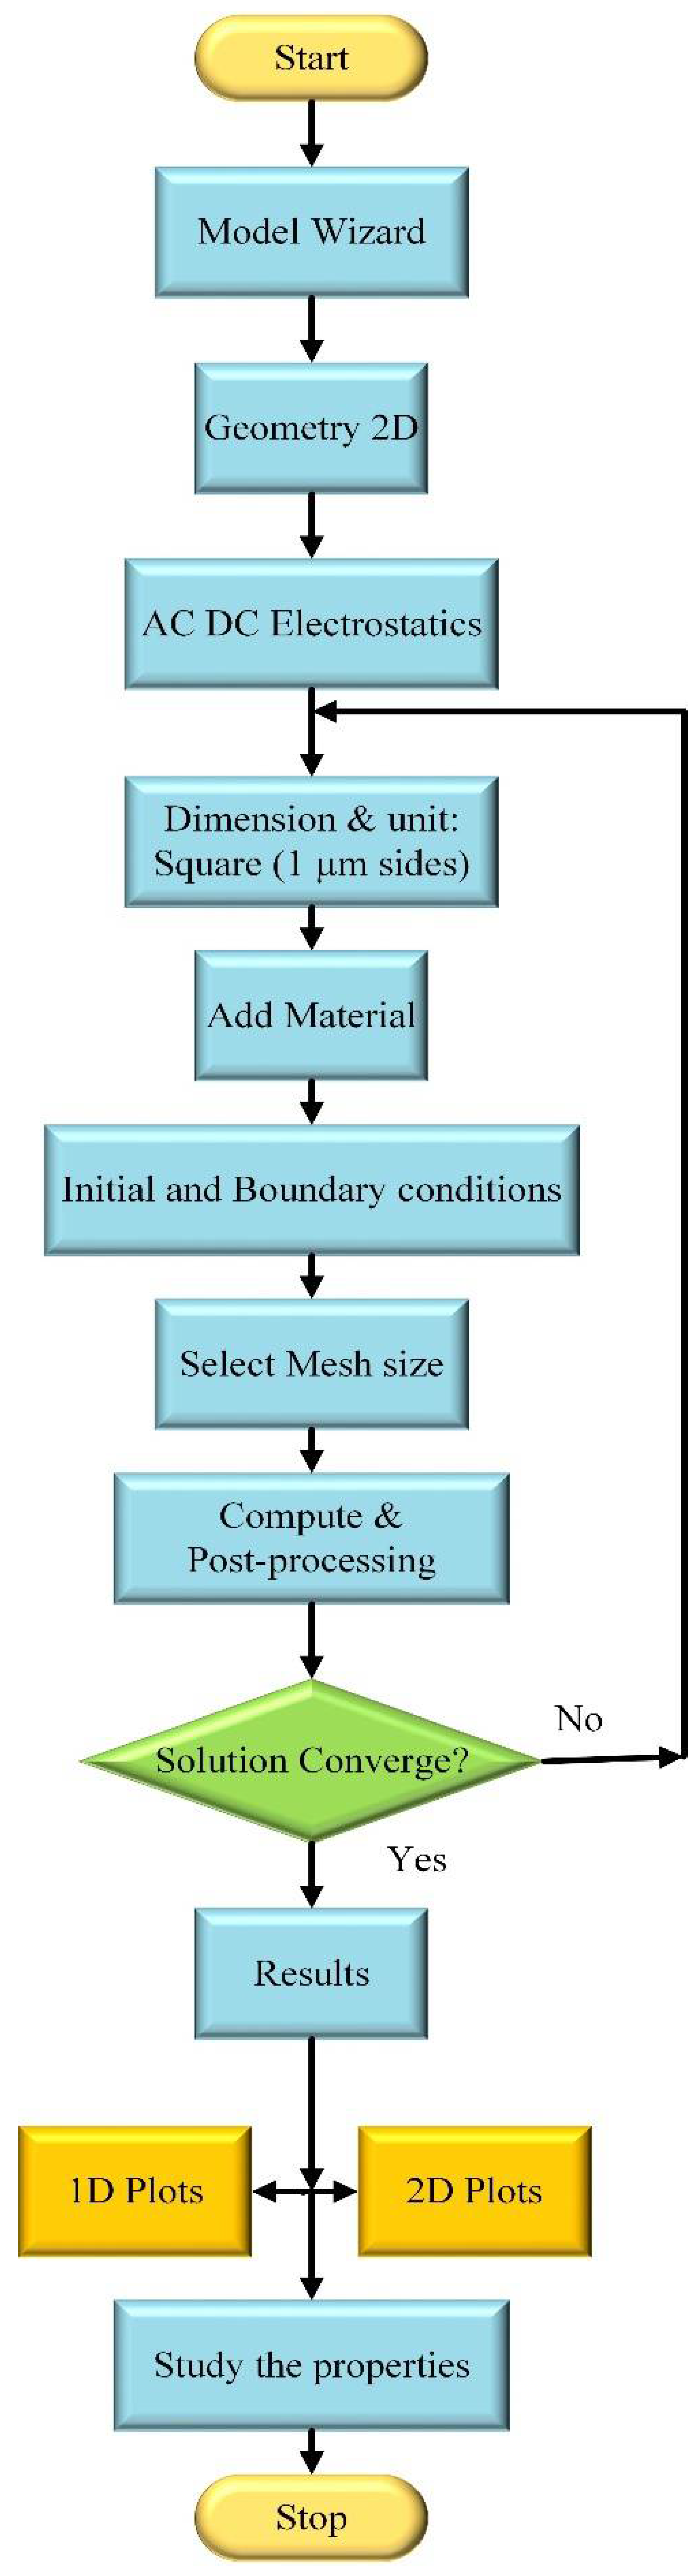
2. Methodology
3. Simulation and Results
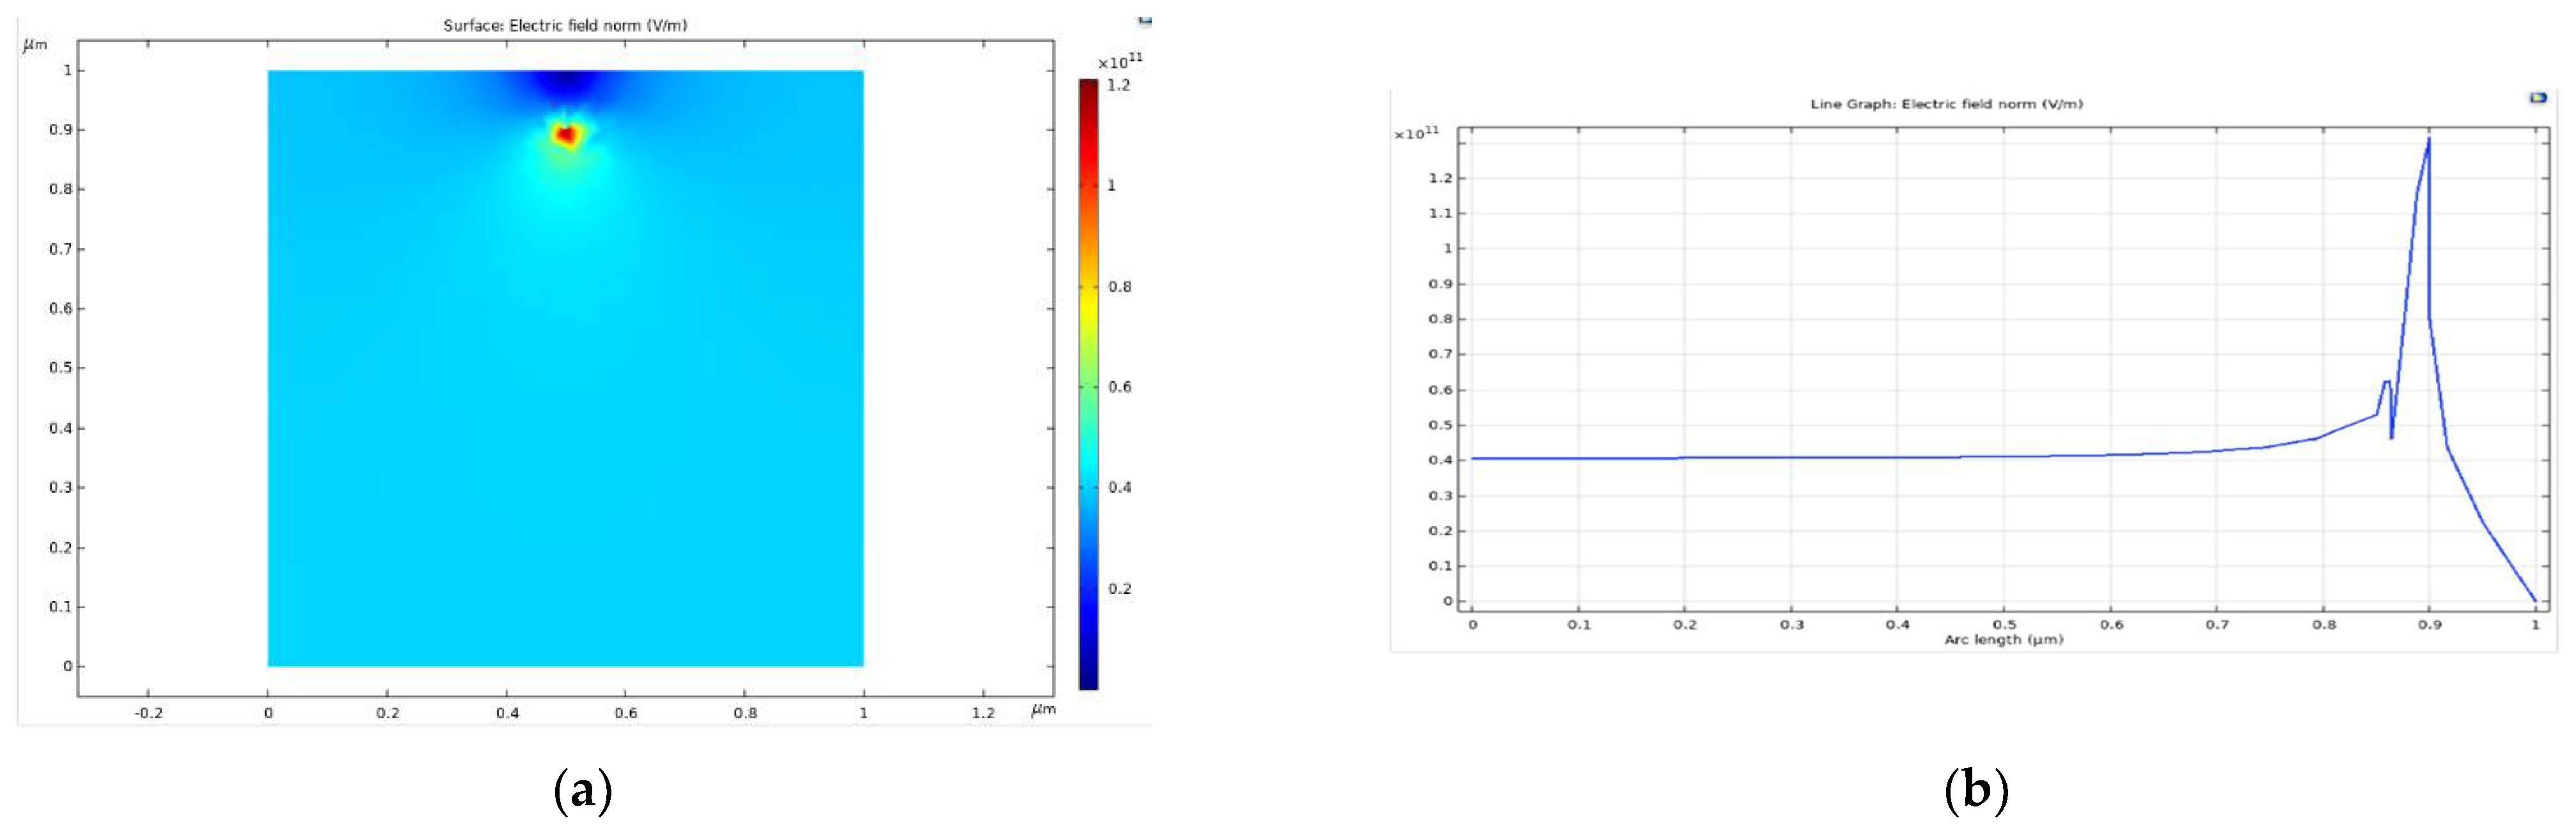
3.1. Electric Field Modelling in Raw Polyethylene
3.2. Electric Field Modelling in Polyethylene under the Effect of Air Filled Voids or Defects
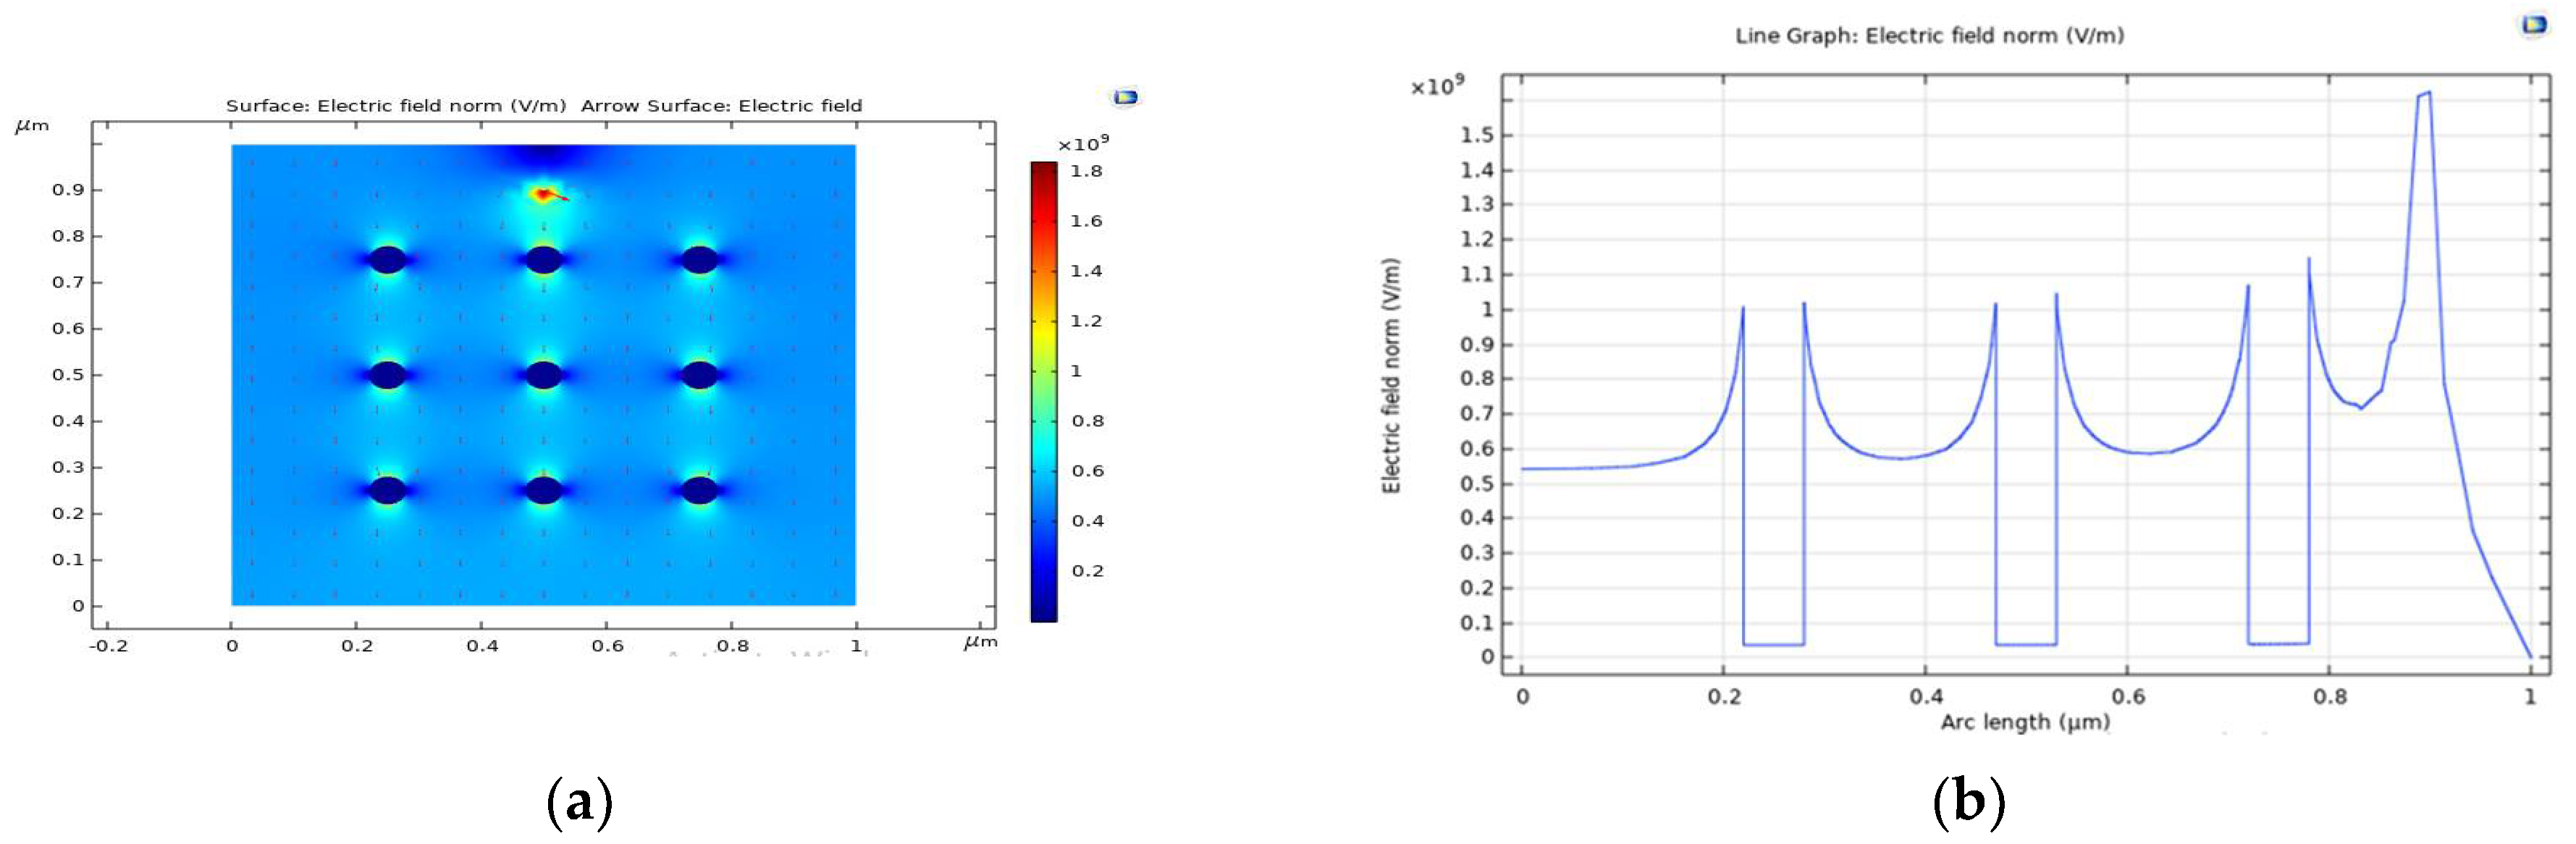
3.3. Electric Field Modelling in Polyethylene under the Effect of Filler Particle
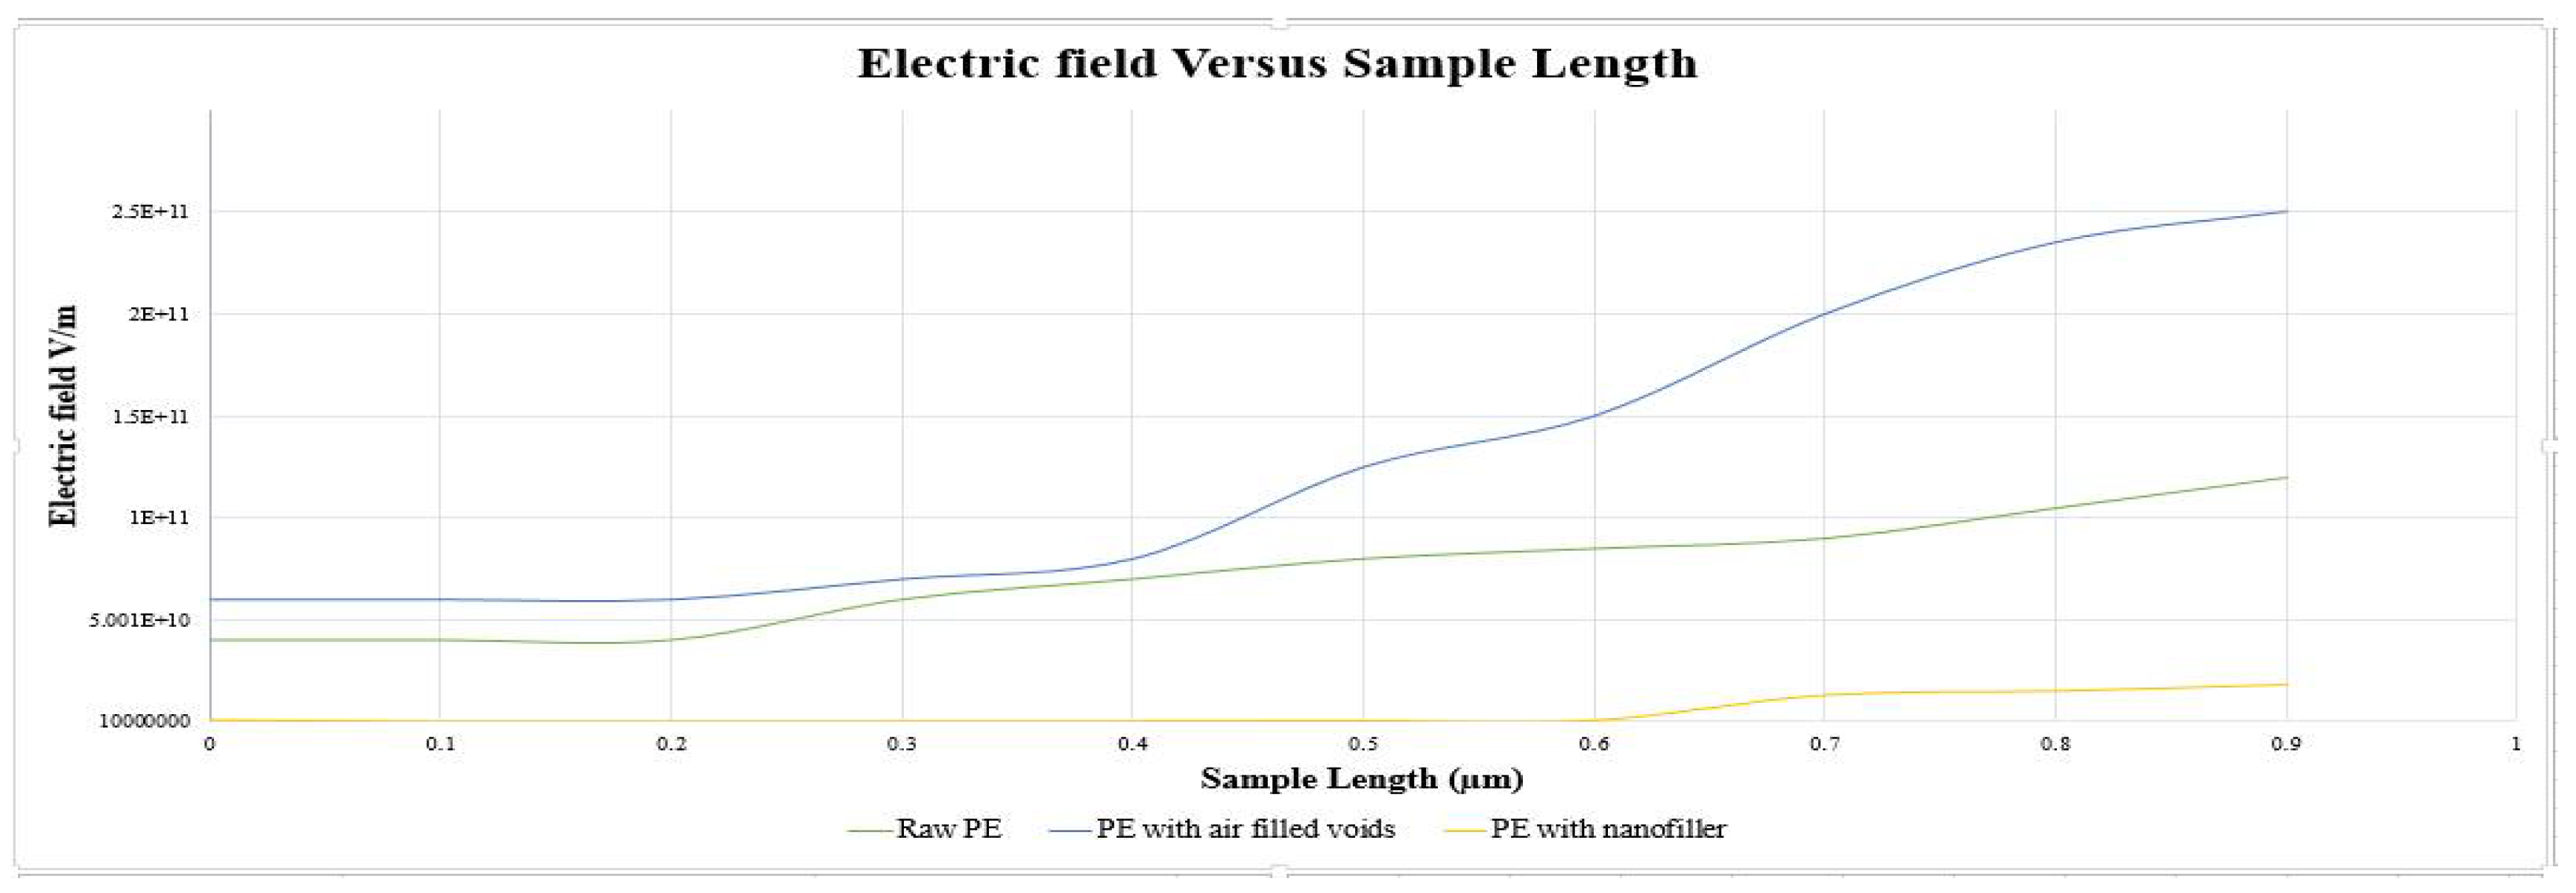
4. Discussion
5. Conclusions
Author Contributions
Funding
Institutional Review Board Statement
Informed Consent Statement
Data Availability Statement
Conflicts of Interest
References
- Chen, G.; Tham, C.H. Electrical treeing characteristics in XLPE power cable insulation in frequency range between 20 and 500 Hz. IEEE Trans. Dielectr. Electr. Insul. 2009, 16, 179–188. [Google Scholar] [CrossRef] [Green Version]
- Zheng, X.; Chen, G. Propagation mechanism of electrical tree in XLPE cable insulation by investigating a double electrical tree structure. IEEE Trans. Dielectr. Electr. Insul. 2008, 15, 800–807. [Google Scholar] [CrossRef] [Green Version]
- Huuva, R. New Test Arrangement for Measuring Electrical Treeing Resistance in Polymers. Ph.D. Thesis, Chalmers University of Technology, Göteborg, Switzerland, 2007. [Google Scholar]
- Ahmad, M.H.; Bashir, N.; Ahmad, H.; Jamil, A.A.A.; Suleiman, A.A. An overview of electrical tree growth in solid insulating material with emphasis of influencing factors, mathematical models and tree suppression. TELKOMNIKA Indones. J. Electr. Eng. 2014, 12, 5827–5846. [Google Scholar] [CrossRef]
- Dissado, L.A. Understanding electrical trees in solids: From experiment to theory. IEEE Trans. Dielectr. Electr. Insul. 2002, 9, 483–497. [Google Scholar] [CrossRef]
- Shimizu, N.; Laurent, C. Electrical tree initiation. IEEE Trans. Dielectr. Electr. Insul. 1998, 5, 651–659. [Google Scholar] [CrossRef]
- Mcdonald, H. Ageing in Epoxy Resin as a Precursor to Electrical Treeing; The University of Manchester (United Kingdom): Oxford, UK, 2020. [Google Scholar]
- Abdulah, C.S.K.; Rohani, M.N.K.H.; Ismail, B.; Isa, M.A.M.; Rosmi, A.S.; Mustafa, W.A.; Kamarol, M. Electrical Tree Investigation on Solid Insulation for High Voltage Applications. In Proceedings of the 2021 IEEE Symposium on Industrial Electronics & Applications (ISIEA), Virtual, 10–11 July 2021; pp. 1–6. [Google Scholar]
- Murakami, Y.; Noda, T.; Kawashima, T.; Hozumi, N. Electrical Treeing Breakdown Characteristics of Epoxy/Spherical Boron Nitride with Card-House Structure Composites. IEEJ Trans. Electr. Electron. Eng. 2022, 7, 169–173. [Google Scholar] [CrossRef]
- Park, J.-J. Electrical Treeing and Partial Discharge Characteristics of Epoxy/Silica Nanocomposite under Alternating Current. Int. J. Polym. Sci. 2021, 2021, 6671681. [Google Scholar] [CrossRef]
- Hamzah, M.S.; Jaafar, M.; Ismail, H.; Jamil, M.K.M. Electrical treeing characteristics of alumina-, zinc oxide-, and organoclay-nanoparticle-filled XLPE nanocomposites. Polym. Eng. Sci. 2022, 62, 772–780. [Google Scholar] [CrossRef]
- Aouabed, F.; Bayadi, A.; Rahmani, A.E.; Boudissa, R. Finite element modelling of electric field and voltage distribution on a silicone insulating surface covered with water droplets. IEEE Trans. Dielectr. Electr. Insul. 2018, 25, 413–420. [Google Scholar] [CrossRef]


| Initial Conditions | Boundary Conditions |
|---|---|
| 1. Initial values applied to entire sample and potential is kept zero volts. | 1. Charge conservation is applied to the sample with Equation (3). 2. Zero charge is assign to both horizontal sides. 3. Ground (0 V) is assigned to the bottom surface. 4. Electric potential is applied on the upper boundary. |
| Sr. No. | Dielectric Condition | Emax (V/m) (at Needle) | Emin (V/m) (at Plate) | Electric Field (E) | Electrical Tree Initiation |
|---|---|---|---|---|---|
| 1. | Raw PE | 1.2 × 10¹¹ | 0.4 × 10¹¹ | Nonuniform, intense | √ Max E > Breakdown strength |
| 2. | PE with air filled void | 2.5 × 10¹¹ | 0.6 × 10¹¹ | Extremely nonuniform, intense | √ Max E >> Breakdown strength |
| 3. | PE filled with TiO2 particle | 1.8 × 10⁹ | 0.1 × 10⁹ | Uniform, less intense | X Max E < Breakdown strength |
Publisher’s Note: MDPI stays neutral with regard to jurisdictional claims in published maps and institutional affiliations. |
© 2022 by the authors. Licensee MDPI, Basel, Switzerland. This article is an open access article distributed under the terms and conditions of the Creative Commons Attribution (CC BY) license (https://creativecommons.org/licenses/by/4.0/).
Share and Cite
Azhar, K.; Amin, S. Modelling the Electric Field Distribution in Polyethylene Nano-Composite to Investigate Electrical Treeing Initiation Using Finite Element Method. Eng. Proc. 2022, 20, 30. https://doi.org/10.3390/engproc2022020030
Azhar K, Amin S. Modelling the Electric Field Distribution in Polyethylene Nano-Composite to Investigate Electrical Treeing Initiation Using Finite Element Method. Engineering Proceedings. 2022; 20(1):30. https://doi.org/10.3390/engproc2022020030
Chicago/Turabian StyleAzhar, Khola, and Salman Amin. 2022. "Modelling the Electric Field Distribution in Polyethylene Nano-Composite to Investigate Electrical Treeing Initiation Using Finite Element Method" Engineering Proceedings 20, no. 1: 30. https://doi.org/10.3390/engproc2022020030
APA StyleAzhar, K., & Amin, S. (2022). Modelling the Electric Field Distribution in Polyethylene Nano-Composite to Investigate Electrical Treeing Initiation Using Finite Element Method. Engineering Proceedings, 20(1), 30. https://doi.org/10.3390/engproc2022020030