Abstract
In this work, we report on the fabrication and testing of a fiber optics sensor based on multimodal interference (MMI) that is capable of measuring sugar concentration in aqueous solutions. The sensor has a simple structure, built by splicing a segment of multimode fiber (MMF) between two single-mode fibers (SMS architecture). The sensor’s operating mechanism is based on the spectral shift due to changes in the effective refractive index (RI) of the media surrounding the MMF. The optical sensor was tested with fructose and sucrose, which were diluted in distilled water in a concentration range from 0% to 18.5%. The proposed device exhibits a linear response with a sensitivity of around 0.17524 nm/% and 0.16321 nm/% for sucrose and fructose, respectively. In addition, this optical sensor shows the advantage of simple construction, low cost, and linear response, it does not require additional processes or coatings on the optical fiber.
1. Introduction
Frequently, sugar is preceded by its dangerous reputation as an antagonist of a nourishing, balanced diet. However, it cannot be removed from the human diet and the consumption in moderate amounts of the right type of sugars, allows a healthy condition. Sugar, along with other nutrients (proteins, fats, and vitamins), provides energy for different organs to perform correctly, such as the brain and muscles, whose functionality is essential throughout life and for physiological functions [1,2]. International organizations focused on health care suggest that sugars should make up less than 5% of total energy intake per day [3]. Therefore, it is necessary to distinguish the amounts of sugars present in food; not taking care of this aspect, together with aggravating factors such as lack of exercise, genetic predisposition, or excessive intake, can lead to hyperglycaemia, diabetes, and cardiovascular diseases, among others [2].
Given the circumstances and quality control in the manufacture of commercial foods, it is necessary to have a tool that permits the detection of different concentrations of sugars and, in this way, guarantees the value of the product. In this scenario, several methods can be used for measuring sugar concentrations, such as Raman spectroscopy coupled with neural networks [4], the monitoring of refractive index [5], fluorescence [6], and radiofrequency techniques [7]. These procedures can provide detailed information; however, they often require complex manufacturing procedures or additional peripherical instrumentation. In contrast, fiber optic-based photonic sensors represent a valuable tool in the field of metrology, resulting in innovative devices with applications in real problems and with notable advantages over conventional electronic sensors. Given the benefits already demonstrated, the interest is to use this type of photonic component in the food area with the aim of measuring sugar concentration levels for industrial applications.
2. Materials and Methods
2.1. SMS Sensor Device and Sample Preparation
A simple configuration of the multimodal interference (MMI) effect in optical fibers, that can be used for sensing the refractive index of liquid samples, can be achieved with conventional elements: a segment of no-core multimode fiber (NC-MMF) spliced between two single-mode fiber segments (SMF). This geometry is commonly referred to as SMS configuration, and it is illustrated in Figure 1 (dotted rectangle). When the SMS structure is fed with a broadband spectrum, optical modes are excited in the segment of MMF, which can interfere with one another as they propagate. Thus, the interference of these modes along the NC-MMF element leads to a periodic formation of self-images of the input field. Therefore, the NC-MMF fiber must have a specific length to reconstruct the input field at the exit of the NC-MMF at a specific wavelength. Importantly, only a specific wavelength of the initial spectrum satisfies the constructive interference condition at the end of the MMF; in other words, the SMS architecture operates naturally as a bandpass filter centered at a certain wavelength, This peak wavelength can be designed by appropriately cleaving the NC-MMF with the right length, given by relation [8,9]:
where denotes the beat length given as:
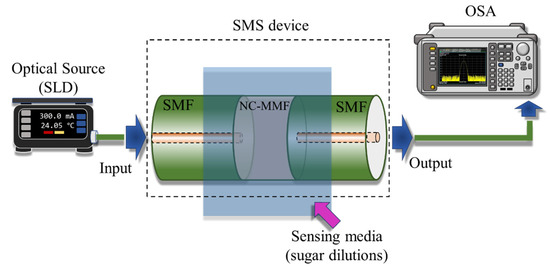
Figure 1.
Experimental set-up used to measure sugar concentrations. In dotted rectangle, the SMS device is shown which is fabricated by splicing an NC-MMF segment between two SMF sections.
Here, and are the refractive index and diameter of the fundamental mode of the NC-MMF, respectively, and is the free-space wavelength. If the SMS structure is fully immersed in a liquid, the refractive index difference between the two media, i.e., silica and liquid, is lower when compared with the case where the fiber is surrounded by air. Thus, due to the Goos–Hänchen effect, the lateral penetration of the evanescent field into the liquid will be higher [9]. Consequently, both and increase, causing the center wavelength of the bandpass filter, expressed in Equation (2), to shift. This is the principle of operation of the proposed system.
The SMS was fabricated using SMF fiber (SMF-28, ®Thorlabs, Newton, NJ, USA), with cladding and core diameters of 125 µm and 8 µm, respectively, and NC-MMF fiber (FG125LA, ®Thorlabs, Newton, NJ, USA), with a diameter and . All segments were spliced using an arc fusion splicer, (®Fujikura, San Jose, CA, USA, model FSM-60S). According to Equation (2), the length of the NC-MMF segment is for the peak wavelength to be centered at .
To test the sensor device, we prepared water–sugar mixtures using deionized water (®Sigma Aldrich, San Louis, MO, USA, 99% pure) and commercial brands of sucrose and fructose. The mixtures were prepared in a range from 0.5%v/v to 18.5%v/v, with increments of 1.5%. The mixtures were based on volume fraction (%v/v) [10].
2.2. Experimental Array
The optical system to test the SMS structure as a sensor, is described in Figure 1. In this scheme, a superluminescent laser diode (SLD, Model SLD1550S-A1, @Thorlabs) provides a broadband spectrum from 1420 nm to 1650 nm, which is launched into an FC/PC patch cable. Later, the signal is propagated into the SMS device, collected by a second patch cable, and measured with an optical spectrum analyzer (OSA, ®Anritsu, Morgan Hill, CA, USA, model MS9740A).
3. Results and Discussion
The response of the fabricated sensor was tested with sucrose and fructose. Experimental tests were initiated by fixing the sensor in a container and covering it completely with each liquid sample (aqueous solutions of sucrose or fructose, with concentrations ranging from 0.5% to 18.5%, in increments of 1.5%). For each sample, the spectrum of the obtained signal was recorded in the OSA. Subsequently, the sensor was meticulously cleaned using de-ionized water; when dried, the sensor was reattached, so that it was placed in initial conditions. Figure 2a shows the spectral change in the sensor in response to the sucrose concentration, while Figure 2b shows the displacement in response to the fructose concentration.
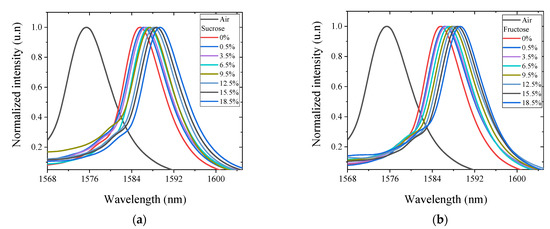
Figure 2.
Spectral response of the MMI sensor for different concentrations of sugar dissolved in distilled water: (a) Sucrose spectral displacement; (b) Fructose spectral displacement.
The spectral shift of the peak of the wavelength, , for each sugar is shown in Figure 3, as a function of sugar concentration in the solution. This displacement is calculated as the difference between the maximum peak wavelength when the SMS structure is immersed in the mixture and its measured position in the air. The positive spectral change is proportional to the concentration level of the sample. By increasing the amount of sucrose and fructose, respectively, the displacement of the peak of the wavelength increases.
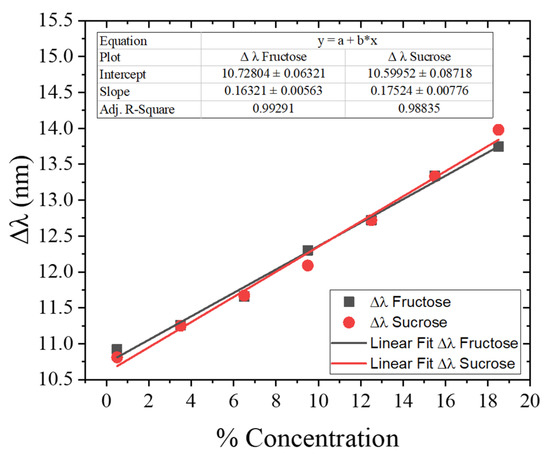
Figure 3.
Displacement of the wavelength peak for each concentration.
As is shown, the sensor exhibits a linear response with a sensitivity of 0.17524 nm/% and 0.16321 nm/% for sucrose and fructose, respectively. To obtain the level of error, three representative samples were selected from the original sample set: 6.5%, 12.5%, and 18.5%, and their response was measured in triplicate by following the same measurement procedure described above. From the standard deviation, we obtained a variability of 0.13565 nm and 0.09043 nm for sucrose and fructose, respectively.
4. Conclusions
A MMI fiber optics sensor is presented that allows the detection of different concentrations of sucrose and fructose in aqueous solution. Tests were conducted using commercial brands of sucrose (refined sugar) and fructose powder, used in industrially-produced soft drinks. This optical sensor has the advantage of simple construction, low cost, and linear response; moreover, it does not require additional processes or coatings on the optical fiber, and it has the capability to perform real-time measurements, which makes it suitable for quality control applications.
Author Contributions
Conceptualization, R.F.D.-C. and Y.A.F.-R.; methodology, N.M.-A. and Y.A.F.-R.; formal analysis, N.M.-A., Y.A.F.-R., R.F.D.-C. and J.R.G.-S.; data curation, N.M.-A.; writing—original draft preparation, N.M.-A.; writing—review and editing, Y.A.F.-R., R.F.D.-C. and J.R.G.-S.; visualization, J.R.G.-S. All authors have read and agreed to the published version of the manuscript.
Funding
This research was partially funded by Secretaría de Investigación y Posgrado, Universidad Autónoma de Tamaulipas (Institutional grants program “Expansion of the Research Capacity of the Electronics group at UAM Reynosa Rodhe 2022-2023”).
Institutional Review Board Statement
Not applicable.
Informed Consent Statement
Not applicable.
Data Availability Statement
Not applicable.
Conflicts of Interest
The authors declare no conflict of interest.
References
- Partearroyo, T.; Sánchez Campayo, E.; Varela Moreiras, G. El azúcar en los distintos ciclos de la vida: Desde la infancia hasta la vejez. Nutr. Hosp. 2013, 28, 40–47. [Google Scholar] [PubMed]
- Cabezas Zabala, C.C.; Hernández Torres, B.C.; Vargas Zárate, M. Azúcares adicionados a los alimentos: Efectos en la salud y regulación mundial. Revisión de la literatura. Rev. Fac. Med. 2016, 64, 319–329. [Google Scholar] [CrossRef]
- Jasarevic, T.; Thomas, G. WHO Opens Public Consultation on Draft Sugars Guideline. Available online: https://www.who.int/news/item/05-03-2014-who-opens-public-consultation-on-draft-sugars-guideline (accessed on 16 August 2022).
- Gonzalez-Viveros, N.; Gomez-Gil, P.; Castro-Ramos, J.; Cerecedo-Nunez, H.H. On the estimation of sugars concentrations using Raman spectroscopy and artificial neural networks. Food Chem 2021, 352, 129375. [Google Scholar] [CrossRef] [PubMed]
- Binu, S.; Pillai, V.M.; Pradeepkumar, V.; Padhy, B.; Joseph, C.; Chandrasekaran, N. Fibre optic glucose sensor. Mater. Sci. Eng. C 2009, 29, 183–186. [Google Scholar] [CrossRef]
- Tam, T.V.; Hur, S.H.; Chung, J.S.; Choi, W.M. Novel paper-and fiber optic-based fluorescent sensor for glucose detection using aniline-functionalized graphene quantum dots. Sens. Actuators B Chem. 2021, 329, 129250. [Google Scholar] [CrossRef]
- Aguila Rodriguez, G.; Arias Duque, N.P.; Gonzalez Sanchez, B.E.; Sandoval Gonzalez, O.O.; Giraldo Osorio, O.H.; Trujillo Romero, C.J.; Wilches Torres, M.A.; Flores Cuautle, J.d.J.A. Sugar Concentration Measurement System Using Radiofrequency Sensor. Sensors 2019, 19, 2354. [Google Scholar] [CrossRef]
- Soldano, L.B.; Pennings, E.C.M. Optical multi-mode interference devices based on self-imaging: Principles and applications. J. Lightwave Technol. 1995, 13, 615–627. [Google Scholar] [CrossRef]
- Guzman-Sepulveda, J.R.; Guzman-Cabrera, R.; Castillo-Guzman, A.A. Optical Sensing Using Fiber-Optic Multimode Interference Devices: A Review of Nonconventional Sensing Schemes. Sensors 2021, 21, 1862. [Google Scholar] [CrossRef] [PubMed]
- Ucko, D.A. Basics for Chemistry; Elsevier: Amsterdam, The Netherlands, 2013. [Google Scholar]


Publisher’s Note: MDPI stays neutral with regard to jurisdictional claims in published maps and institutional affiliations. |
© 2022 by the authors. Licensee MDPI, Basel, Switzerland. This article is an open access article distributed under the terms and conditions of the Creative Commons Attribution (CC BY) license (https://creativecommons.org/licenses/by/4.0/).