Abstract
Early and accurate detection of bearing faults is essential for the safe and reliable working of industrial machinery units. The main problem of the traditional fault diagnosis method is manually extracting the features which require the experimenter’s experience and expert knowledge. Therefore, the shallow diagnostic model’s classification rate does not produce good results. To address this issue, this research proposes a technique to detect and classify bearing faults based on an effective convolutional neural network (CNN) model, which is capable of performing complex vibration signals and removing the impact of expert expertise on the feature extraction process. A time-moving segmentation window is used to segment the vibration raw signal and the segmented signals are decomposed up to two levels using DWT. After that, decomposed signals are converted into grayscale images to train and test the proposed CNN model. To verify the performance of the model, CWRU bearing dataset and MFPT dataset are used. The proposed CNN model achieves the highest accuracy in terms of performance both under different load conditions as well as under noisy situations with varying SNR values. The experimental findings show that the proposed system is effective and extremely dependable in detecting bearing faults.
1. Introduction
Bearing fault detection is given special attention by the researcher because of its evident industrial importance among mechanical device components [1]. Bearing is the most essential element of any rolling machinery. The condition of the bearing has a significant impact on machinery. According to a review of the literature, 45–55 percent of machines are broken due to bearing failure [2]. Incorrect bearing defect diagnosis detection and classification can lead to significant system failure and further financial losses [3]. Early and accurate detection of bearing faults is essential for the safe and reliable working of industrial machinery units.
Bearing fault detection is a form of classification problem, and classifiers based on Artificial Intelligence (AI) approaches can successfully classify normal and defective bearing situations. A machine fault categorization problem is divided into two sections. The first section deals with the extraction of features from vibration signals, which is utilized to extract fault information-related features, and the second section is fault classification, which uses the extracted features for problem detection using various AI approaches [4]. In the traditional feature extraction step, features are extracted by crest factor, root mean square (RMS), standard deviation, variance, envelop spectrum, kurtosis, crest value, and estimation [5,6,7].
Asr et al. [8] developed an EMD-based feature extraction method for detecting faults in rotating machinery. The EMD’s entropy energy was measured, as well as a variety of time and frequency characteristics of the vibratory signal. Lei Y et al. [9] employed an adaptable fuzzy inference system (ANFIS) network to classify rolling faults. Wang et al. [10] used a support vector machine (SVM) as a classifier in their model for evaluating vibration signals. Attoui et al. [11] developed a method for extracting features basis on the analysis of the most impulsive frequency bands, and the features acquired after the dimensionality reducing method are input into an ANFIS to classify bearing defects.
The traditional feature extraction procedure [12] finds it challenging to extract features from bearing defects due to the complicated vibration signals. Existing intelligent defect detection systems in actual industry sectors contain deficiencies in early features and multiple undetected compound failure mechanisms because a signal is affected by environmental noise due to changes in working conditions, and the traditional intelligent classification method typically requires pre-processing the data, manual extracting features and pattern classifier [13]. Because the feature extraction technique requires a high level of professional expertise feature extraction, the model does not give appropriate results.
To solve the difficulty of the existing intelligent method, recently, the deep-learning method is used and achieved good results, but its application in fault diagnosis is still developing. This study proposes an effective CNN model for detecting and classifying bearing faults. This study’s contribution is summarized as follows:
- A data preprocessing technique is proposed, which used DWT to decompose signals up to two levels.
- Creates gray images instead of a one-dimensional vibration signal.
- Design an effective CNN architecture that uses the grayscale image directly for classification and is capable of performing complex vibration signals, and noisy situations with varying SNR values and can reduce the influence of the expert’s experience.
2. Experimental validation
In this paper, two datasets are used to evaluate the proposed model: CWRU dataset [14] and the MFPT dataset [15].
2.1. CWRU Dataset
The reason for this dataset choice is that CWRU data has been evaluated by various researchers in the bearing failure research area as a standard and easily accessible dataset [2]. This dataset consists of four classes such as normal (healthy state), inner race fault, ball fault, and outer race fault. Accelerometers are used to capture vibration signal data. Figure 1 depicts the experimental setup, which comprises a 2 hp induction motor. Sampling frequencies of 12 kHz and 48 kHz were employed for data collecting. The operating condition is considered a deep ball bearing type which is 6205-2RS JEM SKM. A total of 102,400 samples of data are considered in normal bearing in this paper, similarly, 102,400 samples of data are considered in each faulty data such as fault in inner, fault in the ball, and fault in outer. This article considers a 0.014 inch fault diameter.
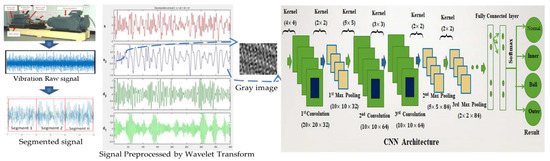
Figure 1.
Proposed System Architecture.
2.2. MFPT Dataset
The MFPT dataset is provided by the Society for Machinery Failure Prevention Technology [15]. The MFPT’s bearing data makes use of a NICE bearing. This dataset provides three classes of bearing data such as normal bearing data, fault in the inner race, and fault in the outer race at various loads. A total of 102,400 samples of data are considered in normal bearing in this paper. Similarly, 102,400 samples of data are considered in both faulty data such as fault in the inner and fault in the outer.
3. Proposed System
The proposed system adopts an approach for detecting and classifying bearing faults based on vibration gray-scale images and an Effective CNN model. The proposed system is described in two key parts. The first part is data pre-processing with signal-to-image conversion and the final part is the effective convolutional neural network models which effectively extract the features and classify the bearing fault diagnosis. Figure 1 presents the overall proposed system architecture.
3.1. Pre-Processing
This paper proposes an effective data pre-processing technique to effectively extract the features. This technique has three steps: segmentation, discrete wavelet transform (DWT), and gray image construction.
3.1.1. Segmentation
The vibration raw signals are segmented by using a time-moving segmentation window. Figure 2 shows the signal segmentation process. A total of 1024 samples are considered for each time-moving segmentation window to create a 32 × 32 matrix. Similarly, 625 and 400 sample data are considered for each segmentation window to create a 25 × 25 and 20 × 20 matrix, respectively.
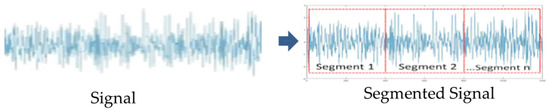
Figure 2.
Signal segmentation.
3.1.2. Wavelet Transform
Wavelet transform is an application tool that analyzed signals [16]. Wavelet transform can signify the complexity of an unsteady signal in the frequency or time domain. The DWT is a signal decomposition method that uses a set of separate, spatially aligned frequency bands. The vibration signal is processed by dual filters, yielding dual signals: details and approximation. This procedure is named analysis signal or decomposition of the signal. The breakdown signal’s apparatuses can be rebuilt further into the original raw signal any losing any information. The DWT is a mathematical operation that entails analysis and synthesis [17]. This paper focuses on DWT to signify the complexity of unsteady segmented vibration signals. This paper used the one-dimensional wavelet decomposition up to two levels. Figure 3 shows the output of wavelet decomposition. In Figure 3 the two levels of details (d1, d2), and approximation (a2) are chosen for each signal.
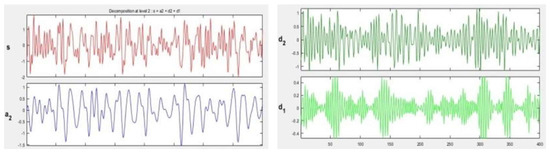
Figure 3.
The output result of wavelet transform.
3.1.3. Gray Image Construction
CNN is used for two-dimension analysis (2D) while bearing fault signals are 1D data. Considering these issues, this paper used an effective data pre-processing technique, which converts the decomposed signals into a gray-scale image. In this method, the decomposed signals sequentially fill the pixels of the image. After that, each signal that has been segmented converts into the intensity of the respective pixel in the associated image. Figure 4 shows the gray image construction procedure. Finally, all of the segmented decomposed signals are converted into gray images, which are shown below in Figure 5.
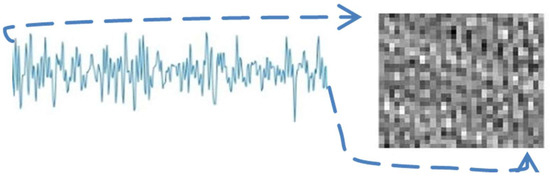
Figure 4.
Signal-to-gray image construction.
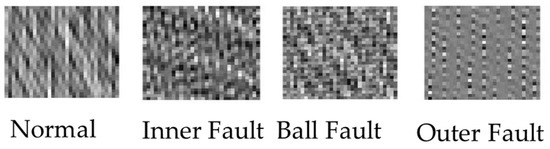
Figure 5.
Gray-scale images of each type.
4. Proposed Effective CNN Architecture
An effective CNN model for detecting and classifying bearing problem diagnostics is developed for this proposed system. The proposed effective CNN model consists of three sequential convolutional layers, three max-pooling layers, two fully connected layers, a softmax classifier, and four output layers. The 1st convolutional layer used a (4 × 4) kernel size of 32 filters, the 2nd convolutional layer used a (5 × 5) kernel size of 64 filters, and the 3rd convolutional layer used a (3 × 3) kernel size of 64 filters. The 1st max-pooling layer used a (2 × 2) kernel size of 32 filters, the 2nd max-pooling layer used 84 filters have a kernel size of (2 × 2), and the 3rd max-pooling layer used 84 filters have a kernel size of (2 × 2). As an activation function, ReLU is used and also used four full connection layers. Softmax is used in this model as a classifier. The network’s parameters are used for proposed effective CNN architectures, which are presented in Table 1 to explore the best accuracy.

Table 1.
Proposed CNN parameters.
5. Experimental Result and Analysis
5.1. Proposed System’s Performance
Figure 6 exhibits the network model’s confusion matrix, which gives a summary of classification results for four types of bearing faults on the CWRU dataset. The overall accuracy of the proposed model is 100% on the CWRU dataset.
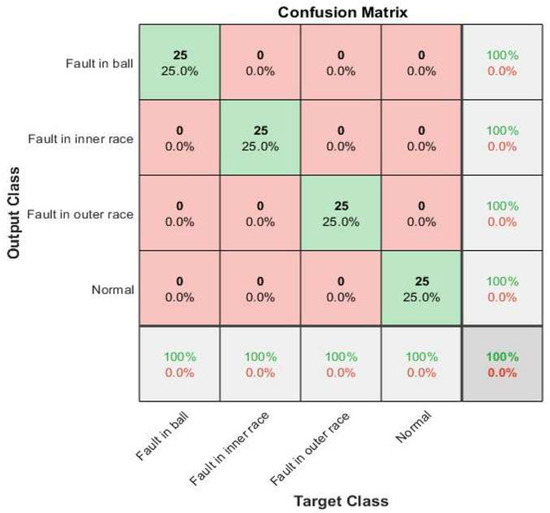
Figure 6.
Confusion matrix on the CWRU dataset.
Figure 7 exhibits the network model’s confusion matrix, which gives a summary of classification results. for three types of bearing faults on the MFPT dataset. The proposed model achieved 96%, 100%, and 96% accuracy in normal conditions, with a fault in the inner race and a fault in the outer race, respectively. The overall accuracy of the proposed model is 97.7% on the MFPT dataset which, indicates that the presented model is very dependable in bearing fault detection.
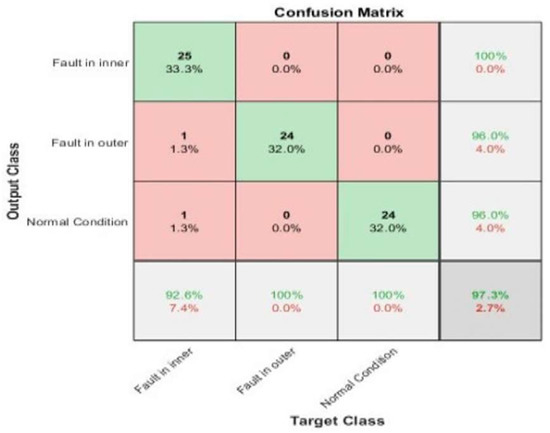
Figure 7.
Confusion matrix on the MFPT dataset.
5.2. Effect of DWT on the Classification Result
In this section, compare the performance between the using DWT and without DWT in a noisy environment. Figure 8 shows the effect of using DWT on classification results. In Figure 8, the performance with DWT is indicated by the red color line on the graph, and the performance without DWT is indicated by the blue dot line on the graph a noisy condition on the CWRU dataset and from the graph can see using DWT is better to perform than without DWT at the noisy environment. The performance with DWT is indicated by the green color line on the graph, and the performance without DWT is indicated by the yellow dot line on the graph at noisy conditions on the MFPT dataset. From the graph, we can see at the noisy environment proposed model using DWT shows better performance on both the CWRU dataset and the MFPT dataset.
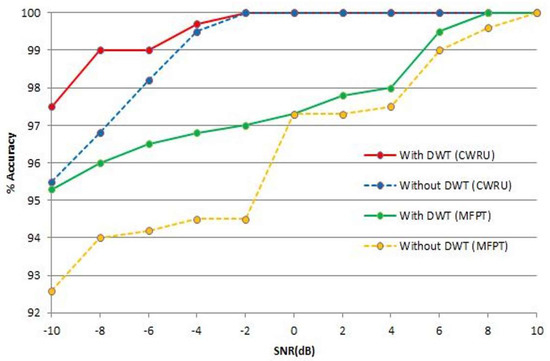
Figure 8.
Effect of DWT on the result.
5.3. Evaluate under Various Load Conditions
In industry or real application, their bearing has to work under different load conditions. When the load changes, the characteristic of the vibration signal also changes, which complicates the fault diagnostic process. In this part, we evaluate the proposed CNN model’s performance under various load situations, such as 0 hp, 1 hp, 2 hp, and 3 hp load.
Figure 9 depicts the proposed CNN model’s performance under various load conditions. In 0 hp and 2 hp load conditions, the proposed model achieved 100% accuracy. In 1 hp load, the accuracy was 98.2%, and in 3 hp load condition, the model achieved 99.4% accuracy.
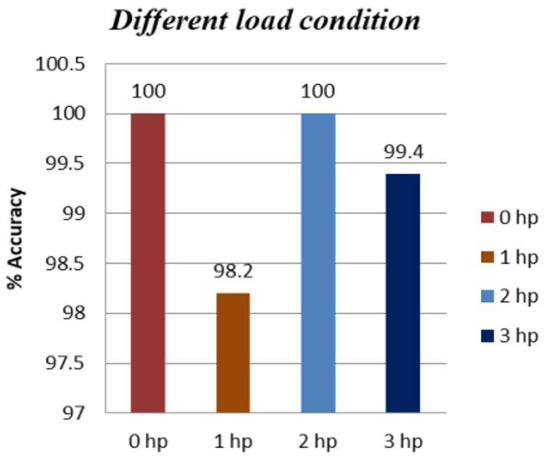
Figure 9.
Performance under various load conditions.
5.4. Evaluate under a Noisy Environment
Signals are affected by noise in real-world industrial applications. Noise is another issue that has evolved as a result of the change in working conditions, which reduces the performance of the model. In this section, we evaluate how well the proposed system performs in a noisy environment while classifying bearing faults. The proposed model is first trained on the original data before being put to the test on noisy data. The noisy signal is created by adding AWG noise to the original signals with varying SNR. The SNR is calculated as follows:
The proposed model is tested using noisy signal amplitudes ranging from −8 dB to 10 dB. Figure 10 shows the success of the proposed model under noisy situations with varying the SNR value from −8 dB to +10 dB. It can be seen that When SNR is high, all models obtain quite a high accuracy; when SRN is ≥6 dB, all models achieve relatively close to 100% but when the SNR value is −4 dB, the SVM accuracy is 68%, WDCNN accuracy is 67.5 and TICNN accuracy is 79.5% but proposed model accuracy is still 99.7%. However, It can be seen that under a noisy environment SNR = −8 dB, the proposed model still has pretty high accuracy, which is 99%.
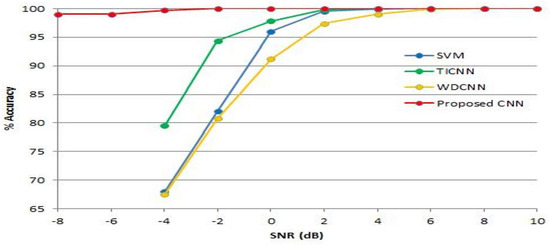
Figure 10.
Performance in a noisy environment.
5.5. Performance of CWRU vs. MFPT Dataset
In this section, we used 75 gray images from each dataset such as the CWRU dataset and the MFPT to test the proposed CNN model. Figure 11 depicts the total classification performance. The blue color represents the CWRU dataset’s accuracy; the red color represents the MFPT dataset’s accuracy. The overall classification accuracy of the CWRU dataset is 100% and the MFPT dataset is 97.3%.
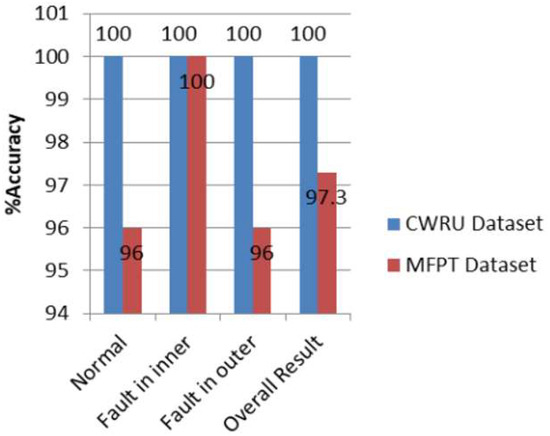
Figure 11.
Performance of CWRU vs. MFPT dataset.
In Figure 12, the red line shows classification performance under a noisy environment in which SNR values are −10 dB to 10 dB and the blue line shows classification performance under a noisy environment at the same SNR values. From the graph, we can see proposed system provides better accuracy on the CWRU dataset than the MFPT dataset.
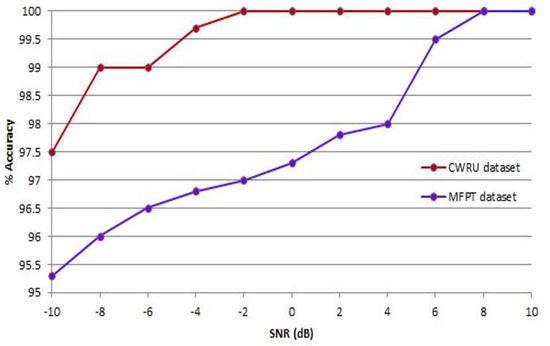
Figure 12.
Performance of CWRU vs. MFPT in a noisy environment.
6. Conclusions
This study aimed to design an effective CNN model based on vibration gray-scale images to solve the existing problems in bearing fault diagnosis which is capable of performing complex vibration signals and can reduce the influence of an expert’s experience on the feature extraction procedure. To verify the performance of the proposed model, CWRU bearing dataset and MFPT dataset are used. The proposed approach is able to classify bearing faults both under different load conditions as well as under noisy environments with different values of SNR. The experimental findings showed that the proposed system is effective and extremely dependable in classifying bearing faults.
Author Contributions
Conceptualization, M.M.; software, writing—original draft preparation, M.S.I.; review, editing, and supervision. All authors have read and agreed to the published version of the manuscript.
Funding
This research received no external funding.
Institutional Review Board Statement
Not applicable.
Informed Consent Statement
Not applicable.
Data Availability Statement
“CWRU Research Data Policies” at https://engineering.case.edu (accessed on 28 October 2022) and “MFPT Research Data Policies” at https://www.mfpt.org/fault-data-sets (accessed on 28 October 2022).
Conflicts of Interest
The authors declare no conflict of interest.
References
- Holm-Hansen, B.T.; Gao, R.X. Vibration analysis of a sensor-integrated ball bearing. J. Vib. Acoust. 2000, 122, 384–392. [Google Scholar] [CrossRef]
- Hoang, D.-T.; Kang, H.-J. Rolling element bearing fault diagnosis using convolutional neural network and vibration image. Cogn. Syst. Res. 2018, 53, 42–50. [Google Scholar] [CrossRef]
- Youcef Khodja, A.; Guersi, N.; Saadi, M.N.; Boutasseta, N. Rolling element bearing fault diagnosis for rotating machinery using vibration spectrum imaging and convolutional neural networks. Int. J. Adv. Manuf. Technol. 2019, 106, 1737–1751. [Google Scholar] [CrossRef]
- Kankar, P.K.; Sharma, S.C.; Harsha, S.P. Rolling element bearing fault diagnosis using wavelet transform. Neurocomputing 2011, 74, 1638–1645. [Google Scholar] [CrossRef]
- Prieto, M.D.; Cirrincione, G.; Espinosa, A.G.; Ortega, J.A.; Henao, H. Bearing fault detection by a novel condition-monitoring scheme based on statistical-time features and neural networks. IEEE Trans. Ind. Electron. 2013, 60, 3398–3407. [Google Scholar] [CrossRef]
- Samantha, B.; Al-Balushi, K.R. Artificial Neural Networks based fault diagnostics of rolling element bearings using time domain features. Mech. Syst. Signal Process. 2003, 17, 317–328. [Google Scholar] [CrossRef]
- Shiroishi, J.; Li, Y.; Liang, S.; Kurfess, T.; Danyluk, S. Bearing condition diagnostics via vibration and acoustics emission measurements. Mech. Syst. Signal Process. 1997, 11, 693–705. [Google Scholar] [CrossRef]
- Asr, M.Y.; Ettefagh, M.M.; Hassannejad, R.; Razavi, S. Diagnosis of combined faults in rotary machinery by non-naive bayesian approach. Mech. Syst. Signal Process. 2017, 85, 56–70. [Google Scholar] [CrossRef]
- Lei, Y.; He, Z.; Zi, Y. A new approach to intelligent fault diagnosis of rotating machinery. Expert Syst. Appl. 2008, 35, 1593–1600. [Google Scholar] [CrossRef]
- Wang, X.; Zheng, Y.; Zhao, Z.Z.; Wang, J.P. Bearing fault diagnosis based on statistical locally linear embedding. Sensors 2015, 15, 16225–16247. [Google Scholar] [CrossRef] [PubMed]
- Attoui, I.; Fergani, N.; Boutasseta, N.; Oudjani, B.; Deliou, A. A new time-frequency method for identification and classification of ball bearing faults. J. Sound Vib. 2017, 397, 241–265. [Google Scholar] [CrossRef]
- PKankar, P.; Sharma, S.C.; Harsha, S. Fault diagnosis of ball bearings using machine learning methods. Expert Syst. Appl. 2011, 38, 1876–1886. [Google Scholar] [CrossRef]
- Mohiuddin, M.; Islam, M.S.; Kabir, M.H. Performance Analysis of Bearing fault diagnosis using Convolutional Neural Network. In Proceedings of the 2021 IEEE 4th International Conference on Computing, Power and Communication Technologies (GUCON), Kuala Lumpur, Malaysia, 24–26 September 2021; pp. 1–6. [Google Scholar] [CrossRef]
- Bearing Data Center. Seeded Fault Test Data. Available online: https://engineering.case.edu/bearingdatacenter (accessed on 28 October 2021).
- Fault Data Sets. Condition Based Maintenance Fault Database for Testing of Diagnostic and Prognostics Algorithms. Available online: https://www.mfpt.org/fault-data-sets (accessed on 25 October 2021).
- Shensa, M.J. The Discrete Wavelet Transform: Wedding the A Trous and Mallat Algorithms. IEEE Trans. Signal Process. 1992, 40, 2464–2482. [Google Scholar] [CrossRef]
- Mohideen, S.K.; Perumal, S.A.; Sathik, M.M. Image De-noising using Discrete Wavelet transform. Int. J. Comput. Sci. Netw. Secur. 2008, 8, 213–216. [Google Scholar]


Publisher’s Note: MDPI stays neutral with regard to jurisdictional claims in published maps and institutional affiliations. |
© 2022 by the authors. Licensee MDPI, Basel, Switzerland. This article is an open access article distributed under the terms and conditions of the Creative Commons Attribution (CC BY) license (https://creativecommons.org/licenses/by/4.0/).