Abstract
Iron (Fe) doped zinc sulfide (ZnS) nanoparticles were prepared by thermolysis with varying concentrations of iron. X-ray diffraction (XRD) results revealed the zinc blende cubic structure of ZnS. The effect of iron on lattice parameters such as crystallite size, micro strains, and dislocation density was examined. The defect chemistry inside the samples was analyzed by photoluminescence spectroscopy (PL). The variation in PL intensity introduced by doping can be used in optical applications. The optical parameters of nanostructures were investigated with different doping and the incorporation of Fe substitute for Zn ions using UV-Visible (UV-Vis).
1. Introduction
Due to size-dependent optical, electronic, and magnetic properties, II-VI semiconductor materials have acquired the attention of the scientific community for their use in various device applications such as optoelectronics and spintronics [1,2]. Among the various II-VI semiconductor materials, ZnS is non-toxic wide band gap material and has numerous optoelectronic and photonic applications [3,4]. The optoelectronic properties of the material enhance as the crystallite size reduces below the Bohar exciton radius, which alters the band structure. Hexagonal wurtzite and cubic zinc blende are two common crystal structures of zinc sulfide at room temperature [4,5]. In addition, the absorption edge of ZnS only allows high-energy light absorption because its absorption edge is shorter than 340 nm. This absorption edge can be moved towards higher wavelengths, usually called being redshifted, by introducing the suitable dopant. If transition metals, such as Ni, Fe, Mn, and Co, are doped in the semiconductor, then it possesses wonderful characteristics because of spin–spin interactions [6,7].
However, Fe-doped II-VI materials-based dilute magnetic semiconductors (DMS) have gained significant importance because of their excellent properties, such as i. ferromagnetism at room temperature, ii. tunable optical band gap, iii. photocatalyst activity, and iv. Antibacterial nature [8,9]. Various research groups have reported how the band gap of ZnS can be tuned by doping transition metals [5,6,7]. However, according to our knowledge, only a few reports on the detailed study of the optical parameters of Fe-doped ZnS nanostructures are available in the research of [10,11]. In this paper, the effect of iron doping on structural and optical parameters of ZnS nanoparticles was studied in detail by using XRD, scanning electron microscopy (SEM), UV-Vis, and PL. Fe-doped nanostructures have the potential to be employed in solar cells, biomarkers, band gaps engineering devices, lasers, and nano electrochemical systems.
2. Experimental Details
Fe-doped zinc sulfide (Zn1−xFexS) nanoparticles were prepared by thermolysis technique with x = 0, 0.2, and 0.4. Zinc acetate was used as a source of Zn, iron citrate for iron, and thiourea for sulfur. All chemicals were purchased from Sigma-Aldrich. All the salts at the required quantity were mixed and ground. After that, the mixture was heated in an electric furnace at 200 °C for three hours. In this manner, all samples were synthesized with varying concentrations of iron. A Bruker D8 Advance was used for X-ray diffraction with Cu Ka (1.5406 Å) radiation. The SEM images of samples were obtained through JOEL-JSM-6490 LASEM. UV-1800 (SHIMADZU) was used for UV-Vis spectroscopy. The photoluminescence measurement was carried out by dongwoo optron with 325 nm excitation wavelength.
3. Results and Discussion
Figure 1a illustrates the XRD patterns of samples. In these XRD patterns, the diffraction peaks correspond to the (111), (220), and (311) planes, confirming the zinc blende cubic structure of ZnS. The absence of any impurity peaks indicates the successful incorporation of Fe in ZnS. However, the broadening of the XRD peaks of the doped samples as compared to undoped samples points out slight variations in lattice parameters. Thus, variations in peak intensity, Bragg’s angle, and FWHM with changes in iron content indicate the lattice deformation of ZnS. The effects of iron doping on lattice parameters such as crystallite size, strain, and dislocation density were determined with the help of the Scherrer formula, and values are given in Table 1. As the concentration of iron increased, the crystallite size decreased, which may be ascribed to the difference in ionic radii of Zn (0.6 Å) and Fe (0.63 Å) [6]. The PL measurements were performed to analyze the charge transfer and migration properties of the material. The intensity of PL emission determines the recombination of photo-excited electron/hole pairs. It means the low PL intensity indicates the low recombination of photogenerated charge carriers [12,13].
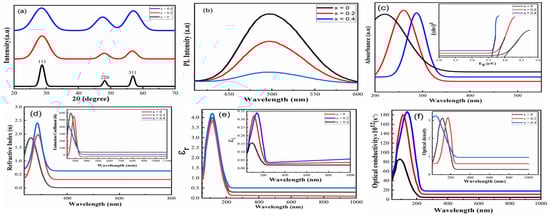
Figure 1.
XRD patterns (a), PL spectra (b), UV-Vis absorption spectra (c), plots of (αhν)2 ((c) inset), refractive index (d), extinction coefficient ((d) inset), real and imaginary parts of dielectric ((e) inset), and optical conductivity and density ((f) inset) of Zn1−xFexS where x = 0, 0.2, and 0.4.

Table 1.
Calculated values of crystallite size, dislocation density, micro-strain, and bandgap of Zn1−xFexS (e).
Figure 1b shows the PL spectra of all samples. PL spectra usually have two regions: (i) the band edge emission region, which originates from the valence band hole and conduction band electron recombination, and (ii) the defect emission region, which results from the existence of defects in the ZnS structure [8]. The PL spectra of the samples contain a wide emission band ranging from 410 to 600 nm. Moreover, pure ZnS exhibits high-intensity peaks, and this peak intensity is reduced as Fe is doped in ZnS. The surface defects, for example, sulfur vacancies placed at the surface of nanoparticles, are the source of this broad emission. It does not relate to band edge emission. Such a kind of broad emission has already been reported by various researchers in doped ZnS [14,15,16]. The decrease in PL intensity due to doping follows how iron doping in ZnS efficiently reduces the traps in the ZnS structure by removing surface defects. It can be explained as, in general, defects are located on the surface instead of the bulk, which is suppressed due to doping. Doping reduced surface defects and charge carrier recombination [16]. Figure 1c shows the optical absorption spectra of undoped and doped nanoparticles recorded. In the spectrum of undoped samples, an absorption edge is observed, which is blue-shifted as compared to the bulk ZnS, indicating quantum confinement effects [17]. It is noted that the absorption edge moved towards the higher wavelength with an increase in doping concentration. The scattering of light by grain boundaries, ion clusters, and defects due to doping are the possible reasons for the shifting of the absorption edge towards the higher wavelength. The direct energy gap of undoped and doped samples was calculated with the help of the Tauc equation, as shown in Figure 1(c inset). Values of the band gap (given in Table 1) decreased as the concentration of doping increased. The obtained results are in agreement with previous reports of ZnS doped with metals [15,16]. Figure 1d illustrates the plots of the refractive index (n) as a function of wavelength. In a lower wavelength region, the frequency of incident photons becomes equal to the plasma frequency, causing higher values of the refractive index. After this region, the refractive index decreases and becomes almost constant in a higher wavelength region. Moreover, it is also noted that the n value increased with the content of iron. Thus, these outcomes may be due to a change in stoichiometry behavior and the bonding arrangements of the lattice [17]. Figure 1(d inset) illustrates the plots of extinction coefficient (K) as a function of photon wavelength. The values of K are in the range of 400 nm or less, which correspond to irrelevant dissipation of energy, delay in electromagnetic wave propagation, and scattering of light. It is also observed that values of K being reduced in the high wavelength range indicate that prepared specimens allow the electromagnetic waves to pass through the material without any damping in the region. Such results of extinction coefficient about semiconductor material are in good agreement with the available literature [18,19]. Figure 1(e, inset) shows the spectral variation of real (εr) and imaginary (εi) parts of the dielectric constant as a function of wavelength. The spectral variation of real and imaginary parts of the dielectric constant indicates a strong interaction between incident photons and free electrons. It is clear that both (εr) and (εi) exhibited the same trend as refractive index and extinction coefficient because values of the dielectric constant depend on the n and K. It is also observed that values of real and imaginary parts of the dielectric constant are increased with the addition of iron. It means dispersion increases with the content of Fe. In other words, Fe concentration reduced the propagation of electromagnetic waves. The variation of optical conductivity and density as a function of wavelength is shown in Figure 1(f, inset). It is noted that optical conductivity increased in the low wavelength region. It may be due to the sharp increase in absorption coefficient and/or excitation of carriers from the valence to the conduction band after absorption of photon energy. The optical density seems to follow the same behavior as the absorption coefficient due to the energy of the incident of photons.
Figure 2 shows the SEM images of undoped and doped samples. SEM images demonstrate the formation of grains of different shapes and sizes. On the contrary, the doped samples showed conepiston-like particles, which may be due to the geometrical and multidimensional growth of ZnS particles. The particles are aggregated with doping.
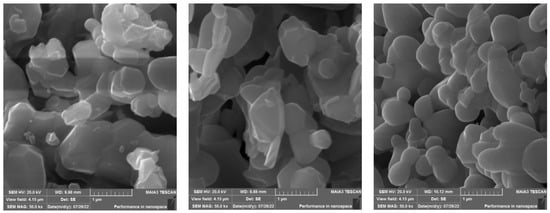
Figure 2.
SEM images of Zn1−xFexS where x = 0, 0.2, and 0.4 (left to right).
4. Conclusions
Fe-doped ZnS nanoparticles were made by the thermolysis technique. The zinc blende cubic structure of foresaid nanoparticles was confirmed by XRD. Applying the Scherrer formula, the lattice parameters such as crystallite size, dislocation density, and micro-strain were calculated.PL results illustrated the presence of an emission band in specimens. PL intensity reduced with doping is a sign of fewer surface defects. The values of the energy gap of prepared samples were determined by means of the Tauc equation. With the doping of iron, the sp-d spin exchange interactions between the band electron and localized electron of iron metal ion substituting the cation occurred. Consequently, band gap values decreased. The high values of refractive index observed with doping can be employed in scheming compact circuits. Low values of the extinction coefficient were also observed due to doping, which indicates the minimum dispersion energy during the propagation of light in the material. The dielectric constant (real and imaginary), optical conductivity, and density possess the same behavior as the refractive index.
Author Contributions
H.N. designed the study and performed synthesis. A.R. performed the characterizations, analyzed the result and wrote the original draft. H.N., S.R. and S.N. performed formal analysis, assisted in methods and supervision. All authors contributed to discussions and critically proofread the manuscript. All authors have read and agreed to the published version of the manuscript.
Funding
This research received no external funding.
Institutional Review Board Statement
Not applicable.
Informed Consent Statement
Not applicable.
Data Availability Statement
Not applicable.
Conflicts of Interest
The authors declare no conflict of interest.
References
- Quan, Z.; Wang, Z.; Yang, P.; Lin, J.; Fang, J. Synthesis and characterization of high-quality ZnS, ZnS:Mn2+, and ZnS:Mn2+/ZnS (core/shell) luminescent nanocrystals. Inorg. Chem. 2007, 46, 1354–1360. [Google Scholar] [CrossRef] [PubMed]
- Li, X.; Wang, X.; Xiong, Q.; Eklund, P.C. Mechanical properties of ZnS nanobelts. Nano Lett. 2005, 5, 1982–1986. [Google Scholar] [CrossRef]
- Corrado, C.; Jiang, Y.; Oba, F.; Kozina, M.; Bridges, F.; Zhang, J.Z. Synthesis, structural, and optical properties of stable ZnS:Cu, Cl nanocrystals. J. Phys. Chem. A 2009, 113, 3830–3839. [Google Scholar] [CrossRef]
- Kumar, S.; Verma, N.K. Structural, optical and magnetic investigations on Fe-doped ZnS nanoparticles. J. Mater. Sci. Mater. Electron. 2015, 26, 2754–2759. [Google Scholar] [CrossRef]
- Theivasanthi, T.; Kartheeswari, N.; Alagar, M. Chemical precipitation synthesis of ferric chloride doped zinc sulphide nanoparticles and their characterization studies. arXiv 2013, arXiv:1303.2531. [Google Scholar]
- Lee, G.J.; Wu, J.J. Recent developments in ZnS photocatalysts from synthesis to photocatalytic applications—A review. Powder Technol. 2017, 318, 8–22. [Google Scholar] [CrossRef]
- Kim, H.J.; Kim, J.H.; Durga, I.K.; Punnoose, D.; Kundakarla, N.; Reddy, A.E.; Rao, S.S. Densely packed zinc sulfide nanoparticles on TiO 2 for hindering electron recombination in dye-sensitized solar cells. New J. Chem. 2016, 40, 9176–9186. [Google Scholar] [CrossRef]
- Zafar, S.; Zubair, M.; Shah, S.M.; Khan, M.I.; Khan, A.A.; Iqbal, M.F.; Hassan, A.; Din, M.F.U. Effect of Fe doping on the structural and optical properties of ZnS macro-spheres. Optik 2022, 262, 169–342. [Google Scholar] [CrossRef]
- Mahour, L.N.; Choudhary, H.K.; Kumar, R.; Anupama, A.V.; Sahoo, B. Structural, optical and Mössbauer spectroscopic investigations on the environment of Fe in Fe-doped ZnO (Zn1-xFexO) ceramics synthesized by solution combustion method. Ceram. Int. 2019, 45, 24625–24634. [Google Scholar] [CrossRef]
- Poornaprakash, B.; Reddy, D.A.; Murali, G.; Rao, N.M.; Vijayalakshmi, R.P.; Reddy, B.K. Composition dependent room temperature ferromagnetism and PL intensity of cobalt doped ZnS nanoparticles. J. Alloys Compd. 2013, 577, 79–85. [Google Scholar] [CrossRef]
- Sambasivam, S.; Joseph, D.P.; Reddy, D.R.; Reddy, B.K.; Jayasankar, C.K. Synthesis and characterization of thiophenol passivated Fe-doped ZnS nanoparticles. Mater. Sci. Eng. 2008, 150, 125–129. [Google Scholar] [CrossRef]
- Lee, J.C.; Gopalan, A.I.; Sai-Anand, G.; Lee, K.P.; Kim, W.J. Preparation of visible light photocatalytic graphene embedded rutile titanium (IV) oxide composite nanowires and enhanced NOx removal. Catalysts 2019, 9, 170. [Google Scholar] [CrossRef]
- Panigrahy, B.; Aslam, M.; Misra, D.S.; Bahadur, D. Polymer-mediated shape-selective synthesis of ZnO nanostructures using a single-step aqueous approach. CrystEng Comm. 2009, 11, 1920–1925. [Google Scholar] [CrossRef]
- Karar, N.; Singh, F.; Mehta, B.R. Structure and photoluminescence studies on ZnS:Mn nanoparticles. J. Appl. Phys. 2004, 95, 656–660. [Google Scholar] [CrossRef]
- Ghosh, P.K.; Ahmed, S.F.; Jana, S.; Chattopadhyay, K.K. Photoluminescence and field emission properties of ZnS:Mn nanoparticles synthesized by rf-magnetron sputtering technique. Opt. Mater. 2007, 29, 1584–1590. [Google Scholar] [CrossRef]
- Peng, W.Q.; Cong, G.W.; Qu, S.C.; Wang, Z.G. Synthesis and photoluminescence of ZnS:Cu nanoparticles. Opt. Mater. 2006, 29, 313. [Google Scholar] [CrossRef]
- Zhang, L.; Qin, D.; Yang, G.; Zhang, Q. The investigation on synthesis and optical properties of ZnS:Co nanocrystals by using hydrothermal method. Chalcogenide Lett. 2012, 9, 93–98. [Google Scholar]
- Hassanien, A.S.; Sharma, I. Band-gap engineering, conduction and valence band positions of thermally evaporated amorphous Ge15-x Sbx Se50 Te35 thin films: Influences of Sb upon some optical characterizations and physical parameters. J. Alloys Compd. 2019, 798, 750–763. [Google Scholar] [CrossRef]
- Hassanien, A.S.; Akl, A.A. Optical characteristics of iron oxide thin films prepared by spray pyrolysis technique at different substrate temperatures. Appl. Phys. A 2018, 124, 752. [Google Scholar] [CrossRef]


Disclaimer/Publisher’s Note: The statements, opinions and data contained in all publications are solely those of the individual author(s) and contributor(s) and not of MDPI and/or the editor(s). MDPI and/or the editor(s) disclaim responsibility for any injury to people or property resulting from any ideas, methods, instructions or products referred to in the content. |
© 2023 by the authors. Licensee MDPI, Basel, Switzerland. This article is an open access article distributed under the terms and conditions of the Creative Commons Attribution (CC BY) license (https://creativecommons.org/licenses/by/4.0/).