Abstract
To automate the aliquoting process, it is necessary to determine the required depth of immersion of the pipette into the blood serum. This paper presents the results of a study aimed at creating a vision system that makes it possible to determine the position and nature of the fractional interface based on the use of a convolutional neural network. As a result of training on photographic images of tubes ready for aliquoting, the neural network acquired the ability to determine the visible part of the tube, the upper fraction of its contents, and the fibrin strands with high accuracy, allowing the required pipette immersion depth to be calculated.
1. Introduction
Biobanking is a system for collecting, processing, storing, and analyzing samples of biological materials and associated clinical information intended for scientific and biomedical research [1,2].
Currently, this area of biomedicine is actively developing, which requires the introduction of new technological solutions to ensure the quality of biosamples and their compliance with international standards [3]. The types of material stored in the biobank are diverse, but the most common and relatively easily accessible is blood serum.
The technological process of biobanking this type of biomaterial provides for obtaining whole blood samples, separating blood serum, storing it in low-temperature storage, and entering a set of significant information about material donors into a specialized database.
One of the necessary conditions for high-quality biobanking of blood serum is its aliquoting, that is, its division into portions of small volume (200–800 L), which are then sent to low-temperature long-term storage [4,5,6].
Blood sampling is carried out in a plastic test tube with a coagulation activator sprayed on its inner wall. After coagulation, the resulting clot is compacted. To speed up retraction, blood tubes are subjected to centrifugation. As a result, the contents of the tube are separated. The lower fraction is a compacted clot and the upper one is blood serum, a material used for aliquoting, biobanking, and further research.
To aliquot the serum, a laboratory assistant uses a pipette to take it from the test tube. This operation requires care; when serum is taken near a clot, erythrocytes may be partially drawn into the pipette from its surface, and the sample will be contaminated. On the other hand, being too careful will result in a significant amount of serum remaining in the tube, resulting in fewer aliquots.
Aliquoting is the process of manipulating an accurately measured fraction of a sample (a volume of solution) taken for analysis that retains the properties of the main sample. The process of aliquoting the blood of various patients involves removing biological material from a tube with a separated fraction (Figure 1a) into smaller-volume tubes (Figure 1b). To do this, it is necessary to move the tube from the rack to the working area, where dosing into aliquots takes place (Figure 1c). The quality of sample preparation is ensured at all stages, including during aliquoting [7].

Figure 1.
Aliquoting examples.
The results presented in [8] show the efficiency of automated aliquoting in comparison with the use of manual labor. Research in the field of application of robotic systems for liquid dosing and automation of laboratory processes for sample preparation is being carried out by many scientists. Thus, in [9], a technology for determining the level of liquid in a given volume based on a pressure sensor was proposed, making it possible to ensure the stability of the platform for processing liquid and the accuracy of its dosing. In [10,11], the authors proposed the use of a two-armed robot that works together with an operator and is remotely controlled.
There are already optimal programs to prepare for fully automated pipetting and dilution of biological samples in favor of controlled bioassays [12]. To better understand the problem, many typical solutions have been studied. The main developers of robotic equipment for aliquoting biological samples are Dornier-LTF (Germany), TECAN (Switzerland), and Hamilton. The laboratory equipment produced by them includes the PIRO robotic excavation station [13] manufactured by Dornier-LTF (Germany), the Freedom EVO® series robotic laboratory station [14] manufactured by TECAN, and the Microlab STAR automatic dosing robot system [15] by the Hamilton production company. All are designed to perform aliquoting technological processes, and include the same main elements: a robotic module with dosing multichannel pipettes and removable tips, a robotic module with a gripping device for carrying tripods, and auxiliary devices (pumps, barcode readers, thermo-shakers, UV emitters, work surface object position detectors, etc.), the number of which depends on the intended use of the robotic station. The differences between the listed equipment types lies only in the number of operations able to be performed simultaneously; structurally, the systems have no major differences. The structure of the mentioned systems is designed to separate a large number of aliquots of one biological fluid, which is most often used in microbiology and virology laboratories. There is a research gap when searching for new technical solutions in the field of robotic aliquoting and new approaches to organizing a vision system with the possibility of effective image segmentation while taking into account the heterogeneity of biosamples.
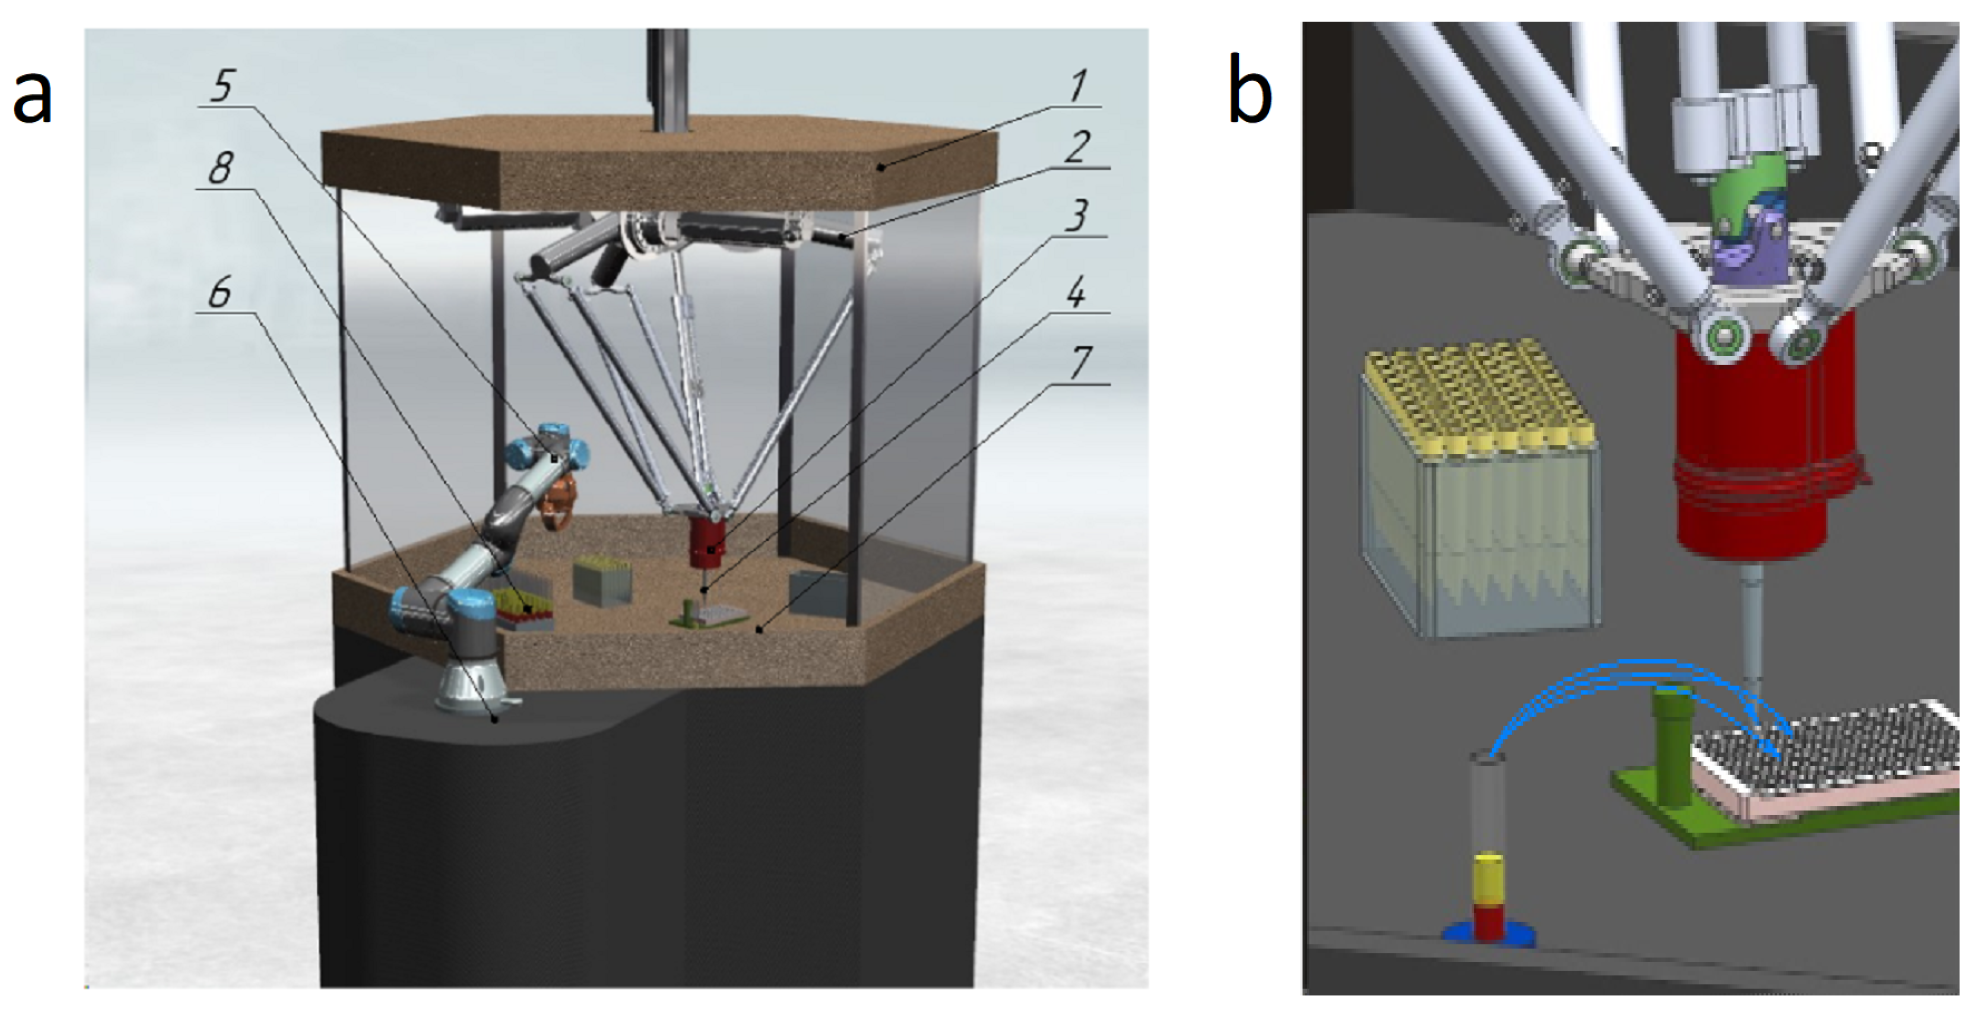
The present article proposes a new design of a robotic system (RS) consisting of two robots: a fast robot with a parallel delta structure and a collaborative robot with a sequential structure and a gripper. A dosing device is installed on the delta arm. The dosing device contains a vacuum system and an automatic tip change system. The device must have a small mass, as this significantly affects the speed of the delta robot. The mutual arrangement of the manipulators should ensure the intersection of the working spaces for access of both manipulators to the required objects [4]. The design of the proposed robotic system for aliquoting biological fluid of various patients is shown in Figure 2. The RS (Figure 2a) includes: the body (1), in which there is a parallel delta manipulator (2) that moves the dosing head (3) fixed in the center of the movable platform of the manipulator that performs biomaterial aliquoting. The replaceable tip (4) on the digging head is fixed with a rubber sealing ring. The UR3 manipulator (5) is mounted on a fixed base (6) and ensures the movement of the test tubes (8) within the working area (7) using a gripping device.
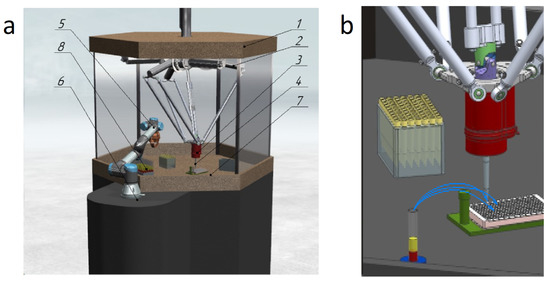
Figure 2.
(a) 3D model of RS for aliquoting and (b) working body with dosing head.
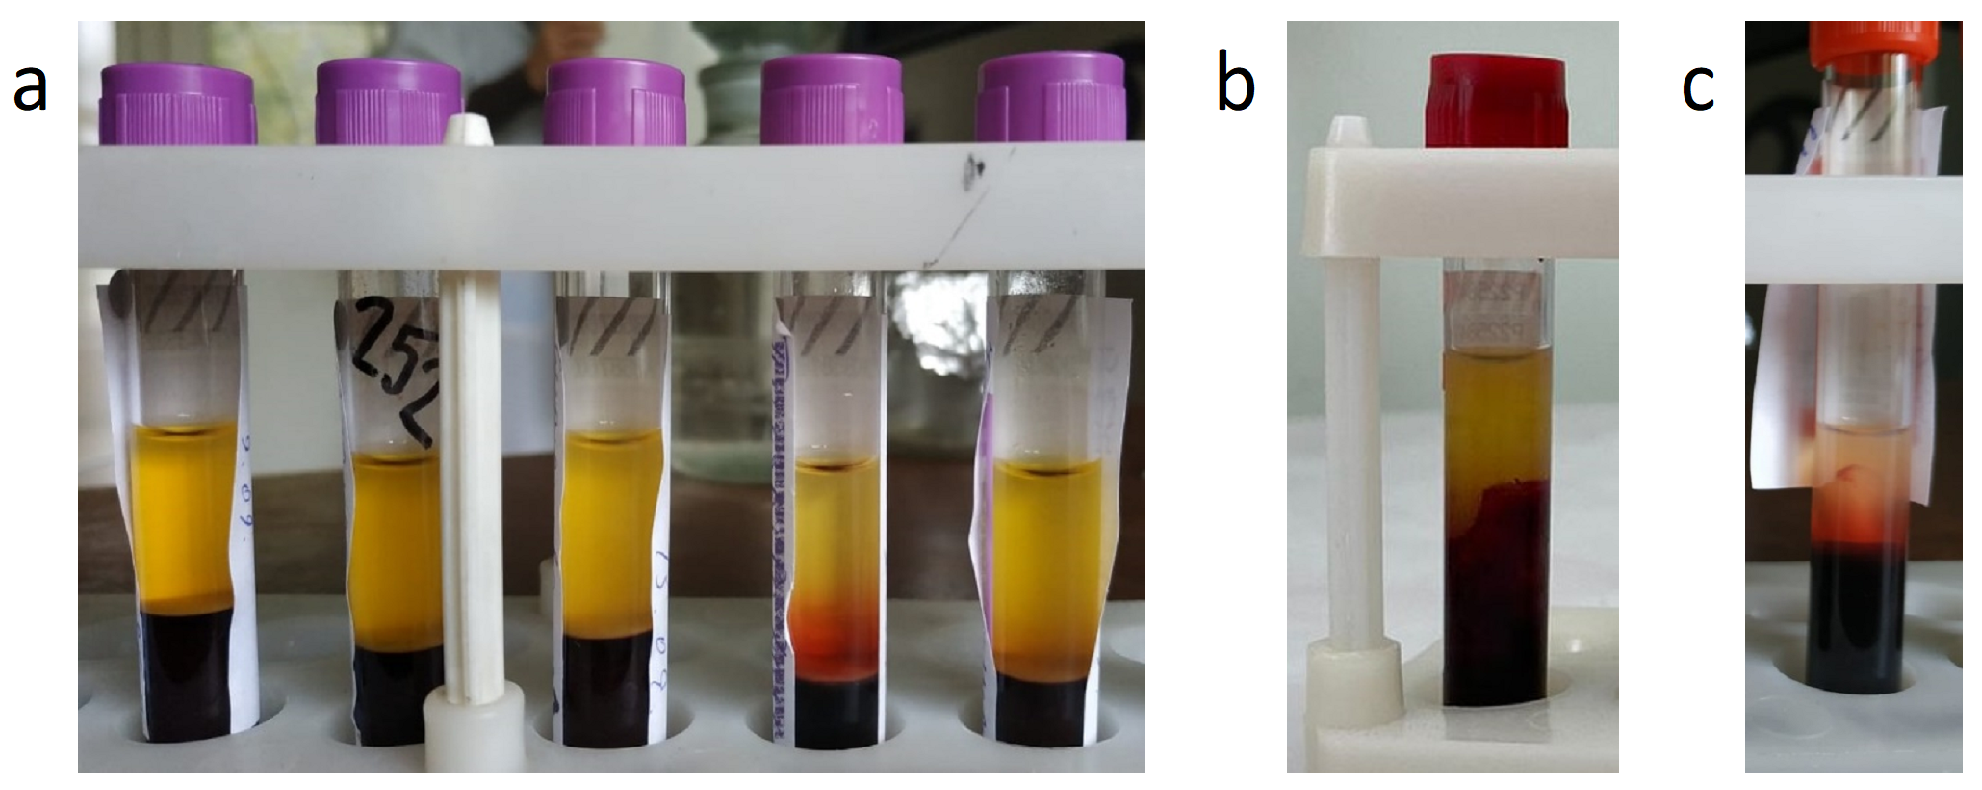
The task of automating the aliquoting process depends on the need to determine the height of the fraction boundary in the test tube. This border can be at different levels, and can either be evenly horizontal (Figure 3a), irregularly shaped (Figure 3b) as a result of improper centrifugation, or even a lump of whitish fibrin filaments (Figure 3c), if the activator did not work well or the tube was shaken during transportation. Because the laboratory assistant currently determines this boundary “by eye”, it is advisable to use the technical vision system proposed here instead.
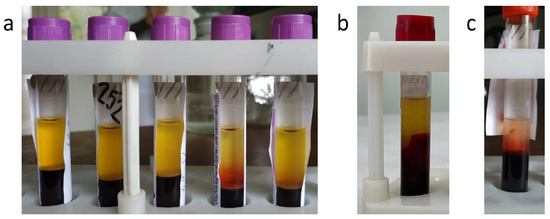
Figure 3.
Examples of the boundary between fractions in vitro: (a) horizontal, (b) irregular, and (c) lump of fibrin threads.
Thus, the organization of such a system based on neural network image recognition, which is the goal of this study, is an urgent task.
2. Using U-Net for Image Segmentation
For a set of biomaterial in a pipette, it is necessary to correctly determine the levels at which the upper fraction begins and ends. To do this, it is proposed to photograph the test tube and determine the area corresponding to the serum in the photograph. At the same time, if the clot has an irregular shape or is covered with fibrin threads, determining the lower border of the serum from a photograph can be a nontrivial task. In addition, in order to avoid potentially drawing the threads into the pipette it is necessary to increase the margin on the lower level in the latter case (i.e., to leave more serum in the tube).
Deep learning neural networks developed to solve the problem of image segmentation are currently being used to successfully recognize objects in a photograph.
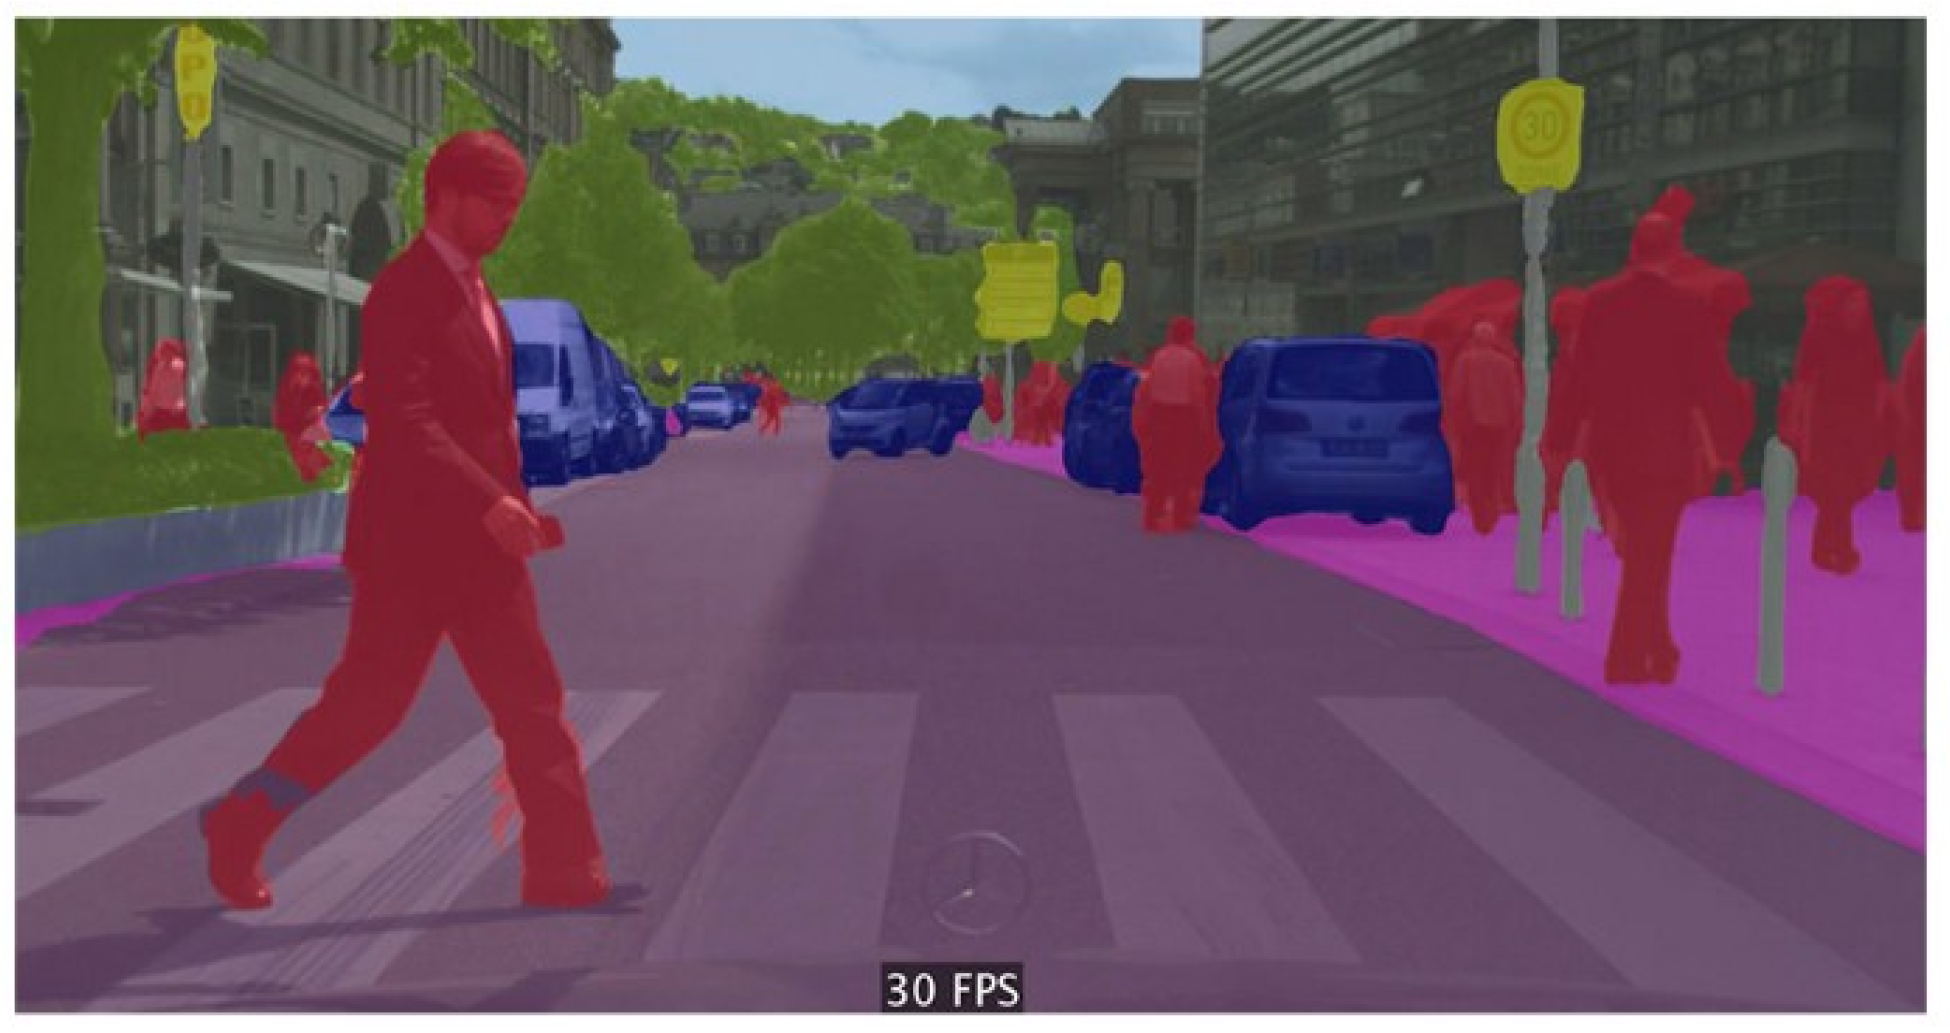
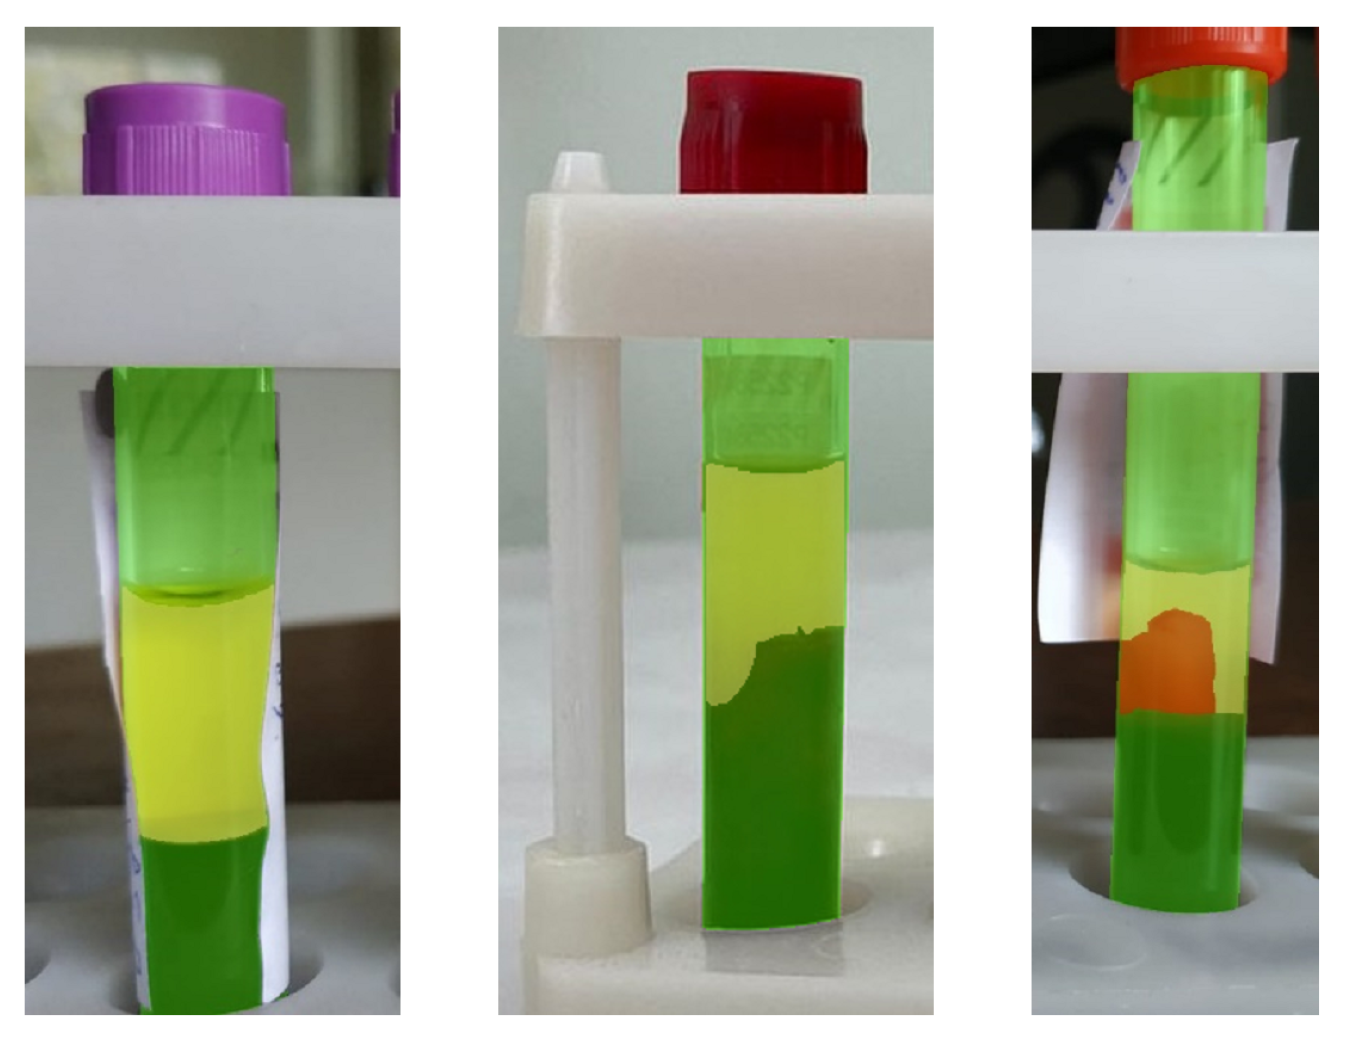
In this case, segmentation is the process of selecting segments of an image. The initial image is used as the input of a neural network and an image of the same size is formed at its output, with each of its pixels represented as a color that corresponds to the object that this pixel belonged to in the original image (Figure 4).
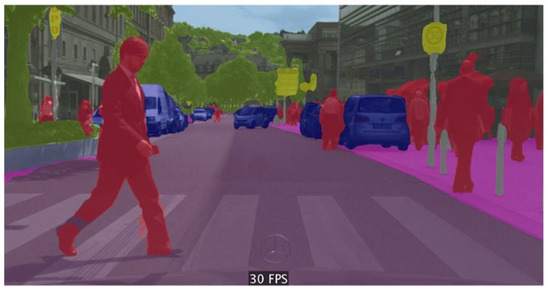
Figure 4.
An example of the result of the operation of a segmenting neural network.
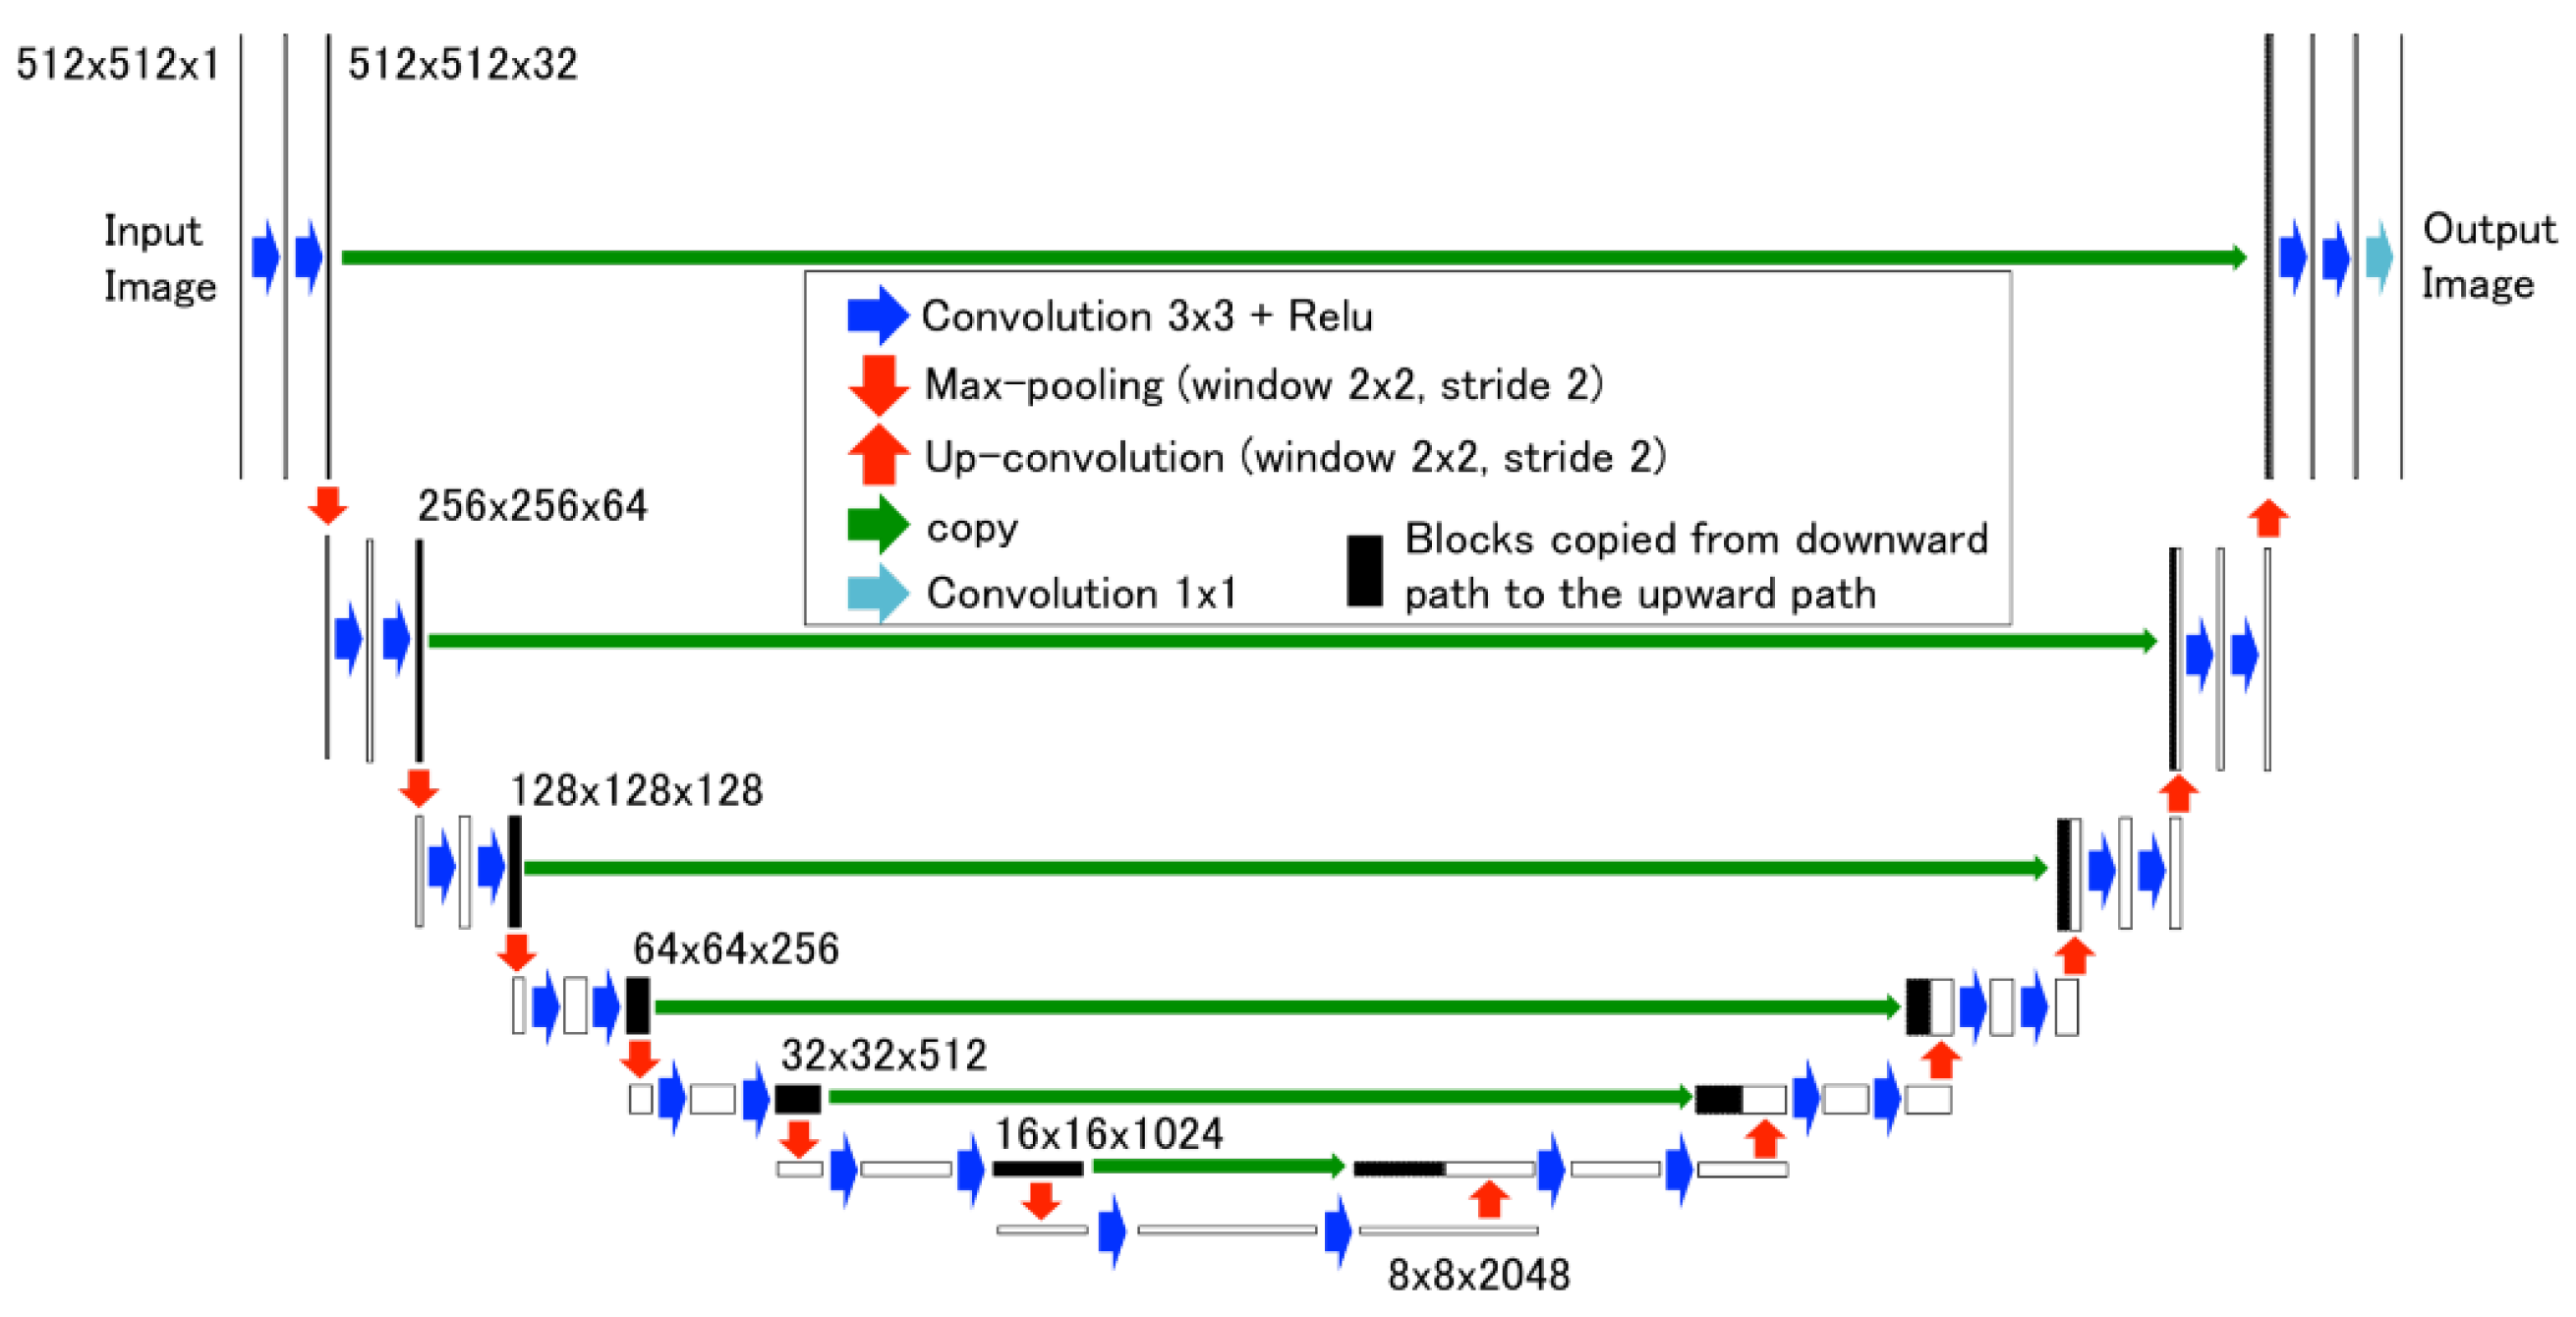
The most effective current neural networks for solving the problem under consideration are networks of the “encoder–decoder” class, such as U-Net [16,17,18]. Below, we consider the principles of its operation in more detail (Figure 5).
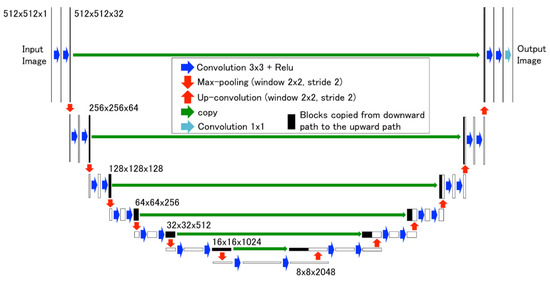
Figure 5.
U-Net architecture.
The original picture is subjected to a convolution operation with a 3 × 3 kernel (these are matrices of a specified size which are filled with random numbers when the network is initialized; after the network has been trained for specific pictures, they become means of highlighting essential features in them), indicated by the blue arrows in Figure 5. The number of such nuclei is 32. As a result, 32 feature maps are obtained.
Then, the feature maps, located one above the other, are again convolved with a 3 × 3 × 32 kernel. Again, there are 32 such nuclei. The result is 32 new maps with a clearer selection of features in the image.
Next, a dimensionality reduction operation (max-pooling) is applied with a 2 × 2 kernel, shown by the red down-arrows in Figure 5. This reduces the size of each feature map by half, allowing more abstract features in the picture to be highlighted, which increases the generalization ability of the network. The result is 32 feature maps of half the original size.
Then, the convolution operation is applied with a kernel of size 3 × 3 × 32. There are 64 such convolution kernels. Therefore, the result is 64 feature maps. The feature maps located one above the other are convolved with a 3 × 3 × 64 kernel. There are 64 such nuclei. The result is 64 new feature maps.
Max-pooling operation and two convolutions are performed five more times in succession. The result is 2048 feature maps with linear dimensions times smaller than the dimensions of the original image. Thus, the narrowing network pass (encoder) is completed (the left branch of the structure in Figure 5). Its result is the essential features extracted from the original image, which helps in making subsequent decisions about the presence of objects of any class. The forward pass is the essential part of any convolutional neural network architecture.
Next, the right decoder branch of the network starts working. Its main action is to apply upsampling (the red up-arrows in Figure 4), which has the opposite meaning to max-pooling. Each time this is used, the size of the image is doubled. Pixels that did not exist before are filled using the values of neighboring pixels. After the upsampling operation, the results of the direct network pass from the corresponding level are taken and combined with the resulting image (concatenation), indicated by the green arrows in Figure 5. Then, two additional convolution operations are performed.
As a result of the repetition of the four operations described above, the image is returned to its original size. There are as many nuclei in the last convolution as there are object classes in the source image under consideration.
At the same time, the presence of a group of pixels marked as “1” on a specific output map means that the corresponding object was found by the network in the image.
3. Formation of the Training Sample
To train a neural network, it is necessary to prepare a sample consisting of examples of the “original image–labeled image” type. A labeled image is a picture with the same size as the original image on which each object of interest is painted in its own color.
Image analysis (Figure 3) shows that three classes of objects are of greatest interest:
- 1.
- Object No. 1: serum, the upper fraction of the contents of the tube. The greatest difficulty here is the identification of the lower boundary.
- 2.
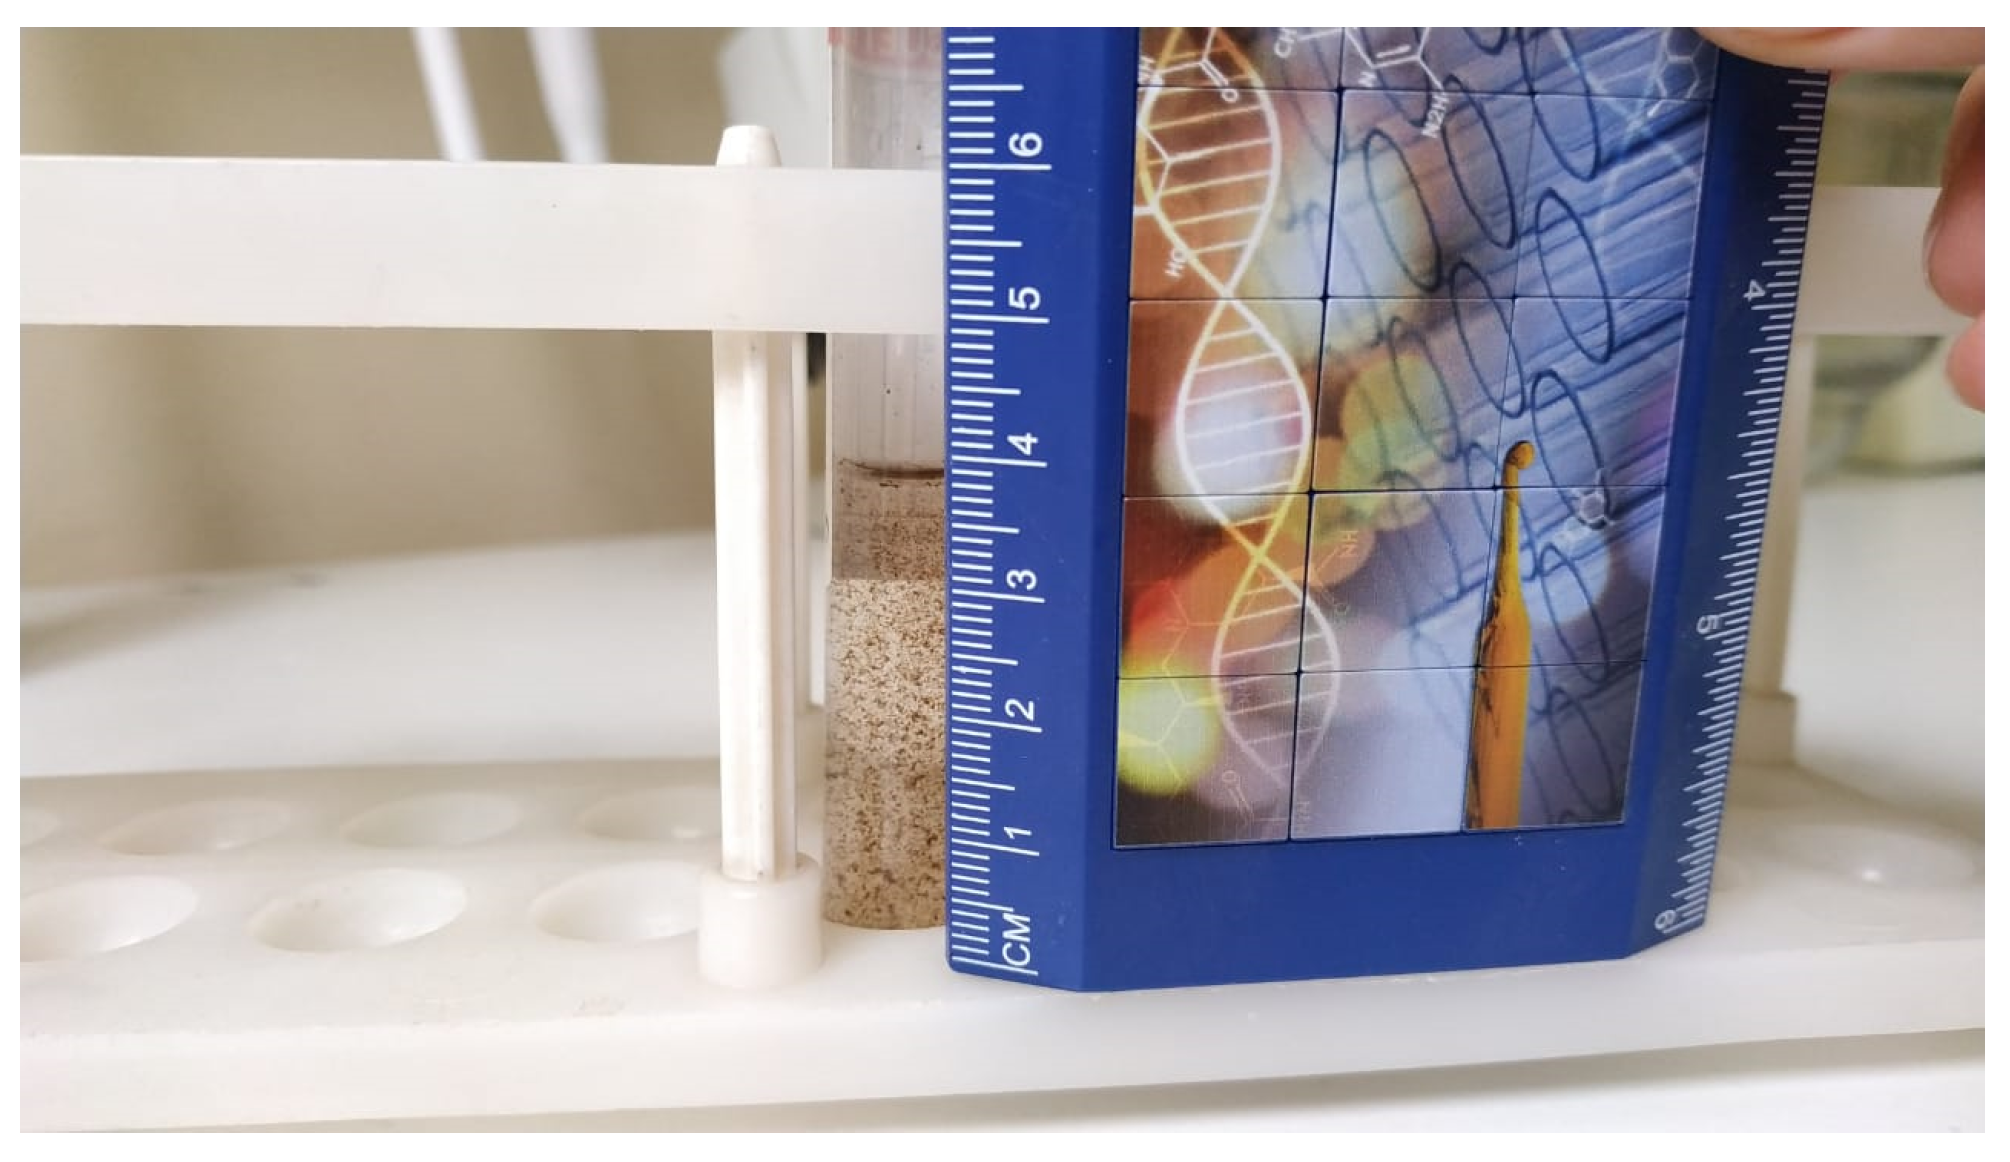
- Object No. 2: test tube. Using its linear dimensions on the image, it is possible to determine the scale of the photograph (Figure 6) and calculate the actual distance from the boundaries of the upper fraction of the contents of the test tube to its lower or upper edge. Selecting this object allows the position of the camera and the focal length of its lens to be changed as if necessary without the need for recalibration.
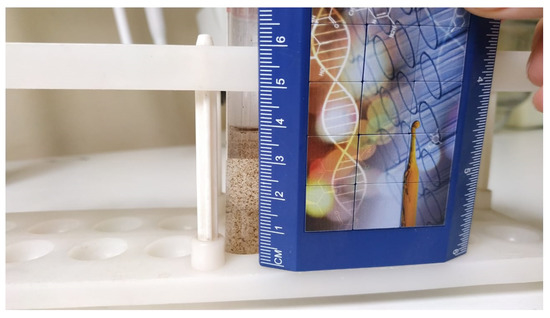 Figure 6. Determining the scale of the photograph by the size of the visible part of the test tube.
 - 3.
- Object No. 3: fibrin threads on a clot (Figure 3c). First, the very fact of its presence/absence in the image is important, as this makes it possible to correctly determine the required distance from the working end of the pipette to the lower boundary of the upper fraction.
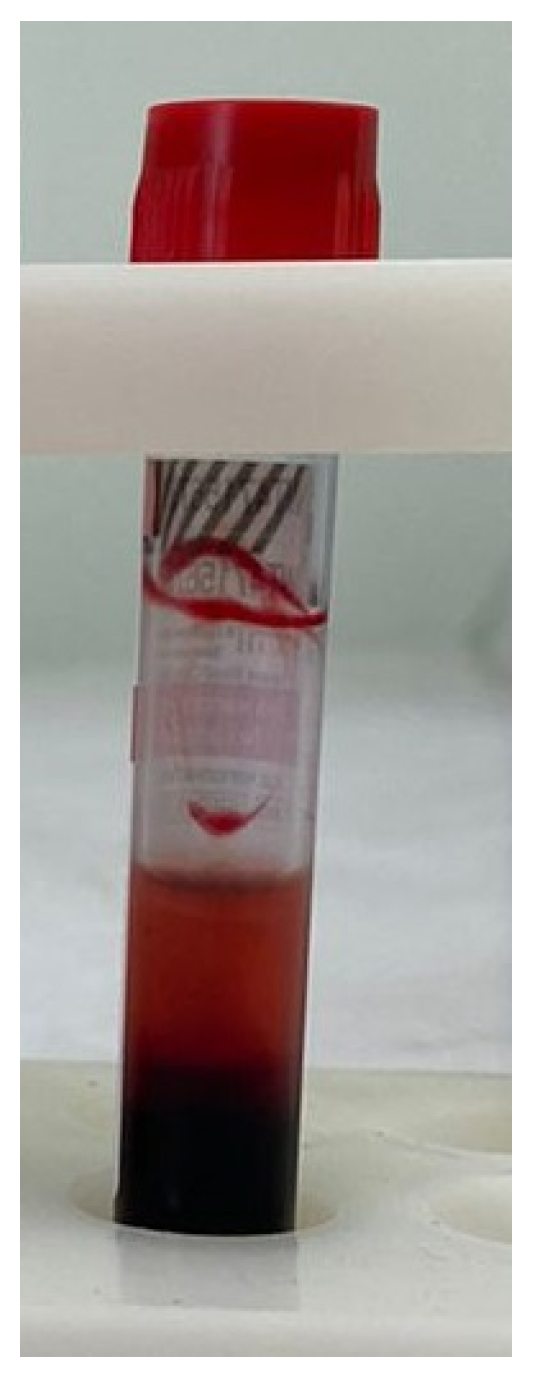
The upper fraction can contain erythrocyte hemolysis products. In this case, it turns out to be intensely pink (Figure 7) and is considered unsuitable for further research. With a sufficient number of relevant images, such an object could be recognized by the network; however, tubes showing signs of hemolysis are usually discarded in the early stages of sample handling.
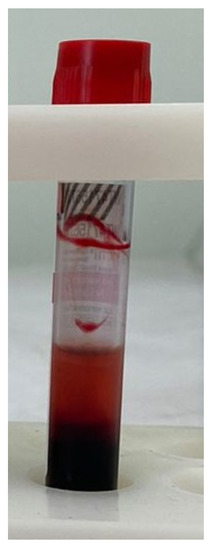
Figure 7.
Result of hemolysis.
Each photo selected in one of the samples (training, testing, or validation) must be labeled in such a way as to provide a “correct” answer for the neural network that is the goal in the learning process.
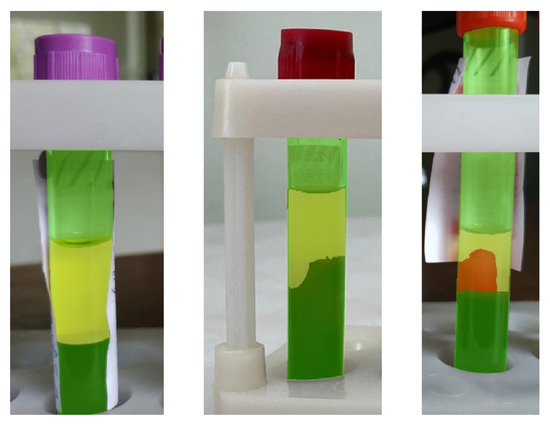
Figure 8.
Image markup examples.
To train the neural network, we used the stochastic optimization algorithm Adam (adaptive moment estimation) [19,20,21], which is currently one of the most popular methods for training networks of the “ encoder–decoder” type. The learning rate was set to 0.001 and the exponential decay rates 1 and 2 were set to 0.9 and 0.999, as suggested in [22].
The training itself is traditionally performed as follows: all pictures of the training sample are fed to the neural network, then the accumulated gradient is calculated for each of the parameters of the neural network. However, training on a full sample requires a significant amount of memory, including video memory on a video card.
Therefore, in the course of the present study an alternative method was used: the training sample was divided into minisamples (batches) and the network parameters were corrected after only examples of this sample were fed to the network. Reducing the batch volume leads to a decrease in the required amount of memory, although it slightly reduces the quality of training.
Categorical cross-entropy was applied as a loss function (objective learning function). The quality of the network was evaluated using the accuracy metric; that is, the output of the network consisting of three pictures (according to the number of classes of recognizable objects) was combined into a single picture, where in each pixel the color was the class of the object to which the pixel belonged. Then, the picture was compared pixel-by-pixel with the reference markup for the input picture and the percentage of pixels was determined, where the same class was used for both the reference and the output of the network.
4. Training of Neural Networks and Results Obtained
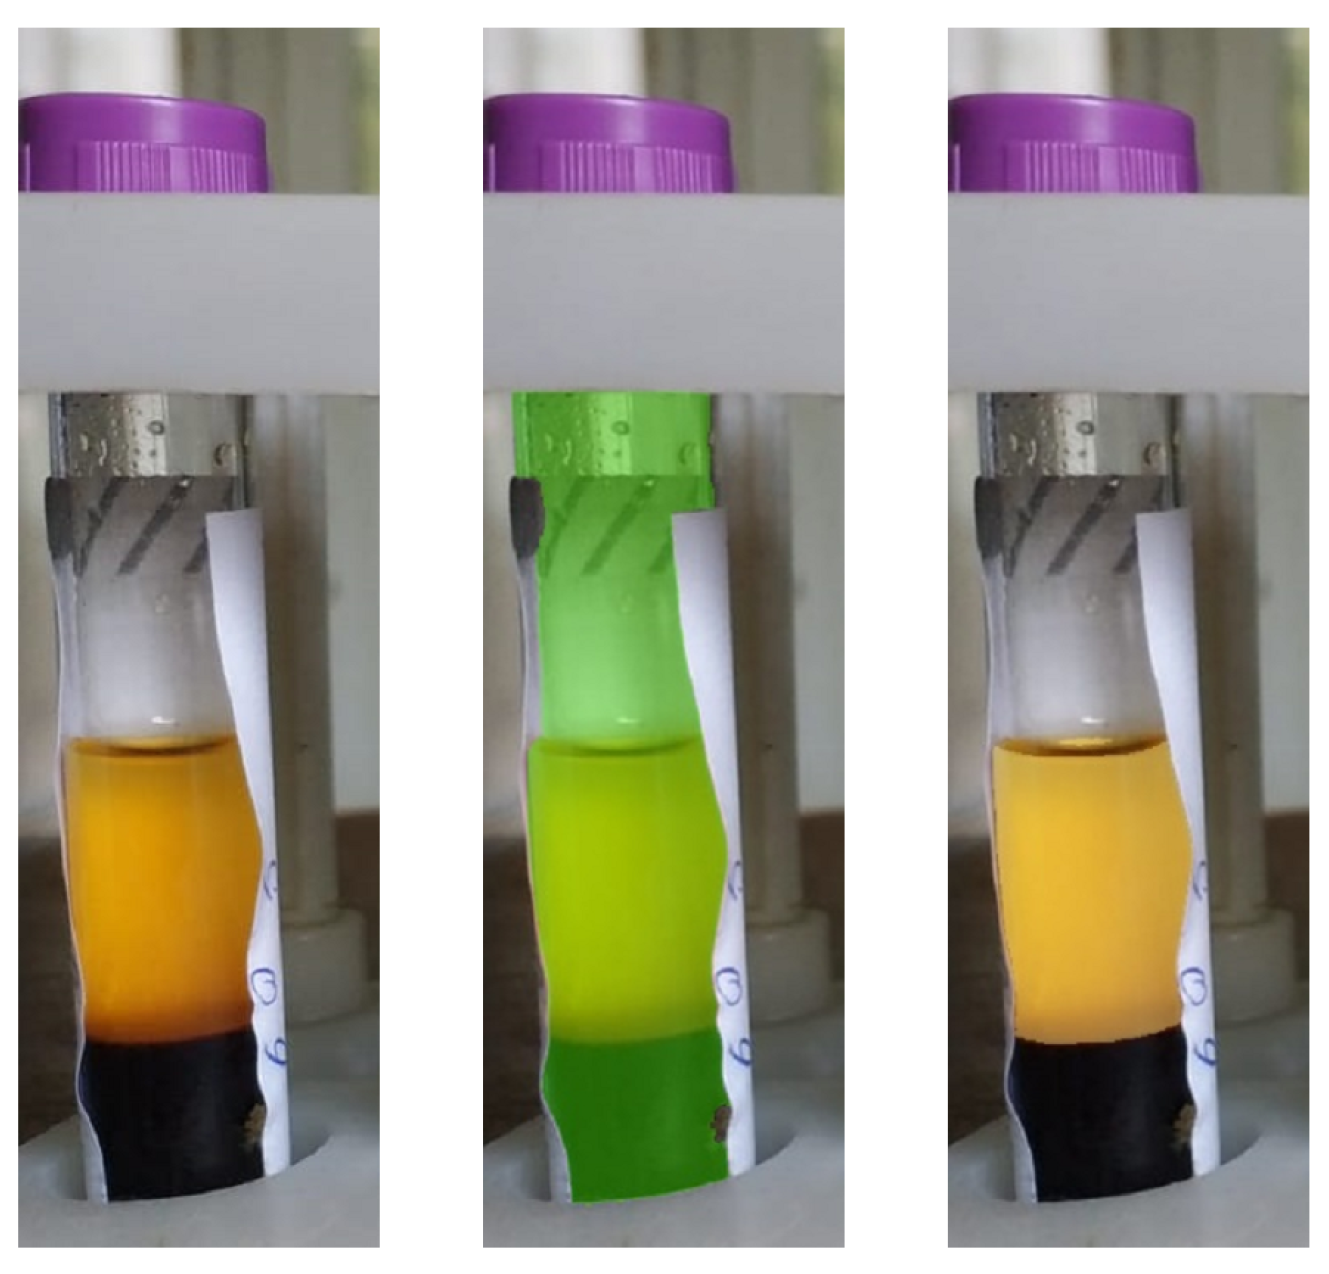
The size of the training sample was increased gradually. The network was first trained on 100 images without fibrin strands. On the test sample, it showed an accuracy of 95%. Figure 9 shows a typical result for one of the images of the test sample combined with the original image.
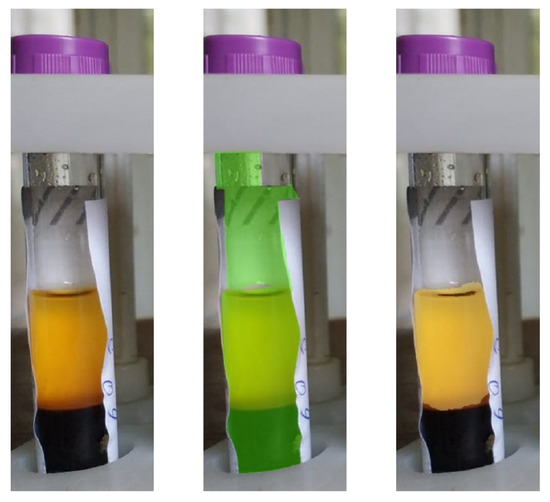
Figure 9.
The result of the network trained on 100 fibrin-free images.
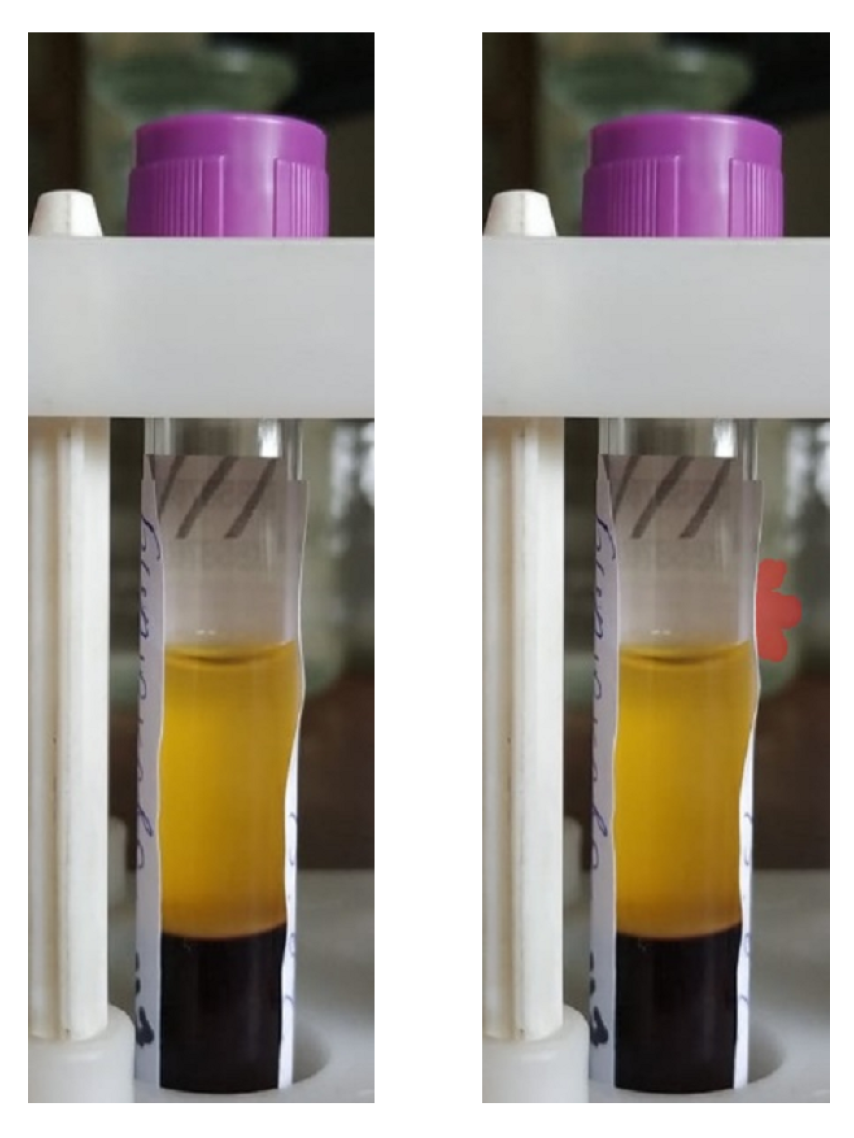
It can be seen from the figure that there are no serious problems with the recognition of the upper fraction of the contents of the tube, while the tube itself is often not completely recognized. Increasing the number of images in the test set to 200 made it possible to solve this problem, and the quality of recognition on the test set increased to 97% (Figure 10).
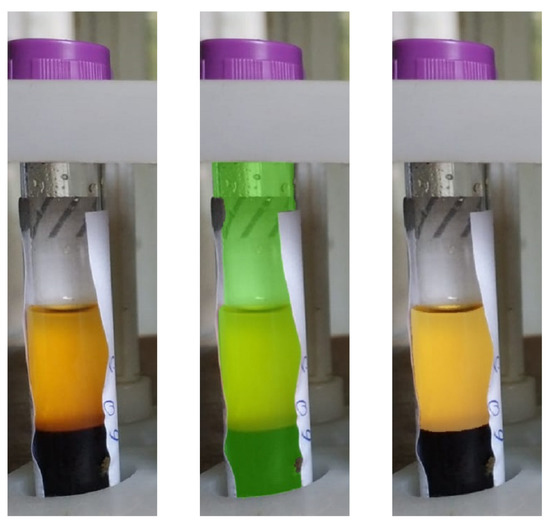
Figure 10.
The result of the network trained on 200 images without fibrin.
In most cases, errors resulted from inaccurate recognition of the vertical boundaries of the test tube, which is associated with glare and reflection in the plastic of paper labels. Such errors do not affect the accuracy when determining the scale of a photograph. In addition, there was an increase in the quality of recognizing the upper fraction. The corresponding figure calculated without taking other objects into account was close to 99%.
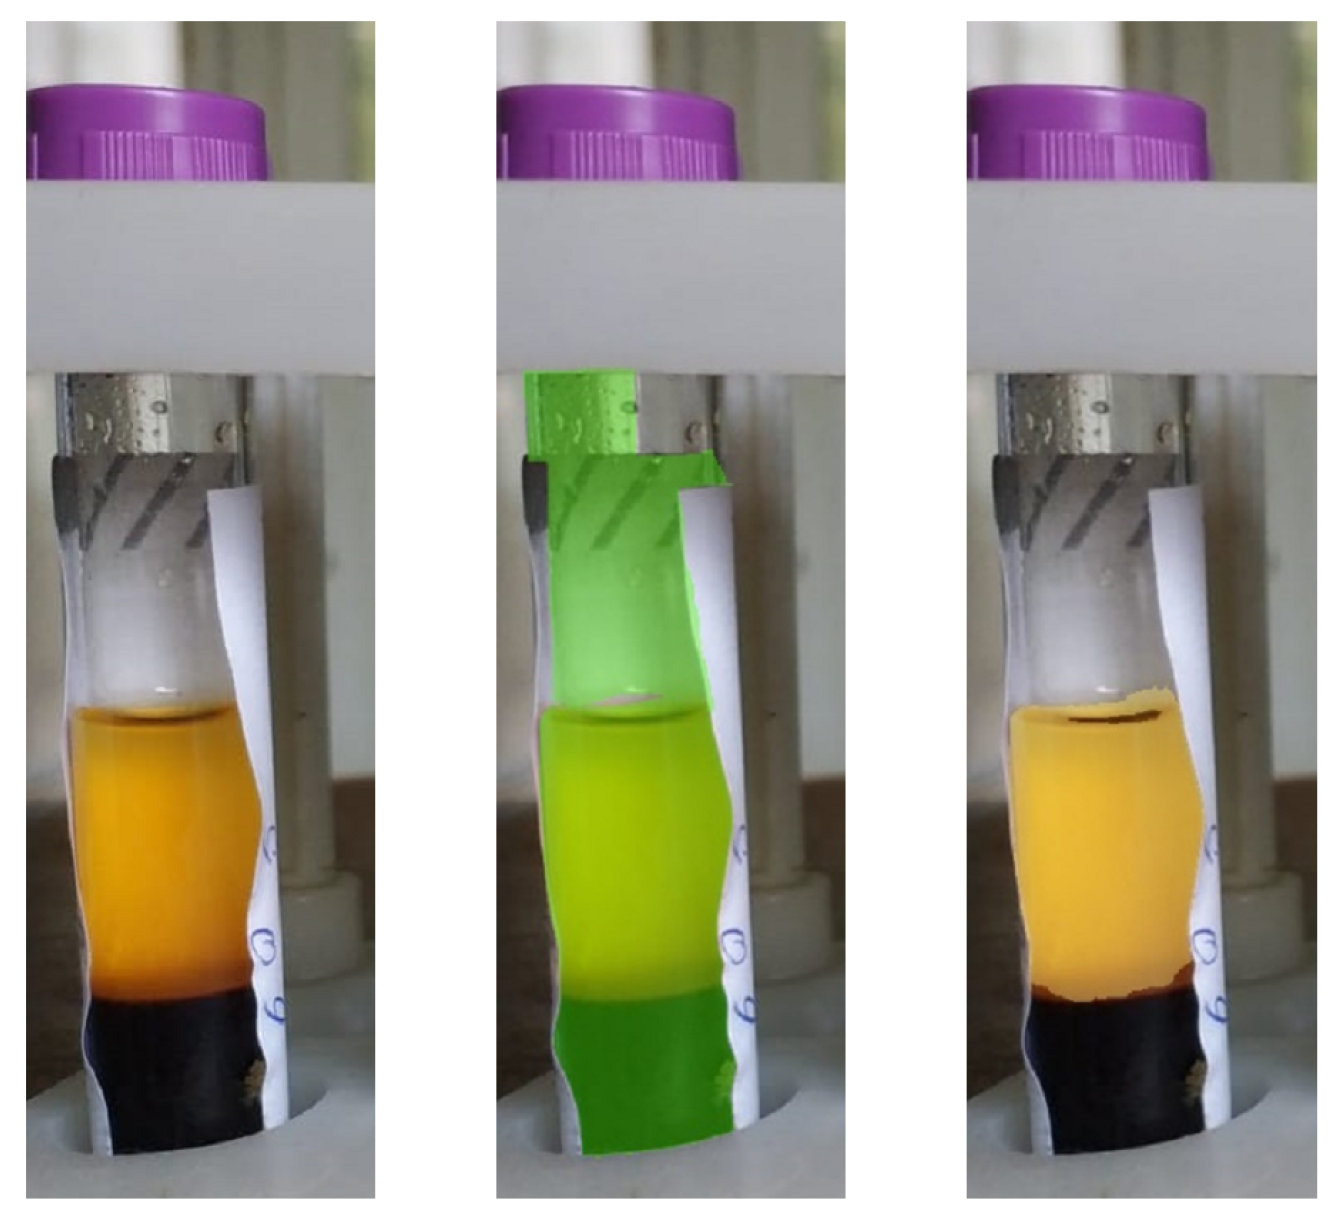
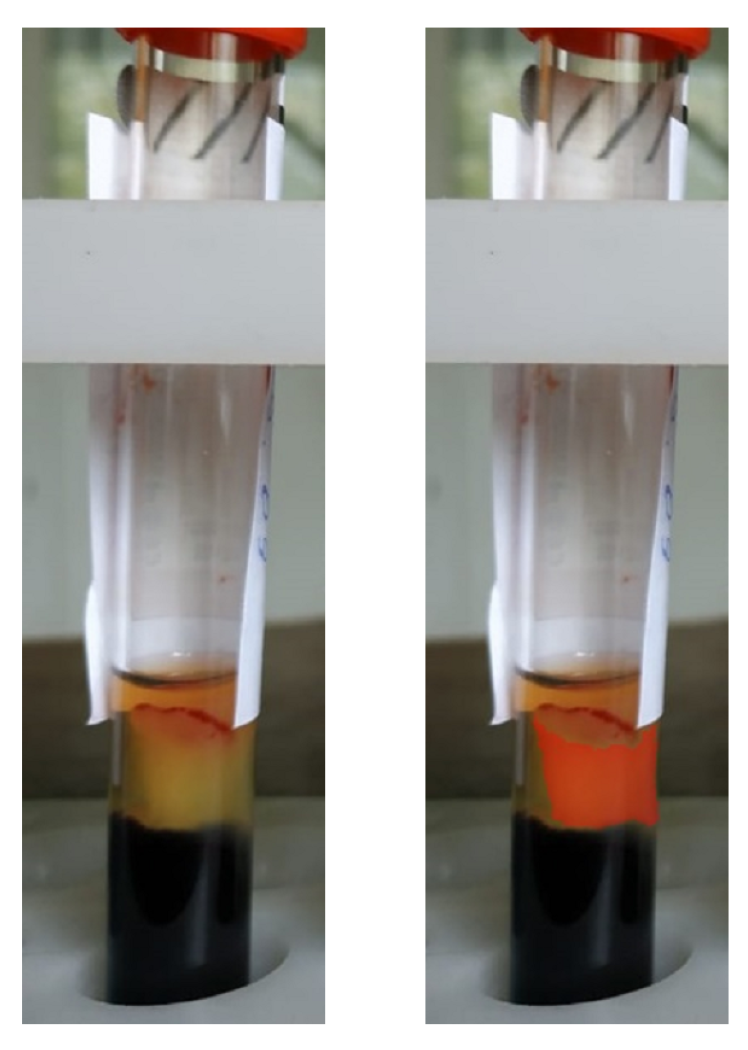
Adding 100 images with fibrin threads to the training set did not worsen the quality of recognition of objects No. 1 and No. 2; however, several cases of “phantom” objects being detected in images without fibrin threads (object No. 3) were recorded, and often these were not even inside the test tube (Figure 11). The test tube was successfully recognized in the photo, and objects outside it should not be paid attention to; however the problem of such phantom objects can be solved by simple organizational measures as well, such as by creating a solid background. Testing the network on images with threads showed that they were detected, but often not in full (Figure 12).
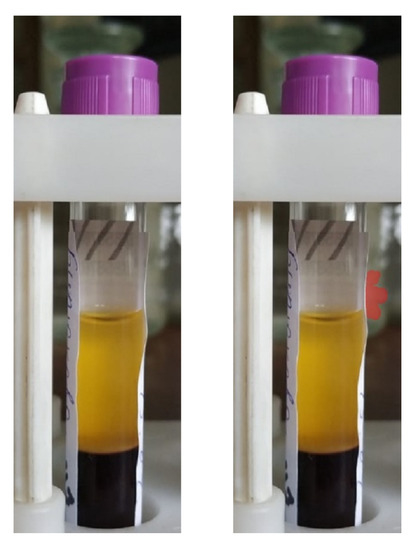
Figure 11.
Phantom object outside the test tube.
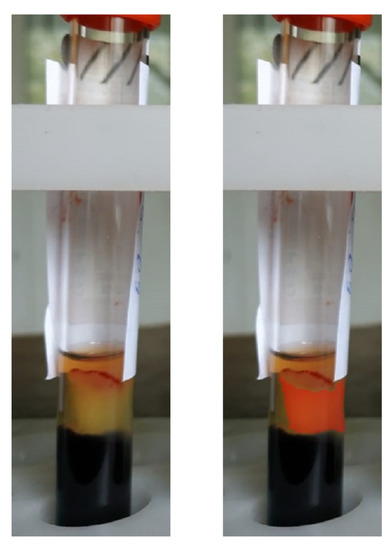
Figure 12.
Partial recognition of fibrin strands.
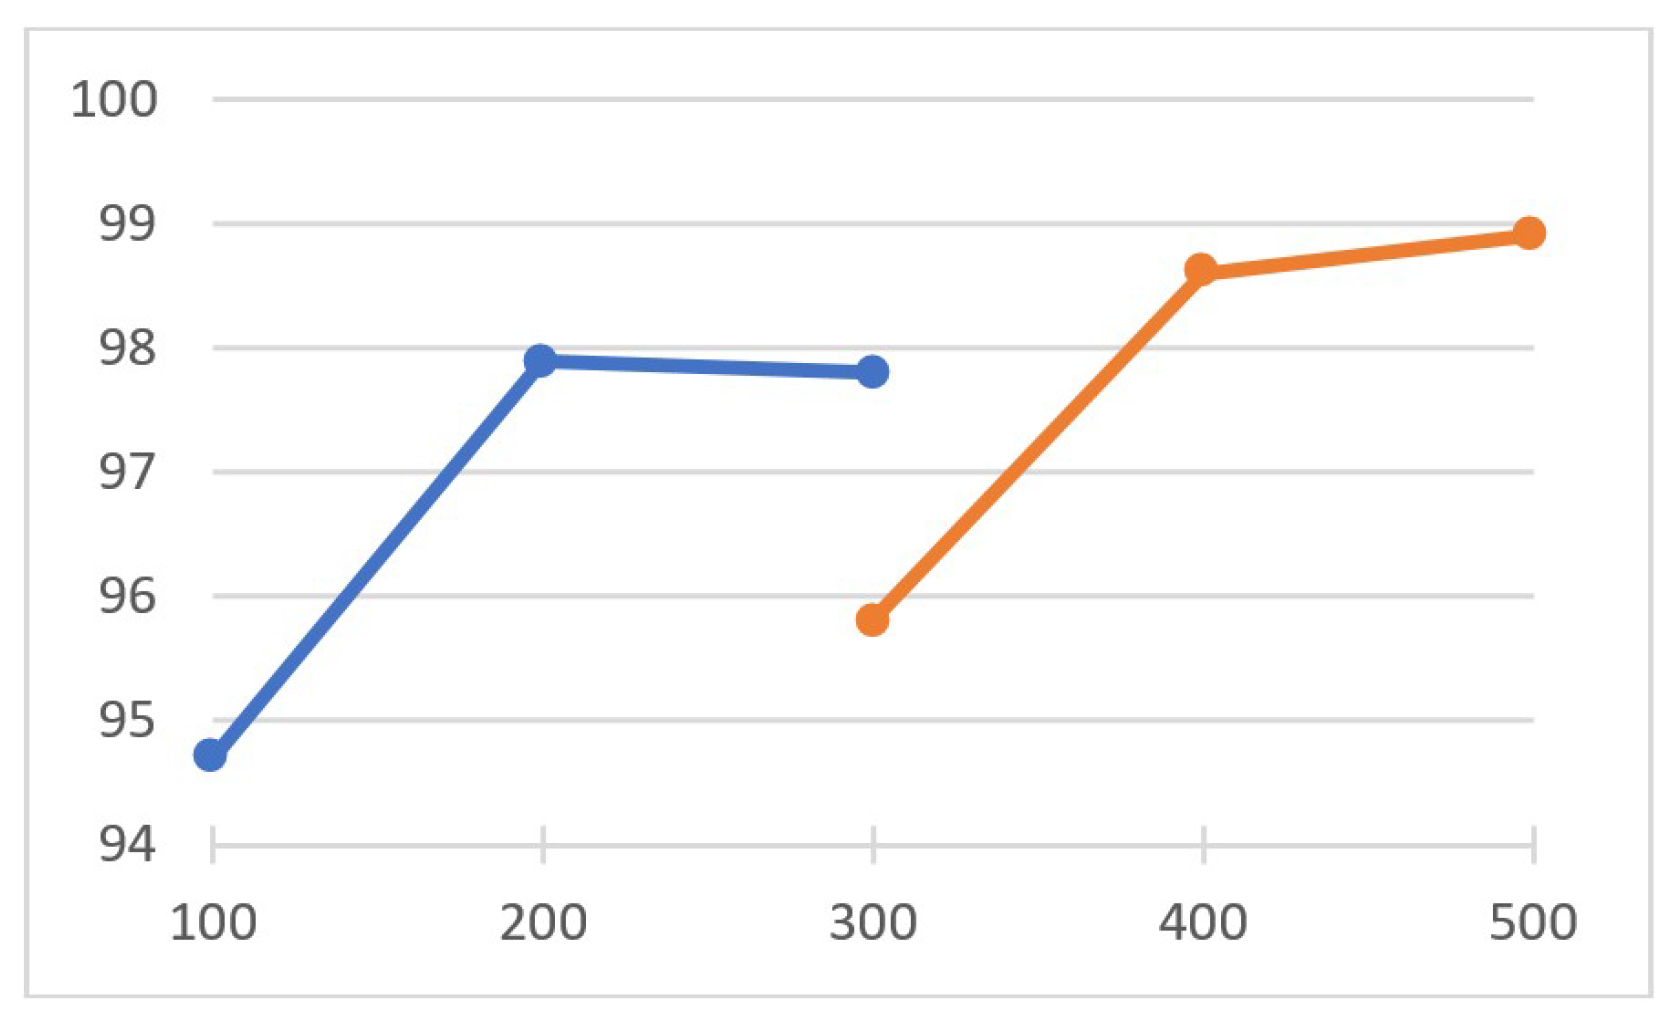
An increase in the training set to 500 images (200 without threads and 300 with threads) led to an increase in the quality of recognition for all classes of objects. On the validation set, the recognition accuracy approached 99% (Figure 13), while for objects No. 2 and No. 3 it even exceeded this value.
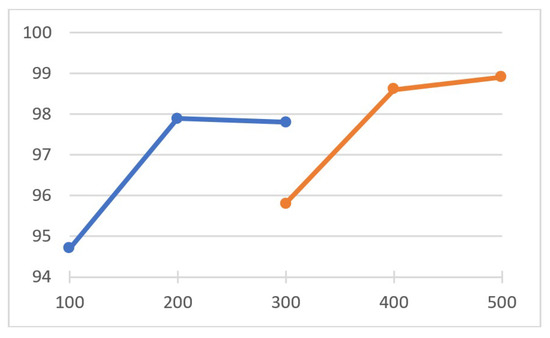
Figure 13.
Recognition accuracy on the validation set depending on the volume of the training set: blue graph—validation set containing only test tubes without filaments; orange—validation set containing 50% tubes with filaments.
It should be noted that, despite the detected error, the accuracy of determining the upper and lower edges of the visible part of the tube, which are necessary for calculating the image scale, was 100% based on the results of the network operation. In addition, for all images in the validation set the presence or absence of fibrin strands was correctly determined. As for the lower level of the upper fraction of the contents of the tube, it was accurately determined for all test tubes without filaments. For tubes with filaments the maximum error did not exceed 1 mm, which is sufficient to guarantee safe aliquoting considering the large headroom.
5. Conclusions
In the course of the study, a neural network was trained to determine the depth to which a pipette must be immersed in order to take serum aliquots based on photographic images of tubes containing blood serum and a clot. In this case, the nature of the fraction interface was determined and taken into account beforehand, making it possible to obtain the maximum number of aliquots while at the same time avoiding (or significantly reducing the likelihood of occurrence) situations such as contamination of an aliquot with erythrocytes drawn from the clot surface, clogging of the pipette tip with fibrin threads, etc. The resulting neural network showed high accuracy, and can be directly used to automate the aliquoting process.
Author Contributions
Conceptualization, S.K., L.R. and T.S.; methodology, S.K. and L.R.; software, S.K.; validation, L.R. and A.N.; formal analysis, A.N.; investigation, S.K. and A.N.; resources, A.N. and T.S.; data curation, T.S. and A.N.; writing—original draft preparation, S.K.; writing—review and editing, L.R. and A.N.; visualization, S.K.; supervision, L.R. and T.S.; project administration, L.R. All authors have read and agreed to the published version of the manuscript.
Funding
This research was supported by a state assignment of the Ministry of Science and Higher Education of the Russian Federation under Grant FZWN-2020-0017.
Institutional Review Board Statement
Not applicable.
Informed Consent Statement
Not applicable.
Data Availability Statement
The investigation was conducted as part of the work approved by the local ethics committee (Protocol No. 31 of 25 November 2022). At the same time, the bio-material used in the work was a “residual material” previously used for laboratory diagnostics from donor patients who gave voluntary informed consent in a medical and preventive organization. For the current investigation, only anonymous blood samples were used (there were no personal data such as full name, residential address, passport details, etc.). Identification of the persons from whom the biosamples were obtained is impossible, therefore their use cannot cause harm to the subjects of the investigation, including a violation of confidentiality. This ensures that the organization and conduct of the investigation comply with the provisions of the Guide for research ethics committee members, Council of Europe, 2010.
Conflicts of Interest
The authors declare no conflict of interest.
References
- Anisimov, S.V.; Akhmerov, T.M.; Balanovsky, O.P.; Baranich, T.I.; Belyaev, V.E.; Borisova, A.L.; Bryzgalina, E.V.; Voronkova, A.S.; Glinkina, V.V.; Glotov, A.S.; et al. Biobanking: National Guidelines: Prepared by Experts of the National Association of Biobanks and Biobanking Specialists; Triumph: Moscow, Russia, 2022. [Google Scholar]
- Pokrovskaya, M.S.; Borisova, A.L.; Sivakova, O.V.; Metelskaya, V.A.; Meshkov, A.N.; Shatalova, A.M.; Drapkina, O.M. Quality management in biobank. World tendencies and experience of biobank of FSI NMRC for Preventive Medicine of the Ministry of Healthcare of Russia. Russ. Clin. Lab. Diagn. 2019, 64, 380–384. [Google Scholar] [CrossRef] [PubMed]
- Henderson, M.; Goldring, K.; Simeon-Dubach, D. Advancing professionalization of biobank business opera-tions: A worldwide survey. Biopreserv. Biobank. 2019, 17, 71–75. [Google Scholar] [CrossRef] [PubMed]
- Malyshev, D.; Rybak, L.; Carbone, G.; Semenenko, T.; Nozdracheva, A. Optimal Design of a Parallel Manipulator for Aliquoting of Biomaterials Considering Workspace and Singularity Zones. Appl. Sci. 2022, 12, 2070. [Google Scholar] [CrossRef]
- Voloshkin, A.; Rybak, L.; Cherkasov, V.; Carbone, G. Design of gripping devices based on a globoid transmission for a robotic biomaterial aliquoting system. Robotica 2022, 40, 4570–4585. [Google Scholar] [CrossRef]
- Malyshev, D.; Rybak, L.; Carbone, G.; Semenenko, T.; Nozdracheva, A. Workspace and Singularity Zones Analysis of a Robotic System for biosamples Aliquoting. In Advances in Service and Industrial Robotics, RAAD 2021 Mechanisms and Machine Science; Springer: Cham, Switzerland, 2021; pp. 31–38. [Google Scholar]
- Malm, J.; Fehniger, T.E.; Danmyr, P.; Végvári, Á.; Welinder, C.; Lindberg, H.; Marko-Varga, G. Developments in biobanking workflow standardization providing sample integrity and stability. J. Proteom. 2013, 16, 38–45. [Google Scholar] [CrossRef] [PubMed]
- Malm, J.; Végvári, A.; Rezeli, M.; Upton, P.; Danmyr, P.; Nilsson, R.; Steinfelder, E.; Marko-Varga, G. Large scale biobanking of blood—The importance of high density sample processing procedures. J. Proteom. 2012, 76, 116–124. [Google Scholar] [CrossRef] [PubMed]
- Zhang, C.; Huang, Y.; Fang, Y.; Liao, P.; Wu, Y.; Chen, H.; Chen, Z.; Deng, Y.; Li, S.; Liu, H.; et al. The Liquid Level Detection System Based on Pressure Sensor. J. Nanosci. Nanotechnol. 2019, 19, 2049–2053. [Google Scholar] [CrossRef] [PubMed]
- Fleischer, H.; Baumann, D.; Joshi, S.; Chu, X.; Roddelkopf, T.; Klos, M.; Thurow, K. Analytical Measurements and Efficient Process Generation Using a Dual-Arm Robot Equipped with Electronic Pipettes. Energies 2018, 11, 2567. [Google Scholar] [CrossRef]
- Fleischer, H.; Drews, R.; Janson, J.; Chinna, P.B.; Chu, X.; Klos, M.; Thurow, K. Application of a Dual-Arm Robot in Complex Sample Preparation and Measurement Processes. J. Lab. Autom. 2016, 21, 671–681. [Google Scholar] [CrossRef] [PubMed]
- Jiang, H.; Ouyang, Z.; Zeng, J.; Yuan, L.; Zheng, N.; Mohammed, J.; Mark, E. A User-Friendly robotic sample preparation program for fully automated biological sample pipetting and dilution to benefit the regulated bioanalysis. J. Lab. Autom. 2012, 17, 211–221. [Google Scholar] [CrossRef] [PubMed]
- INTEGRA Biosciences. Freeling You from Tedious Multichannel Pipetting Tasks. Available online: www.bionity.com/en/products/1128490/freeing-you-from-tedious-multichannel-pipetting-tasks.html (accessed on 11 September 2022).
- Freedom EVO Platform. Available online: www.lifesciences.tecan.com/freedom-evo-platform (accessed on 11 September 2022).
- Hamilton Broshure. Life Science Robotics. Available online: www.corefacilities.isbscience.org/wp-content/uploads/sites/5/2015/07/HamiltonBrochure.pdf (accessed on 11 September 2022).
- Wagner, F.; Ipia, A.; Tarabalka, Y.; Lotte, R.; Ferreira, M.; Aidar, M.; Gloor, M.; Phillips, O.; Aragão, L. Using the U-net convolutional network to map forest types and disturbance in the Atlantic rainforest with very high resolution images. Remote Sens. Ecol. Conserv. 2019, 5, 360–375. [Google Scholar] [CrossRef]
- Ronneberger, O.; Fischer, F.; Brox, T. U-Net: Convolutional Networks for Biomedical Image Segmentation. arXiv 2015, arXiv:1505.04597. [Google Scholar]
- Poleshchenko, D.A.; Glushchenko, A.I.; Fomin, A.V. Application of Pre-Trained Deep Neural Networks to Identify Cast Billet End Stamp before Heating. In Proceedings of the 2022 24th International Conference on Digital Signal Processing and Its Applications (DSPA), Moscow, Russia, 30 March–1 April 2022; pp. 1–5. [Google Scholar]
- Kida, S.; Nakamoto, T.; Nakano, M.; Nawa, K.; Haga, A.; Kotoku, J.; Yamashita, H.; Nakagawa, K. Cone Beam Computed Tomography Image Quality Improvement Using a Deep Convolutional Neural Network. Cureus 2018, 10, e2548. [Google Scholar] [CrossRef] [PubMed]
- Jais, I.K.M.; Ismail, A.R.; Nisa, S.Q. Adam optimization algorithm for wide and deep neural network. Knowl. Eng. Data Sci. 2019, 2, 41–46. [Google Scholar] [CrossRef]
- Zhang, Z. Improved adam optimizer for deep neural networks. In Proceedings of the 2018 IEEE/ACM 26th International Symposium on Quality of Service (IWQoS), Banff, AB, Canada, 4–6 June 2018; pp. 1–2. [Google Scholar]
- Kingma, D.; Ba, J. Adam: A method for stochastic optimization. arXiv 2014, arXiv:1412.6980. [Google Scholar]
Disclaimer/Publisher’s Note: The statements, opinions and data contained in all publications are solely those of the individual author(s) and contributor(s) and not of MDPI and/or the editor(s). MDPI and/or the editor(s) disclaim responsibility for any injury to people or property resulting from any ideas, methods, instructions or products referred to in the content. |
© 2023 by the authors. Licensee MDPI, Basel, Switzerland. This article is an open access article distributed under the terms and conditions of the Creative Commons Attribution (CC BY) license (https://creativecommons.org/licenses/by/4.0/).


