Proceeding Paper

Outdoor Thermal Comfort Study on Urban Areas with Various Densities in Taipei †

Department of Architecture and Urban Design, National Taipei University of Technology, Taipei 106, Taiwan
*
Author to whom correspondence should be addressed.
Presented at the 3rd IEEE International Conference on Electronic Communications, Internet of Things and Big Data Conference 2023, Taichung, Taiwan, 14–16 April 2023.
Eng. Proc. 2023, 38(1), 77; https://doi.org/10.3390/engproc2023038077
Published: 10 July 2023

Abstract

:
With relatively high temperatures and evenly distributed precipitation throughout the year, outdoor thermal comfort is important in Taiwan. Thus, we discuss thermal comfort in different density areas with A: a low density (average buildings height/Street width ratio: 1.3, SVF: 0.28), B: a mid density (H/W: 2.75, SVF: 0.14), and C: a high density (H/W: 6.88, SVF: 0.11). Data were acquired through field meteorological measurements from the three sites on typical summer days from 15 to 17 July 2022. Around the Wanhua district of Taipei City, thermal comfort was obtained through the calculation of thermal comfort indices: physiological equivalent temperature (PET) and Universal Thermal Climate Index (UTCI). Results showed that different urban density areas had different thermal comforts; streets in A were more exposed to sunlight, causing the mean radiant temperature to be the highest; C had lower solar radiation and stronger wind with the highest comfort level; and B had higher air temperature but lower radiation than A. PET contributed to uncomfortableness in A. Thermal sensation vote results showed that B had the most “uncomfortable” votes because wind speed in B was the lowest. Medium-density urban areas had enough solar exposure on the pedestrian level, but not enough wind to dissipate the heat. PET was more sensitive to mean radiant temperature. These findings provide a guideline and technical reference for urban designers to mitigate the high temperatures of summer in urban areas and improve thermal comfort to create a healthy environment and encourage people to utilize outdoor environments.

1. Introduction

Urban outdoor spaces accommodate pedestrian passage and provide space for outdoor activities; thus, they are important components of urban life. Encouraging urban residents to visit outdoor spaces and streets benefits the city economically, physically, environmentally, and socially [1,2,3,4]. Taiwan entered the era of an aged society with more than 14% of the population being 65 years old and above. A study in Japan [5] concluded that walkable urban spaces improved the lives of senior citizens. Outdoor spaces can also provide health benefits and offer a feeling of social support. However, global warming and the rapid urbanization process of big cities have caused tremendous changes to the climate, especially in urban areas, intensifying the urban heat island (UHI) effect and affecting outdoor thermal comfort. The UHI effect is a phenomenon where heat accumulates in urban areas caused by urban development and activities [6]. In the past decade, the urban temperature has been continuously rising and has caused a serious impact on urban residents. Exposure to extremely high temperatures leads to fatigue and dizziness, and is even life threatening [7,8]. According to the Central Weather Bureau, Taiwan is located in a humid–subtropical region with relatively high temperatures and heavy precipitation with 204 rainy days per year. The summer of 2020 was recorded as the hottest season ever in Taiwan, with the highest temperature of 40.2 °C in Taitung and 39.7 °C in Taipei. According to Taiwan Climate Change Projection Information and the Adaptation Knowledge Platform, by the end of this century, there is a high possibility that summer will be lengthened by up to 210 days per year, with winter shortened by less than 50 days if global warming continues to escalate.
To encourage citizens to utilize urban outdoor spaces, thermal comfort is a necessary factor to be considered. Thermal comfort depends on the satisfaction of the human body in relation to the thermal environment. Global climate change has made people pay more attention to outdoor thermal comfort. Outdoor thermal comfort is affected by meteorological factors (air temperature, humidity, wind, sun, and exposure) and personal factors (gender, age, clothing insulation, and metabolism). Thermal comfort can be assessed through thermal indices and subjective questionnaires. Thermal indices can be calculated through meteorological data acquired from field monitoring while conducting questionnaire surveys around the monitoring area.
Physiological equivalent temperature (PET) and Universal Thermal Climate Index (UTCI) are the most commonly used thermal comfort indices. PET was developed in the 1990s by Hoppe, and UTCI was developed by the International Society for Biometeorology (ISB) [9]. Both PET and UTCI include factors affecting thermal comfort in the calculation: meteorological parameters and personal parameters. UTCI has the advantage of presenting different climates, weather, and locations [10]. Reference [11] indicated that PET was more sensitive in the heat of summer; thus, both PET and UTCI were considered suitable thermal indices to be utilized in this research. Several studies on urban planning showed that different urban densities had different impacts on the wind ventilation and microclimate of the area. Reference [12] concluded that stronger wind had the effect of dispersing and diluting both pollutants and heat. Urban densities have significant impacts on the urban climate, where good ventilation can improve thermal comfort. Studies in the past have shown that urban densities are affected by factors such as sky view factor (SVF) and height-to-width ratio (H/W), which is the ratio of building heights to street width [13]. Lower density urban areas are proven to have more wind [14]. In urban areas with taller buildings, the wind is accelerated around the corners [15]. During the daytime, air temperature and SVF have a positive correlation, where lower SVF and H/W areas can block direct solar exposure, thus resulting in cooler temperatures [16,17,18]. Studies in Canada showed [14] that SVF between 0.3 and 0.85 caused a 1.5 K temperature difference. However, compared to high-density areas, low-density areas can lose more heat and have lower temperatures in the absence of solar radiation. Mean radiant temperature (Tmrt) is also proven to be lower in narrow streets, where Tmrt increased with SVF value [19]. Research in Tainan [18] studied the thermal environment of a school area and found that PET was lower in low SVF areas. SVF and wind speed directly affect outdoor thermal comfort [20]. In a humid–subtropical climate, lowering radiation and air temperature can result in higher thermal comfort, and accelerating wind speed can improve urban ventilation and thermal comfort. Therefore, overall thermal comfort can be evaluated through PET and UTCI with relevant climate factors in the calculations.
This study aims to explore the relationship between urban density and the influences on pedestrian thermal comfort in Taiwan through field monitoring and questionnaire surveys. Thermal comfort in areas is compared with different urban densities in the Wanhua district of Taipei on hot summer days. The effect of various urban densities on human thermal comfort is investigated to determine urban density with the highest thermal comfort level in summer, and to provide a guideline for urban planners to optimize the thermal comfort of outdoor spaces in Taiwan.

2. Methodology

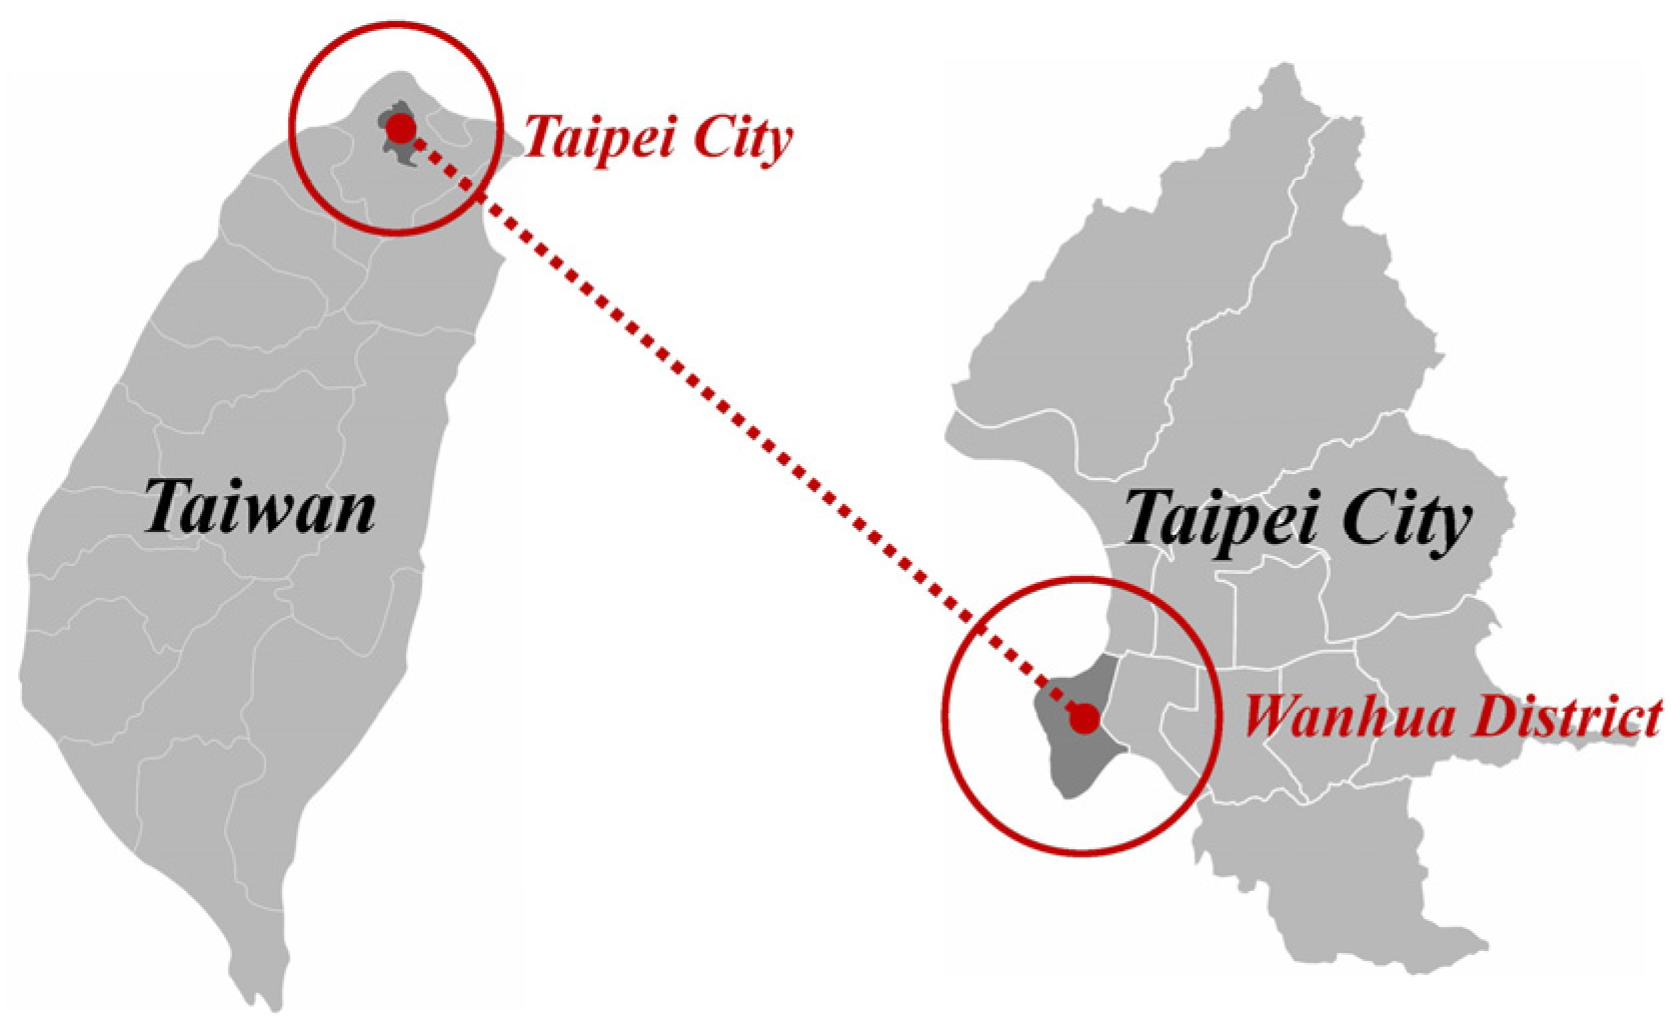
2.1. Experiment Site

Taiwan has a humid–subtropical climate with high temperatures, especially in the summer season, and a high level of humidity. Urban areas selected for this study are located in Ximen, a part of the northeast side of the Wanhua district, which is located in the west of Taipei City, the northern part of Taiwan (Figure 1). The pedestrian area in Ximen was the first to be built in Taipei, and the largest in Taiwan. Ximen was selected as the location of this study due to the variety of age groups and a large number of pedestrians, making this place ideal for an outdoor human thermal comfort study. Three different locations were selected as experimental sites for meteorological measurement and questionnaire surveys in all three sites (A-C) were located in the same district to minimize the climate difference (Figure 2). The H/W ratio and SVF value were used to determine the urban density of this study. Fisheye images were taken and SVF was calculated using RayMan Pro software [21,22,23,24,25]. Three types of urban densities (low, medium, and high) were compared in this study. Site A was located in a low-density area that has an H/W ratio of 1.3 with an SVF value of 0.28. Site B was in a medium-density area with an H/W of 2.75 and an SVF value of 0.14. Site C had the highest density of all three, with an H/W of 6.88 and an SVF value of 0.11. Taking solar angle into account, all three sites were north–south oriented to minimize differentiation between sites (Table 1).

2.2. Meteorological Measurement

Site monitoring and meteorological data measurements of this study were conducted during the summer season from the 15th to the 17th of July 2022. The dates chosen were the 196th to 198th days of the year, which were the typical hottest summer days in the Wanhua district. The majority of the shops in Ximen opened around 10 AM; thus, this study was conducted from 10:00 to 18:00 when the typical daytime activity occurred in Ximen to ensure the number of questionnaire surveys in this study. Meteorological factors such as air temperature (Ta), relative humidity (RH), wind speed (v), and black globe temperature (Tg) were measured using the testo-480 measuring equipment. The equipment and probes were placed at a height of 1.5 m, and thermal data were collected every 1 min.

2.3. Questionnaire Survey

A questionnaire survey was conducted simultaneously with field data measurement, within a radius of 5m of the measuring equipment. Interviewees were randomly selected. Taking thermal adaptation into account, interviewees stayed outdoors (preferably in the same area) for at least 10 min to be eligible to fill out the questionnaire. The interview method was used for the questionnaire, in which interviewees were asked questions in the questionnaire. The questionnaire comprised three sections. The first section included questions for information about the interview, such as date, time, and location. The second section was for basic information on the interviewees, such as gender, age group, upper and lower body clothing, and activities. The third section was for the thermal sensation vote. This section included 6 questions. The first question was to determine the thermal sensation of the interviewees according to their sensation at the moment of the interview with a 5-point scale (−2, hot; −1, warm; 0, neutral; +1, cool; +2, cold). The second through fifth questions were for the preference vote towards the climate parameters, including air temperature, relative humidity, wind speed, and radiation with a 3-point scale (−1, 0, +1). Interviewees were asked about their expectations of the parameters. The last question was about the overall thermal comfort of the interviewee using a 3-point scale (−1, uncomfortable; 0, neutral; +1, comfortable). A total of 1177 valid questionnaires were completed. Personal parameters such as age, clothing, and activities were collected to calculate thermal comfort with PET and UTCI.

2.4. Thermal Comfort Indices

UTCI and PET are two of the most commonly used thermal comfort indices to assess outdoor thermal comfort. Both indices were considered with every parameter influencing thermal comfort: meteorological parameters (air temperature, relative humidity, wind speed, and radiation), and personal parameters (clothing and metabolic rate) [9]. PET was developed by Hoppe using the Munich Personal Energy Balance Model or MEMI, defined as an environment where human skin and body temperature reach the typical indoor environment where Tmrt = Ta, vp = 12 hPa, and v = 0.1 m/s. UTCI was developed by ISB, using equivalent temperature where RH = 50%, Tmrt = Ta, v < 0.15 m/s, and vp < 20 hPa. With meteorological data obtained through field measurement and personal data obtained through questionnaire surveys, outdoor thermal comfort was calculated through PET and UTCI. Both indices were calculated with RayMan software, an applied meteorology and climatology software developed by Andreas and Rutz [21,22,23,24,25]. The time, date, longitude, and latitude of the experiment sites, meteorological data, and personal data were input into the software to calculate thermal indices. Fisheye images were used to calculate the SVF value for mean radiant temperature calculations. The average metabolic rates and clothing insulation of interviewees were used in this study.

3. Results and Discussions

3.1. Meteorological Measurement

Among the three sites, the maximum mean air temperature of sites A and B were both 39.5 °C (Table 2). Site B had a slightly higher mean air temperature than A. Site B showed the highest mean air temperature. The main reason was that the medium-density area had enough sun exposure and solar radiation to the pedestrian level, but did not have a high enough wind speed to disperse the heat. The mean air temperature and maximum air temperature of site C were the lowest of all three. Site C also had the lowest black globe temperature because C had the highest H/W ratio and lowest SVF value. Site A, with the lowest H/W ratio and highest SVF value, showed the highest black globe temperature. Although site A was more exposed to solar radiation, the openness allowed stronger wind than B to lower the air temperature. Wind speed was the strongest in site C, but relative humidity in site C was the highest. Humidity was defined as the concentration of water vapor in the air. Higher-density areas could cause wind speed to be stronger around tall buildings, but could also cause humid air to take longer to evaporate. In conclusion, site C had the lowest mean air temperature and lowest black globe temperature. There was a positive correlation between air temperature and wind speed, and between urban density and black globe temperature. The higher the H/W ratio, the lower the radiation. The wind speed in site B was the weakest, and the mean air temperature was the highest.

3.2. Questionnaire Result

A total of 1177 valid questionnaires were collected: 457 in site A (208 males, 249 females), 384 in site B (178 males, 206 females), and 336 in site C (155 males, 181 females). Average clothing insulation slightly differed from sites, which ranged from 0.28 to 0.29. Activity level was also typical, which ranged from 2.03 met to 2.11 met. The majority of the interviewees belonged to the 19−30 age group, with the 13−18 age group being the second largest, and the 31−40 age group being the third. Table 3 and Table 4 summarize the data of the interviewees. Most of the interviewees voted “hot = −2” on the thermal sensation vote, and most preferred a lower temperature. More than half of the interviewees voted “lower = +1” on the relative humidity vote. Stronger wind speed was preferred on sites A and B, but remained unchanged in site C. Regarding solar radiation, most voted for “lower = +1”. Sites A and B had a majority vote of “uncomfortable = −1”, while site C had a majority of “neutral = 0”. The air temperature preference vote result showed that the thermal environment in Ximen was extreme. The result showed that wind speed had a direct correlation with the thermal sensation vote of the interviewees.

3.3. Relationship between Urban Densities and Pedestrian Thermal Comfort

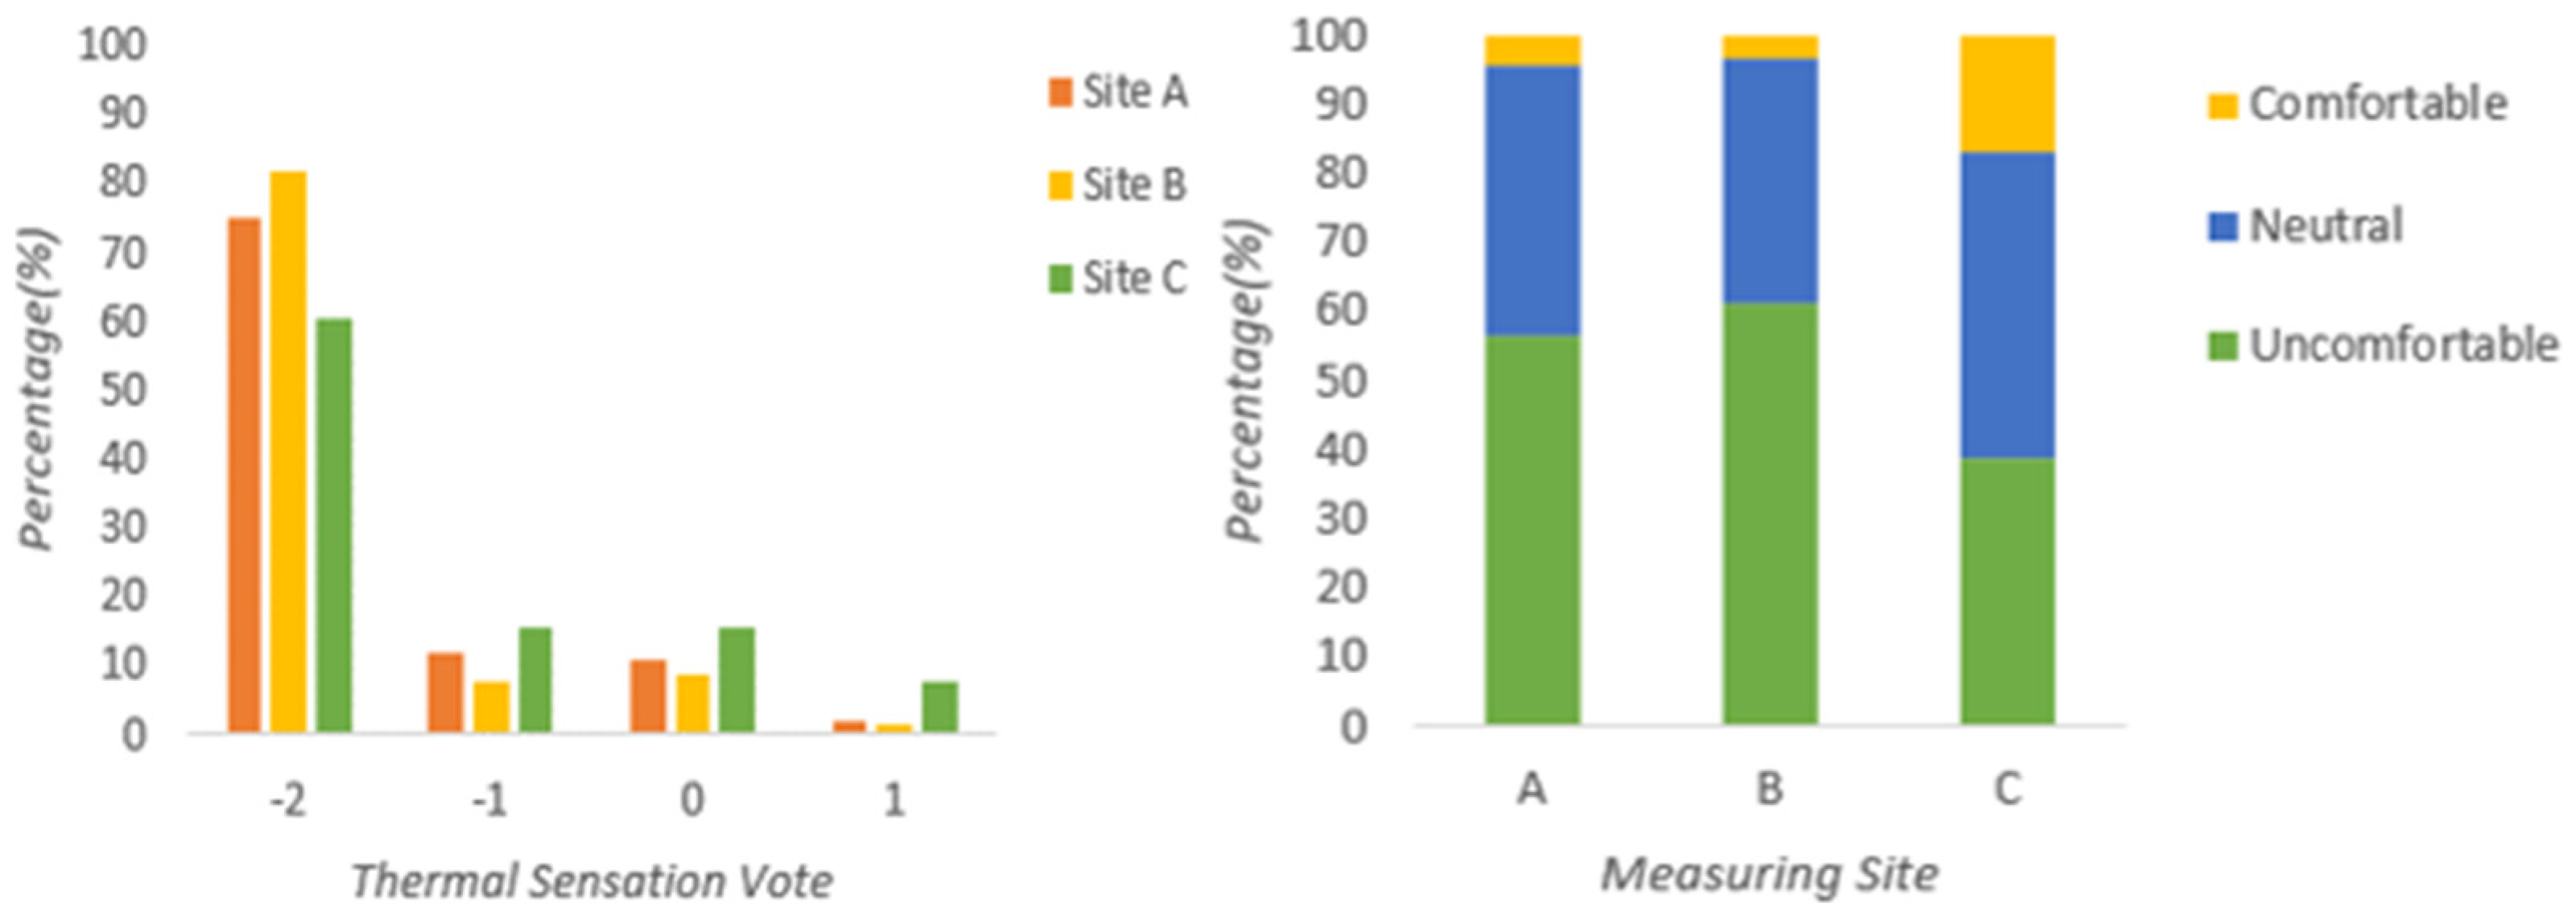
3.3.1. Thermal Sensation Vote (TSV)

The thermal sensation vote (Figure 3) showed that the majority of pedestrians felt “hot = −2”, as the summer thermal environment of Ximen was extremely hot. In site B, the highest percentage of 82% was obtained, and in site C, the lowest percentage of 61% was recorded. This result proved that high-density areas (H/W = 6.88, SVF = 0.11) had significantly better thermal sensation in the summer season. The medium-density areas of site B (H/W = 2.75, SVF = 0.14) had the worst thermal comfort of all three sites. Low-density areas (H/W = 1.3, SVF = 0.28) had 75% of the vote for “hot = −2”. Comparing the percentages of thermal sensation votes, different urban densities showed different thermal comfort, with thermal comfort ranking as site C > site A > site B.

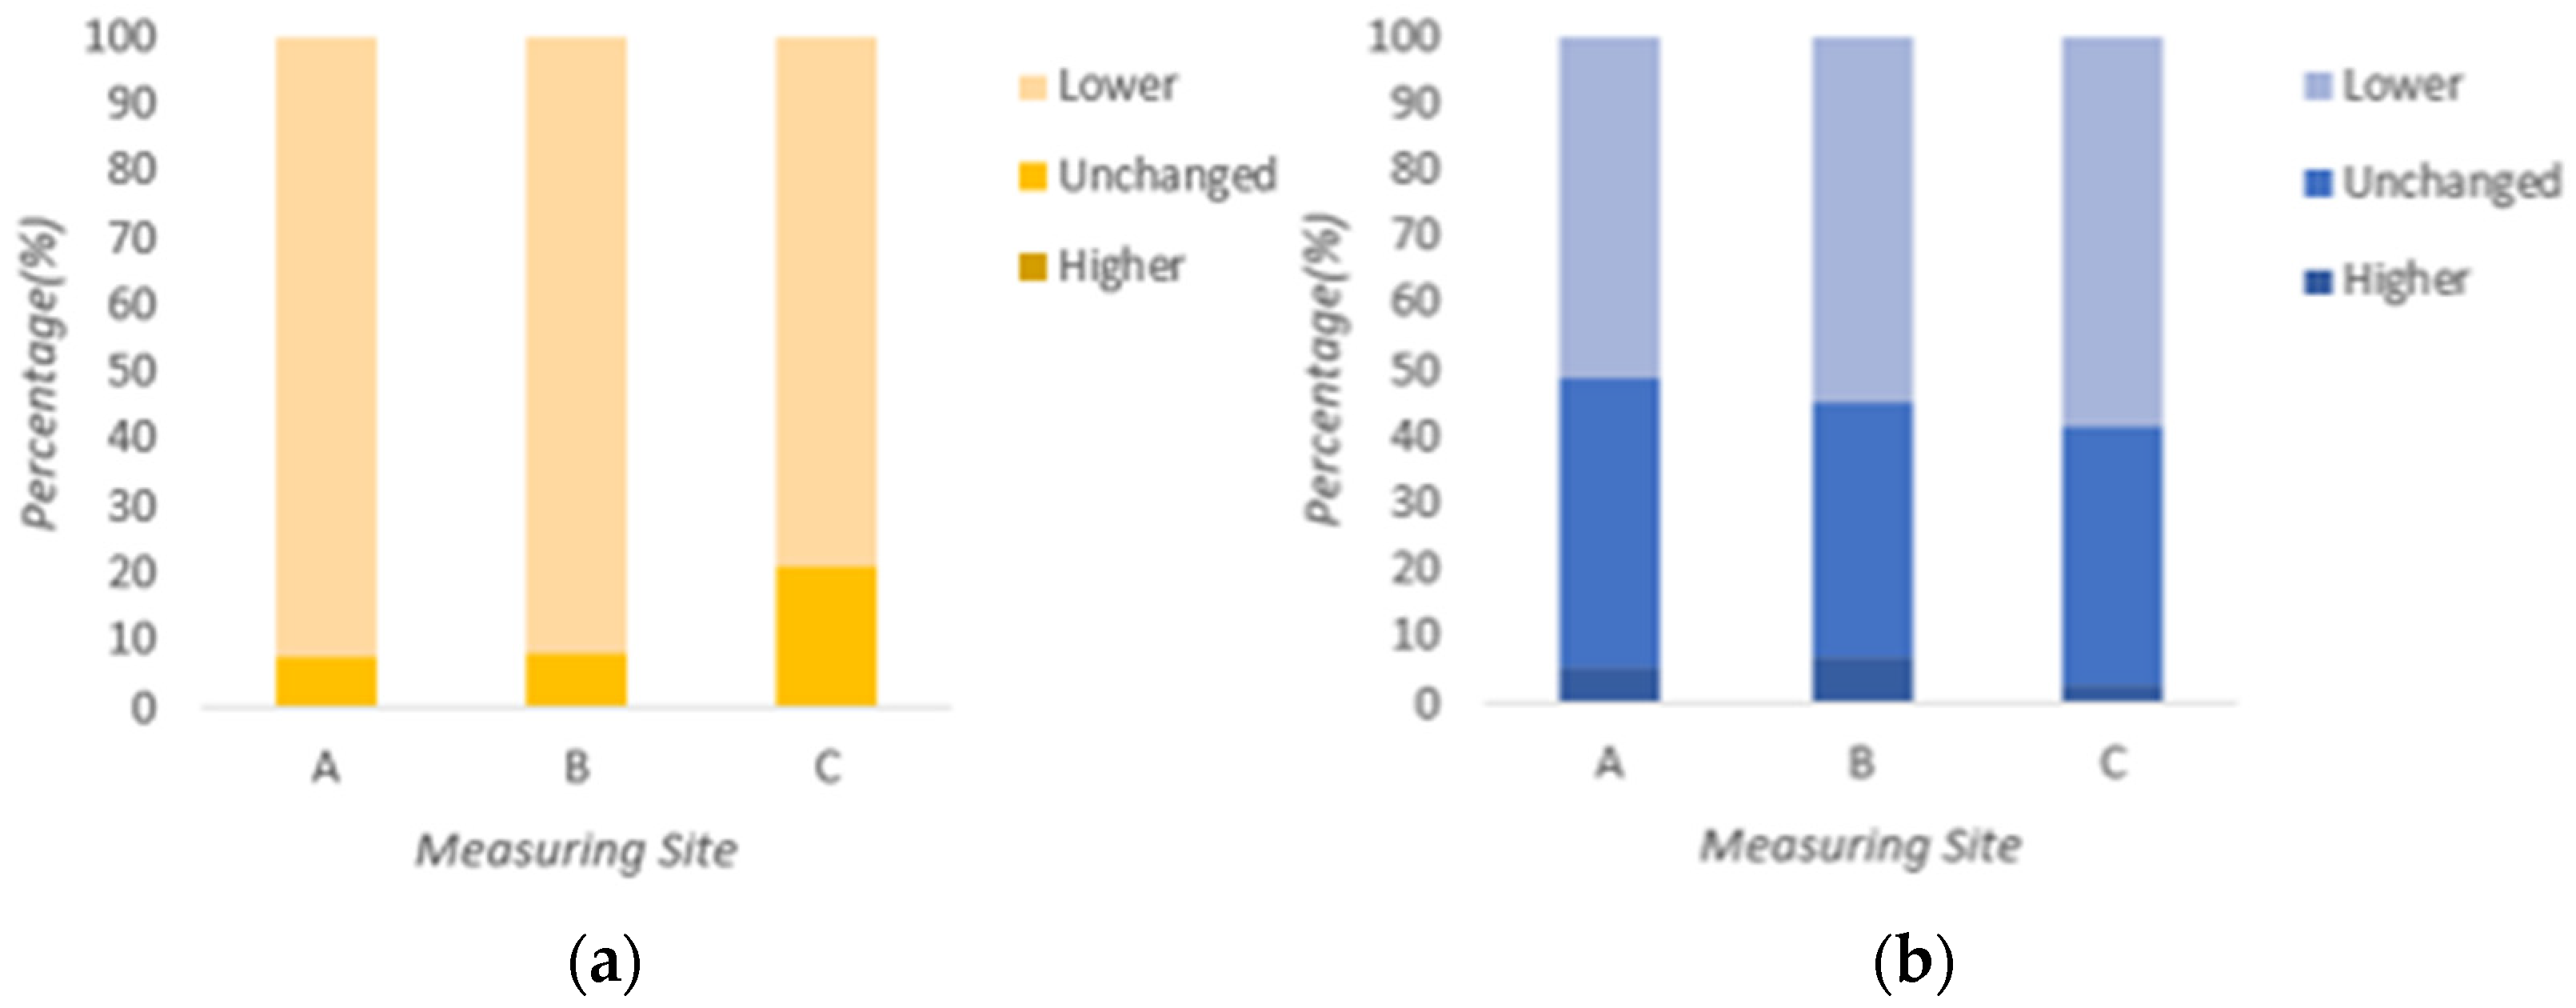
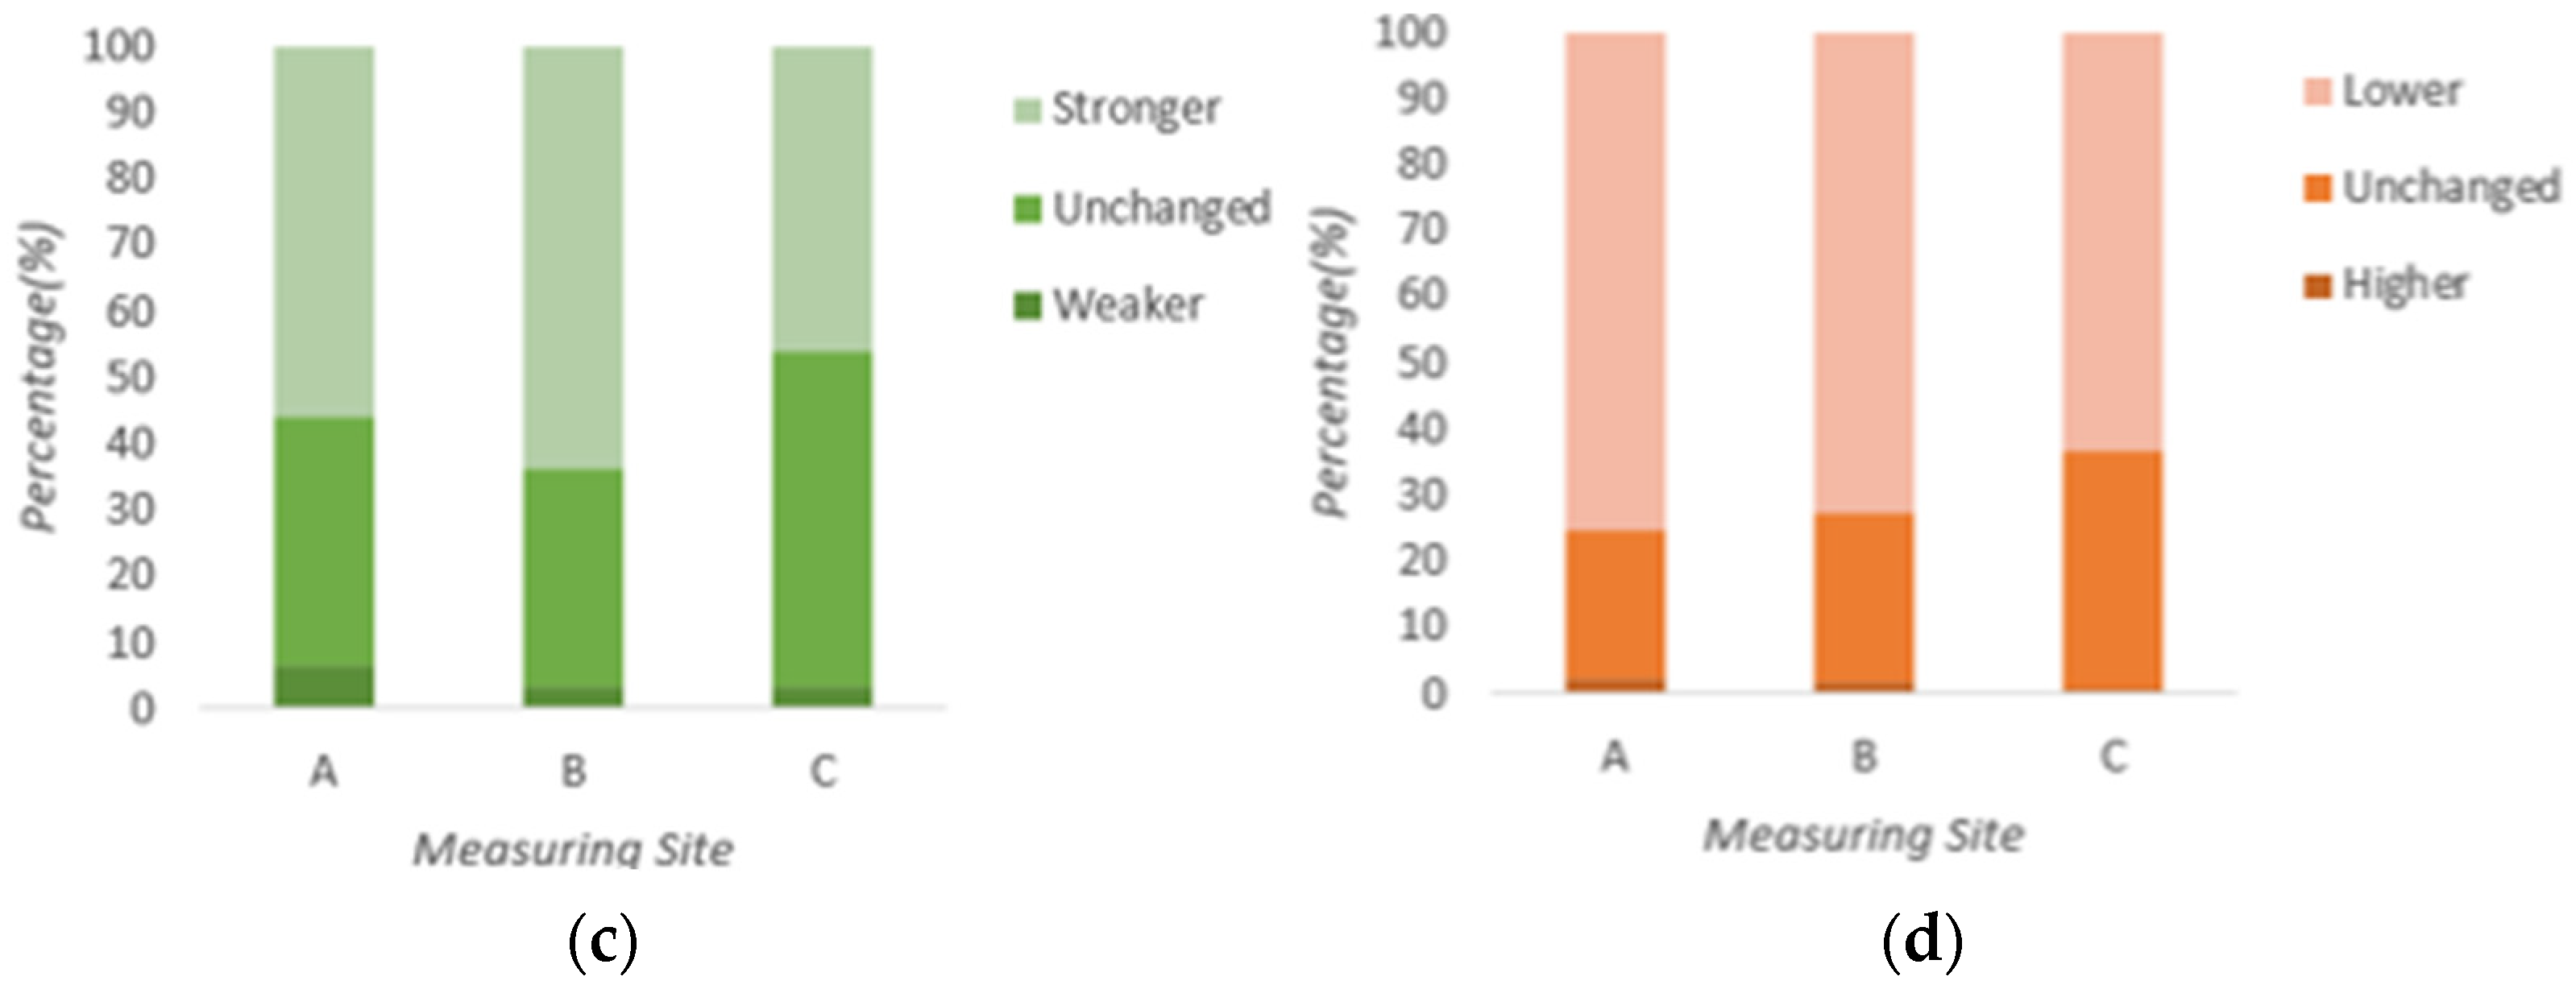
3.3.2. Meteorological Preferences Vote

Table 5 and Figure 4 show a majority of “lower = +1” on all sites, ranked as site C (78.9%) < site B (91.9%) < site A (92.3%). Site A had the highest vote of pedestrians who preferred the temperature to be “lower = +1”. While sites A and B had different results with a difference of 0.4%, site C had 78.9% votes for lower temperatures, and 20.8% votes for “unchanged = 0”, which were significantly higher than the other two sites. The relationship between Ta preference and TSV was similar, but the ranking was not similar. The v has a direct relation to thermal sensation vote, where the stronger wind was preferred on lower TSV sites. The v preference of “stronger = +1” was ranked as site C (46.1%) < site A (56%) < site B (63.5%). Solar radiation preference of “lower = +1” was ranked as site A (75.1%) > site B (72.4%) > site C (63.1%), which was similar to the measurement results. RH preference between sites was slightly different, as the human body was not sensitive to changes in humidity.
In conclusion, both Ta and solar radiation of Ximen in summer were extreme. Site C had the highest percentage of “unchanged = 0” in Ta, solar radiation, and v preferences compared to the other three sites. RH showed no significant correlation to thermal comfort. Lower solar radiation and Ta improved thermal comfort, but in a situation where Ta and radiation were slightly different, wind speed showed a more direct correlation to thermal comfort.

3.3.3. Overall Thermal Comfort (OTC)

OTC was used to evaluate TSV and the meteorological preference votes’ correlation to thermal comfort. The majority of votes in sites A and B were “uncomfortable = −1” (A = 56.7%, B = 61.5%). Site C had the highest thermal comfort, where the majority of pedestrians voted “neutral = 0” (44.3%). OTC was ranked as site C > site A > site B. The result correlated with TSV results, which was also consistent with wind speed preferences.

3.4. Thermal Comfort Indices

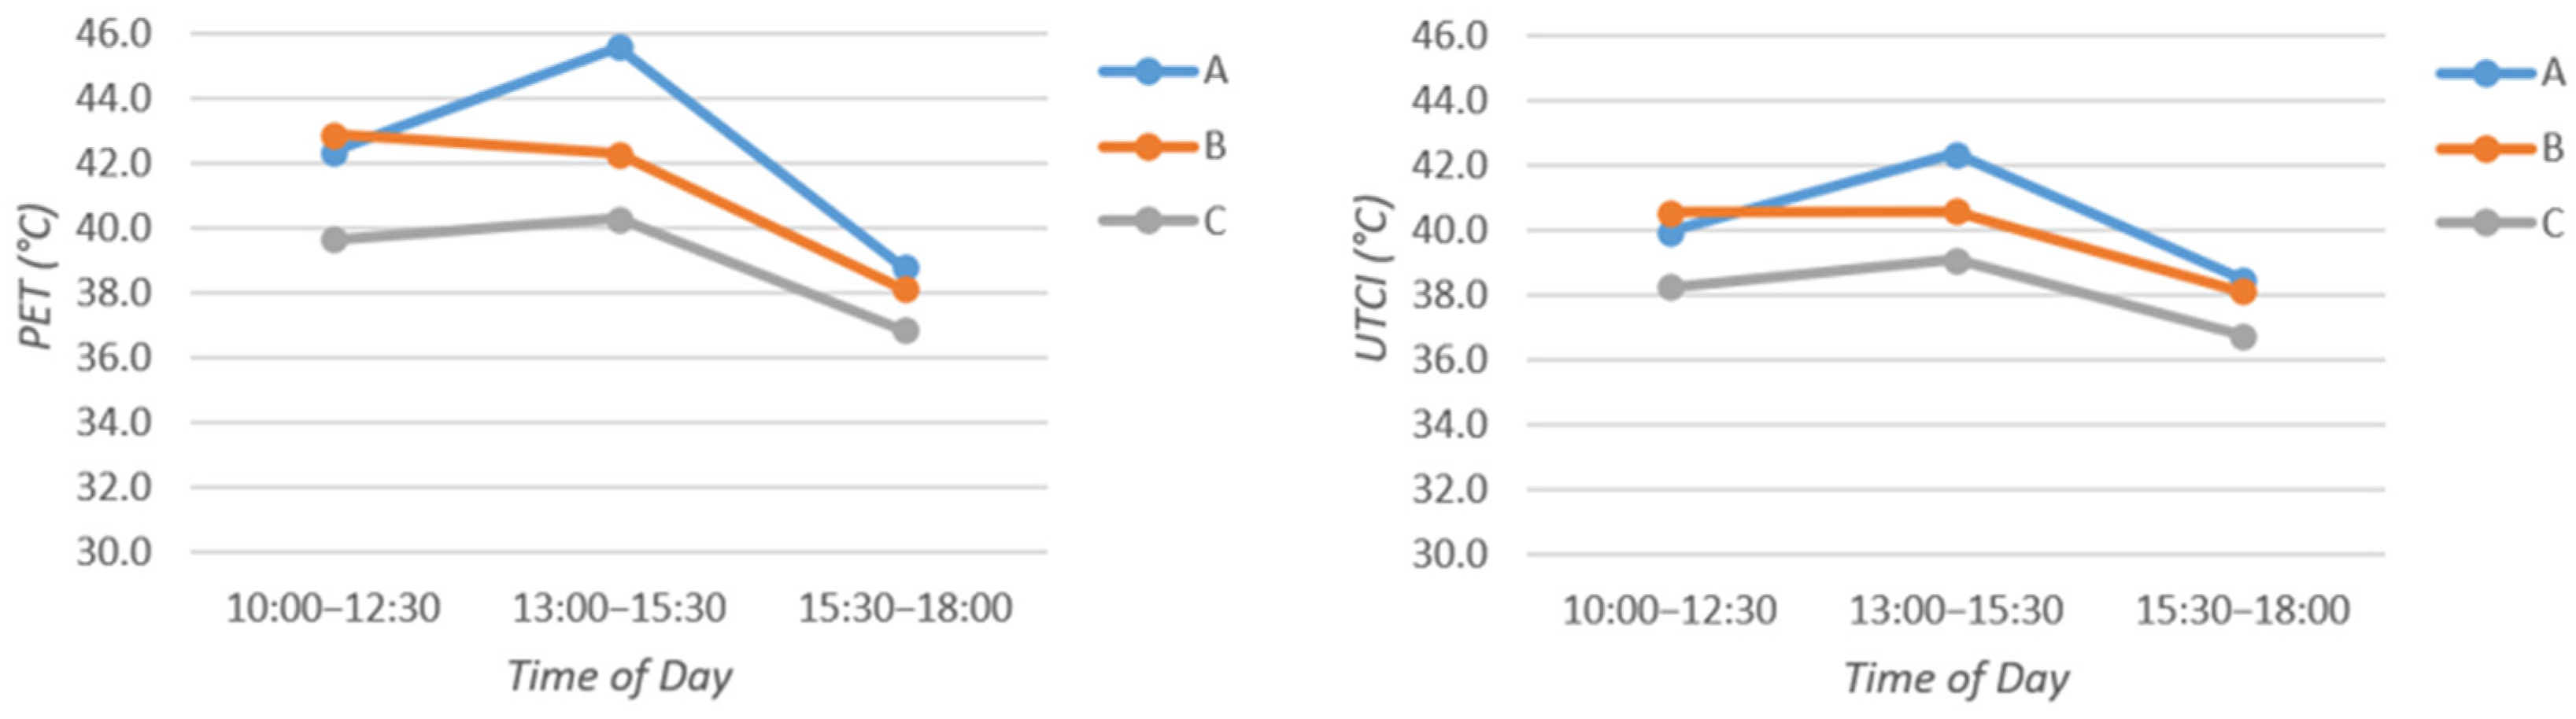
3.4.1. PET and UTCI Assessments

Meteorological data combined with average clothing insulation and metabolic rates on each site were used to calculate PET and UTCI. Thermal indices calculations were conducted in three periods to analyze the meteorological data and its impact on thermal indices (Table 6). Tmrt was the highest on every period at site A, because A had the largest street area and the most sun exposure. In the period “10:00–12:30”, both PET and UTCI in site B presented the most uncomfortable site. The ranking of PET and UTCI was site B < site A < site C, with C being the most comfortable site. As can be seen in Figure 5, during “13:00–15:30” and “15:30–18:00”, site C remained the most comfortable, and site A was the most uncomfortable site. The difference between PET and UTCI during “15:30–18:00” was small. During “13:00–15:30”, site A was significantly more uncomfortable than B due to the direct sun exposure and high Tmrt. PET was more sensitive to heat when the Tmrt level was high, and PET had a narrow range compared to UTCI. On average, PET was higher than expected from UTCI. Sites A and B were “very hot” from 10:00 to 15:30, and “hot” from 15:30 to 18:00. The result was consistent with TSV and OTC, where C was the most comfortable site, being “hot” from 10:00–15:30, and “warm” from 15:30–18:00. The TSV and OTC showed that site B had the most votes of “uncomfortable”. This proved that air temperature and mean radiant temperature had a bigger influence on thermal indices, but subjective thermal comfort in this study was affected by wind speed.
In summary, the result showed that PET was more sensitive to thermal and radiation changes than UTCI. In this study, PET was defined to be at three levels; “warm”, “hot”, and “very hot”, while UTCI had two levels of “strong heat stress” and “very strong heat stress”. PET and UTCI showed that the thermal environment in the Ximen area in summer was extreme.

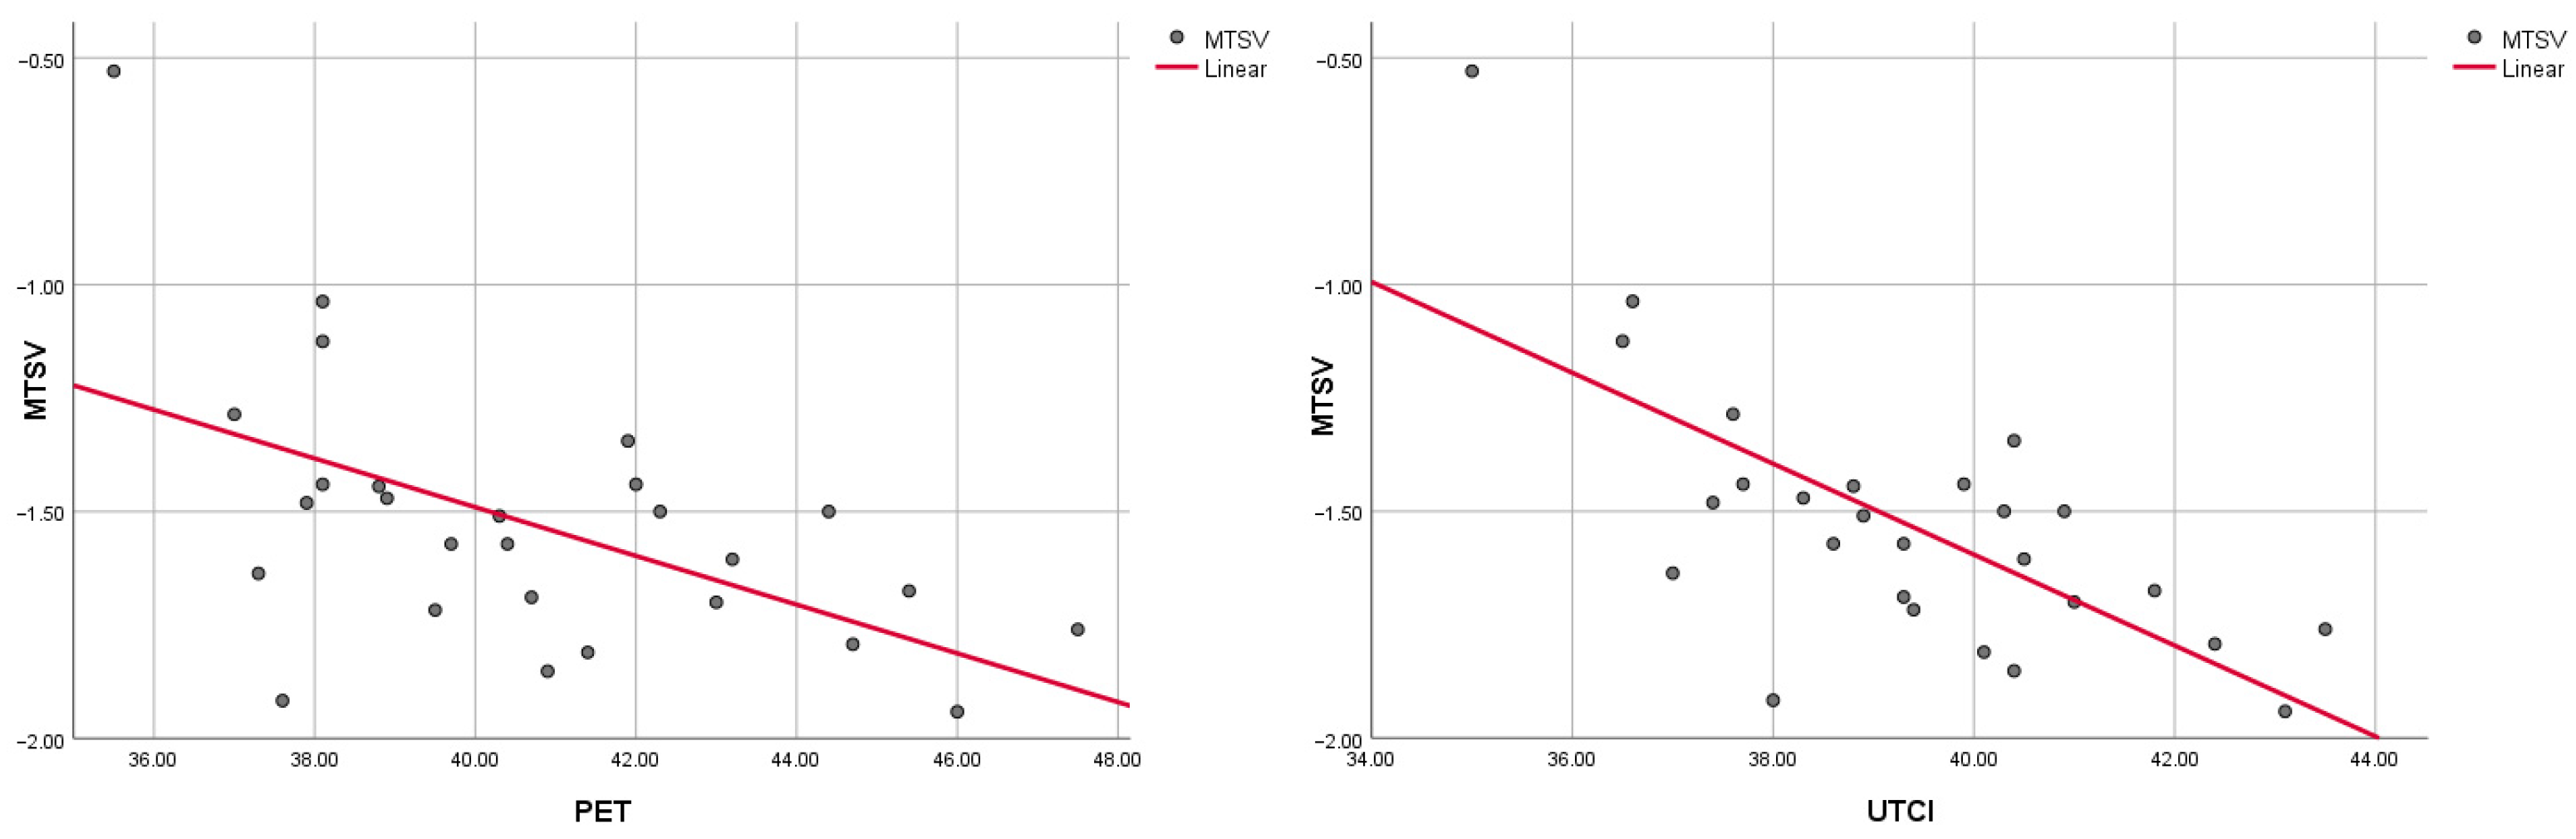
3.4.2. Linear Regression Analysis

The relationship between thermal indices and questionnaire results was calculated and analyzed using the linear regression analysis method to identify which thermal index has more impact on subjective thermal sensation. Mean thermal sensation votes on each site were obtained through TSV data from the questionnaire, ranging from −2 (hot) to +2 (cold), which were defined as the dependent variable of the analysis. To achieve higher accuracy in the analysis, data from three days of surveys were calculated separately, with each day consisting of three different times of day on each site, resulting in 27 cases of data. PET and UTCI values of each site at the same time of day were calculated and defined as the independent variable (see Figure 6).
The coefficient of determination (defined as R-squared) is used to determine which of the thermal indices fit the subjective TSV data. Linear regression of PET and MTSV has an R-squared value of 0.307, while that of UTCI and MTSV has an R-squared value of 0.486. Thus, by comparing the relationship between TSV and thermal indices, UTCI has a higher significance of linear regression, which was shown by a higher R-squared value of 0.486, which determines UTCI to be more suitable for outdoor thermal comfort evaluation in this study.

4. Conclusions

Three different urban density areas were investigated to explore the relationship between urban density and outdoor thermal comfort. The H/W ratio and SVF were used to determine different urban densities. Through meteorological measurement and questionnaire surveys, PET and UTCI were calculated, and questionnaire data were analyzed to determine which site has the highest comfort level.
Urban densities affected the pedestrian thermal environment. Different H/W ratios and SVFs had different impacts on pedestrian thermal comfort. In this study, site C (H/W = 6.88, SVF = 0.11) showed the best thermal comfort in summer. The questionnaire survey result showed that the thermal comfort ranking of the three sites was site C > site A > site B, with B being the most uncomfortable site. Thermal comfort ranking was dependent on wind speed, as wind speed had a bigger influence on subjective thermal comfort in this study, while relative humidity had the least influence on thermal comfort. PET and UTCI showed that the thermal environment in Ximen during the summer season was extreme. Mean radiant temperature had a higher influence on both PET and UTCI than wind speed. PET was more sensitive in extreme heat, and UTCI had a wider range than PET. Both PET and UTCI showed that site C had the highest thermal comfort level. UTCI had a higher significance towards the subjective thermal sensation vote result. Considering the calculation result of PET and UTCI, further study is required to understand the difference between the two.
Although site A had the highest solar radiation and Tmrt, site B had the highest mean air temperature. This was because site A had a wider street width and lower buildings, which caused sun exposure to be the highest, but stronger wind ventilated the pedestrian. Site B had a higher average building height, but was not tall enough that sun could penetrate the street. On the other hand, wind speed in site B was the lowest of all three sites, causing the mean air temperature to be the hottest. Site C showed the highest thermal comfort because tall buildings provided shading and stronger wind around the corners. Urban ventilation was an important factor for outdoor thermal comfort. The findings of this study provide a technical benchmark for urban planners, especially in hot summer areas, such as Taiwan, to mitigate the effects of climate change and global warming that cause extreme outdoor thermal environments for urban residents, and to create a healthier outdoor environment.

Author Contributions

Conceptualization, Y.-M.S. and J.A.; methodology, J.A.; site survey, J.A.; writing—original draft preparation, J.A.; writing—review and editing, Y.-M.S.; supervision, Y.-M.S. All authors have read and agreed to the published version of the manuscript.

Funding

This research was funded by The Ministry of Science and Technology of Taiwan, R.O.C (Project number: 110-2221-E-027-013-MY2) and the Research Center of Energy Conservation for New Generation of Residential, Commercial, and Industrial Sectors.

Institutional Review Board Statement

Not applicable.

Informed Consent Statement

Informed consent was obtained from all subjects involved in the study.

Data Availability Statement

Not applicable.

Conflicts of Interest

The authors declare no conflict of interest.

References

  1. Hakim, A.A.; Petrovitch, H.; Burchfiel, C.M.; Ross, G.W.; Rodriguez, B.L.; White, L.R.; Yano, K.; Curb, J.D.; Abbott, R.D. Effects of Walking on Mortality among Nonsmoking Retired Men. N. Engl. J. Med. 1998, 338, 94–99. [Google Scholar] [CrossRef] [PubMed]
  2. Hass-Klau, C. Impact of pedestrianization and traffic calming on retailing: A review of the evidence from Germany. Transp. Policy 1993, 1, 21–31. [Google Scholar] [CrossRef]
  3. Jacobs, J. The Death and Life of Great American Cities; Penguin: Harmondsworth, UK, 1961. [Google Scholar]
  4. Kaplan, R.B.A.; Whyte, W.H. City: Rediscovering the Center. J. Arch. Educ. 1991, 44, 241. [Google Scholar] [CrossRef]
  5. Takano, T.; Nakamura, K.; Watanabe, M. Urban residential environments and senior citizens’ longevity in megacity areas: The importance of walkable green spaces. J. Epidemiol. Community Health 2002, 56, 913–918. [Google Scholar] [CrossRef] [Green Version]
  6. Liu, L.; Lin, Y.; Liu, J.; Wang, L.; Wang, D.; Shui, T.; Chen, X.; Wu, Q. Analysis of local-scale urban heat island charac-teristics using an integrated method of mobile measurement and GIS-based spatial interpolation. Build. Environ. 2017, 117, 191–207. [Google Scholar] [CrossRef]
  7. Xiong, J.; Lian, Z.; Zhou, X. Investigation of Subjectively Assessed Health Symptoms and Human Thermal Perceptions in Transient Thermal Environments. Procedia Eng. 2015, 121, 212–216. [Google Scholar] [CrossRef] [Green Version]
  8. Wang, Y.; Wang, A.; Zhai, J.; Tao, H.; Jiang, T.; Su, B.; Yang, J.; Wang, G.; Liu, Q.; Gao, C.; et al. Tens of thousands additional deaths annually in cities of China between 1.5 °C and 2.0 °C warming. Nat. Commun. 2019, 10, 3376–3377. [Google Scholar] [CrossRef] [Green Version]
  9. Zhang, L.; Wei, D.; Hou, Y.; Du, J.; Liu, Z.; Zhang, G.; Shi, L. Outdoor Thermal Comfort of Urban Park—A Case Study. Sustainability 2020, 12, 1961. [Google Scholar] [CrossRef] [Green Version]
  10. Huang, J.; Zhou, C.; Zhuo, Y.; Xu, L.; Jiang, Y. Outdoor thermal environments and activities in open space: An experiment study in humid subtropical climates. Build. Environ. 2016, 103, 238–249. [Google Scholar] [CrossRef] [Green Version]
  11. Cheung, P.K.; Jim, C. Comparing the cooling effects of a tree and a concrete shelter using PET and UTCI. Build. Environ. 2018, 130, 49–61. [Google Scholar] [CrossRef]
  12. Hu, T.; Yoshie, R. Effect of atmospheric stability on air pollutant concentration and its generalization for real and idealized urban block models based on field observation data and wind tunnel experiments. J. Wind. Eng. Ind. Aerodyn. 2020, 207, 104380. [Google Scholar] [CrossRef]
  13. Lai, D.; Liu, W.; Gan, T.; Liu, K.; Chen, Q. A review of mitigating strategies to improve the thermal environment and thermal comfort in urban outdoor spaces. Sci. Total Environ. 2019, 661, 337–353. [Google Scholar] [CrossRef] [PubMed]
  14. Wang, Y.; Akbari, H. Effect of Sky View Factor on Outdoor Temperature and Comfort in Montreal. Environ. Eng. Sci. 2014, 31, 272–287. [Google Scholar] [CrossRef]
  15. Berardi, U.; Wang, Y. The Effect of a Denser City over the Urban Microclimate: The Case of Toronto. Sustainability 2016, 8, 822. [Google Scholar] [CrossRef]
  16. Johansson, E. Influence of urban geometry on outdoor thermal comfort in a hot dry climate: A study in Fez, Morocco. Build. Environ. 2006, 41, 1326–1338. [Google Scholar] [CrossRef]
  17. Kakon, A.N.; Mishima, N.; Kojima, S. Simulation of the urban thermal comfort in a high density tropical city: Analysis of the proposed urban construction rules for Dhaka, Bangladesh. In Building Simulation; Springer: Berlin, Germany, 2009; Volume 2, pp. 291–305. [Google Scholar]
  18. Shih, W.-M.; Lin, T.-P.; Tan, N.-X.; Liu, M.-H. Long-term perceptions of outdoor thermal environments in an elementary school in a hot-humid climate. Int. J. Biometeorol. 2017, 61, 1657–1666. [Google Scholar] [CrossRef]
  19. Krüger, E.L.; Minella, F.O.; Rasia, F. Impact of urban geometry on outdoor thermal comfort and air quality from field measurements in Curitiba, Brazil. Build. Environ. 2011, 46, 621–634. [Google Scholar] [CrossRef]
  20. Mahmoud, A.H.A. Analysis of the microclimatic and human comfort conditions in an urban park in hot and arid regions. Build. Environ. 2011, 46, 2641–2656. [Google Scholar] [CrossRef]
  21. Matzarakis, A.; Rutz, F.; Mayer, H. Modelling radiation fluxes in simple and complex environments—Application of the RayMan model. Int. J. Biometeorol. 2007, 51, 323–334. [Google Scholar] [CrossRef]
  22. Matzarakis, A.; Rutz, F.; Mayer, H. Modelling radiation fluxes in simple and complex environments: Basics of the RayMan model. Int. J. Biometeorol. 2010, 54, 131–139. [Google Scholar] [CrossRef] [Green Version]
  23. Solovchenko, A.; Lukyanov, A.; Nikolenko, A.; Shurygin, B.; Akimov, M.; Gitelson, A. Physiological foundations of spectral imaging-based monitoring of apple fruit ripening. Acta Hortic. 2021, 1314, 419–428. [Google Scholar] [CrossRef]
  24. Matzarakis, A.; Gangwisch, M.; Fröhlich, D. RayMan and SkyHelios Model. Urban Microclim. Model. Comf. Energy Stud. 2021, 2021, 339–361. [Google Scholar] [CrossRef]
  25. Fröhlich, D.; Gangwisch, M.; Matzarakis, A. Effect of radiation and wind on thermal comfort in urban environ-ments—Application of the RayMan and SkyHelios model. Urban Clim. 2019, 27, 1–7. [Google Scholar] [CrossRef]
Figure 1. Location of Wanhua District.
Engproc 38 00077 g001
Figure 2. Location of the three experiment sites in Ximen.
Engproc 38 00077 g002
Figure 3. TSV (left) and OTC (right) on three different sites.
Engproc 38 00077 g003
Figure 4. Preference votes on three different sites: (a) Ta, (b) RH, (c) v, (d) Solar radiation.
Engproc 38 00077 g004aEngproc 38 00077 g004b
Figure 5. Comparison of PET (left) and UTCI (right) throughout the day.
Engproc 38 00077 g005
Figure 6. Correlation between TSV and PET (left) and UTCI (right).
Engproc 38 00077 g006
Table 1. SVF and H/W Ratio of three different sites.
Site A
(Low Density)
Site B
(Medium Density)
Site C
(High Density)
Engproc 38 00077 i001Engproc 38 00077 i002Engproc 38 00077 i003
SVF = 0.287SVF = 0.140SVF = 0.114
H/W = 1.3H/W = 2.75H/W = 6.88
Table 2. Meteorological measurement results.
SiteSVFTg (°C)Ta (°C)RH (%)v (m/s)
MeanMax.Min.MeanMax.Min.MeanMax.Min.MeanMax.Min.
A0.28737.942.334.436.539.533.047.156.140.90.93.80.1
B0.1437.240.033.836.739.534.445.753.039.90.72.60.1
C0.11436.143.132.535.738.233.147.757.141.11.55.80.2
Table 3. Summary of the interview data.
SiteGenderNo. of
Subjects
Avg.
Clothing (clo)
Avg.
Metabolism (met)
AM2084570.282.03
F249
BM1783840.282.11
F206
CM1553360.292.06
F181
Table 4. Age groups of interviewees.
Age Range<1213–1819–3031–4041–5051–6061–6565<Total
No. of Subjects3316353912311110041671177
Percentage (%)2.813.845.810.59.48.53.55.7100.0
Table 5. Summary of interview responses.
No.QuestionVariableOptionStatistics and Percentage
ABC
1How do you feel?TSVHot = −234475.3%31582.0%20460.7%
Warm = −15512.0%307.8%5315.8%
Neutral = 04910.7%348.9%5315.8%
Cool = +192.0%51.3%267.7%
Cold = +200.0%00.0%00.0%
2How would you prefer
the air temperature to be?
Ta
preference
Higher = −120.4%00.0%10.3%
Unchanged = 0337.2%318.1%7020.8%
Lower = +142292.3%35391.9%26578.9%
3How would you prefer
the relative humidity to be?
RH
preference
Higher = −1255.5%277.0%92.7%
Unchanged = 019943.5%14638.0%13139.0%
Lower = +123351.0%21155.0%19658.3%
4How would you prefer
the wind speed to be?
v
preference
Weaker = −1306.6%143.7%123.6%
Unchanged = 017137.4%12632.8%16950.3%
Stronger = +125656.0%24463.5%15546.1%
5How would you prefer
the solar radiation to be?
Sun
exposure
preference
Higher = −1112.4%71.8%30.9%
Unchanged = 010322.5%9925.8%12136.0%
Lower = +134375.1%27872.4%21263.1%
6How is your overall
thermal comfort?
Thermal
Comfort
Uncomfortable = −125956.7%23661.5%13038.7%
Neutral = 017838.9%13535.1%14944.3%
Comfortable = +1204.4%133.4%5717.0%
Table 6. Summary of Tmrt, PET, and UTCI.
Site10:00−12:3013:00−15:3015:30−18:00Average
TmrtPETUTCITmrtPETUTCITmrtPETUTCITmrtPETUTCI
A47.942.439.950.745.642.439.738.838.546.142.240.3
B46.842.940.645.242.340.638.838.138.143.641.139.8
C44.739.738.344.040.339.138.036.936.842.338.938.0
Disclaimer/Publisher’s Note: The statements, opinions and data contained in all publications are solely those of the individual author(s) and contributor(s) and not of MDPI and/or the editor(s). MDPI and/or the editor(s) disclaim responsibility for any injury to people or property resulting from any ideas, methods, instructions or products referred to in the content.

