Proceeding Paper

Visual State Estimation for False Data Injection Detection of Solar Power Generation †

by
Byron Alejandro Acuña Acurio
1,*,‡,
Diana Estefanía Chérrez Barragán
1,‡,
Juan Camilo López
2,‡,
Felipe Grijalva
3,‡,
Juan Carlos Rodríguez
4,‡,§ and
Luiz Carlos Pereira da Silva
1,‡
1
Faculdade de Engenharia Elétrica e de Computação (FEEC), Universidade Estadual de Campinas (UNICAMP), Campinas 13083-852, SP, Brazil
2
Department of Electrical Engineering, Mathematics and Computer Science (EEMCS), University of Twente, 7522 Enschede, Overijssel, The Netherlands
3
Colegio de Ciencias e Ingenierías ”El Politécnico”, Universidad San Francisco de Quito USFQ, Quito 170157, Ecuador
4
Analog Devices Inc., Wilmington, MA 01887, USA
*
Author to whom correspondence should be addressed.
Presented at the XXXI Conference on Electrical and Electronic Engineering, Quito, Ecuador, 29 November–1 December 2023.
These authors contributed equally to this work.
§
The opinions expressed in this publication are those of the authors. They do not purport to reflect the opinions or views of the ADI, its subsidiaries or employees.
Eng. Proc. 2023, 47(1), 5; https://doi.org/10.3390/engproc2023047005
Published: 4 December 2023
(This article belongs to the Proceedings of XXXI Conference on Electrical and Electronic Engineering)

Abstract

:
As the penetration level of solar power generation increases in smart cities and microgrids, an automatic energy management system (EMS) without human supervision is most communly deployed. Therefore, assuring safe and reliable data against cyber attacks such as false data injection attacks (FDIAs) has become of utmost importance. To address the aforementioned problem, this paper proposes detecting FDIAs considering visual data. The aim of visual state estimation is to enhance the resilience and security of renewable energy systems. This approach provides an additional layer of defense against cyber attacks, ensuring the integrity and reliability of solar power generation data and facilitating the efficient and secure operation of EMS. The proposed approach uses a modified VGG-16 neural network model to obtain an intermediate representation that provides textual and numerical explanations about the visual weather conditions from sky images. Numerical results and simulations corroborate the validity of our proposed approach. The performance of the modified VGG-16 neural network model is also compared with previous state-of-the-art machine learning models in terms of accuracy.

1. Introduction

False data injection attacks (FDIAs), such as data poisoning or noise injection, can significantly affect the decision-making process of energy management system (EMS) applications, for instance, voltage regulation [1]. FDIAs are destructive to EMS [2], because the attacker can manipulate the meter readings by injecting additional false data, causing system instability [3] and even cascading failures leading to massive blackouts [4]. Therefore, various methodologies have been developed over the past decade to defend against such attacks. The existing methodologies can be divided into (i) protection-based and (ii) detection-based approaches [5]. The protection-based approaches [6,7] are based on protecting specific sensors, but these methods have two drawbacks: (i) protecting data will reduce the amount of measured data, and (ii) the protection mechanism can not ensure that the data are always safe. On the other hand, FDIA detection methods traditionally were model-driven approaches. In [8], the authors proposed a method based on Kalman filters to detect FDIA in power grids. A multiobjective optimal detection scheme based on the parity method was proposed in [9], which only applies to DC microgrids but has poor adaptability to the current mainstream AC power grid. Although high detection accuracy is shown when tested on traditional power grid scenarios (without renewable energy resources), the literature does not answer whether the existing detection methods can be applied to microgrids with a high share of solar power generation plants. To the best of the authors’ knowledge, the present work is the first attempt to apply computer vision techniques to the FDIA detection problem. However, for a detailed survey of FDIA detection strategies, the reader is referred to [10].
The fundamental problem in FDIA detection methods is to identify tampered measurement z a reported from a smart metering system, which can be expressed as:
z a = z + a .
In this case, a is a nonzero attack value added to the true measurement z of the solar power generation system. Facing this problem, this paper proposes an FDIA detection approach for solar power generation based on image processing of visual weather conditions using convolutional neural networks and transfer learning. To do this, a VGG-16 architecture pretrained on the ImageNet dataset was used. This work expands the theoretical explanation of transfer learning techniques to facilitate reproducibility by newcomers to this field. The main contributions of this work are:
  • A novel deep learning architecture that can detect FDIA in solar power generation measurements based on sky images,
  • A detailed step-by-step process to perform transfer learning from an object classification domain to the FDIA detection domain in solar power generation.
The remainder of this paper is organized as follows. After this introduction, Section 2 explains each stage of the proposed methodology, step by step. In Section 3, the experimental setup is presented. Section 4 shows the numerical results. Finally, Section 5 presents the conclusions of this work.

2. Proposed Approach

This section describes the main components of our proposed method: (i) a transfer learning procedure using a modified VGG-16 convolutional neural network, (ii) an intermediate representation with a support vector regressor, and (iii) a binary hypothesis test.

2.1. Transfer Learning Procedure

The idea of transfer learning is to use a network previously trained with a large amount of data from a specific task and reuse it in a new task. In this case, a pretrained architecture named visual geometry group 16 (VGG-16) [11] was used as a starting point for our proposed FDAI approach. VGG-16 is a deep convolutional neural network (CNN) consisting of 16 layers with 1.2 million parameters. VGG-16 was initially pretrained using the ImageNet dataset that contains around 16 million images [11] to perform the classification task for 1000 different categories. In this work, the aforementioned VGG-16 architecture of the network was modified, discarding the fully connected and softmax blocks that are highlighted in red in Figure 1.
The convolutional and pooling layers shown in Figure 1 work as feature extractor layers; consequently, these layers have been frozen. The removed fully connected layers were replaced with the following layers in an ordered fashion: (i) a new batch normalization layer, (ii) a fully connected layer of 1024 neurons with a rectified linear unit (ReLU) as an activation function, (iii) a dropout layer with a rate set to 10% to avoid overfitting, and (iv) finally, a fully connected layer of 40 neurons with a sigmoid activation function. The original VGG-16 was trained to perform image classification (source domain D s ). A domain D is the subject that performs learning. It consists of two parts: data ( X , Y ) and the distribution P ( x , y ) that generates such data for any sample x i , y i in the available data x i X , y i Y , as follows D = { X , Y , P ( x , y ) } .
In this case, D s was obtained using the ImageNet dataset that contains around 16 million images X s and 1000 different categories Y s . With transfer learning, it is possible to use the aforementioned modified VGG-16 for a new target domain D t = x j , y j j = 1 N t . Hence, in order to retrain the pretrained VGG-16 from the source domain to the target domain, the “transient attribute dataset” ( X t , Y t ) publicly available in [12] was used.
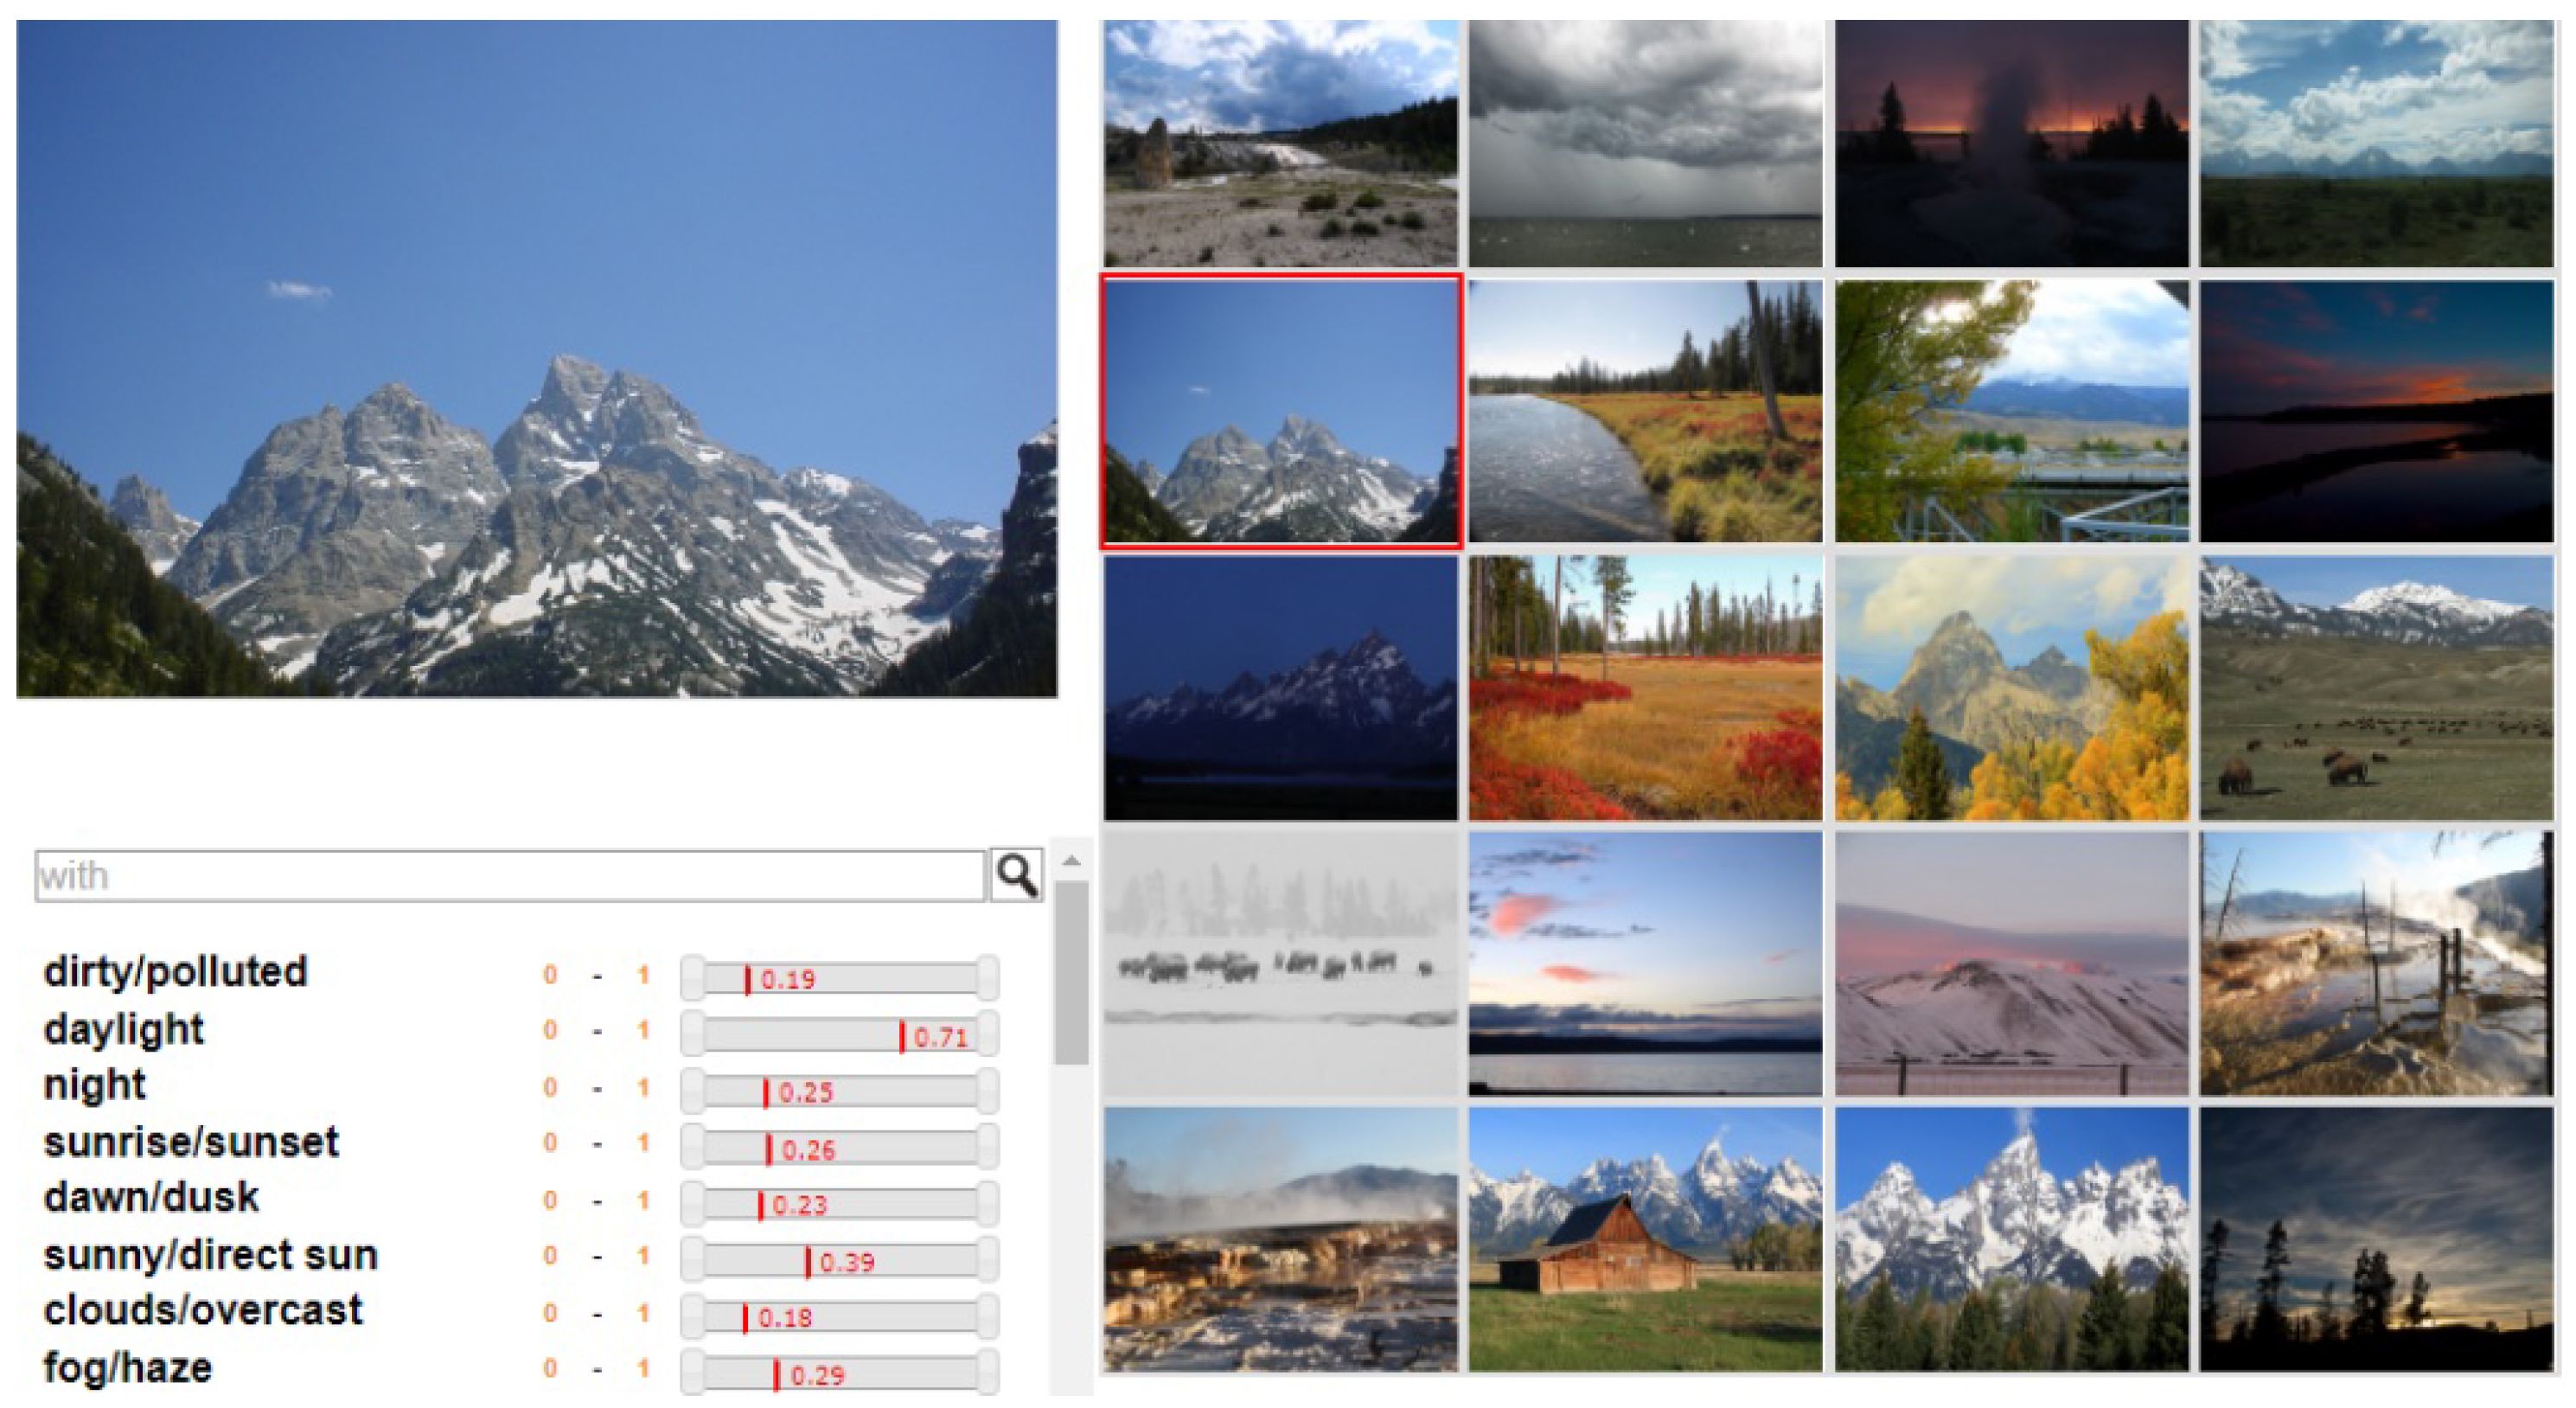
The transient attribute dataset ( X t , Y t ), has 8571 images X t from 101 webcams, all annotated with 40 attribute labels Y t of different types that contain values from 0 to 1. The 40 attributes are, for instance, lighting, the season of the year (winter, summer, etc.), weather (sunny, warm, cloudy, etc.), subjective impressions (beautiful, gloomy, soft, etc.), and some additional attributes such as dirty/polluted, busy, lush vegetation, etc. (see Figure 2 for some examples).
To perform the aforementioned transfer learning task, a finetuning of network weights was performed over all the layers of the modified VGG-16, since the images of the transient attribute dataset used for transfer learning are quite different from the ImageNet dataset used in the original VGG-16. In this work, the Adam optimization algorithm was used. Unlike the stochastic gradient descent (SGD), Adam can vary the learning rate throughout the training process to obtain a better performance model. The learning rate controls the variation of the network weights for each training epoch [13]. In this work, the initial learning rate at was set at 0.001. If there was no network performance improvement during the training epochs, the learning rate was modified to 0.0005. This adjustment aimed to facilitate improvements until the final stages of training when there was no progress concerning its validation through the mean absolute error (MAE) over 15 consecutive epochs. Finally, the training process was limited to a maximum of 250 epochs. Given that the target domain D t is a 40 multi-output regressor, where each output ranges from 0 to 1, in this work, it was found that the most suitable loss function for performing the transfer learning task was the mean absolute error (MAE).

2.2. Intermediate Representation

Depending on the season of year and weather conditions, the modified VGG-16 neural network that was fitted using the aforementioned transfer learning approach looks for very different points in the image, as shown in the heat maps of Figure 3.
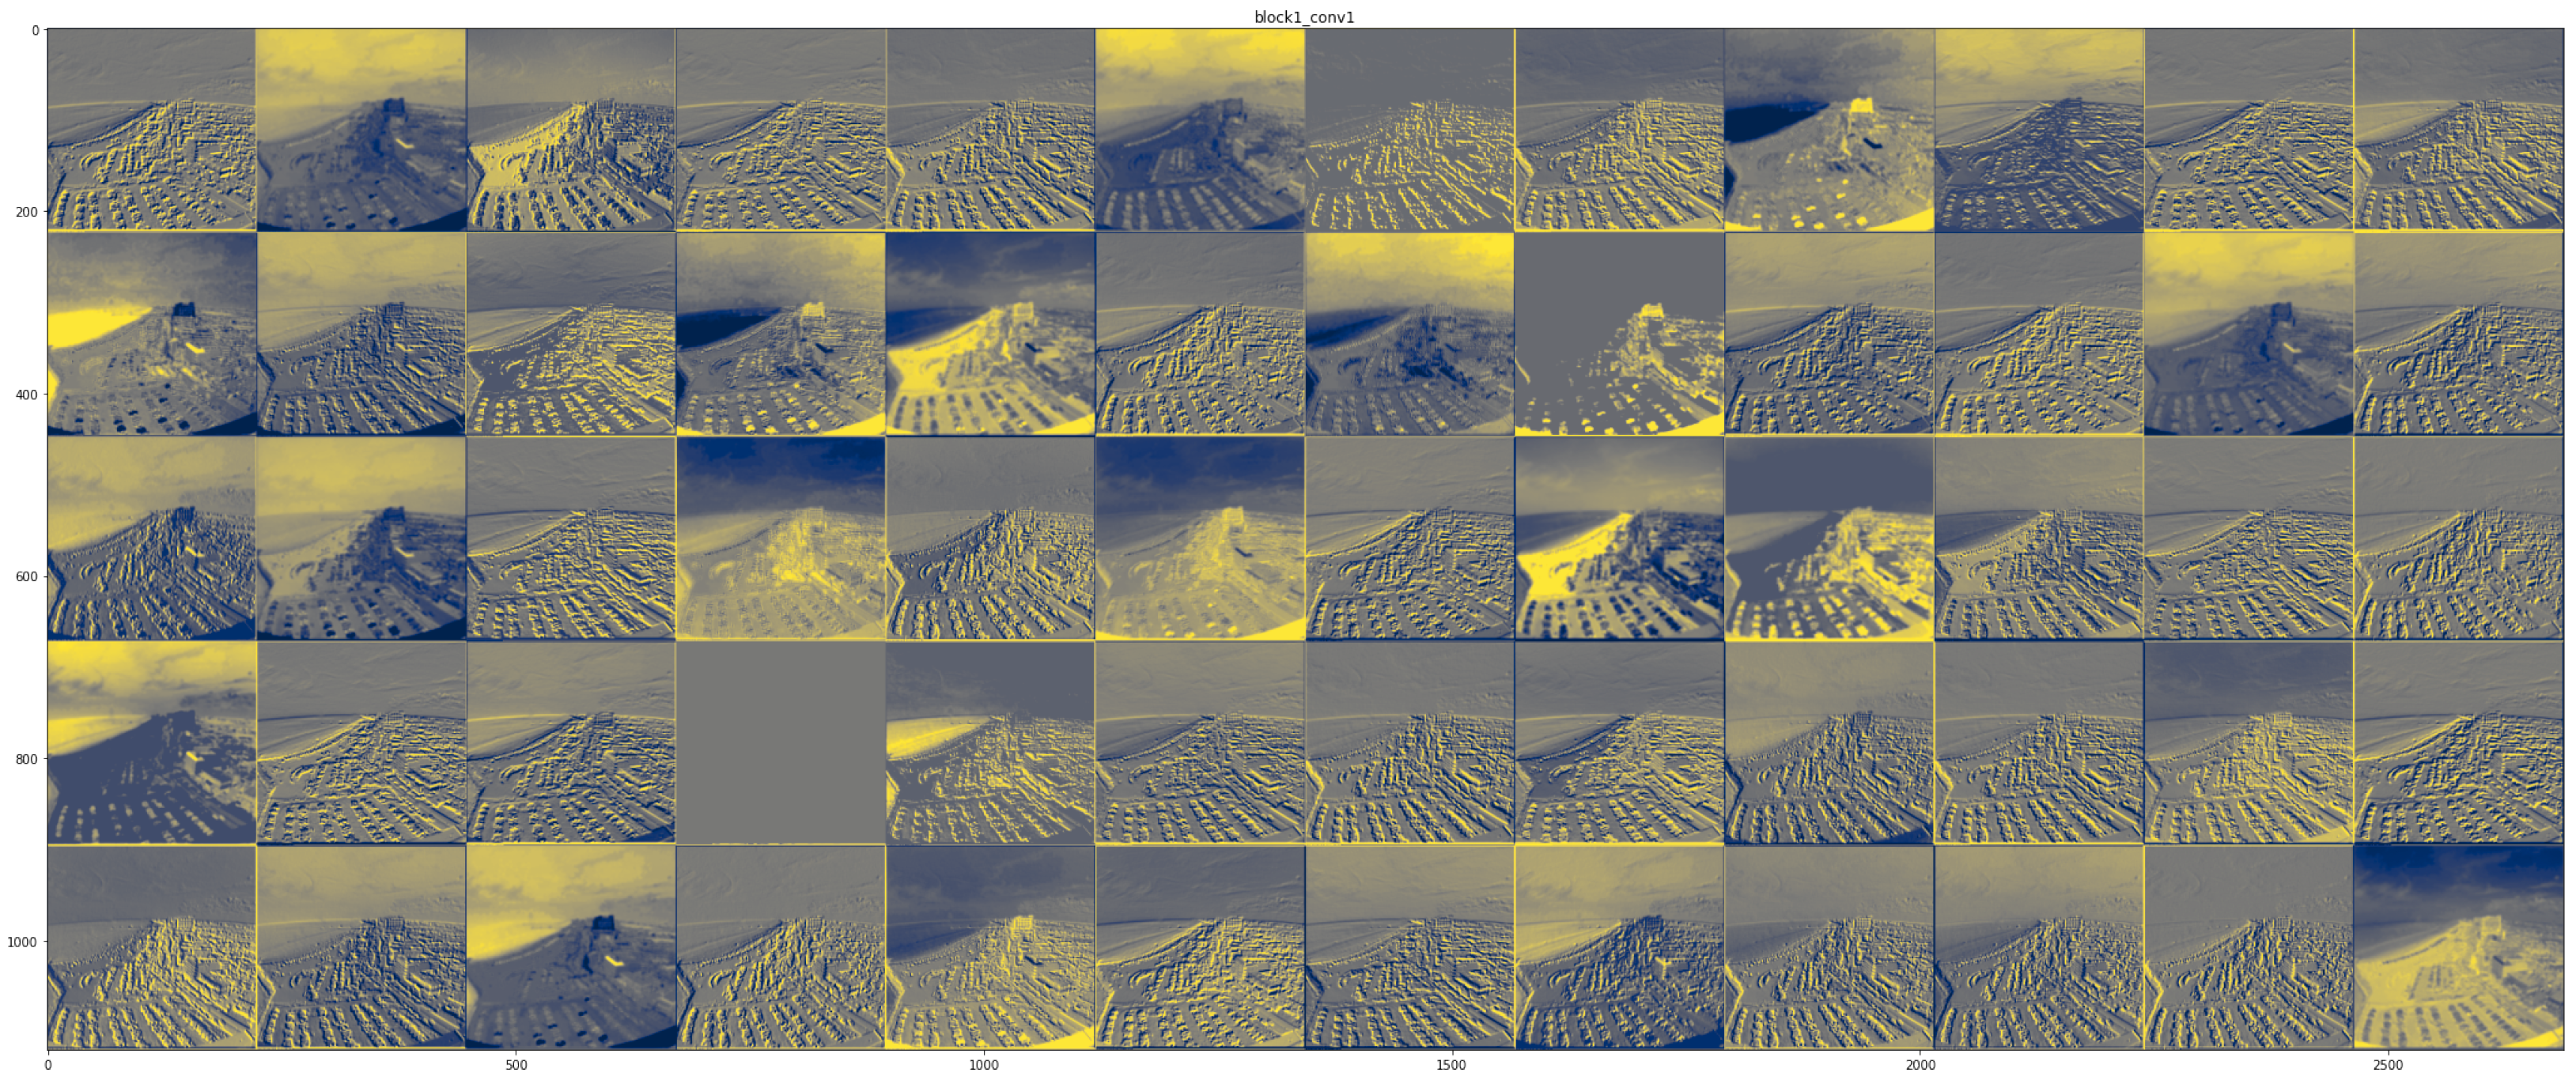
Therefore, the convolutional layers of the modified VGG-16 work as a feature extractor, as shown in Figure 4.
The output of the modified VGG-16 is 40 attributes, as shown in the correlation matrix in Figure 5.
This work used these 40 attributes as an intermediate representation to perform the state estimation of solar power generation. The intermediate representation captures a numerical description of the variability in weather conditions that are very distinctive over time. To do this, historical sky images collected from the same location as the solar power generation plant under different conditions over one month were used to create a new dataset D s k y of the historical intermediate representations X s k y and the historical solar power generation Y s k y . Then, a support vector regressor (SVR) with Radial Basis Function (RBF) kernel was trained using D s k y to receive the intermediate representation and return the most likely state of solar power generation. It was empirically observed that 500 sky images were enough to fit the SVR.

2.3. Binary Hypothesis Test

To detect a false data injection attack on solar power generation measurements, an inequality chi-square test χ 2 was employed. For this, an estimated chi-square value χ ^ 2 was computed using the observed values and estimates, as follows:
χ ^ 2 = i = 1 m O i E i 2 E i ,
where O represents the solar power generation measurements, E represents the estimated values of the solar power generation obtained from the SVR, and m is the number of measures over one day. To compute the chi-square probability distribution value χ 2 , the degrees of freedom k = m n were defined, where n is the state variable, in this case n = 1 . The estimated chi-square value χ ^ 2 was compared with the value of χ 2 for a given degree of freedom k and significance level α . The significance level α is the upper bound on the probability that a Type I error will occur after performing a hypothesis test. A Type I error occurs when the null hypothesis is correct but is rejected. In this work, a significance level of α = 0.03 was used, which indicates that there is a 3 % chance that there are erroneous data or a confidence level of 97 % . Consequently, the following chi-square test can be performed for the false data injection detection of solar power generation using visual state estimation:
  • If χ ^ 2 > = χ k , α 2 , false data injection attacks are suspected;
  • If χ ^ 2 < χ k , α 2 , false data injection attacks are not suspected.

3. Experimental Setup

Images captured by the webcams have different sizes, requiring a preprocessing step before using the aforementioned approach. Initially, all images were resized to dimensions of 200 × 200 with 3 color channels (RGB). Subsequently, for compatibility with the modified VGG16, the images were transformed into tensors of dimensions 200 × 200 × 3.
The transient attribute dataset [12] with 8571 images was used to perform the transfer learning stage, to finetune the modified VGG-16. The transient attribute dataset was divided between testing and training data according to the original paper [12], but a double-stratified k-fold cross-validation approach was used to validate the modified VGG-16 during the training stage. Under this approach, the entire training dataset was divided into k = 10 fold, one fold for validation and the remaining folds for training. This procedure allows us to obtain a more realistic idea of the performance of the model [13].
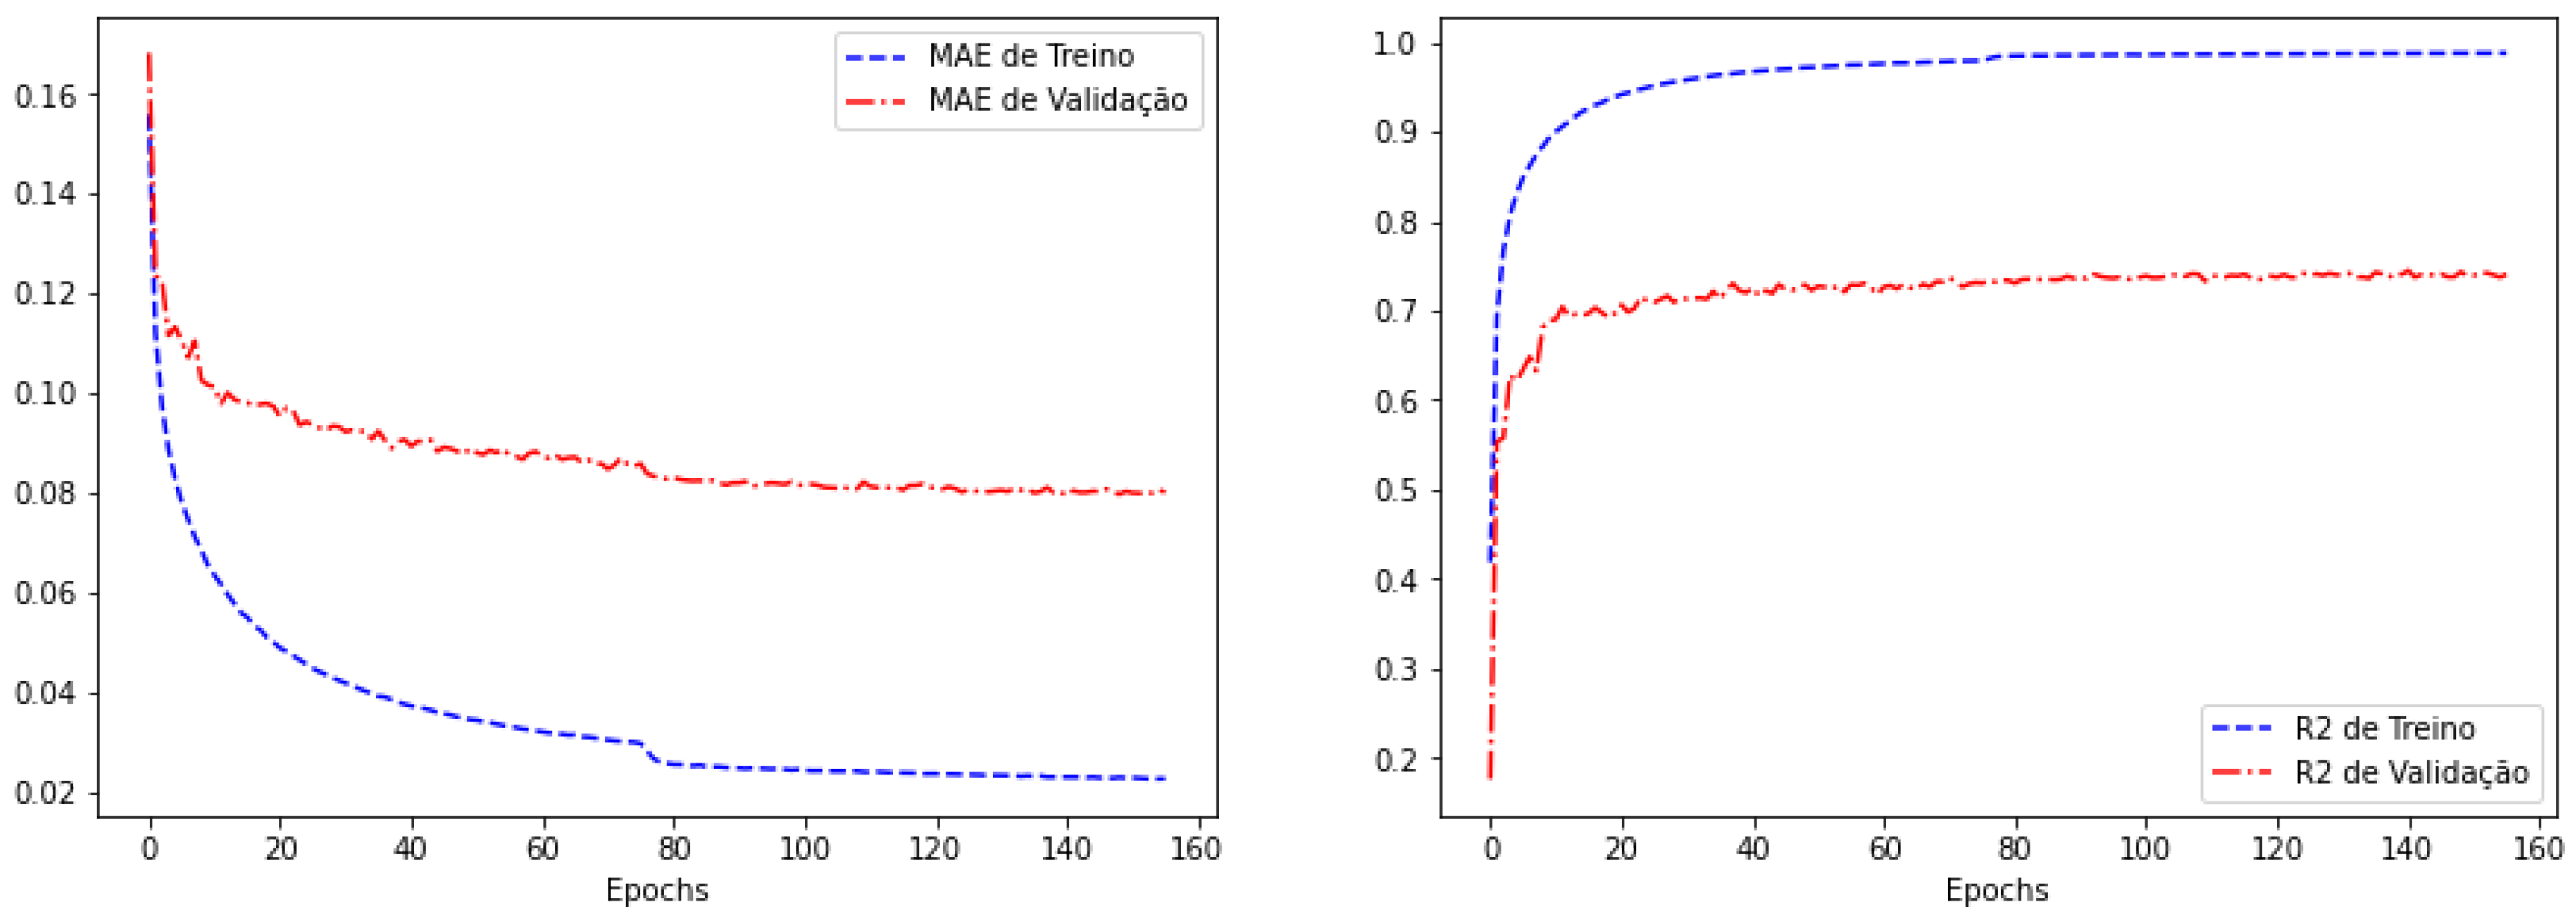
The modified VGG-16 neural network was trained with 250 epochs. However, empirically, it was observed that a good fit was obtained with only 25 epochs, as shown in the results section on the biases–variance curve, MAE metric, and R2 curve (see: Figure 6). Some data augmentation techniques were used in the finetuning stage of the modified VGG-16. The data augmentation stage aims to generate new images from the original ones. To achieve this goal, the original images were modified to generate new instances using the following set of transformations, which are:
  • Rotation range: This is the degree range for random rotations. In this study, a range between −5 and +5 degrees was used;
  • Width shift range: The original image is randomly shifted by a proportional percentage of the original image width. In this study, this parameter was set at 0.2, i.e., 20 % ;
  • Height shift range: This is similar to the previous transformation, but it uses the height of the image to perform the shift. In all the experiments, this parameter was set to 0.2, i.e., 20 % ;
  • Zoom range: This transformation generates a random zoom. In this work, a range between 90% and 110% of the original image was used;
  • Horizontal flip: This randomly flips the image horizontally;
  • Vertical flip: This randomly flips the image vertically;
  • Brightness range: This increases or decreases the brightness of the image. Hence, this parameter was set in a range between 0.9 and 1.1;
  • Fill mode: In all the experiments, the nearest approach fill mode was used, which fills points outside the boundaries of the image with similar information to that of the boundaries,
These transformations are applied to generate “on-demand” new images in the finetuning stage of the VGG-16.

Svr Training Details

For reproducibility purposes, the publicly available dataset of sky images in [14] was used to create the new dataset D s k y of historical intermediate representations X s k y and historical solar power generation Y s k y . This new dataset D s k y was employed to train the support vector regression model.

4. Results and Discussion

Our proposed modified VGG-16 was compared to similar previous work [12]. To ensure a fair comparison the proposed model was trained using the same dataset that was reported in [12]. The results of our model are presented in Table 1. Figure 6 shows the training and validation learning curves of our proposed modified VGG-16 neural network model. Both the training and validation loss curves decreased after the modified VGG-16 model training began. This can be attributed to the transfer learning, indicating that the convolutional layer of the modified VGG-16 already had a high level of feature extraction, because these layers were pretrained. Although occasional fluctuations can be observed in the training loss, it is clear that the overall trend is a continuous decrease in the mean absolute error (MAE) during training.
The results of the intermediate representation show that the best-performing approach was accomplished using the proposed modified VGG-16 neural network as shown in Table 1.
The results indicate that, inside the critical region, the estimated values and the groundtruth values using α = 0.03 , as suggested in Section 2.3 for false data injection detection, can be considered the same, as shown in Figure 7.

5. Conclusions

This work explores the false data injection detection in solar power generation from sky images, using a modified VGG-16 neural network to obtain an intermediate representation that can be used to estimate power generation with a support vector regressor. Results comparing the estimated values and the ground truth did not reveal a significant difference without a false data injection attack. A measurement discrepancy was detected when a data injection attack was performed in a random measurement. Our proposed approach overcomes the previous work [12] in terms of performance. The proposed approach is flexible and can be easily adapted to different solar power generation systems.

6. Future Works

As a future work, it could be interesting to study actions once a false data injection attack is detected; for instance, an appropriate mitigation strategy can be implemented. This might involve isolating the affected components, recalibrating sensors, restoring valid data from backups, or even triggering an automated response to neutralize the attack.

Author Contributions

Conceptualization, B.A.A.A. and D.E.C.B.; methodology, B.A.A.A.; software, D.E.C.B.; validation, L.C.P.d.S., J.C.L., F.G. and J.C.R.; formal analysis, D.E.C.B.; investigation, B.A.A.A.; resources, L.C.P.d.S.a; data curation, F.G. and J.C.R.; writing—original draft preparation, B.A.A.A.; writing—review and editing, D.E.C.B.; visualization, D.E.C.B.; supervision, J.C.L.; project administration, L.C.P.d.S.; funding acquisition, L.C.P.d.S. All authors have read and agreed to the published version of the manuscript.

Funding

This work has been supported by the following Brazilian Research Agencies: FAPESP, CAPES, CNPq, INEP, FINEP, etc. The authors are funded by the grant #2022/16881-5, #2020/03069-5, #2021/11380-5, and #2016/08645-9, Centro Paulista de Estudos da Transição Energética (CPTEn), São Paulo Research Foundation (FAPESP). This work was also developed under the Electricity Sector Research and Development Program PD-00063-3058/2019 - PA3058: "MERGE - Microgrids for Efficient, Reliable and Greener Energy", regulated by the National Electricity Agency (ANEEL in Portuguese), in partnership with CPFL Energia (Local Electricity Distributor). This work was also supported by the Universidad San Francisco de Quito through the Poli-Grants Program under Grant 17993.

Institutional Review Board Statement

Not applicable.

Informed Consent Statement

Not applicable.

Data Availability Statement

This work used sky images dataset publicly available in [14] and transient attribute database, which is publicly available in [12].

Conflicts of Interest

The authors declare no conflict of interest.

References

  1. Musleh, A.S.; Chen, G.; Dong, Z.Y. A survey on the detection algorithms for false data injection attacks in smart grids. IEEE Trans. Smart Grid 2019, 11, 2218–2234. [Google Scholar] [CrossRef]
  2. Tan, R.; Nguyen, H.H.; Foo, E.Y.; Yau, D.K.; Kalbarczyk, Z.; Iyer, R.K.; Gooi, H.B. Modeling and mitigating impact of false data injection attacks on automatic generation control. IEEE Trans. Inf. Forensics Secur. 2017, 12, 1609–1624. [Google Scholar] [CrossRef]
  3. Acurio, B.A.A.; Barragán, D.E.C.; Amezquita, J.C.L.; Rider, M.J.; Da Silva, L.C.P. Design and Implementation of a Machine Learning State Estimation Model for Unobservable Microgrids. IEEE Access 2022, 10, 123387–123398. [Google Scholar] [CrossRef]
  4. Ameli, A.; Hooshyar, A.; El-Saadany, E.F.; Youssef, A.M. Attack detection and identification for automatic generation control systems. IEEE Trans. Power Syst. 2018, 33, 4760–4774. [Google Scholar] [CrossRef]
  5. Chaojun, G.; Jirutitijaroen, P.; Motani, M. Detecting false data injection attacks in AC state estimation. IEEE Trans. Smart Grid 2015, 6, 2476–2483. [Google Scholar] [CrossRef]
  6. Yang, Q.; Yang, J.; Yu, W.; An, D.; Zhang, N.; Zhao, W. On false data-injection attacks against power system state estimation: Modeling and countermeasures. IEEE Trans. Parallel Distrib. Syst. 2013, 25, 717–729. [Google Scholar] [CrossRef]
  7. Wang, Z.; He, H.; Wan, Z.; Sun, Y. Detection of false data injection attacks in ac state estimation using phasor measurements. IEEE Trans. Smart Grid 2020. [Google Scholar] [CrossRef]
  8. Manandhar, K.; Cao, X.; Hu, F.; Liu, Y. Detection of faults and attacks including false data injection attack in smart grid using Kalman filter. IEEE Trans. Control Netw. Syst. 2014, 1, 370–379. [Google Scholar] [CrossRef]
  9. Tan, S.; Xie, P.; Guerrero, J.M.; Vasquez, J.C. False data injection cyber-attacks detection for multiple dc microgrid clusters. Appl. Energy 2022, 310, 118425. [Google Scholar] [CrossRef]
  10. Husnoo, M.A.; Anwar, A.; Hosseinzadeh, N.; Islam, S.N.; Mahmood, A.N.; Doss, R. False data injection threats in active distribution systems: A comprehensive survey. arXiv 2022, arXiv:2111.14251v2. [Google Scholar] [CrossRef]
  11. Simonyan, K.; Zisserman, A. Very deep convolutional networks for large-scale image recognition. arXiv 2014, arXiv:1409.1556. [Google Scholar]
  12. Laffont, P.Y.; Ren, Z.; Tao, X.; Qian, C.; Hays, J. Transient Attributes for High-Level Understanding and Editing of Outdoor Scenes. ACM Trans. Graph. 2014, 33, 4. [Google Scholar] [CrossRef]
  13. Goodfellow, I.; Bengio, Y.; Courville, A. Deep Learning; MIT Press: Cambridge, MA, USA, 2016. [Google Scholar]
  14. Nie, Y.; Li, X.; Scott, A.; Sun, Y.; Venugopal, V.; Brandt, A. SKIPP’D: A SKy Images and Photovoltaic Power Generation Dataset for short-term solar forecasting. Sol. Energy 2023, 255, 171–179. [Google Scholar] [CrossRef]
Figure 1. (a) Original VGG-16 [11]. (b) Modified VGG-16 employed to perform a transfer learning task.
Engproc 47 00005 g001
Figure 2. Example of an image from “transient attribute database X t , Y t ”, which is publicly available in [12] with their attribute label.
Engproc 47 00005 g002
Figure 3. A heat map shows that the modified VGG-16 neural network looks for very different points in the image, depending on the weather conditions.
Engproc 47 00005 g003
Figure 4. Example of features extracted by convolutional layers.
Engproc 47 00005 g004
Figure 5. Correlation Matrix of the 40 attributes obtained from the modified VGG-16 from the images.
Engproc 47 00005 g005
Figure 6. Numerical results of the training modified VGG-16 neural network.
Engproc 47 00005 g006
Figure 7. Comparison of the visual state estimated values and ground truth.
Engproc 47 00005 g007
Table 1. Comparison of the proposed modified VGG-16 neural network with previous works [12].
ModeloMSE
SVM [12]0.070
log reg [12]0.093
SVR [12]0.043
Proposed modified VGG-160.0319
Disclaimer/Publisher’s Note: The statements, opinions and data contained in all publications are solely those of the individual author(s) and contributor(s) and not of MDPI and/or the editor(s). MDPI and/or the editor(s) disclaim responsibility for any injury to people or property resulting from any ideas, methods, instructions or products referred to in the content.