Proceeding Paper

Field Performance Evaluation of Air Quality Low-Cost Sensors Deployed in a Near-City Space-Airport †

ENEA-Italian National Agency for New Technologies, Energy and Sustainable Economic Development, Laboratory Functional Materials and Technologies for Sustainable Applications, Brindisi Research Centre, Strada Statale 7, Appia, Km. 706, 72100 Brindisi, Italy
*
Author to whom correspondence should be addressed.
Presented at the 2nd International Electronic Conference on Chemical Sensors and Analytical Chemistry, 16–30 September 2023; Available online: https://csac2023.sciforum.net/.
Eng. Proc. 2023, 48(1), 27; https://doi.org/10.3390/CSAC2023-14911
Published: 26 September 2023

Abstract

:
Air pollution is a current problem for the environment and public health. Its impact needs to be monitored in urban agglomerates and critical hot spots such as airports. Green aviation with low air emissions is a sustainable goal for the future. The air pollutants are monitored by governmental agencies that employ regulatory monitoring stations, which are very accurate but also very expensive, bulky, and maintenance demands. On the contrary, low-cost sensor systems can offer a proper solution to cover large areas at high spatial-temporal resolution. However, the low-cost air quality sensors are less accurate than reference analyzers operating in the regulatory stations. To enhance the sensor accuracy, field calibration, and data correction with reference instrumentation is a valid strategy to improve sensor data quality. In this study, a sensor system with a selected set of air quality gas sensors (NO2, O3) and particulate matter (PM10, PM2.5) has been developed and deployed in a near-city space-airport at Grottaglie (Southern Italy) to perform measurements in a period of 4 months, from October 2021 to February 2022. The sensor units installed in the Airbox system used for this measurements campaign are the GS+4NO2 (DD Scientific) for NO2 measurements, the O3-3E1F (City Technology, Sensoric) for O3 measurements, and the NextPM (Tera Sensor) for PM10 and PM2.5 measurements. Data gathered by the low-cost air quality sensors have been compared to reference instrumentations both co-located (ca. 1 m distance) together with low-cost sensors (PM10, R2 > 0.87; PM2.5, R2 > 0.50) and a distributed regulatory network of 14 environmental stations operating in the local area around space-airport at a distance ranging from 3 to 26 km.

1. Introduction

Low-cost sensor systems (LCSS) may represent a suitable technology to supplement regulatory monitoring air quality networks [1,2,3,4] by Indicative Measurements, as contemplated by the European Directives on Air Quality [5]. Concentration measurements from LCSS can support decision-making and provide citizens awareness with information on limit values and alert thresholds for pollutants.
While low-cost electrochemical sensors are designed for a specific gas selectivity, their response is often affected by ambient parameters and the presence of interfering gases. Studies [6,7] have shown sensitivity for NO2 and O3 sensors, which can interfere both by showing a higher signal and by suffocating it with a cancellation effect: the use of the manufacturer’s calibrations can lead in some situations to unexpected negative measurement values concentrations, and it is difficult to carry out calibrations in the laboratory that take into account all the parameters to which the sensors are exposed when they are operated on the field. However further, customized on-field calibrations can be expensive and difficult to execute.
This work reports considerations on ground measurements of a given set of sensors for concentration evaluation of particulate matter (PM10 and PM2.5), ozone (O3), and nitrogen dioxide (NO2) by a procedure to correct the measured concentration values of gaseous species under test. An ENEA-designed LCSS Airbox [1,3,4], equipped with low-cost sensors, has been positioned at the “Marcello Arlotta” airport in Taranto-Grottaglie (Southern Italy), near the town of Grottaglie about 15 km East of Taranto. This city has a large industrial area affected by a high load of air pollution.

2. Materials and Methods

2.1. Airbox, the Low-Cost Sensor System, and Its On-Field Positioning

The Airbox is a home-built system utilizing Raspberry micro-computer to connect different kinds of sensors and manage their measurement data.
For the purpose of this work, the Airbox system integrated an optical particulate matter sensor NextPM (TERA Sensor, Rousset, France), for PM10 and PM2.5 measurements (the sensor also provides PM1 measurements) an electrochemical cell GS+4NO2 (DD Scientific, Fareham, United Kingdom), for NO2 concentration measurements and an electrochemical cell O3-3E1F (Sensoric, City Technology (Bonn, Germany), for O3 concentration measurements. The manufacturer calibration curves were used for gas sensors.
The Airbox provides hourly averaged concentration values, and data are delivered if 75% of the expected measurements pass the validation procedure.
Airbox was properly installed in the area of Grottaglie airport, positioned on a balcony, under the airport control tower (Latitude 40°30′52.7″ N, Longitude 17°23′59.3″ E) at the height of about 12 meters above the ground.
The campaign of measurements started on 5 October 2021 and ended on 8 February 2022, with a total of 125 full calendar days.
Due to the access policies to the Airport and the restrictions related to the COVID-19 emergency, the research staff access was limited during the measurement campaign period according to a scheduled calendar, thus, it was not possible to intervene promptly to evaluate operating faults.

2.2. Reference Instrumentation and Open Data from Air-Quality Regulatory Monitoring Network

The PM data were compared with reference particulate matter monitor APM-2 (Comde-Derenda GmbH, Stahnsdorf, Germany) installed at a distance of about 1 meter: both the suction head of the reference instrumentation and the Airbox inlet were at the same height (approx. 1 m) from the floor.
Public data from the air quality monitoring network of the Apulia Region Environmental Protection Agency, ARPA Puglia [8], were consulted to carry out an evaluation of O3 and NO2 sensor measurements and perform an on-field data correction procedure. ARPA Puglia makes available open data for daily averages, with a day delay, and information from 14 fixed monitoring stations surrounding the Grottaglie Airport was gathered; characteristics of the 14 selected stations are shown in Table 1.
NO2 measurements were available for all stations of the ARPA environmental monitoring station network, while 4 ARPA stations provided measurements for O3 only.
Data from the ARPA Puglia monitoring stations were summarized by calculating the mean value for each day and identifying the minimum and maximum values.

2.3. Comparison of the Measured Data and Procedure for Correcting Gas Concentrations

In order to compare Airbox data with ARPA’s measurements, 24 h mean values were calculated for days with at least 75% validated hourly average concentrations.
As regards the PM concentrations, a comparison was made between the measurements of the optical sensors and the reference instrumentation by evaluating the coefficient of determination (R2) on the daily averages.
As regards the O3 and NO2 concentrations, a procedure was applied for correcting the measurement values according to the available ARPA Puglia data. Referring to the first 21 days with validated measurements, a linear correction of the concentration values was applied by setting equality between:
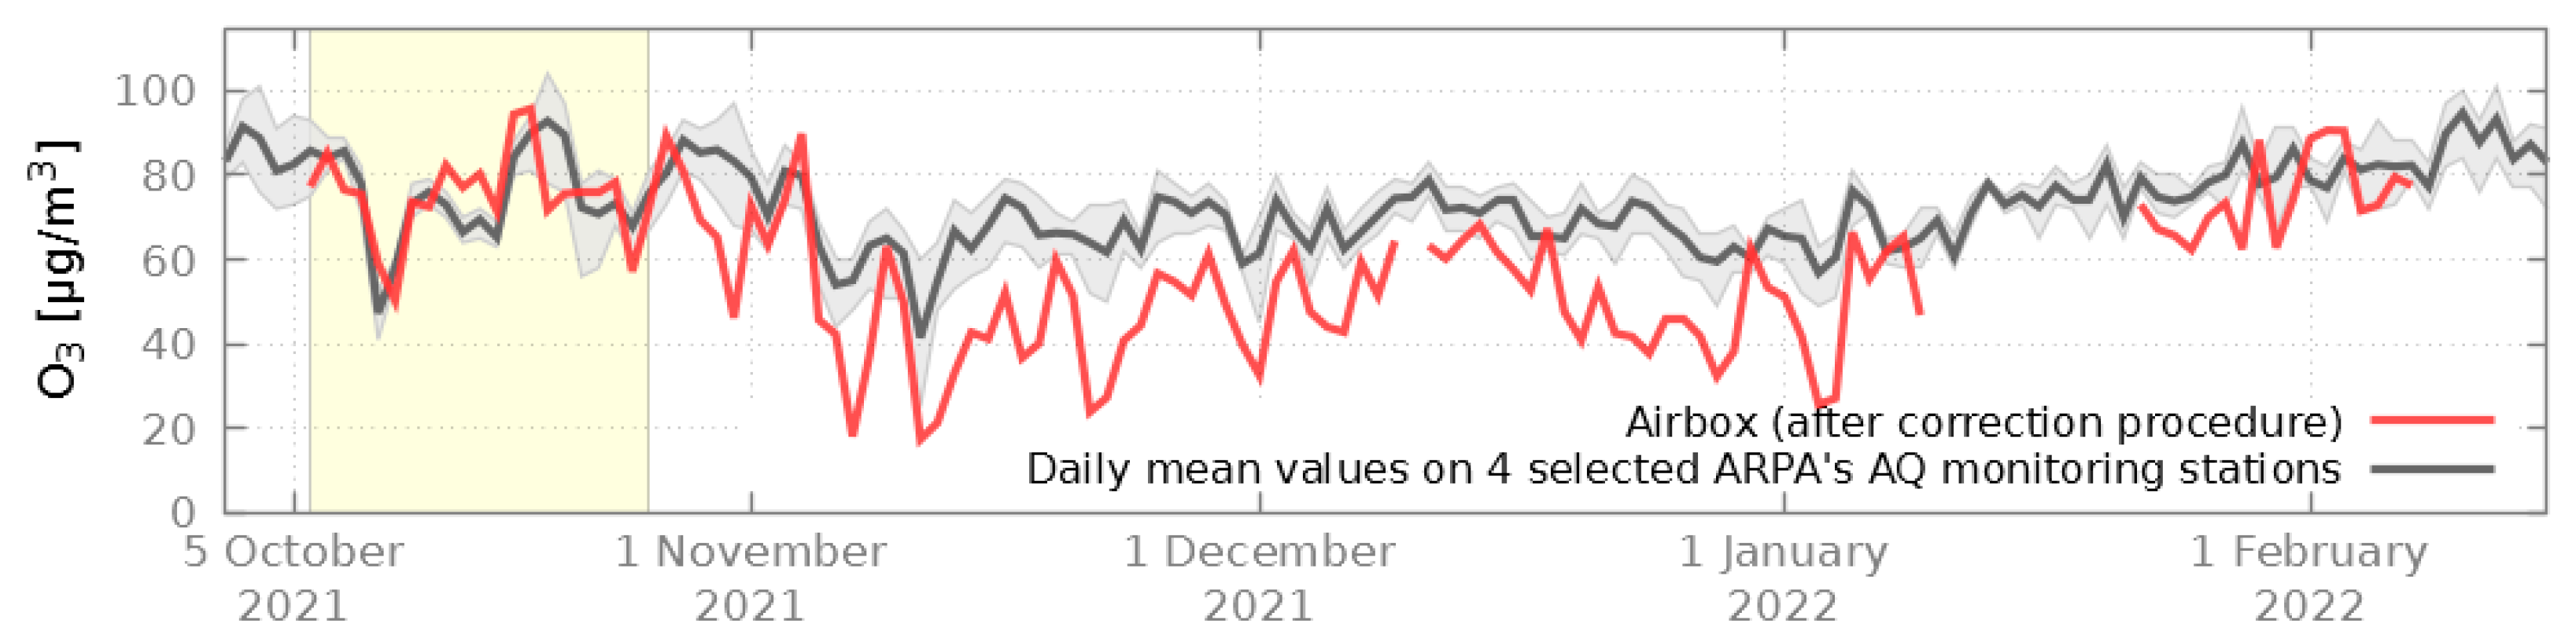
  • Mean of the daily average values of the Airbox corrected measurements and mean of the daily averages of the ARPA stations;
  • Difference between the maximum and minimum values of the daily averages of the Airbox corrected measurements and the difference between the maximum and minimum values of the daily averages of the ARPA stations.
The procedure was applied to:
  • O3 concentration values;
  • NO2 concentration values from which the corrected O3 concentration values have been subtracted to evaluate an O3 cross-sensitivity contribution.

3. Results

During the measurement campaign, the Airbox provided concentration measurements for 113 full days, and the average daily number of validated measurements for each pollutant exceeded 99.5% of the expected measurements. The PM reference instrumentation provided data for 110 full days, and it was possible to compare the data with the Airbox measurements for a total of 101 days.
Figure 1 shows (a) the PM10 daily mean concentrations time series of the NextPM sensor compared to the PM reference instrumentation and (b) the scatter-plot chart with the correlated daily mean values: the coefficient of determination R2 is 0.877, and the linear regression (LR) fit using the ordinary least squares approach brings a regression slope 1.538 and a regression intercept 1.742.
In the same manner, Figure 1 proposes (c) the PM2.5 daily mean concentrations time series of the NextPM sensor compared to the PM reference instrumentation and (d) the scatter-plot chart with the correlated daily mean values: in this case, the coefficient of determination R2 is 0.504, the ordinary least squares LR fitting brings a regression slope 0.525 and a regression intercept 2.586.
Background colors on panels (a,c) of Figure 1 indicate, for each PM pollutant, the Air Quality Index Categories classification according to [9].
Figure 2 shows the mean values of the O3 concentrations after the correction procedure, which used the mean of the daily means of the stations of the ARPA monitoring network as a reference. As described above, measurements of the O3-3E1F sensor were corrected using available ARPA data from the first 21 days of the measurement campaign.
Over this 21-day period, highlighted with a yellow background in Figure 2, the coefficient of determination R2 between the O3 sensor measurements and the ARPA data summarized as a reference was 0.415, while the slope and intercept of the linear correction procedure were 0.762 and 31.339, respectively.
In the same manner, Figure 3 shows the results of the correction procedure of the NO2 concentrations of the GS+4NO2 sensor: in this case, the O3 corrected values of concentration were subtracted from the NO2 daily mean values in order to evaluate possible cross-sensitivity dependence. The coefficients of determination R2 between the NO2 sensor measurements, before and after O3 subtraction, and the ARPA data summarized as a reference were 0.047 and 0.020. This low correlation sensor-vs-analyzer is affected by the high cross-sensitivity of both oxidizing gases. The slope and intercept of the linear correction procedure were 1.690 and −68.261, respectively.
In both Figure 2 and Figure 3, ARPA data were also represented outside the first 21-day period, during which they played an active role in the correction process to provide a qualitative comparison.

4. Summary and Conclusions

In this work, low-cost sensors for the measurement of PM10, O3, and NO2 gas concentrations have been tested at Grottaglie airport with a measurement campaign performed using the manufacturer calibration only. The tested PM optical sensor (NextPM) allowed us to obtain good concentration estimates, especially for PM10. The use of gas sensors without a comparison with reference instrumentation presents known calibration issues, and an on-field correction procedure of the measurement concentrations has been attempted by referring to the open data of a regulatory network of air quality monitoring stations.
The proposed procedure of concentration correction showed estimates closer to the concentration trends in the area under test, but it needs a formulation that takes into account more environmental parameters and additional interfering pollutant gases.
Future work is planned to refine the correction procedure for enhanced air quality sensor calibration.

Author Contributions

Conceptualization, V.P.; methodology, V.P.; software, V.P. and M.P. (Mario Prato); validation, V.P.; formal analysis, V.P.; investigation, V.P. and M.P. (Mario Prato); resources, V.P. and M.P. (Mario Prato); data curation, V.P. and M.P. (Mario Prato); writing—original draft preparation, V.P. and M.P. (Michele Penza); writing—review and editing, V.P., M.P. (Mario Prato), and M.P. (Michele Penza); visualization, V.P.; supervision, V.P. and M.P. (Michele Penza); project administration, V.P. and M.P. (Michele Penza); funding acquisition, M.P. (Michele Penza) All authors have read and agreed to the published version of the manuscript.

Funding

This work was financially supported by the Italian project RPASinAir—Integration of Remotely Piloted Aircraft Systems in unsegregated airspace for services—under the PON ARS01_00820 funding grant of the Italian Ministry of Education, University and Research (MIUR).

Institutional Review Board Statement

Not applicable.

Informed Consent Statement

Not applicable.

Data Availability Statement

Data is available on request from the authors. Open data from ARPA Puglia is available online: http://old.arpa.puglia.it/web/guest/qariainq2 (in Italian) (accessed on 11 August 2023).

Acknowledgments

The authors acknowledge ARPA-Puglia for official air quality public data. The authors also wish to thank ENAC and AdP-Aeroporti di Puglia for access to Taranto-Grottaglie “Marcello Arlotta” Airport and DTA for in-airport escort and logistic support services.

Conflicts of Interest

The authors declare no conflict of interest. The funders had no role in the design of the study; in the collection, analyses, or interpretation of data; in the writing of the manuscript; or in the decision to publish the results.

References

  1. Borrego, C.; Costa, A.M.; Ginja, J.; Amorim, M.; Coutinho, M.; Karatzas, K.; Sioumis, T.; Katsifarakis, N.; Konstantinidis, K.; De Vito, S.; et al. Assessment of air quality microsensors versus reference methods: The EuNetAir joint exercise. Atmos. Environ. 2016, 147, 246–263. [Google Scholar] [CrossRef]
  2. EuNetAir. Available online: http://www.cost.eunetair.it/ (accessed on 11 August 2023).
  3. Penza, M.; Suriano, D.; Pfister, V.; Prato, M.; Cassano, G. Urban air quality monitoring with networked low-cost sensor-systems. Proceedings 2017, 1, 573. [Google Scholar] [CrossRef]
  4. Penza, M.; Suriano, D.; Pfister, V.; Prato, M.; Cassano, G. Wireless Sensors Network Monitoring of Saharan Dust Events in Bari, Italy. Proceedings 2018, 2, 898. [Google Scholar] [CrossRef]
  5. EU. Directive 2008/50/EC of the European Parliament and of the Council of 21 May 2008 on Ambient Air Quality and Cleaner Air for Europe; European Commission: Brussels, Belgium, 2008; Available online: https://eur-lex.europa.eu/eli/dir/2008/50/oj (accessed on 11 August 2023).
  6. Mead, M.; Popoola, O.; Stewart, G.; Landshoff, P.; Calleja, M.; Hayes, M.; Baldovi, J.; McLeod, M.; Hodgson, T.; Dicks, J.; et al. The use of electrochemical sensors for monitoring urban air quality in low-cost, high-density networks. Atmos. Environ. 2013, 70, 186–203. [Google Scholar] [CrossRef]
  7. Spinelle, L.; Gerboles, M.; Aleixandre, M. Performance Evaluation of Amperometric Sensors for the Monitoring of O3 and NO2 in Ambient Air at ppb Level. Procedia Eng. 2015, 120, 480–483. [Google Scholar] [CrossRef]
  8. ARPA Puglia, Apulia Regional Environmental Protection Agency (In Italian). Available online: https://www.arpa.puglia.it/ (accessed on 11 August 2023).
  9. United States Environmental Protection Agency. EPA-454/B-18-007—Technical Assistance Document for the Reporting of Daily Air Quality—The Air Quality Index (AQI); United States EPA-Environmental Protection Agency Office of Air Quality Planning and Standards: Research Triangle Park, NC, USA, 2018. [Google Scholar]
Figure 1. Airbox and Reference Instrumentation daily means time-series of (a) PM10 and (c) PM2.5 concentrations (background colors refer to the AQ level classification); Comparison between (b) PM10 and (d) PM2.5 daily averages of Airbox and daily means of Reference Instrumentation (darker areas indicate a higher frequency of measurement pairs with the same mean values).
Engproc 48 00027 g001
Figure 2. Comparison of the Ozone (O3) corrected daily mean concentrations, using a 21-day fixing period (highlighted in light yellow), and the ARPA’s monitoring network (up to 4 stations). Light gray belt represents the range between the minimum and maximum values of the measurement values of the ARPA monitoring network.
Engproc 48 00027 g002
Figure 3. Comparison of the Nitrogen Dioxide NO2 corrected daily mean concentrations, using a 21-day fixing period (highlighted in light yellow) and the ARPA’s monitoring network (up to 14 stations). Light gray belt represents the range between the minimum and maximum values of the measurement values of the ARPA monitoring network.
Engproc 48 00027 g003
Table 1. Characteristics of the Airport surrounding stations of the ARPA Puglia air quality monitoring network.
StationLine-of-Sight Distance
[km]
Azimuth *
[°]
TypePollutants of Interest in This Work **
PM10PM2.5NO2O3
Grottaglie3.338.0Urban Background+-++
Ceglie Messapica17.732.5Urban Background+++-
Francavilla Fontana16.084.0Urban Traffic--+-
Taranto-Talsano15.1220.5Urban Background+-++
Taranto-San Vito17.9235.5Urban Background+-++
Taranto-Alto Adige13.0242.5Urban Traffic+++-
Taranto-Machiavelli15.0259.0Industrial+++-
Taranto-Archimede14.3261.0Industrial+++-
Taranto-CISI12.4273.0Industrial+++-
Statte-Ponte Wind19.2274.0Industrial+-+-
Statte-Sorgenti17.4288.0Industrial+-+-
Massafra25.5290.0Industrial+-+-
Martina Franca21.5344.5Urban Traffic+-+-
Cisternino25.43.0Urban Background+-++
* Angular distance from North, measured clockwise. ** Symbols list: ‘+’ Data available; ‘-’ Data not available.
Disclaimer/Publisher’s Note: The statements, opinions and data contained in all publications are solely those of the individual author(s) and contributor(s) and not of MDPI and/or the editor(s). MDPI and/or the editor(s) disclaim responsibility for any injury to people or property resulting from any ideas, methods, instructions or products referred to in the content.

