
An Examination of a Method to Reduce the Effect of Standing-Wave Heat Generation in Ultrasound-Excited Thermography Inspection †


Abstract
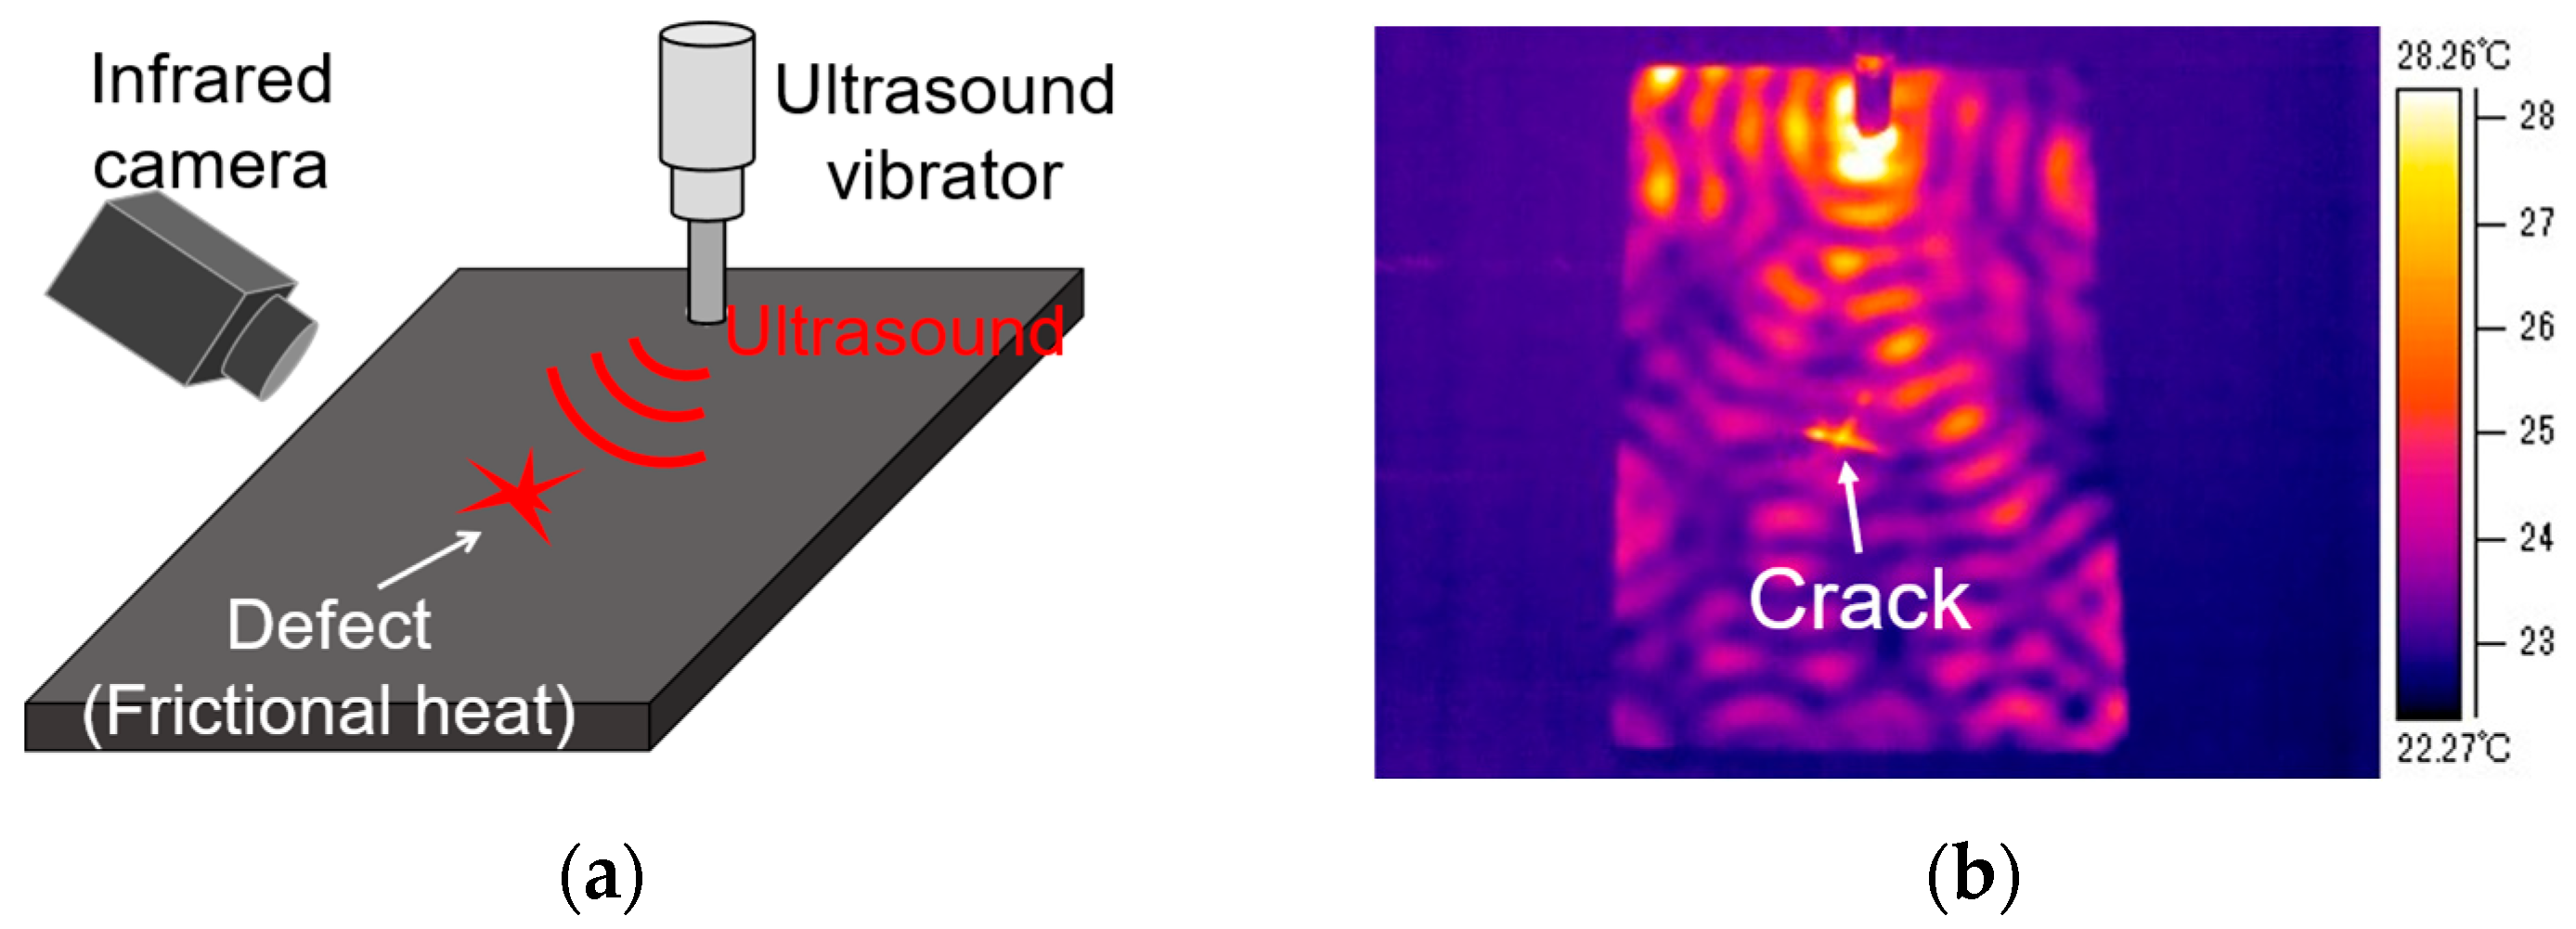
:1. Introduction
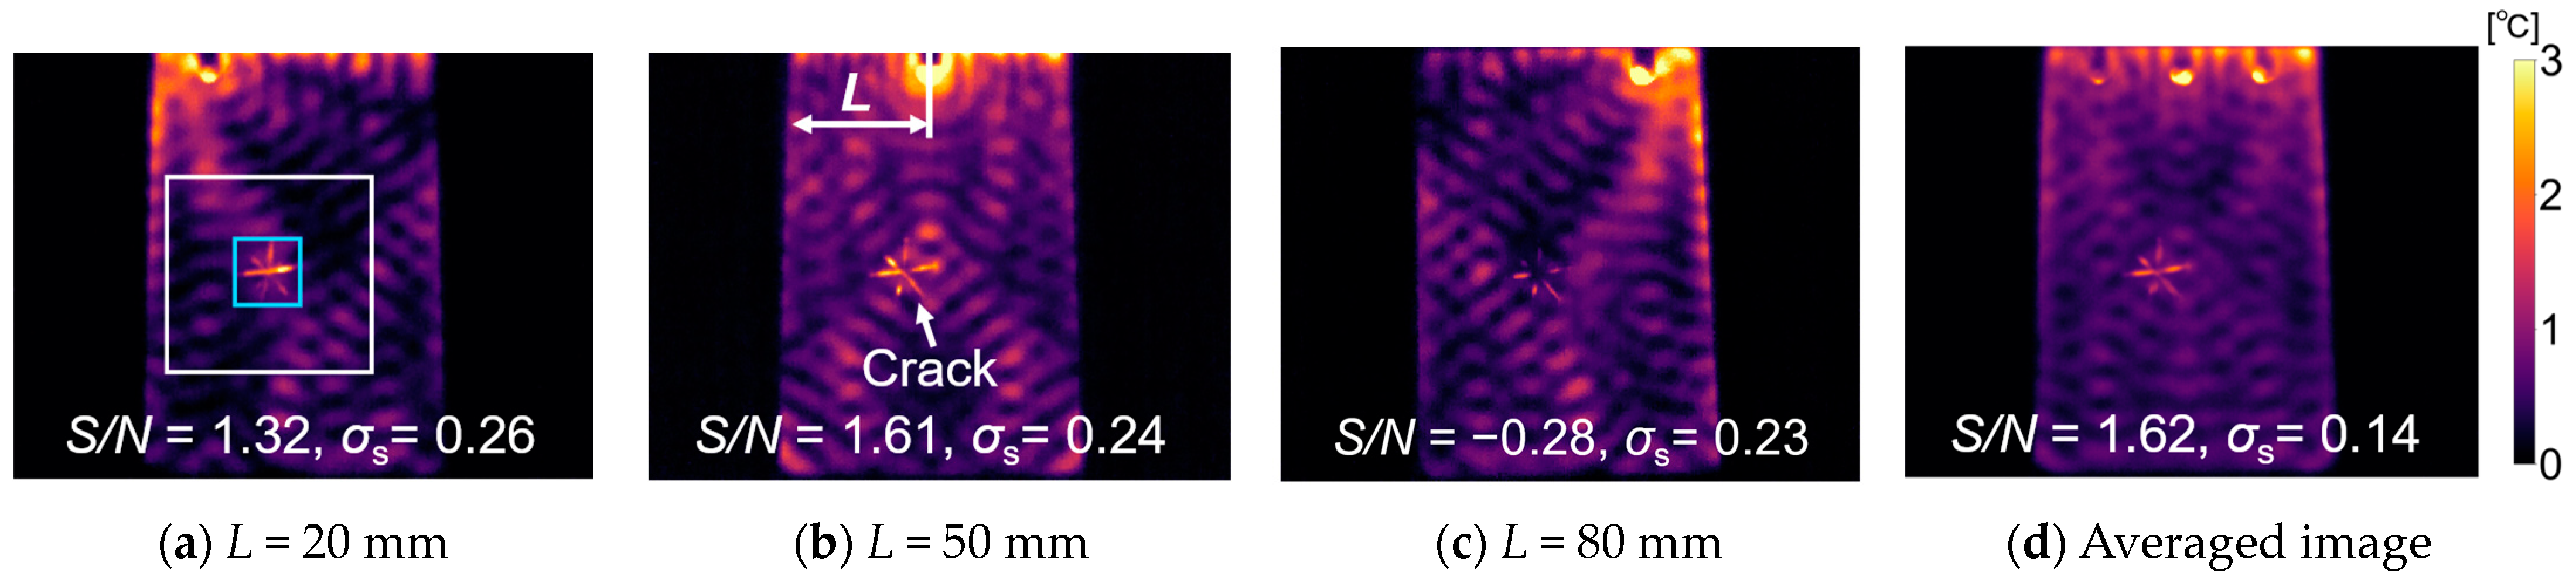
2. Experimental Examination on the Effect of Averaging Multiple Thermal Images
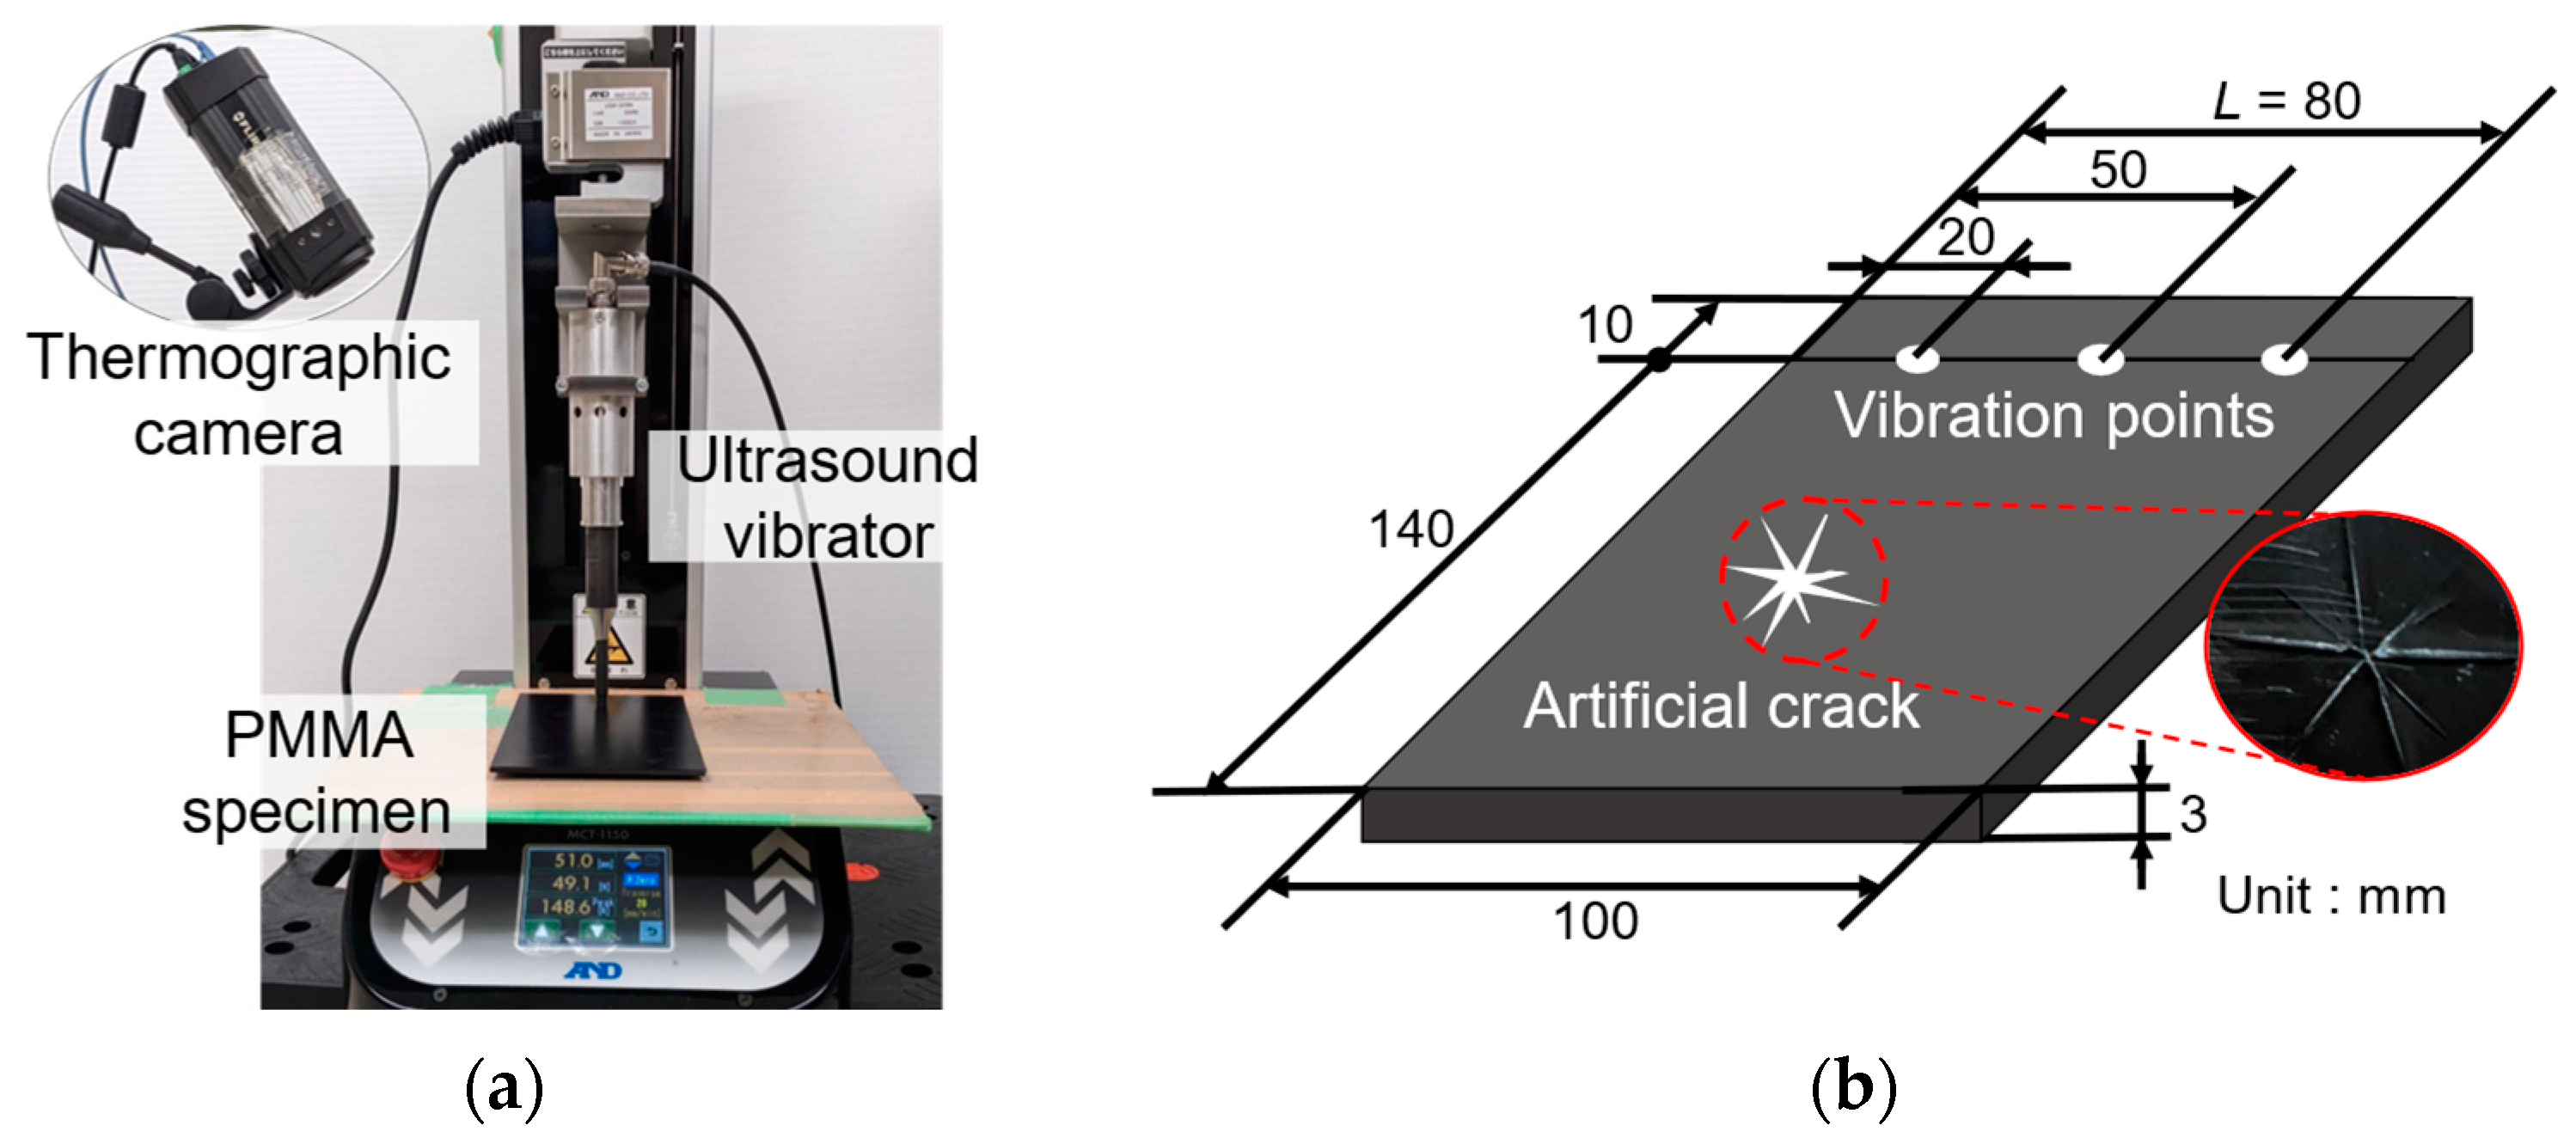
2.1. Experimental Setup
2.2. Experimental Results
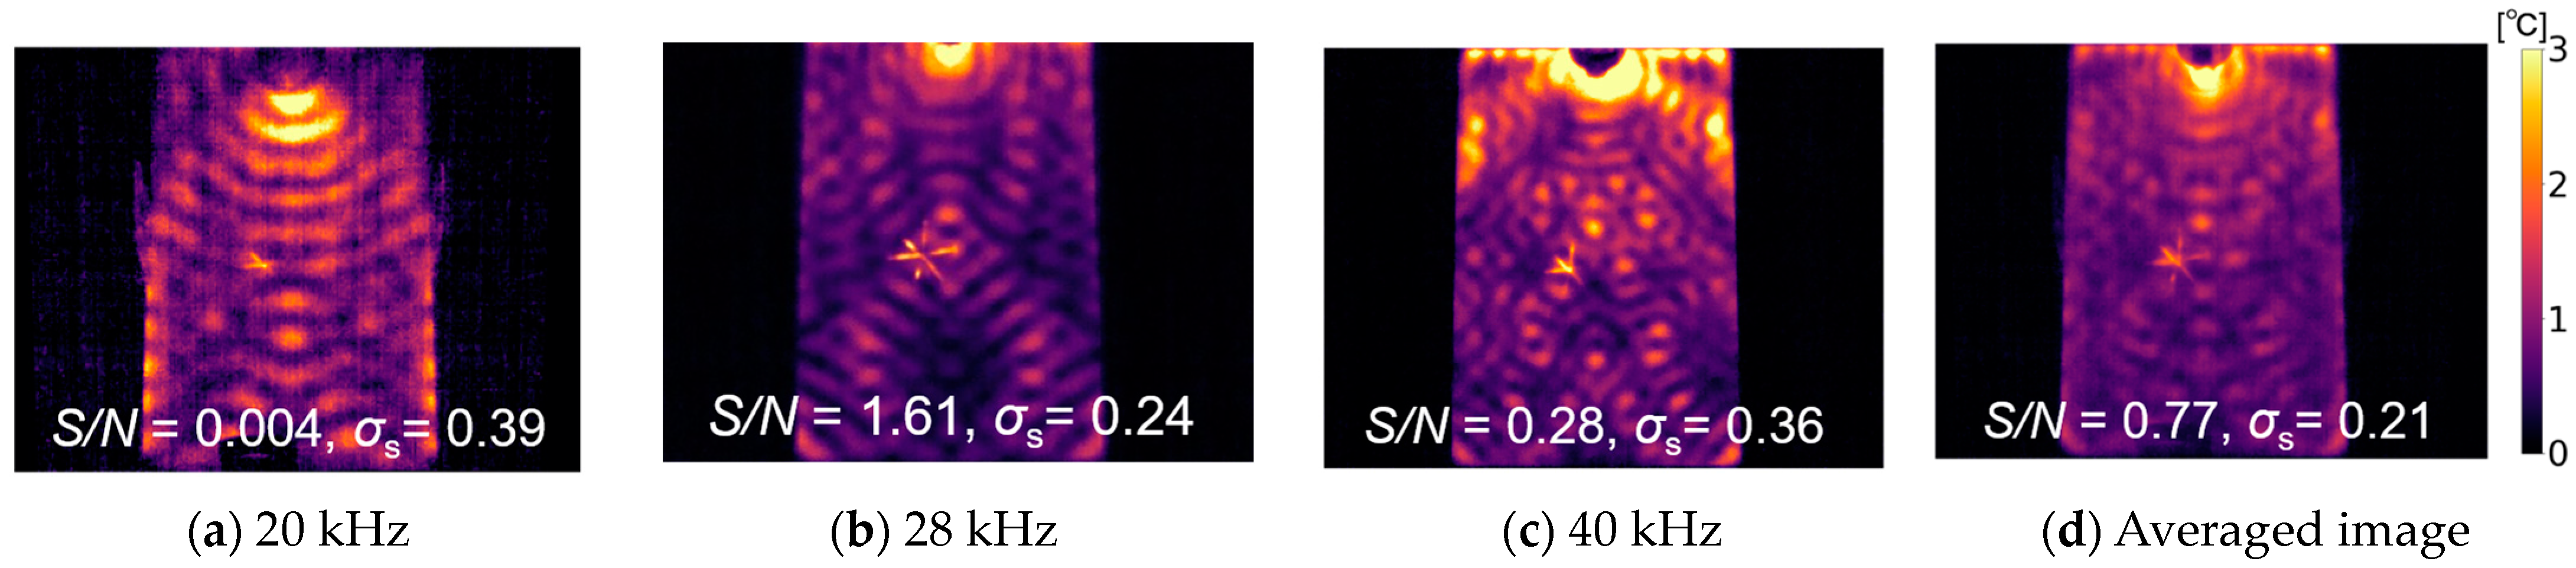
3. Averaging Thermal Images Obtained at Different Vibration Frequencies
4. Conclusions
Author Contributions
Funding
Institutional Review Board Statement
Informed Consent Statement
Data Availability Statement
Conflicts of Interest
References
- Morbidini, M.; Cawley, P. The detectability of cracks using sonic IR. J. Appl. Phys. 2009, 105, 093530. [Google Scholar] [CrossRef]
- Favro, L.D.; Thomas, R.L.; Han, X.; Ouyang, Z.; Newaz, G.; Gentile, D. Sonic infrared imaging of fatigue cracks. Int. J. Fatigue 2001, 23, 471–476. [Google Scholar] [CrossRef]
- Guo, X.; Vavilov, V. Crack detection in aluminum parts by using ultrasound-excited infrared thermography. Infrared Phys. Technol. 2013, 61, 149–156. [Google Scholar] [CrossRef]
- Zweschper, T.; Riegert, G.; Dillenz, A.; Busse, G. Frequency-modulated elastic wave thermography. In Proceedings of the Thermosense XXV, Orlando, FL, USA, 22–24 April 2003; SPIE: Bellingham, WA, USA, 2003; pp. 386–391. [Google Scholar]
- Zweschper, T.; Riegert, G.; Dillenz, A.; Busse, G. Ultrasound burst phase thermography (UBP) for applications in the automotive industry. In Proceedings of the AIP Conference Proceedings, Budapest, Hungary, 16–19 September 2003; American Institute of Physics: College Park, MD, USA, 2003; pp. 531–536. [Google Scholar]
Disclaimer/Publisher’s Note: The statements, opinions and data contained in all publications are solely those of the individual author(s) and contributor(s) and not of MDPI and/or the editor(s). MDPI and/or the editor(s) disclaim responsibility for any injury to people or property resulting from any ideas, methods, instructions or products referred to in the content. |
© 2023 by the authors. Licensee MDPI, Basel, Switzerland. This article is an open access article distributed under the terms and conditions of the Creative Commons Attribution (CC BY) license (https://creativecommons.org/licenses/by/4.0/).
Share and Cite
Takahashi, S.; Ishikawa, M.; Nishino, H.; Koyama, M.; Fukui, R. An Examination of a Method to Reduce the Effect of Standing-Wave Heat Generation in Ultrasound-Excited Thermography Inspection. Eng. Proc. 2023, 51, 22. https://doi.org/10.3390/engproc2023051022
Takahashi S, Ishikawa M, Nishino H, Koyama M, Fukui R. An Examination of a Method to Reduce the Effect of Standing-Wave Heat Generation in Ultrasound-Excited Thermography Inspection. Engineering Proceedings. 2023; 51(1):22. https://doi.org/10.3390/engproc2023051022
Chicago/Turabian StyleTakahashi, So, Masashi Ishikawa, Hideo Nishino, Masashi Koyama, and Ryo Fukui. 2023. "An Examination of a Method to Reduce the Effect of Standing-Wave Heat Generation in Ultrasound-Excited Thermography Inspection" Engineering Proceedings 51, no. 1: 22. https://doi.org/10.3390/engproc2023051022