Abstract
Optical centroid efficiency (OCE) is the traditional enclosed energy by the square detector pixel (the energy on detector (EOD)) averaged over all misalignments between the optical system and the pixel center. We examine the relationship between the OCE and the EOD for two different pixel sizes, with one larger than the diameter of the Airy disc and the other smaller than three diameters of the Airy disc. We observed that the relationships could, in general, be described as having a U shape, with the OCE being proportional to the EOD for small amounts of aberrations and inversely proportional for large amounts. For the letter cases, the energy is distributed over several pixels.
Keywords:
energy-on-square detector; EOD; optical centroid efficiency; OCE; infrared; sensor; aberrations; spherical; coma; astigmatism; defocus 1. Effect of Aberration on Energy Spread in the Focal Plane
The image of a point source in infinity is a square of the Fourier transform of the limiting aperture of the optical system for a diffraction-limited performance. For an optical system with circular aperture, this is a circle, with the square of the diffraction pattern shown Figure 1. When the image is degraded due to the presence of aberrations or misalignments, the image spreads out into a blob [1,2].
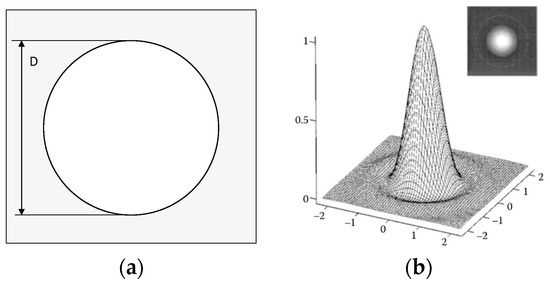
Figure 1.
(a) Transmission profile of a circular pupil. Gray indicates zero-transmission and D is the diameter of the pupil. (b) Point spread function (psf) of an optical system with a circular aperture in the absence of aberrations.
The James Webb Space telescope has a more elaborate aperture shape. Optical systems for the IR applications usually include mirrors to avoid degradations due to chromatic aberrations and to permit multispectral applications. The central obscuration is often avoided with successful application of the reflective three-mirror system [3,4].
The radius of the Airy disc of an ideal imaging system with a circular aperture is rA= 1.22 λF/#. Here, λ is the wavelength and F/# is the focal distance f divided by the aperture diameter of the circular optical system D.
Any optical system with aberrations caused by either the design, alignment, manufacturing imperfections, assembly, or their combination displays a modified and enlarged psf(x,y) compared to that of a perfect system. The energy of an aberrated system is pushed out of the central lobe to the outer rings in the image of a point source. This often happens asymmetrically, un-isotopically, and unevenly. Similarly, the presence of the central obscuration and the spider structure cause the energy to move from the central peak to the outer rings. The larger spot size decreases instrument resolution. Optical centroiding efficiency is the average of all image centroid positions over the pixel surface. In this work, this quantity is calculated numerically because ray tracing is a numerical simulation [5].
The energy on detector (EOD) decreases as the amount of aberration increases. In this report, we present the results of the investigations concerning the relationship between the OCE and the EOD in the presence of spherical aberrations.
2. Relationship between the OCE and the EOD for Spherical Aberrations
The relationship between the OCE and the EOD was studied for spherical aberration. The amount of aberration decrease in the graphs from left (1.25 λ) to right (0) along the EOD axis. As expected, the increase in the amount of aberration results in a decrease in the EOD.
Studies were performed for two different detector sizes, 2d = 3λF/# and 2d = 7λF/#. The pixel size was 2d by 2d. These sizes correspond to a relatively small and a large pixel size in comparison to the diameter of the Airy disc, respectively. The former is a bit larger than one Airy disc diameter while the latter is somewhat smaller than three Airy disc diameters.
The OCE vs. EOD graphs are presented in Figure 2 for the case of spherical aberration. The graph of the small pixel (2d = 3λF/#) is presented in part (a), while the case of the large pixel (2d = 7λF/#) is shown in part (b). The graphs have a similar general shape, except that the valley for the large pixel is deeper by about ΔOCE = 0.4 and shifted to higher EOD values by about ΔEOD = 0.25.
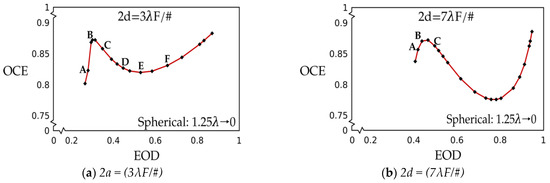
Figure 2.
The OCE vs. EOD graph for the spherical aberration for two pixel sizes as follows: (a) 2d = 3λF/#; and (b) 2d = 7λF/#.
The peak at the lower EOD values might be explained by the interaction of pixel size with the energy enclosed by a different sized pixel. The peaks achieve a similar OCE values for both pixel sizes, the same as an OCE value for no aberration in the right upper corner for both pixel sizes. For low EOD values for both pixel sizes, the image spot is much larger than the small pixel and somewhat larger than the large pixel. Therefore, the centroid position on the blob is not important, only contributing significantly to the OCE. For the EOD values smaller than 0.5, we recommend that a pixel with twice the linear dimension of the one in the graph should be selected to capture enough energy.
We examined the interesting question of whether we can correlate the small and large pixel results, at least for the case concerning small amounts of spherical aberration. This would make the results available for extrapolation for any intermediate pixel size. We relate the OCE and EOD for two pixel sizes, for a point of no aberration, and for the minimum of the curve. Furthermore, 2d is an arbitrary pixel size within the interval [2dmin, 2dmax] = [3λF/# and 7λF/#].
We read the numerical values directly from Figure 2 and substitute them into equations for straight lines, Equations (1) and (2).
Thus, we twice linearize the simulation results, and 2d is expressed numerically in (λF/#).
3. Transmissive IR Optical System for Remote Sensing
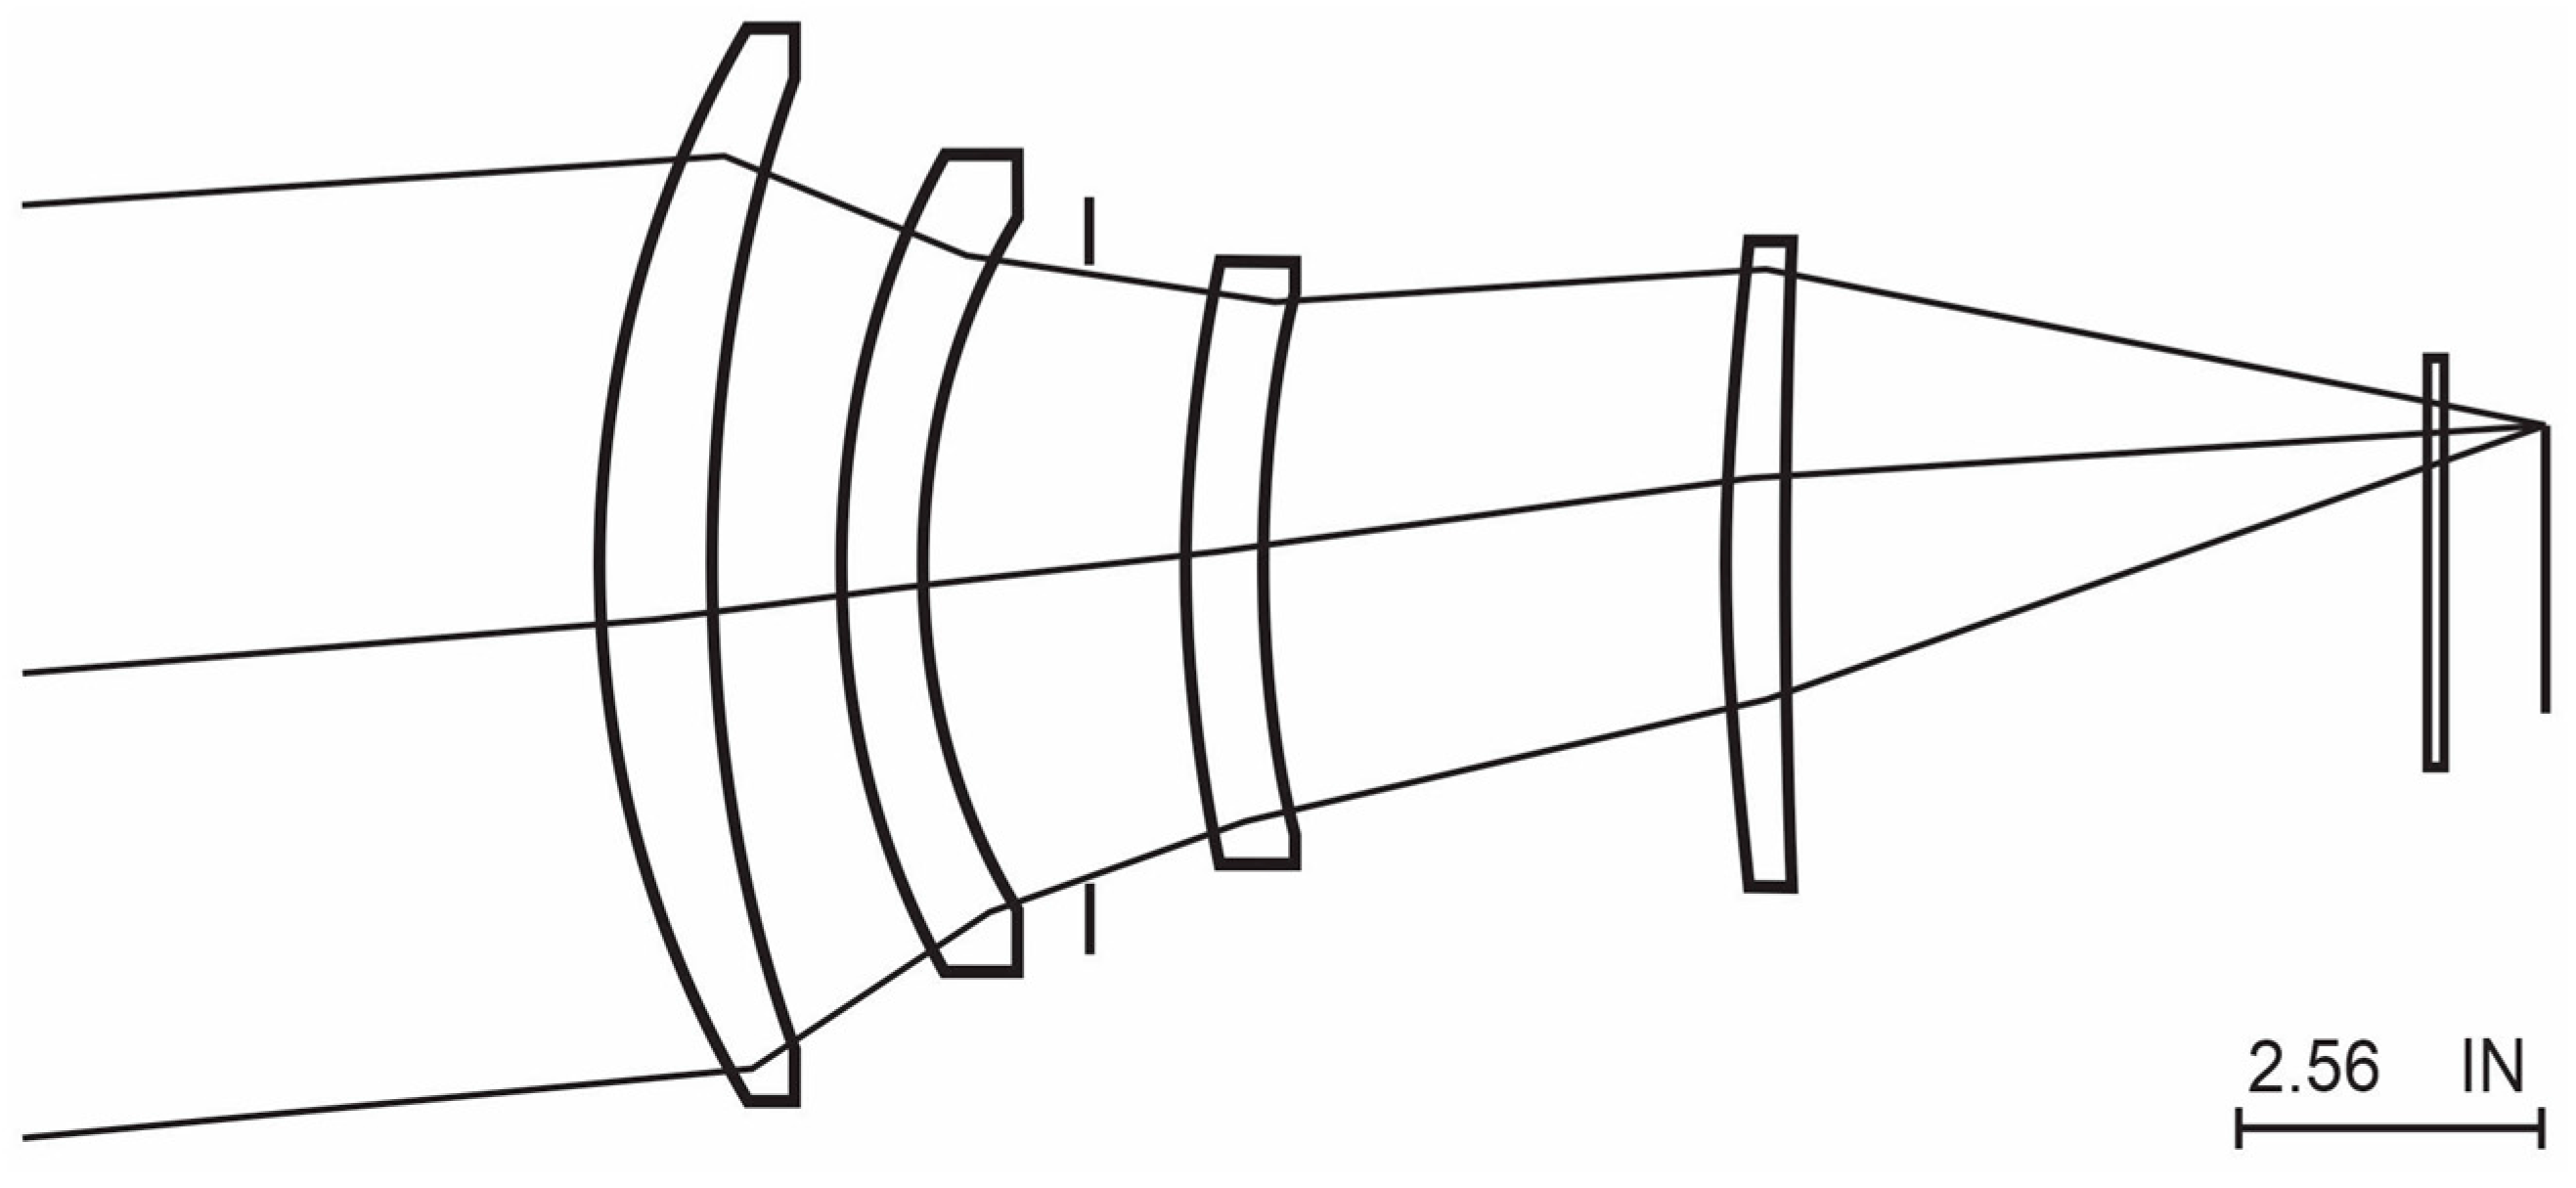
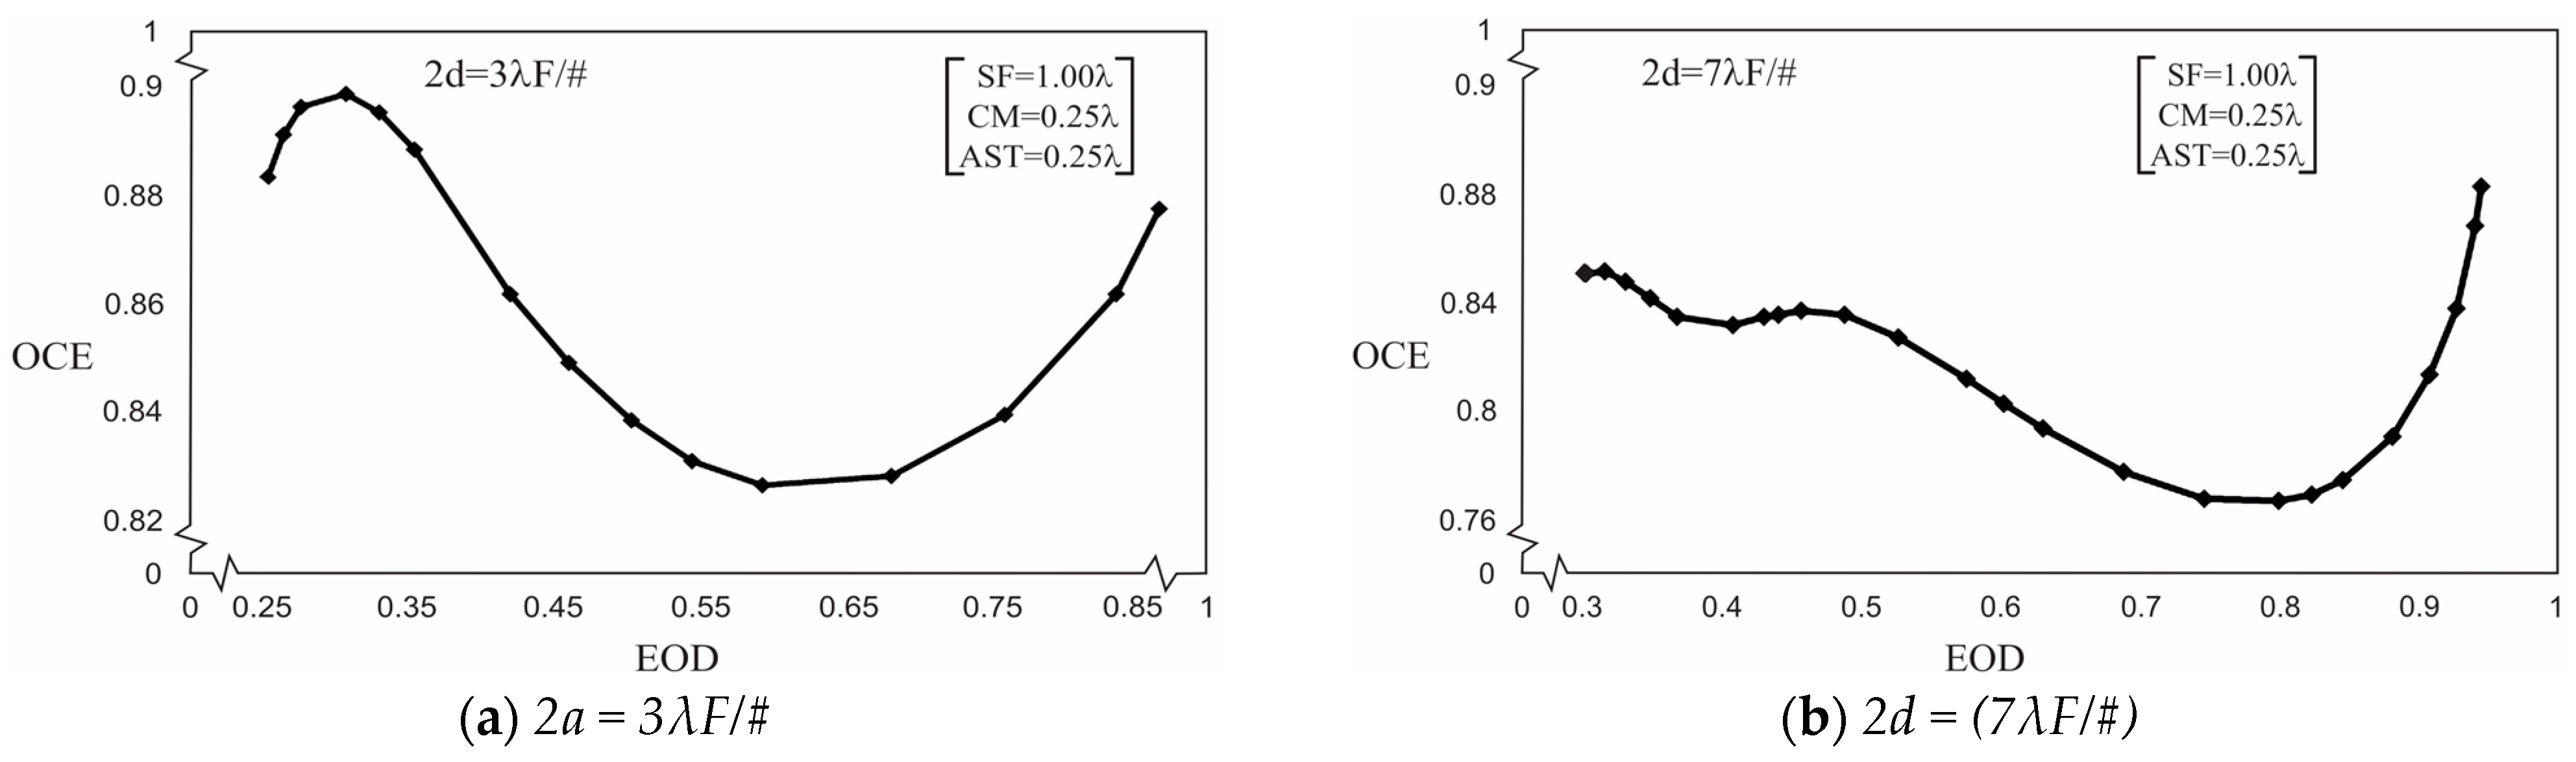
We next analyze the optical system with a 9° × 9° field of view. This concerns an F/2 four-element refractive design (FER), as featured in Figure 3. The aperture stop is located between the transmissive elements 2 and 3. A thin optical filter is inserted in front of the FPA to select the spectral band of interest within the IR range and potentially block visible wavelengths. A mix of third-order aberrations with a ratio of spherical to coma to astigmatism = 1:0.25:0:25 is added to the entrance pupil (on top of a small amount of design residual) in CodeV for two detector pixel sizes. Aberrations decrease proportionately from 1 λ for spherical aberration on the left, corresponding to the large EOD values.

Figure 3.
Schematic view of a transmissive (refractive) four-mirror infrared optical system to perform imaging in one of the standard IR spectral ranges.
The results are shown in Figure 4a,b. Figure 4a resembles that of Figure 2a except that the cone around the lower EOD peak in Figure 2a is sharper. Likewise, the shape of the graph in Figure 4b is similar to that in Figure 2b except that its first hump near EOD = 0.5 is not as obvious as the one in Figure 2a.
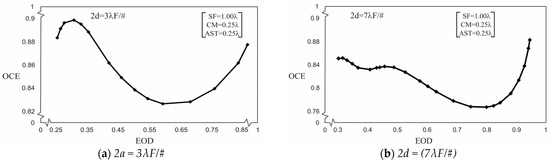
Figure 4.
The OCE as a function of the EOD with the proportion of aberrations; spherical to coma to astigmatism = (1:0.25:0.25) for (a) 2d = (3λF/#) and (b) 2d = (7λF/#) detector pixel and the optical/infrared system, as presented in Figure 3.
4. Discussion
The aberration-driven diffraction patterns incident on the group of pixels, rather than on a single pixel, result in the appearance of additional features in the shape of the OCE vs. EOD curves, compared to the aberration-free analyses presented in textbooks.
We believe that the domain of the EOD values below 0.5 is not appropriate for instrument design. Thus, we recommend that the pixel size be increased or the amount of aberration decreased until the EOD achieves a value of at least 0.65 for a reasonable design. Within the interval where the EOD is not an effective measure or where design parameters are not yet optimized, we find that OCE is likewise not an effective figure of merit because it is based on and derived from the EOD.
5. Conclusions
For the spherical aberration we note that the OCE increases with the EOD for large EOD values. The OCE predominantly decreases with the EOD for small EOD values, where the instrument design is neither feasible nor optimized for either pixel size. The region where the spot size is about equal to the pixel size results in an anomalous peak in the OCE. This is caused by the presence of regions where an increase in the pixel size results in insignificant increases in the EOD.
For electro-optical systems with sigmificant amounts of aberrations (more than 0.5 λ), larger pixel sizes (about twice the dimeter of the Airy disc) are recommended to achieve the same signal-to-noise (S/N) ratio, so it is at least feasible that the energy be absorbed by the same pixel. Aberrated lenses or imaging systems generate a large image blob, resulting in decreased instrument resolution. The shape of the OCE vs. EOD graphs for the transmissive four-element (FER) optical system is similar to that of a lens without any central obscuration and with similar amounts of aberrations.
We also presented a special case of linearization, and so the results of this prospective study might be useful to other users for their applications.
Author Contributions
Both authors contributed equally to this work. Conceptualization, Y.W.; investigation, M.S. and Y.W.; methodology, Y.W.; visualization, Y.W.; writing—original, Y.W.; writing—review and editing, M.S.; writing—final article. All authors have read and agreed to the published version of the manuscript.
Funding
This research received no external funding.
Institutional Review Board Statement
Not applicable.
Informed Consent Statement
Not applicable.
Data Availability Statement
Data are included in the paper.
Conflicts of Interest
Authors declare no conflict of interest.
References
- Born, M.; Wolf, E. Principles of Optics, 7th ed.; Cambridge U. Press: Cambridge, UK, 1999; p. 545. [Google Scholar]
- Lloyd, J.M. Thermal Imaging Systems; Plenum Press: New York, NY, USA, 1975; pp. 11–166. [Google Scholar]
- Strojnik, M.; Bravo-Medina, B.; Beltran-Gonzalez, A.; Wang, Y. Off-Axis Three-Mirror Optical System Designs: From Cooke’s Triplet to Remote Sensing and Surveying Instruments. Appl. Sci. 2023, 13, 8866. [Google Scholar] [CrossRef]
- Galan, M.; Strojnik, M.; Wang, Y. Design method for compact, achromatic, high-performance, solid catadioptric system (SoCatS), from visible to IR. Opt. Express 2019, 27, 142–149. [Google Scholar] [CrossRef] [PubMed]
- Strojnik, M.; Bravo-Medina, B.; Martin, R.; Wang, Y. Ensquared energy and optical centroid efficiency in optical sensors: Part 1, Theory. Photonics 2023, 10, 254. [Google Scholar] [CrossRef]


Disclaimer/Publisher’s Note: The statements, opinions and data contained in all publications are solely those of the individual author(s) and contributor(s) and not of MDPI and/or the editor(s). MDPI and/or the editor(s) disclaim responsibility for any injury to people or property resulting from any ideas, methods, instructions or products referred to in the content. |
© 2023 by the authors. Licensee MDPI, Basel, Switzerland. This article is an open access article distributed under the terms and conditions of the Creative Commons Attribution (CC BY) license (https://creativecommons.org/licenses/by/4.0/).