Abstract
Settlements situated downstream of hills and dams are invariably at risk of floods. Constant land use/land cover changes in the Vishwamitri Watershed and long-term climate variability have made Vadodara City more susceptible to river flooding in recent times. In the past, the local government authorities have only tried to solve this issue within the administrative boundary of the Vadodara City. This study demonstrates the importance of watershed scale investigation over administrative scale. The study presents a review of the current flooding and environmental degradation challenges that are affecting the Vishwamitri Watershed. For the analysis, the entire watershed was classified into two parts: (1) the upper watershed and (2) city limits. The data-deficient upper watershed was studied with the aid of site visits and secondary sources. The floodplain within the city limits was simulated for the 2005 peak discharge event (805 cumec) using Hydrological Engineering Centre—River Analysis System (HEC-RAS, 5.0.7.) software and HEC-GeoRAS (10.2.) (a set of procedures, tools, and utilities for processing geospatial data in ArcGIS using a graphical user interface). The simulated water surface elevation from HEC-RAS was validated with the in situ data available within the city limits. The generated floodplain extent map was used for conducting a primary flood impact survey and analysing the inundation-affected zones. Various aspects of the flood plain, like land use, land cover, built form, affected demography, river system, natural environment and habitat, were analysed during this survey. For the mitigation of floods and other maladies associated with the watershed, this probing calls for the restoration of the river ecosystem back to its original state to the maximum possible extent. Nature-based solutions were found to be the remedy for most of the issues pertaining to the floodplain. The study can potentially help concerned stakeholders of any flood-prone urban settlement to envision the issue of flooding with the whole river system and watershed in mind. This will discourage the usual approach of interventions limited to administrative boundaries.
1. Introduction
Vishwamitri River has been a magnet for numerous settlements since ancient times [1]. In the past, several kingdoms have ruled the imperial province of Baroda containing the river. Because of many significant developments, the reign of Maharaja Sayajirao Gaekwad III is considered the golden era of Baroda [1]. One such development was the Sayaji Sarovar (Ajwa) Dam, built on the Surya River. It was conceived as a water supply scheme to provide drinking water for Vadodara City using gravity [2]. In addition, there have been consequential land use/land cover changes in the entire watershed to meet the demand of the growing population and urban settlements. Nonetheless, an amalgamation of these interferences to the natural environment has caused an increase in the frequency and risk of flood events by altering watershed hydrology and geomorphic processes [3].
Vadodara City has experienced floods in 2005, 2006, 2013, 2014 and 2019 in the recent past [4]. Various influences located within the city have played a role in exacerbating the damage during such extreme events. Some of these factors are floodplain encroachment by urbanization, riparian vegetation loss, bank erosion, siltation and river pollution. Hence, apart from being prone to floods, the Vishwamitri River, like most urban rivers, is in an impaired state. Rivers suffering from “urban stream syndrome” of such a magnitude need immediate attention.
The river ecosystem is home to a variety of flora and fauna. While species like leopards, bears, pythons, nilgais and eagles are currently found in the upper watershed, endangered species like mugger crocodiles and softshell turtles are primarily limited to the city limits [5]. Further, there have been several instances of encounters between crocodiles and humans during flood events. Consequently, maintaining a safe habitat for these species is crucial for their survival.
There have been several proposals in the past to mitigate the flood risk in the city and to improve the river environment. In 2008, the Vishwamitri Re-sectioning and Rejuvenation Project was launched, which aimed at increasing the flood-carrying capacity of the river, strengthening bridges, rehabilitating slums, and finding solid waste management solutions [6]. Then, Vaho Vishwamitri Abhiyan was set in motion in 2012. It targeted the installation of bio shields to create an everlasting flow of clean water in the river for the sustenance of wildlife and the propagation of organic farming practices for environmental conservation [7]. Lastly, the most serious attempt at mitigating the flood risk in Vadodara City was proposed by the Vadodara Municipal Corporation (VMC) (Vadodara, India) in 2014 [8]. With comprehensive specifications and goals for the future of the river, this riverfront project ran full-fledged till 2016 before it was put to a halt by the National Green Tribunal on grounds of environmental clearance [9]. In conclusion, at the time of this study, there is no clear future vision for the watershed.
This paper focuses on the study of the existing flooding and natural/built conditions of the Vishwamitri Watershed with the help of flood inundation software (HEC-RAS), secondary data and a primary survey. After a thorough analysis of the situation, suitable proposals are finally suggested.
2. Study Area
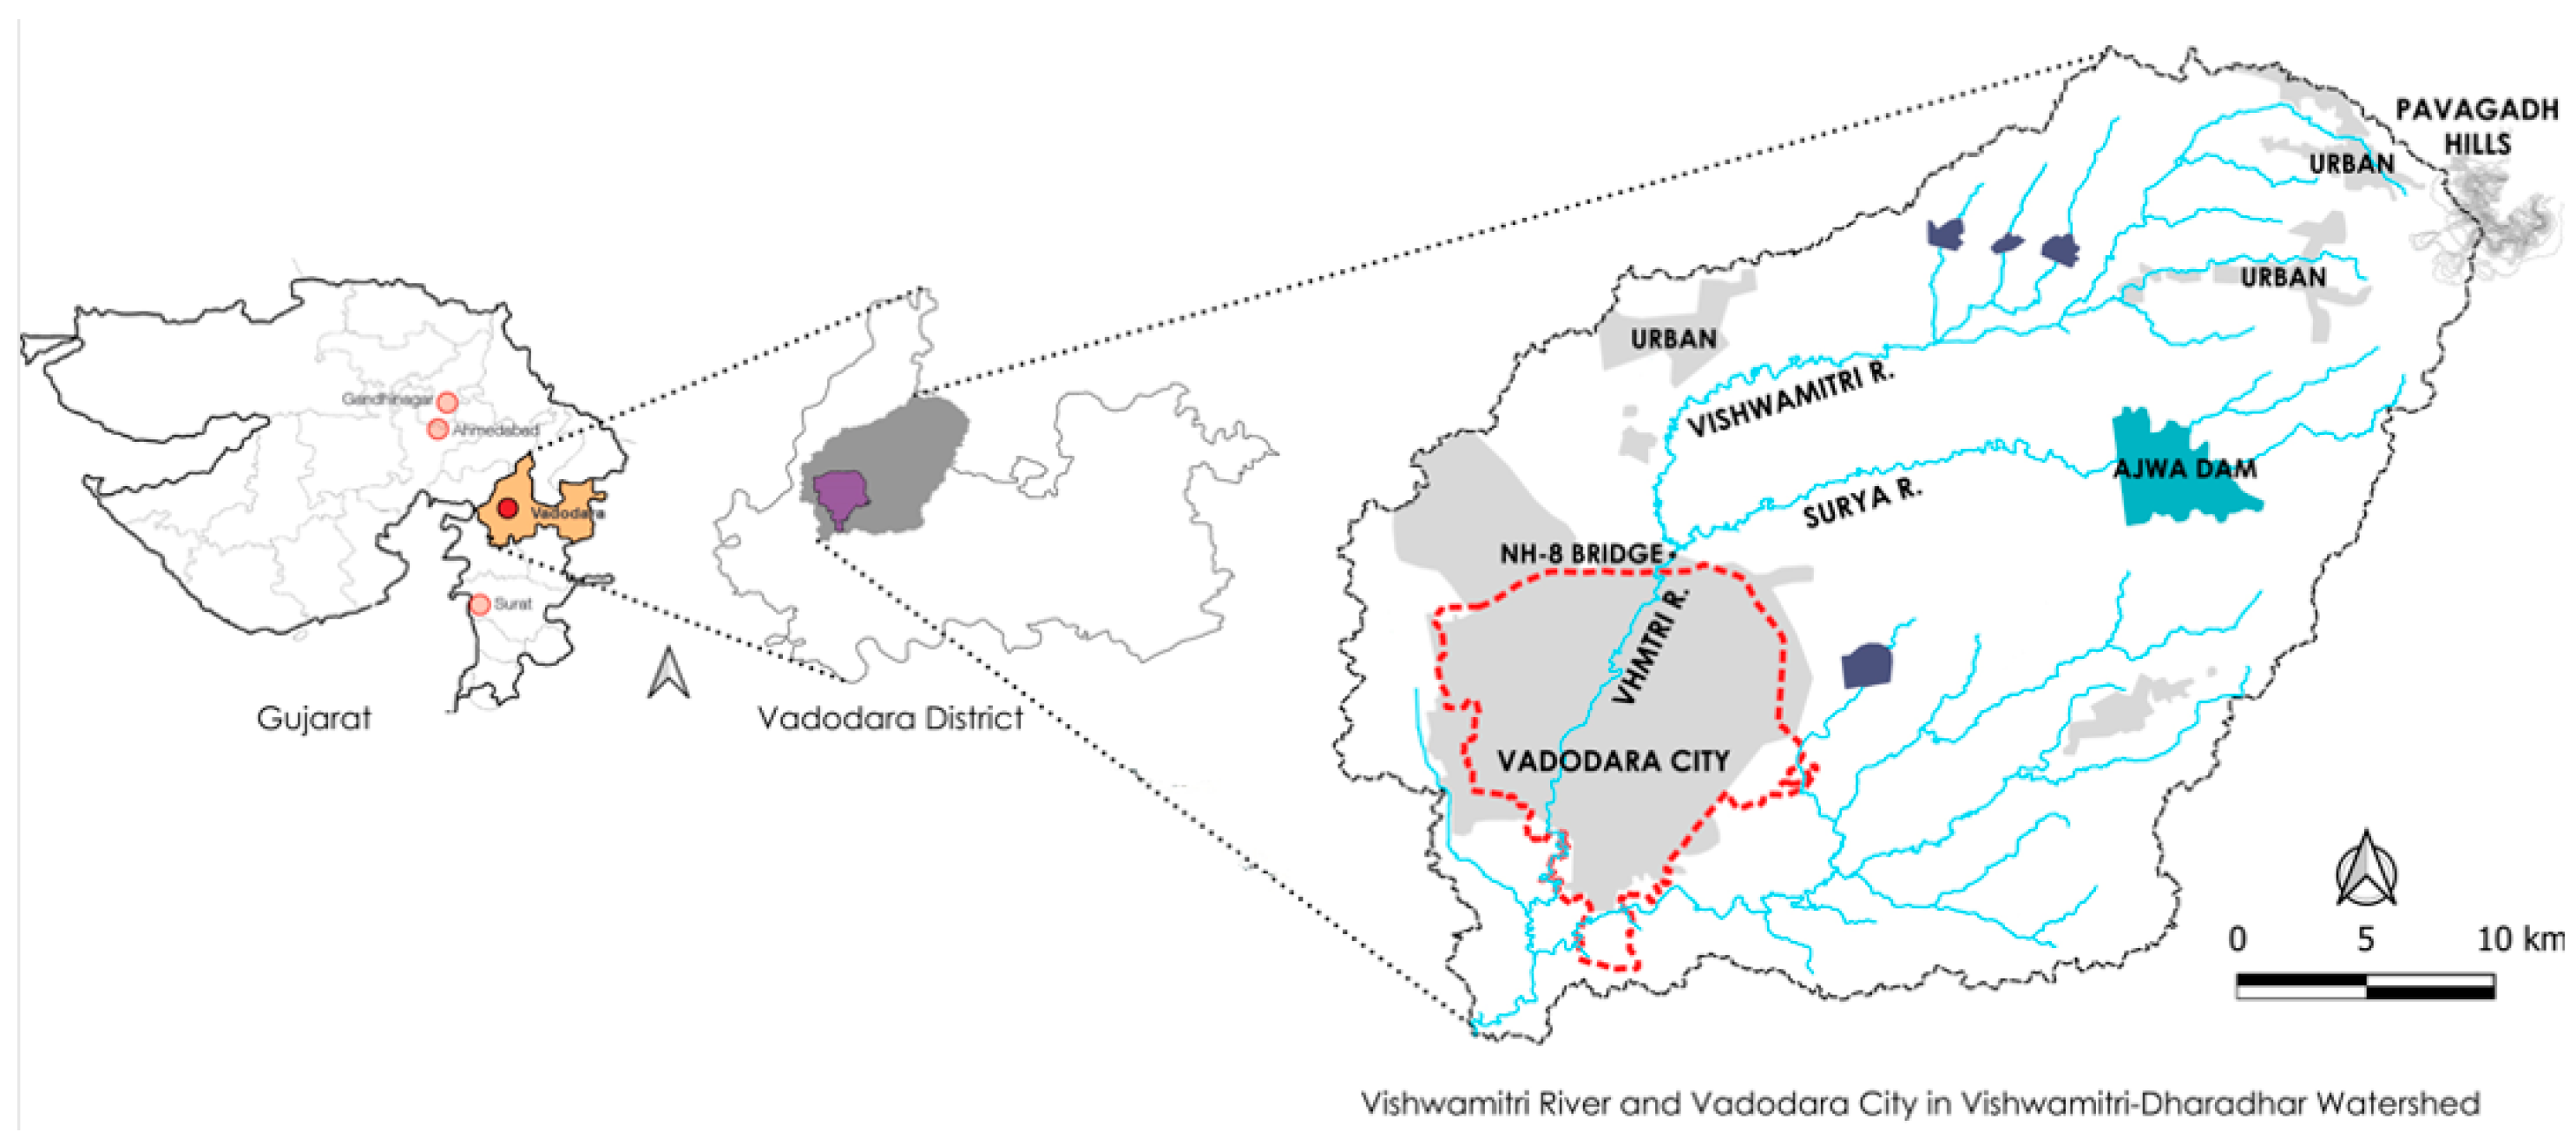
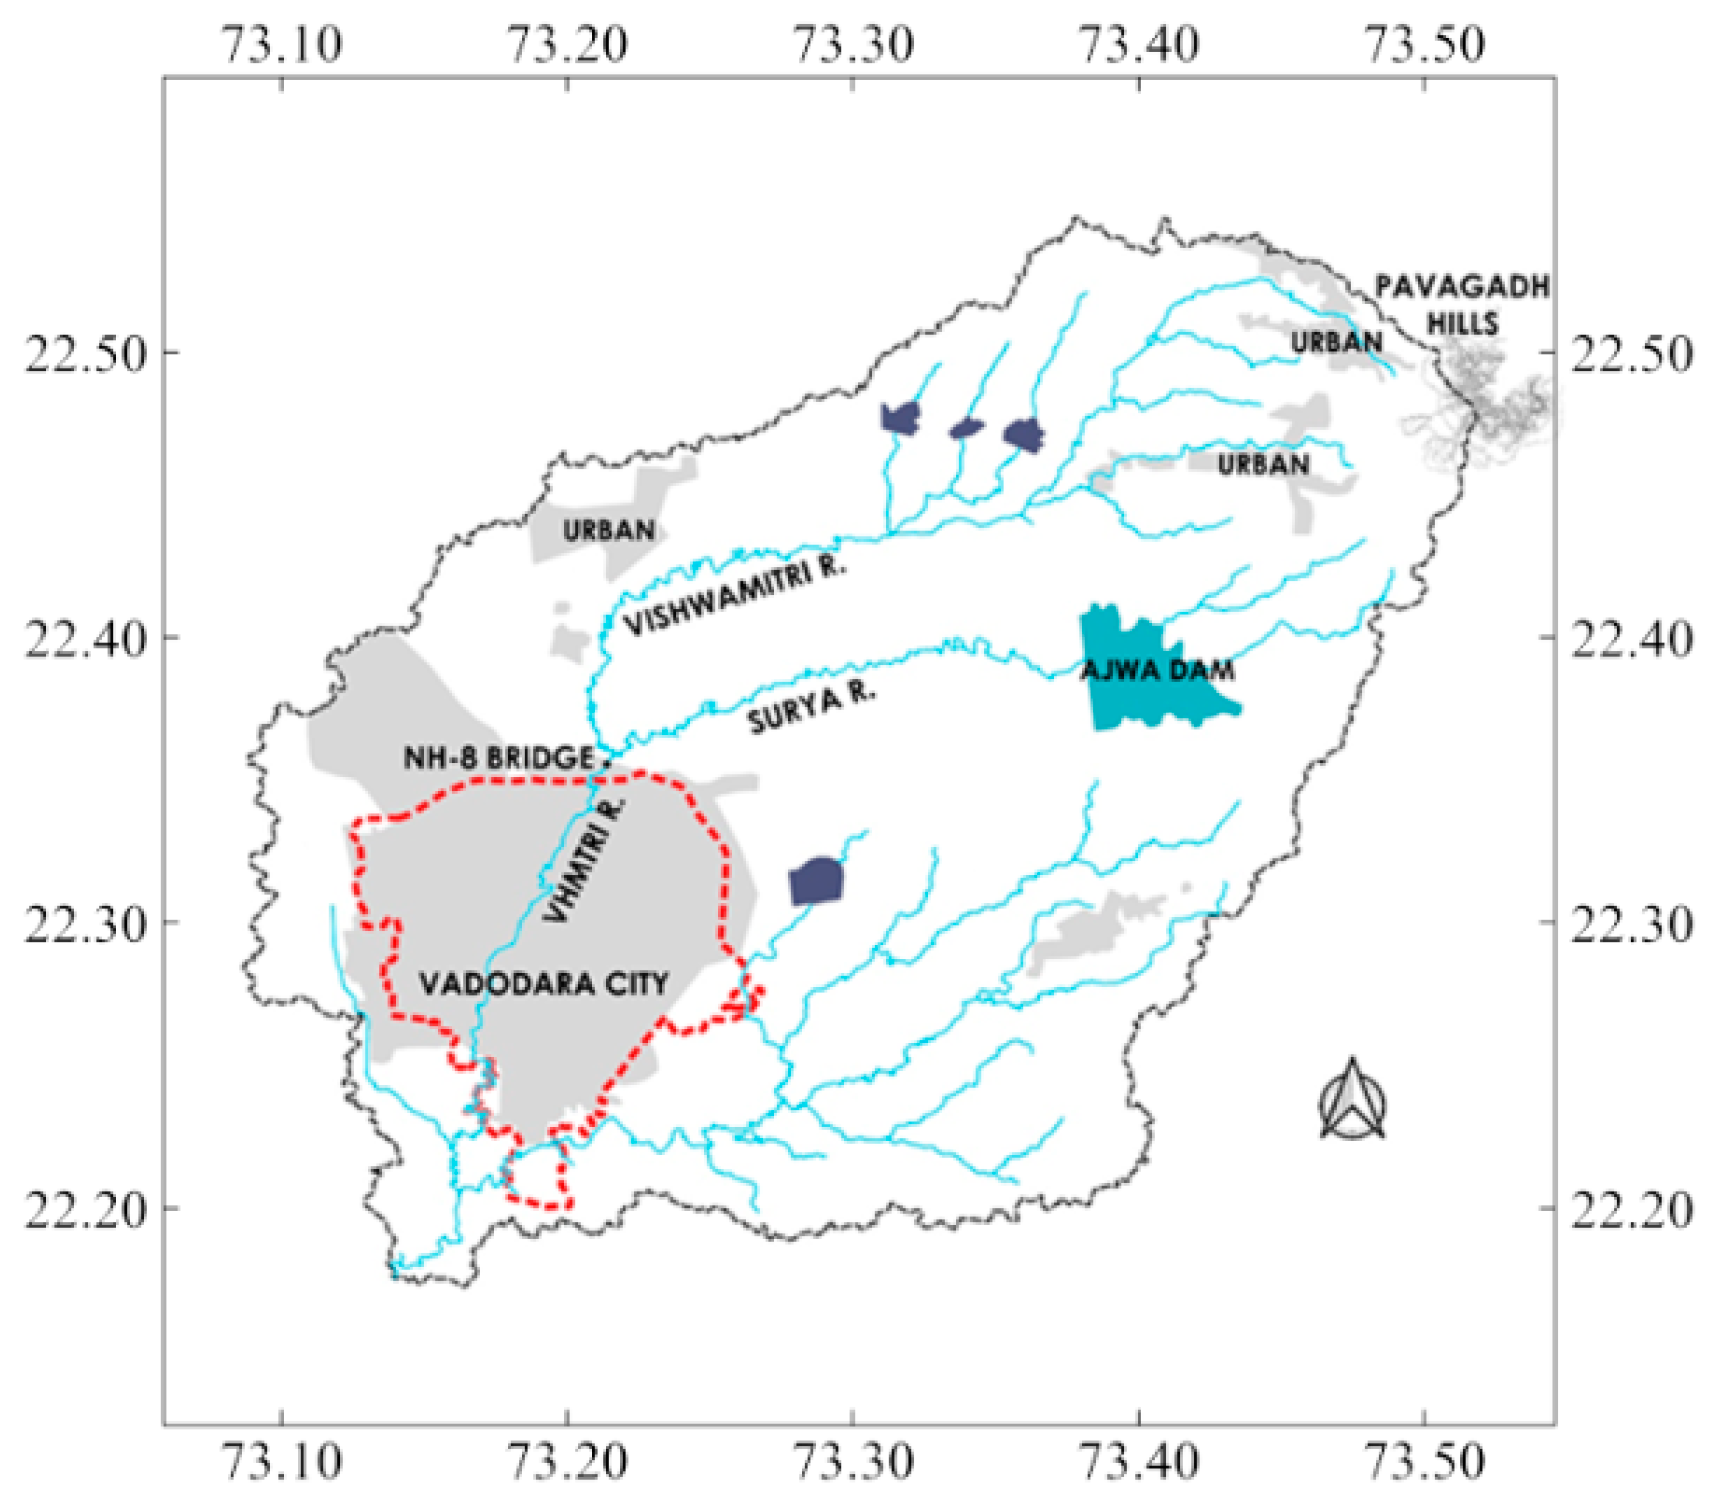
Figure 1 shows the location of Vishwamitri Watershed within the Vadodara District in Gujarat State, India. Vadodara City is the third largest city in the state of Gujarat, India. The city is located at latitude 22.3072° N and longitude 73.1812° E (Figure 2). Vishwamitri River passes through the heart of the Vadodara City.

Figure 1.
Location of Vishwamitri Watershed in Gujarat, India.

Figure 2.
Vishwamitri Watershed.
Most of the Vishwamitri–Dhadhar watershed lies in the Vadodara district, while some of it lies in the Panchmahal District of Gujarat. Originating from the Pavagadh Hills in the Panchmahal district of Gujarat, the Vishwamitri River flows downstream in a southwest direction towards Vadodara City. The river is joined by the Surya River tributary, which carries water from Sayaji Sarovar Dam (Ajwa Dam) right before entering the city of Vadodara. The dam and the degradation of the ecosystem in the upper watershed are the primary causes of floods in Vadodara City. Vishwamitri is a seasonal river that remains mostly dry during non-monsoonal seasons over most stretches.
3. Sampling
Since the floodplain of the Vishwamitri River in Vadodara City is not confined to any administrative boundary, Cochran’s Formula was used to calculate the sample size for the primary survey. This method requires less data for sample size calculation [10]. The formula permits the calculation of the ideal sample size using the estimated proportion of the attributes present in the population with the desired confidence level and precision. The calculated sample size for the targeted study area (floodplain within the Vadodara City limits) was 384 with a 95% confidence interval and Z-Value of 1.96.
4. Data
Yearly peak discharge data for the river from 2004 to 2019 at National Highway 8 Bridge was obtained from the Futuristic Cell of Vadodara Municipal Corporation (VMC) (Table 1). Water surface elevation at Kalaghoda Bridge was obtained from the Fire Department, VMC. Data pertaining to Sayaji Sarovar Dam was provided by the Water Works Department, VMC. Details about flora and fauna of the region were taken from Sayaji Baug Zoo. Also, the primary flood survey was conducted within the simulated floodplain on both sides of the river to study existing conditions. A total of 385 samples were collected during the primary survey.

Table 1.
Yearly flood detail (source: Vadodara Municipal Corporation).
5. Analysis
Findings from flood modelling, visual surveys, primary surveys and secondary information were examined in connection with each other to obtain an overall picture of the entire watershed as well as to understand the individual parts of the river, e.g., the flood-affected zones. Therefore, the analysis for this study transitions from a macro- to a micro-scale. While the upper watershed, due to lack of sufficient secondary data and urban accessibility, could only be studied at a macro-scale, Vadodara City posed little hindrance to a more detailed analysis.
5.1. Upper Watershed
As shown in Figure 3, at the macro-scale, the region of the upper watershed mainly holds agricultural lands, forest cover, the Sayaji Sarovar Dam, a few urban settlements and some human-made lakes [11]. In the upper watershed, the changes in land use/land cover, such as the loss of forest cover, loss of riparian vegetation along the river banks, agricultural land replacing forest cover, urban settlements replacing agricultural and forest lands and incremental siltation of the existing dam, affect the volume and velocity of water and sediment load entering the city [12].
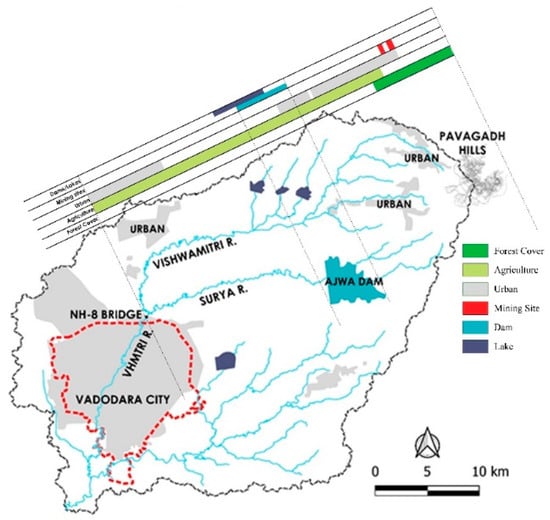
Figure 3.
Macro land use of the upper watershed.
A wide variety of flora and fauna is found in the upper watershed compared to that found within the extent of Vadodara City [5]. The upper watershed has protected forest cover near Pavagadh Hills and a rich riparian buffer at many stretches that is home to species like leopards, bears, pythons, nilgais and eagles, etc. [5]. Due to lesser human intervention in the upper watershed, water quality is better than what can be seen within the city limits [13]. There are two major tributaries, namely Viswamitri and Surya, which confluence right before entering the city [11].
Agricultural lands constitute the majority of land cover in the upper watershed, approximately 80% of the total upper watershed cover area [11]. Some of these agricultural lands located near the river banks were developed at the cost of riparian vegetation along the banks, while croplands were developed at the cost of forest cover [14]. These lands located near river banks are prone to heavy erosion and soil degradation. The sediments eroded from these lands are taken downstream to the city, which, in turn, deposits and reduces the carrying capacity of the river there [15].
Forests can be seen in the upper watershed, confined to the hills of Pavagadh. Vegetation cover near the hills has significantly reduced. It can be observed through temporal images in Google Earth that less than half of the forest cover currently remains of what could be seen in the 1980s. Deforestation causes negative impacts on river systems. Forests promote infiltration and the detention of runoff water while protecting the soil from erosion. It also reduces the velocity of flow [16]. Soil erosion due to high velocity and volume of water near hills has increased in the last few decades [11]. The carrying capacity of the Sayaji Sarovar Dam is slowly reducing each year due to sediment deposits at its bottom. This sediment load comes from agricultural lands located upstream of the dam. Moreover, often during monsoon seasons, water overflows the dam with a huge surge and heads towards the city along the Surya River tributary. This surge carries a large volume of water and sediment load downstream, due to which the area adjacent to the dam outflow is in an impaired state at present [17]. There is a need to reduce the volume and velocity of water from the dam.
Few settlements already exist in the upper watershed, and new ones are also coming up due to increased commercial and mining activities. As settlements in the upper watershed expand, there will be a change in the flow dynamics, leading to widespread symptoms of urban stream syndrome. Growing urbanization will bring in additional impervious surfaces and grey infrastructure connections to the hydrological cycle, which might exacerbate the issue further. [18].
5.2. City Limits
There have been many attempts to study the city floodplain in the last two decades after Vadodara started facing severe floods. Some parts of the river are prone to inundation, even after a low discharge from upstream. Initially, the authorities were only concerned with these high-risk areas. Later, the VMC realized the importance of a city-wide scheme to reduce the effects of floods. This can be seen in the Vishwamitri Riverfront Development Project (VRDP), 2014. The inclusion of local people and concern about the natural environment are some of the aspects that the VRDP approach lacked. In this study, these facets are extensively covered for the floodplain created by the highest recorded discharge of 805 cumecs in HEC-RAS.
5.2.1. D HEC-RAS Modelling
HEC-RAS (Hydrologic Engineer Centre-River Analysis System) is an open-source and widely used software tool for open channel flow analysis. It has multiple applications in 1D and 2D simulations of water flow, space–time flood evolution, sediment transport modelling and the preparation of flood (extent, velocity and depth) maps. A 1D flood hazard model for the peak discharge in the year 2005 (805 cumecs) was generated using HEC-RAS 5.0.7. software developed by the United States Army Corps of Engineers (USACE) and HEC-GeoRAS 10.2., which is an auxiliary module for ArcGIS 10.2. The most common uses of the 1D HEC-RAS model are the statistical analysis of small- and medium-scale catchment basins and the assessment of flood-prone areas [19]. Two stages were involved in 1D HEC-RAS modelling for floodplains within Vadodara City.
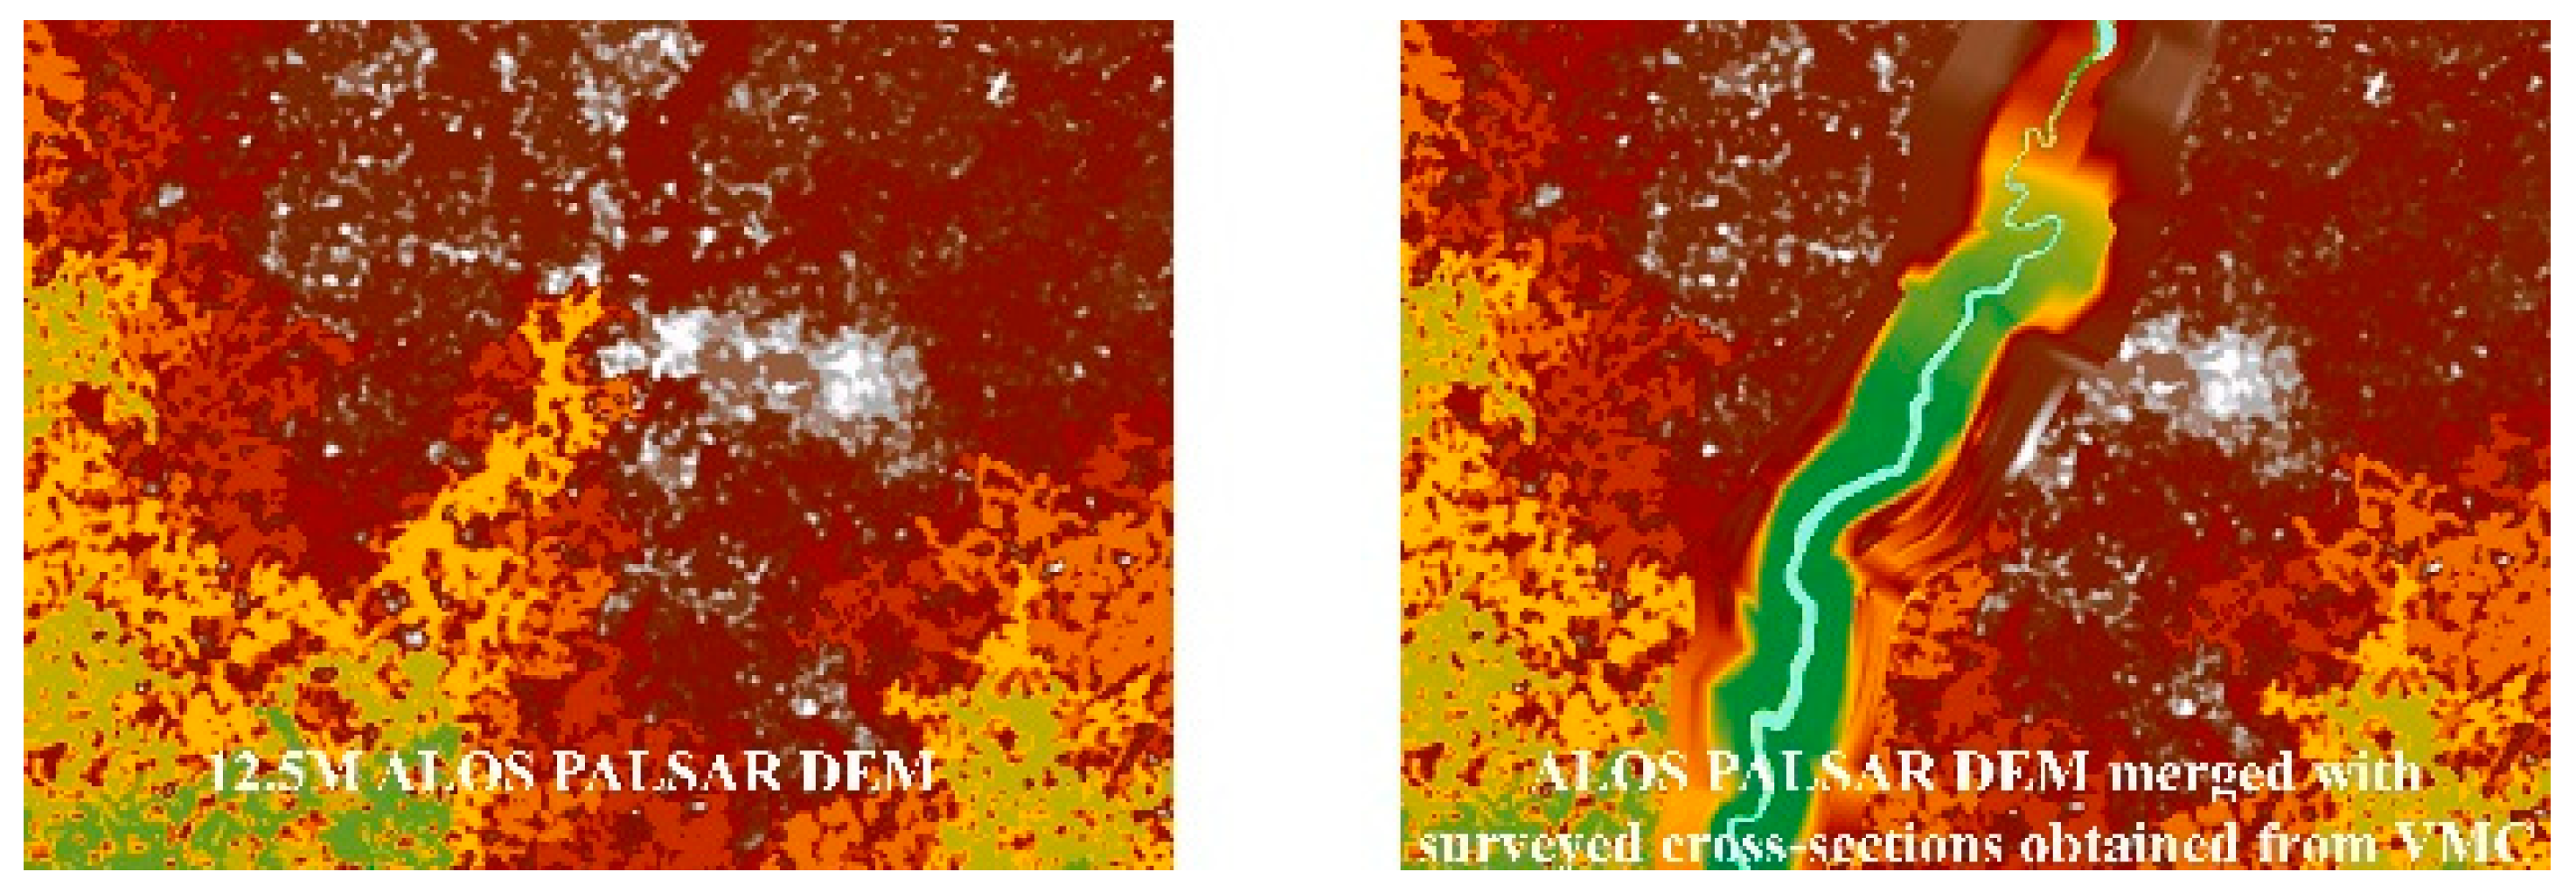
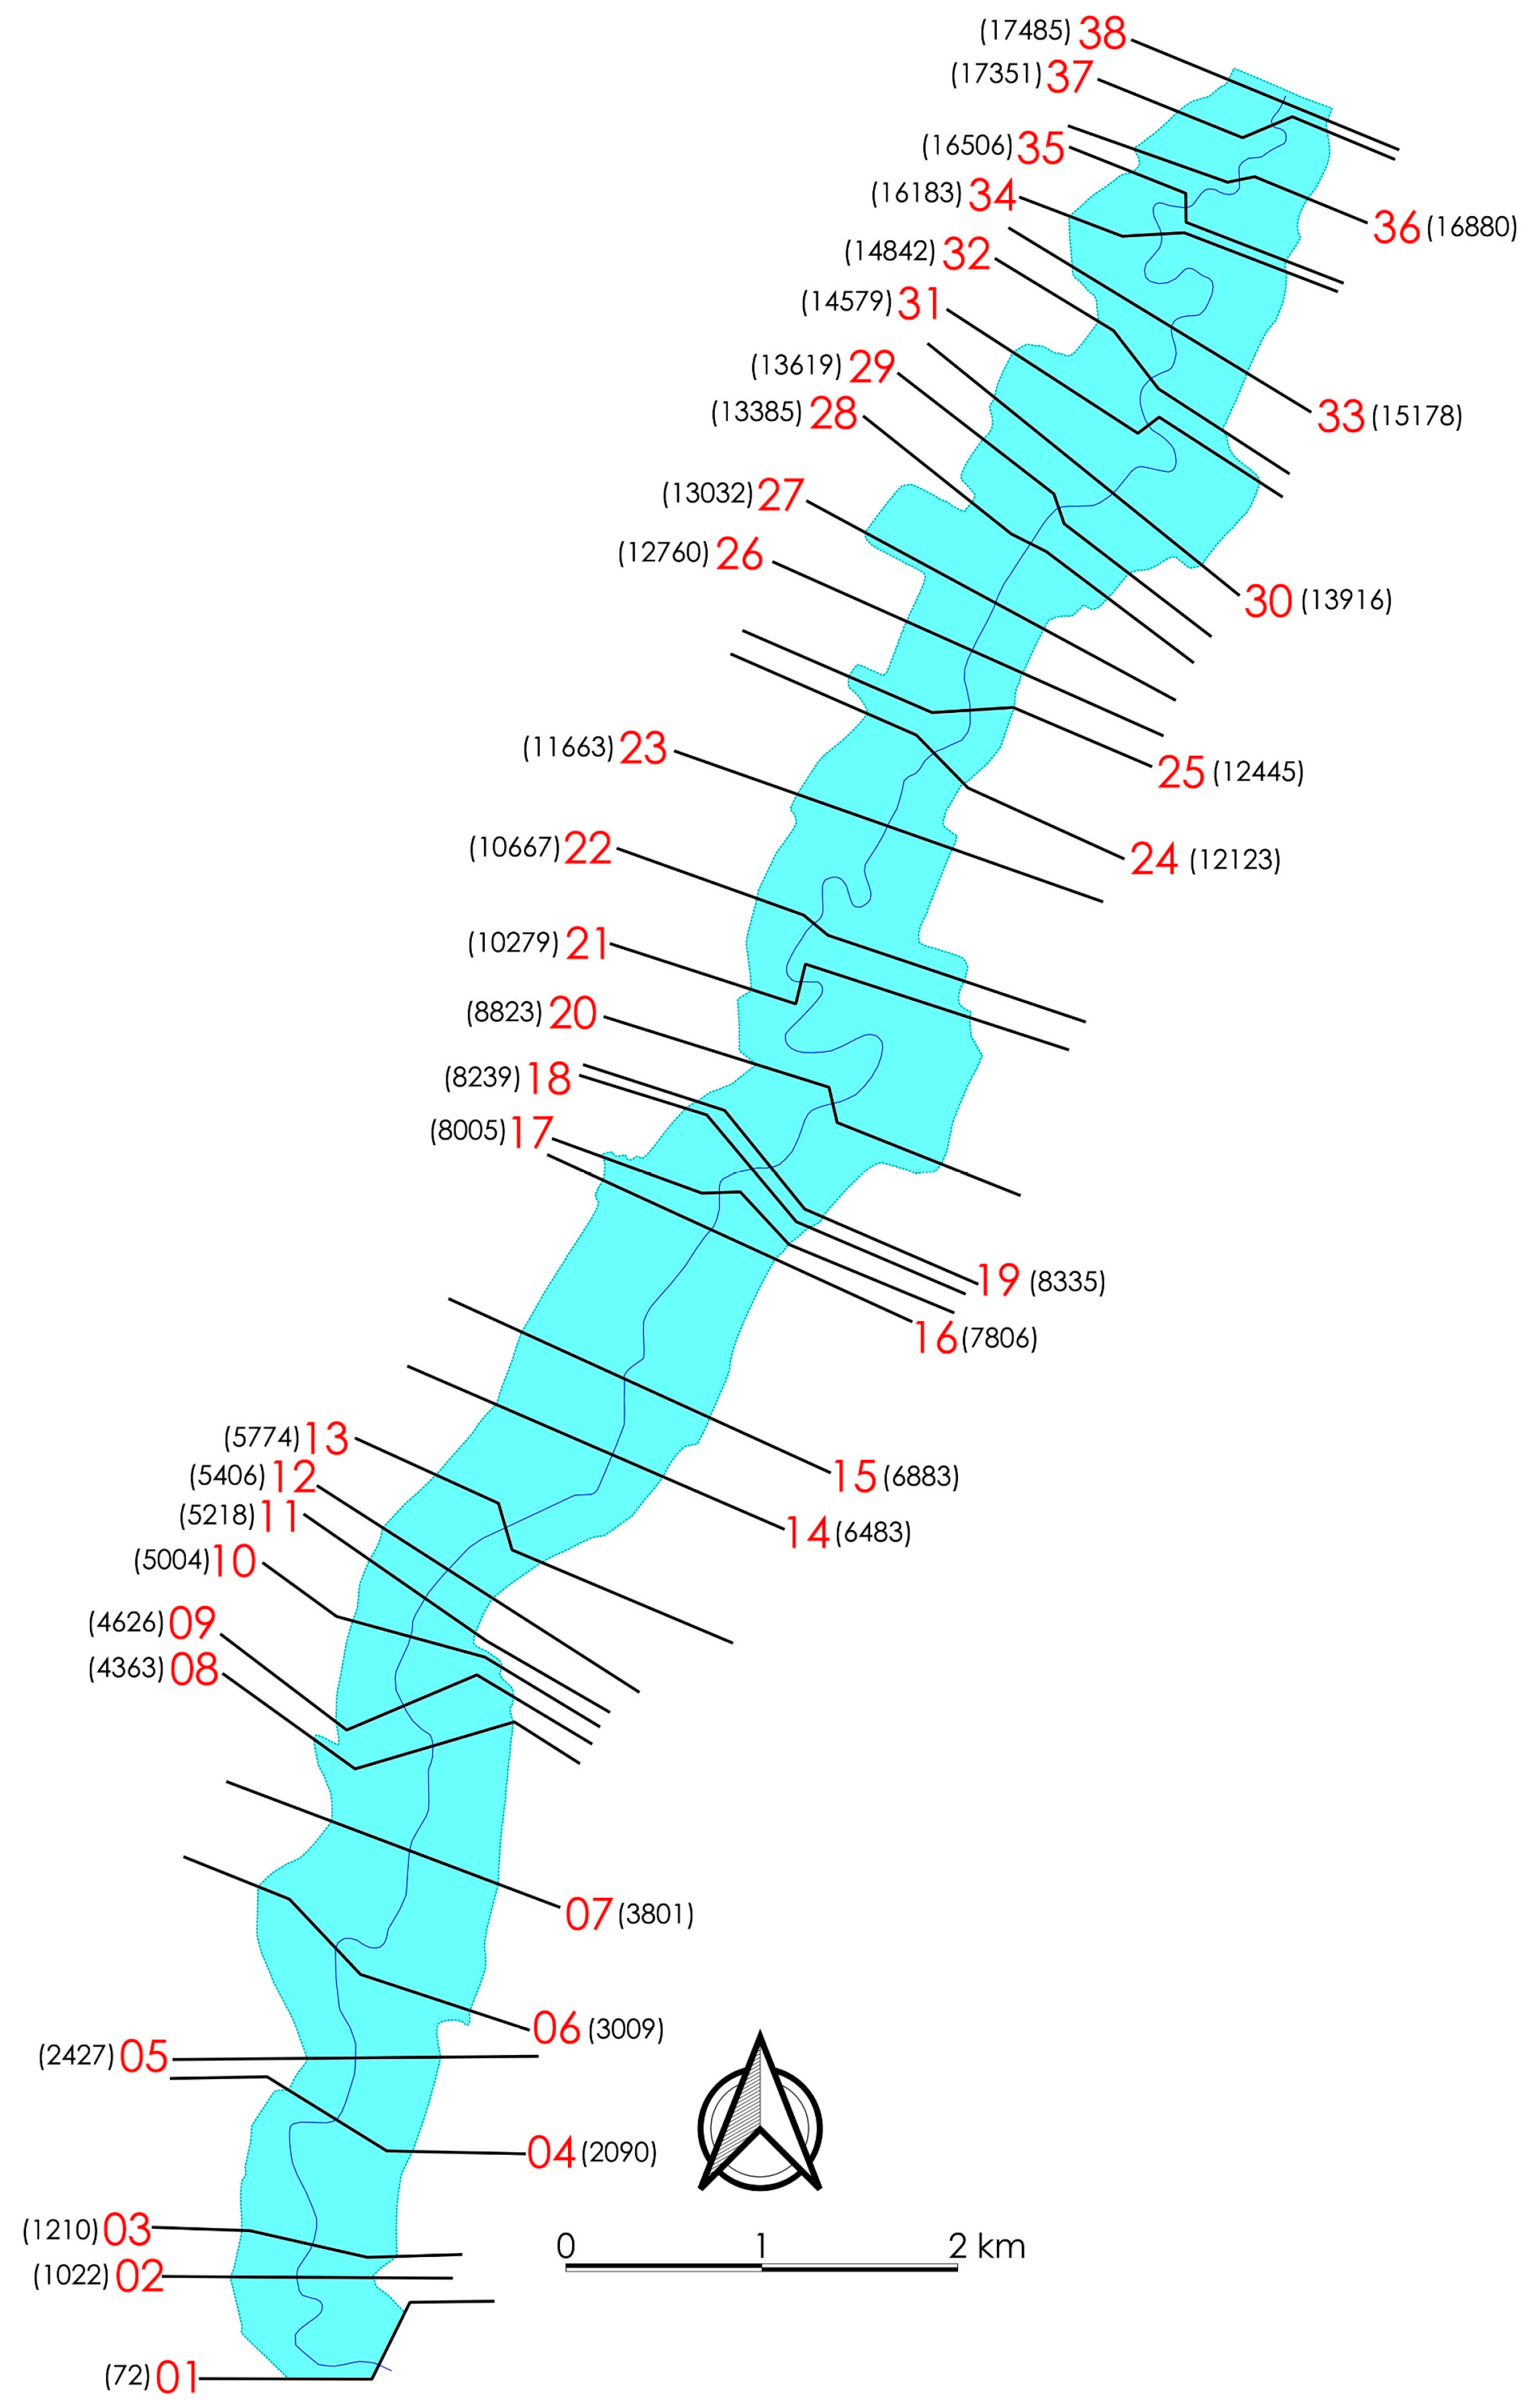
Stage 1: This pre-processing step involved the preparation of data. Surveyed river cross-sections obtained from Vadodara Municipal Corporation were merged with 12.5 m × 12.5 m ALOS PALSAR DEM from USGS in the RAS Mapper window in HEC-RAS to generate more accurate terrain data (Figure 4). In addition, thematic vector layers (river channel, stream centerline, river bank lines, flow path centerlines, cross-sections) were digitized and given attributes in ArcGIS 10.2. using the RAS Geometry tool of HEC-GeoRAS. A total of 38 cross-sections with 150–1000 m intervals between them were manually digitized in accordance with geomorphological and hydrological rules, such as no intersections between cross-sections, from the left bank to the right bank, perpendicularity to the thalweg and spring to spill. Finally, satellite images were obtained to determine the Manning roughness coefficient (n).
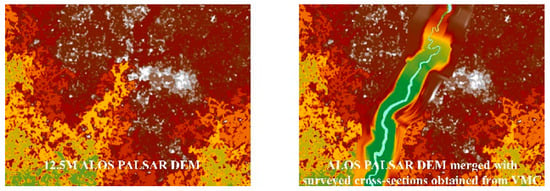
Figure 4.
Making DEM accurate.
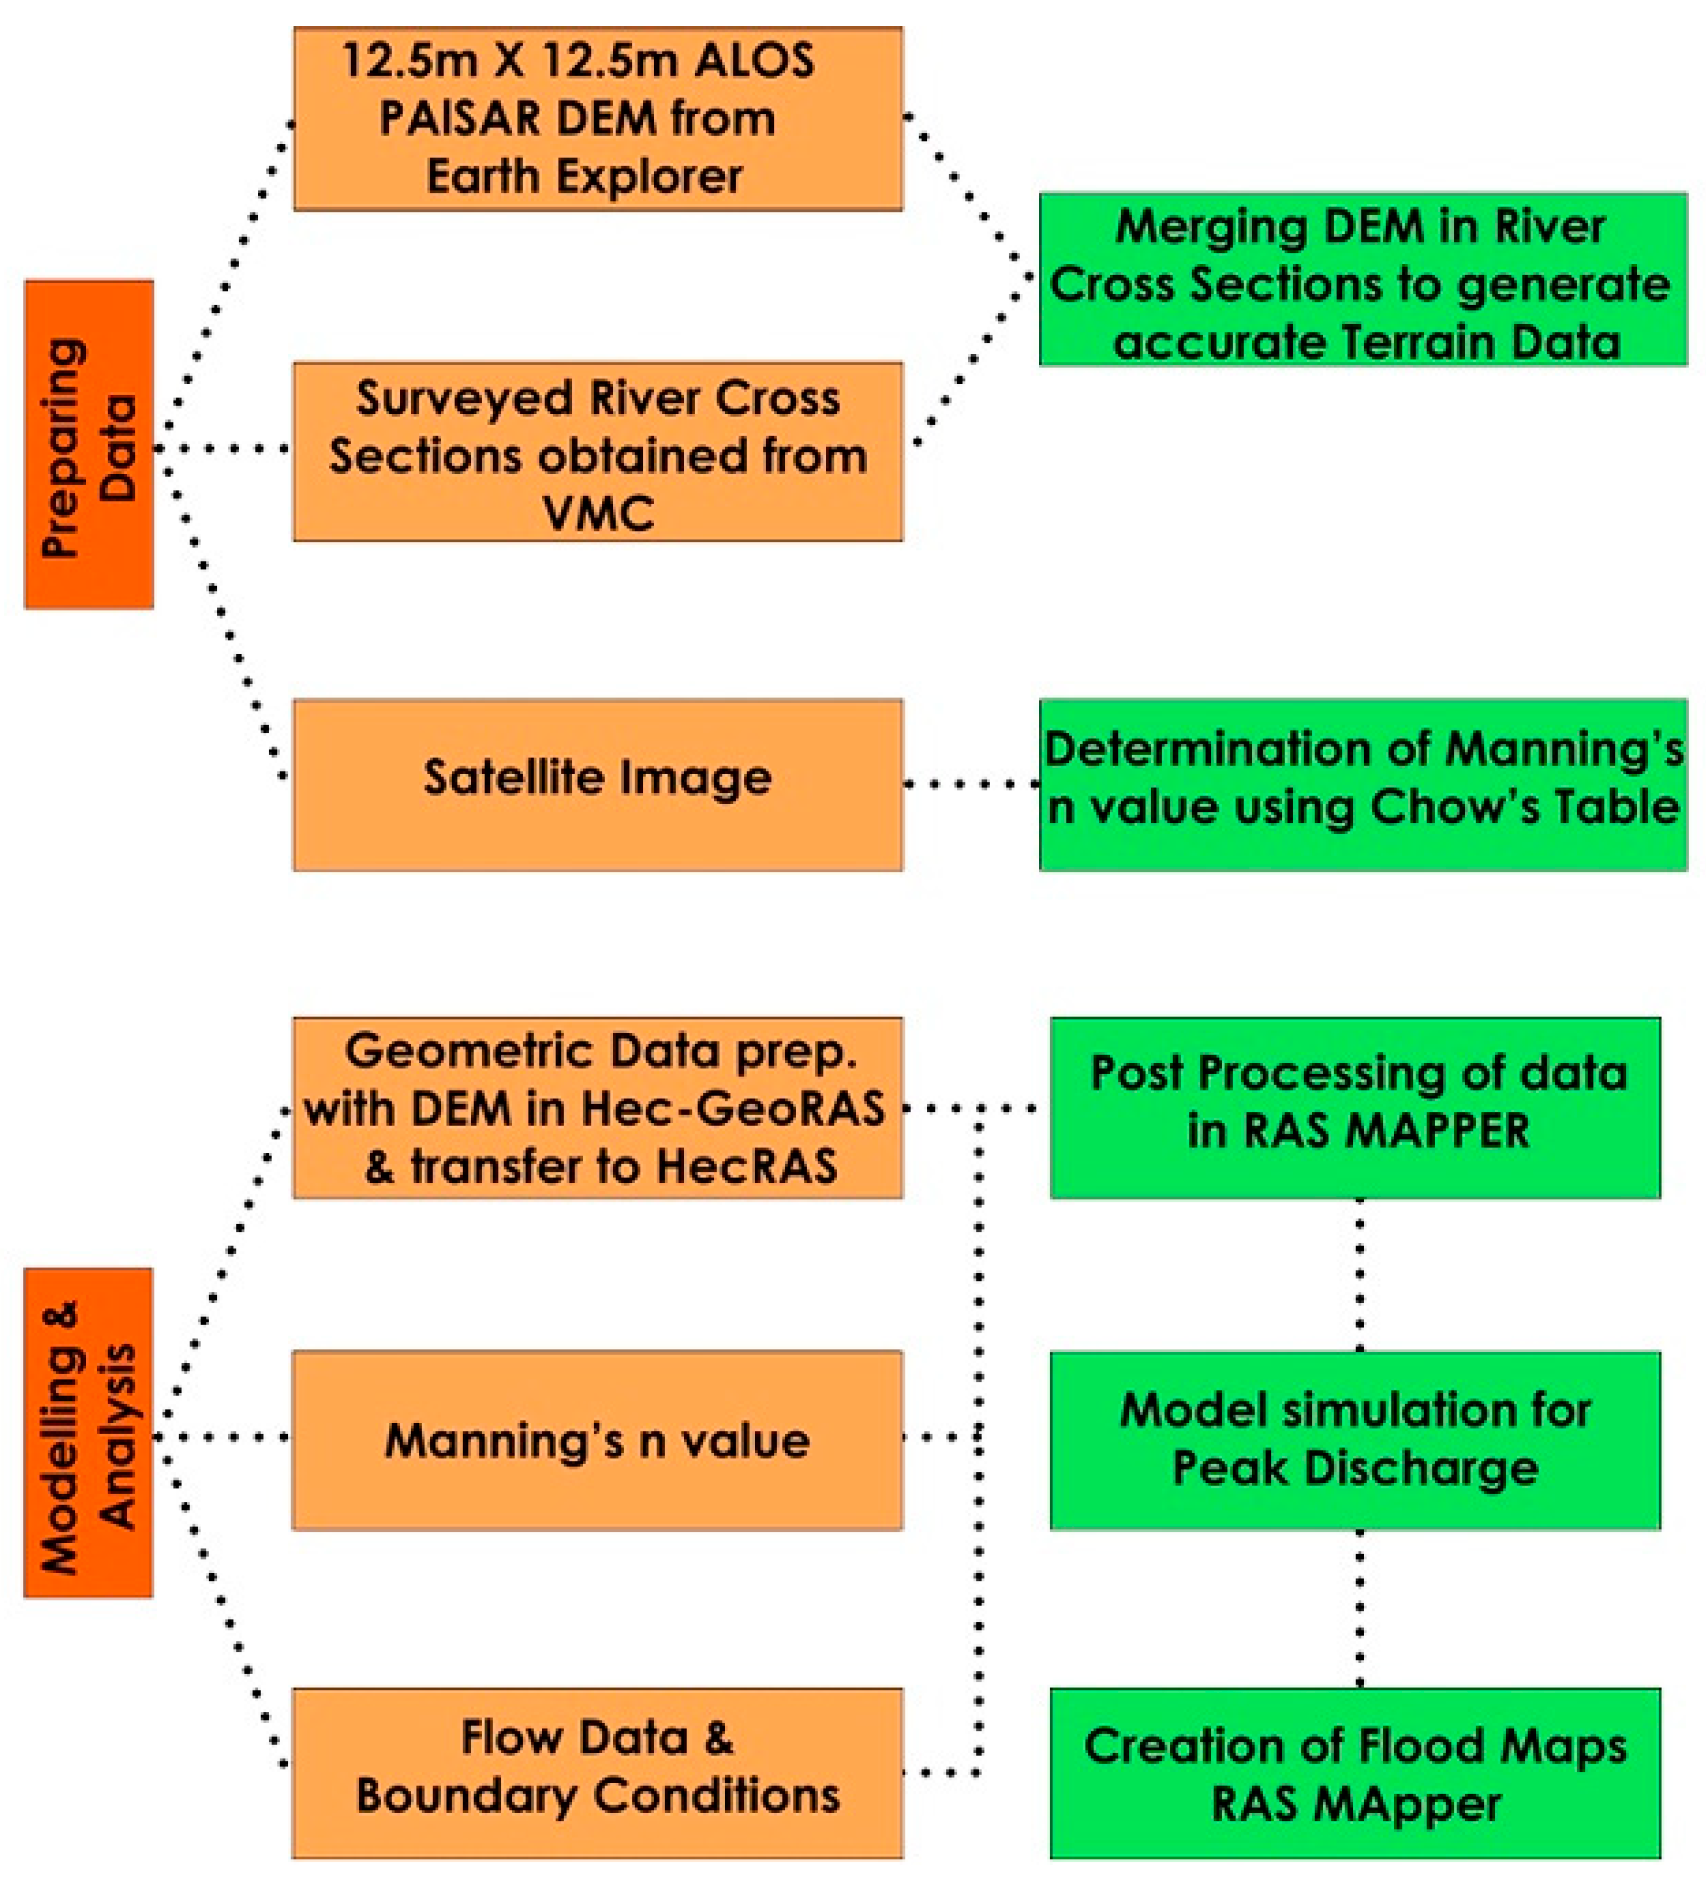
Stage 2: This step constituted the import of variables (geometry data, flow data, Manning’s Roughness Coefficient and boundary conditions) into HEC-RAS to run the simulation. Firstly, geometry data prepared using HEC-GeoRAS were imported to HEC-RAS. Then, from the land use class of each cross-section, Manning’s (n) value was calculated. At last, the steady flow data for the 2005 flood event were entered, and the boundary condition (normal depth) was assigned to the geometric and terrain data. Post-processing was conducted in RAS Mapper itself to generate the flood pattern. Finally, the 1D HEC-RAS model was run, and flood maps were created. The methodology for 1D HEC-RAS flood modeling is shown in Figure 5 and the flood-plain map generated in HEC-RAS is shown in Figure 6.
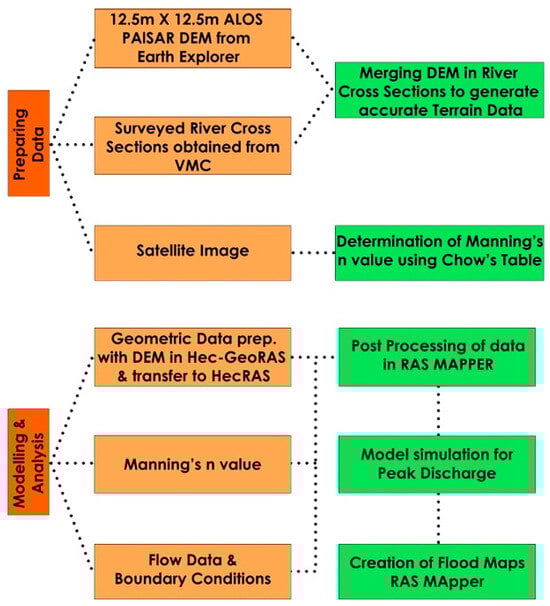
Figure 5.
Methodology for 1D HEC-RAS flood modelling.
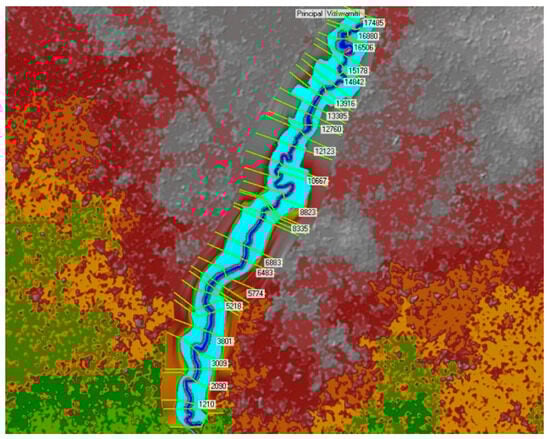
Figure 6.
Floodplain map generated in HEC-RAS.
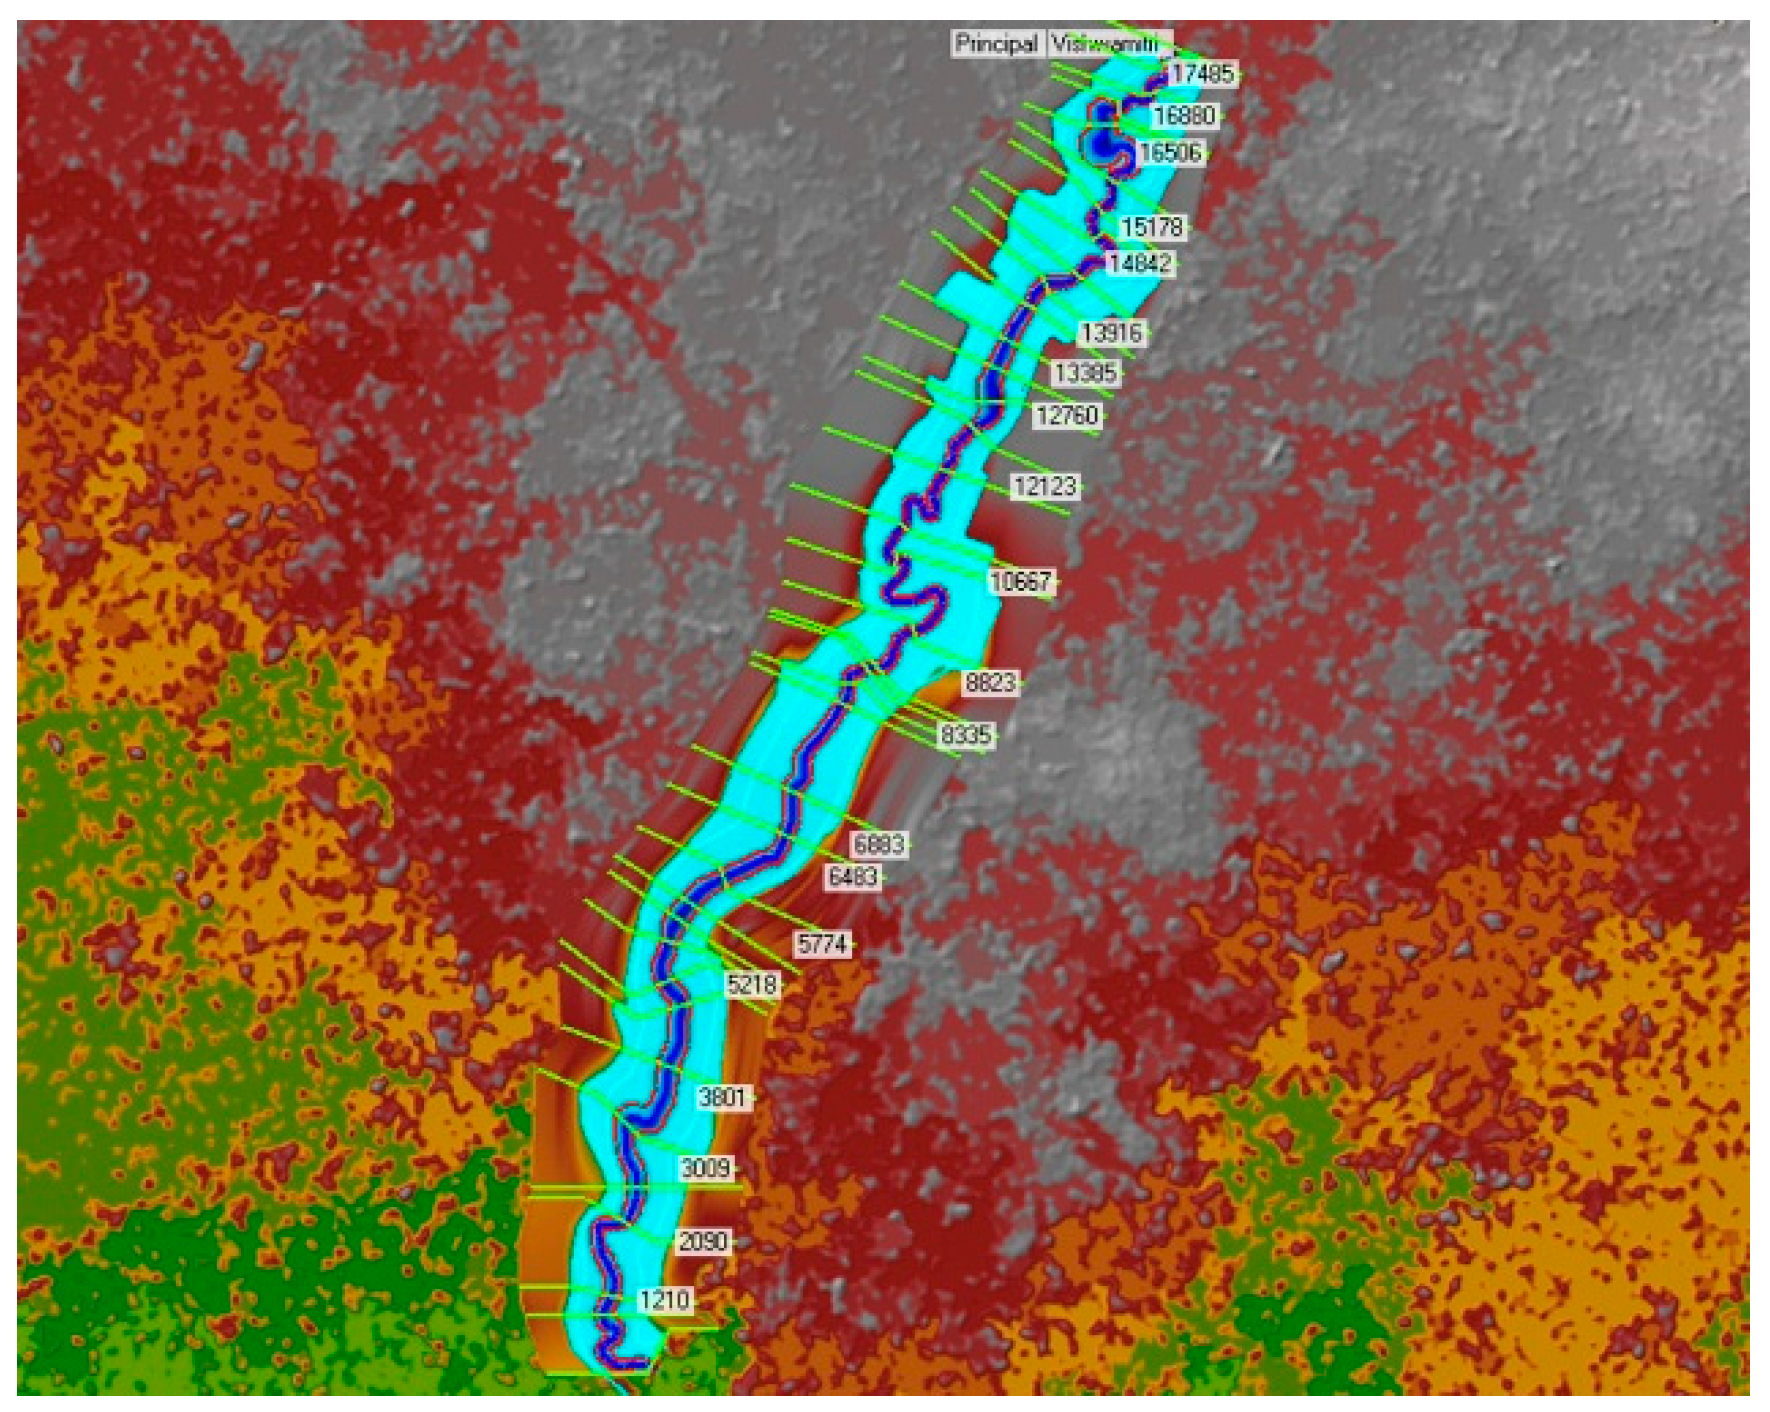
A total of 38 cross-sections, shown in Figure 7, have been used for flood inundation modelling in HEC-RAS. The bank width of the river ranges from 30 m to 100 m, with many low-width cross-sections observed near the CBD area of the city due to high encroachment. In addition, the depth of the river ranges from 8 m to 16 m. Also, simulated flood levels ranged from 0.4 m to 1.8 m above the ground for the 2005 event. The water surface profile for a sample cross-section (cross-section-2)is shown in Figure 8.
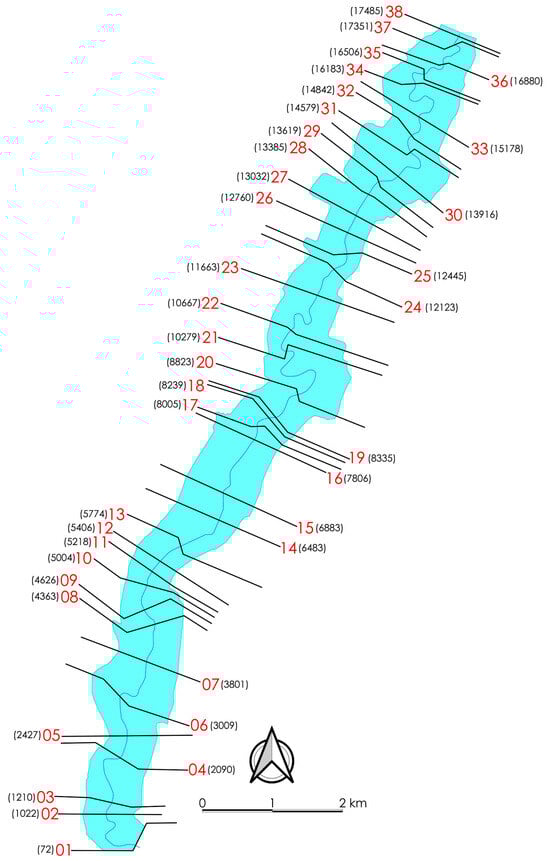
Figure 7.
River cross-sections taken for modelling in HEC-RAS.
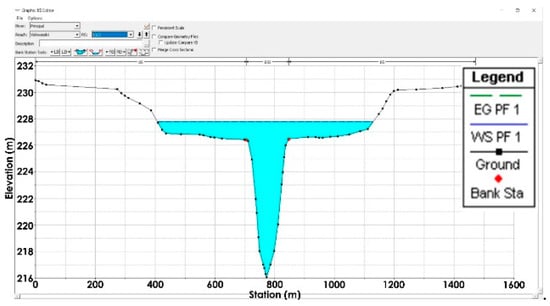
Figure 8.
Water surface elevation at cross-section-02.
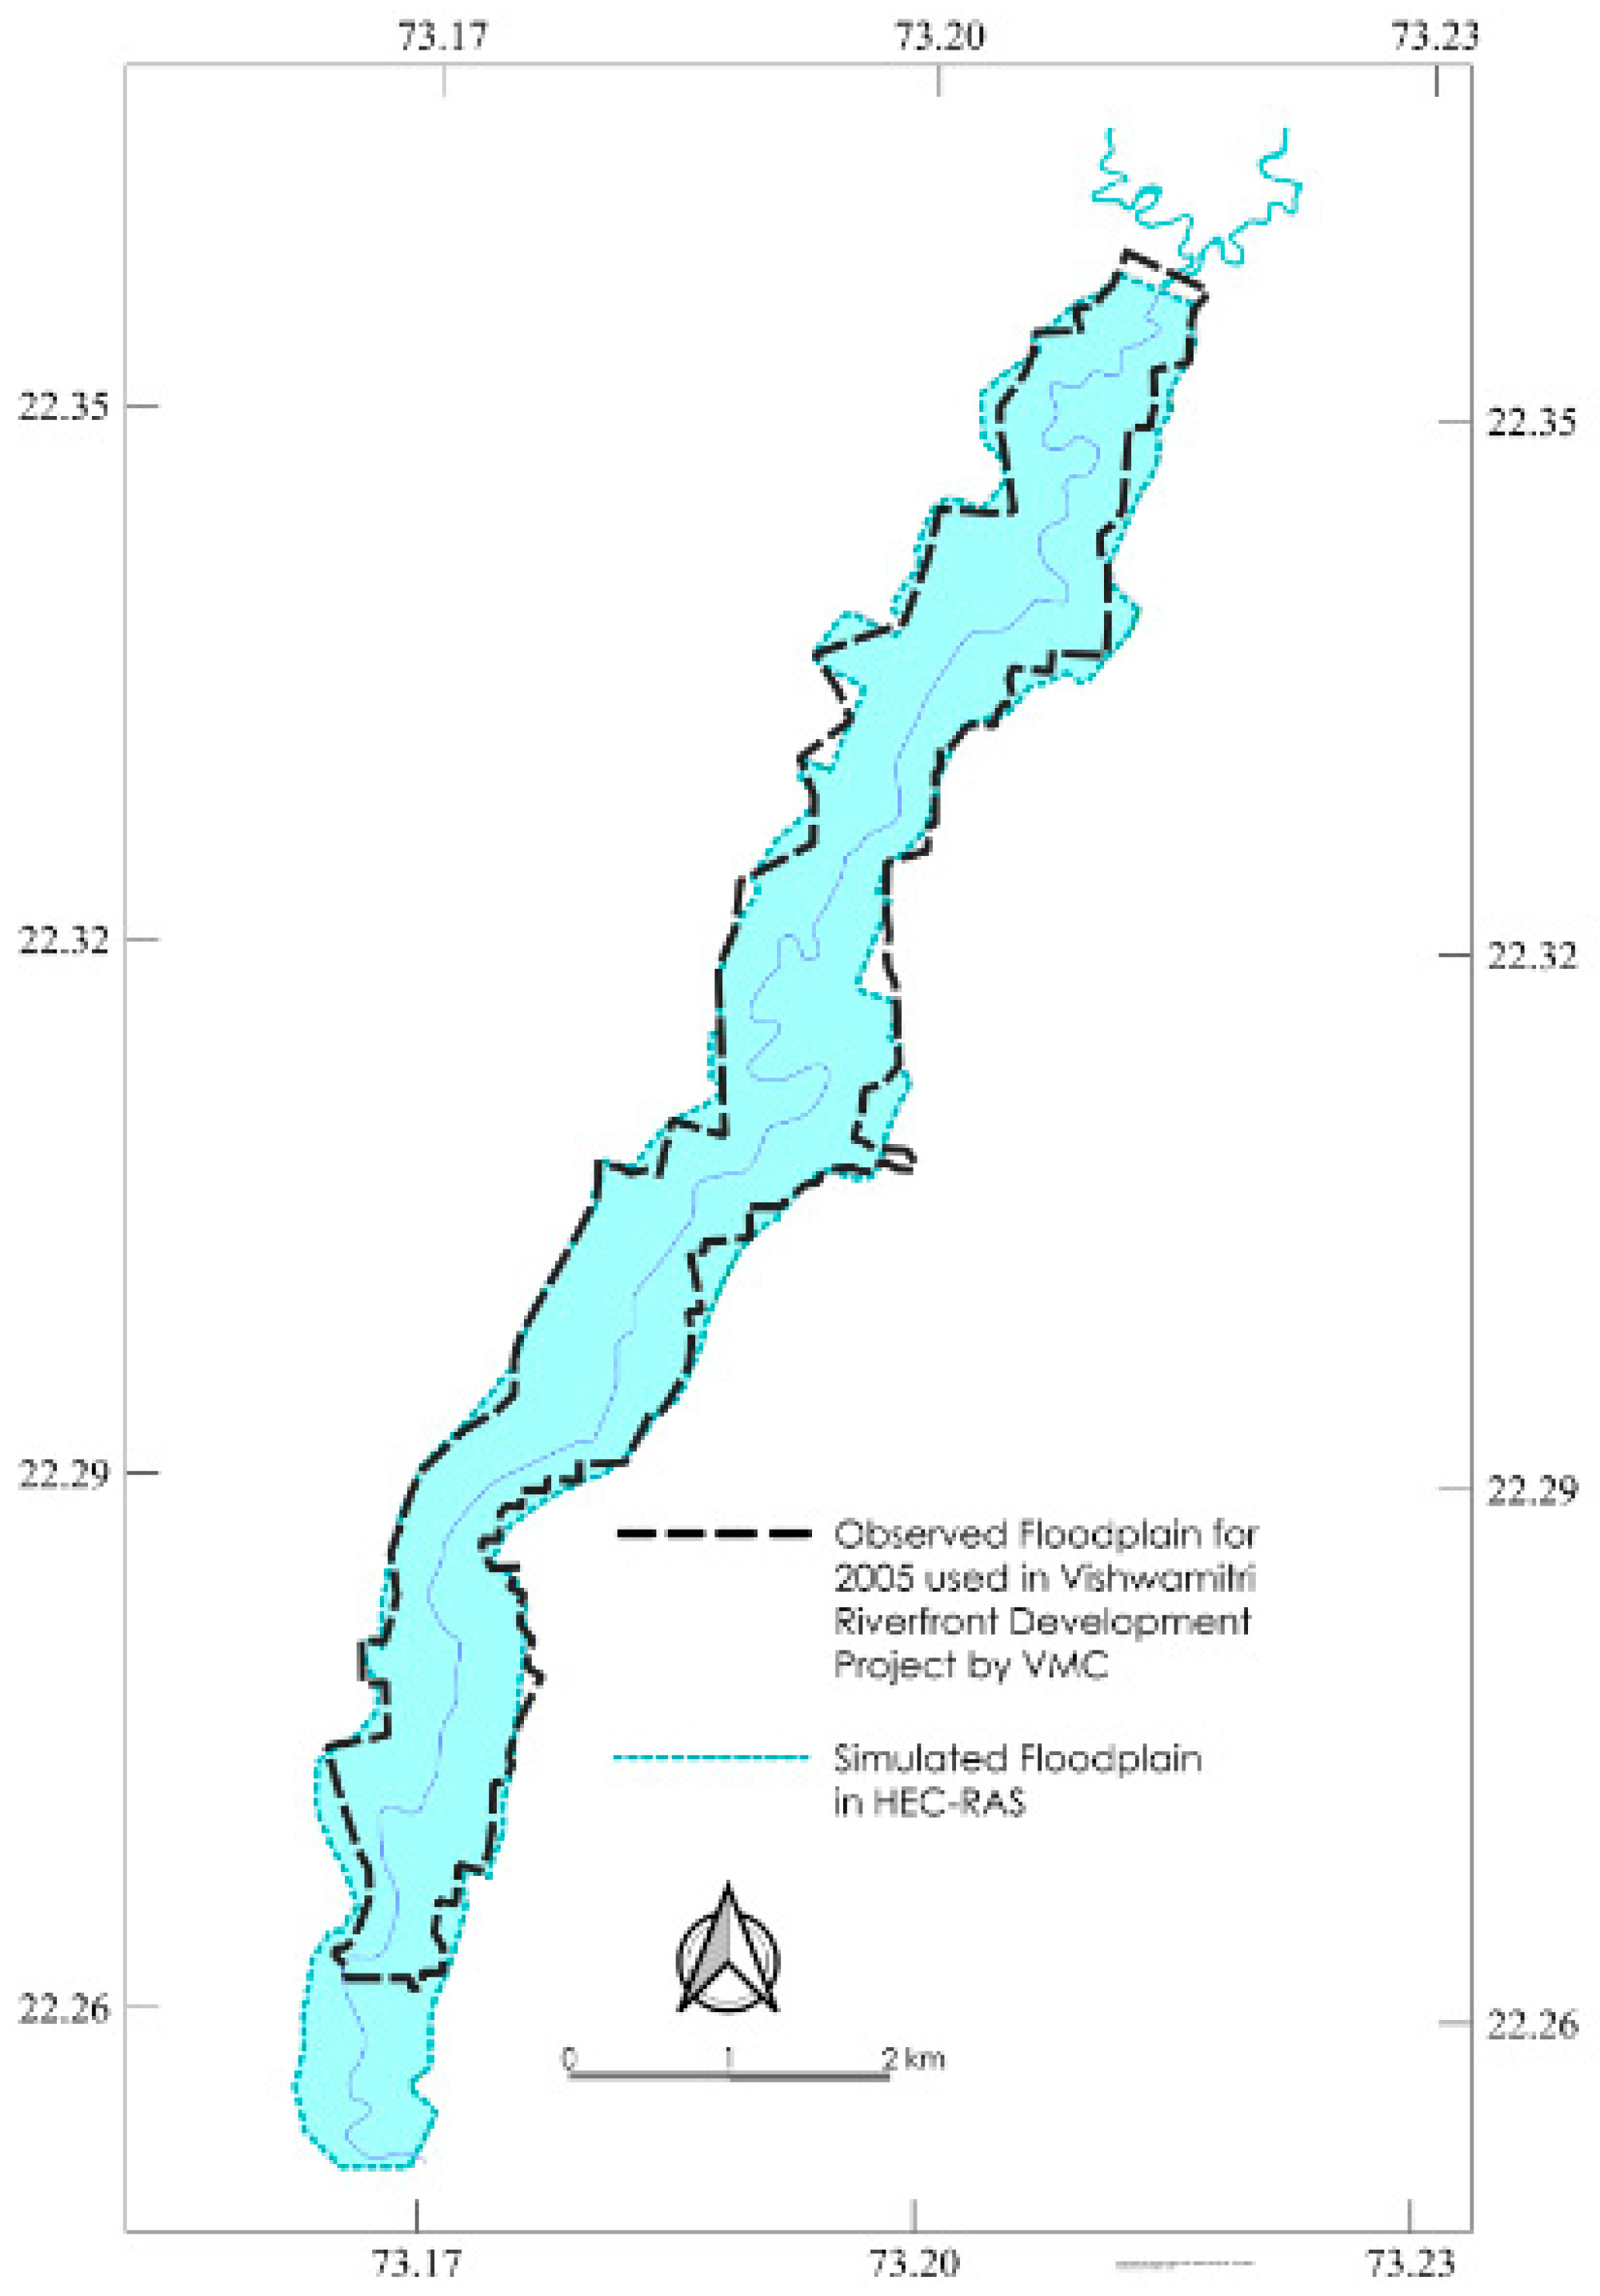
The result was validated from the flood extent map of the same event given by Vadodara Municipal Corporation (Figure 9).
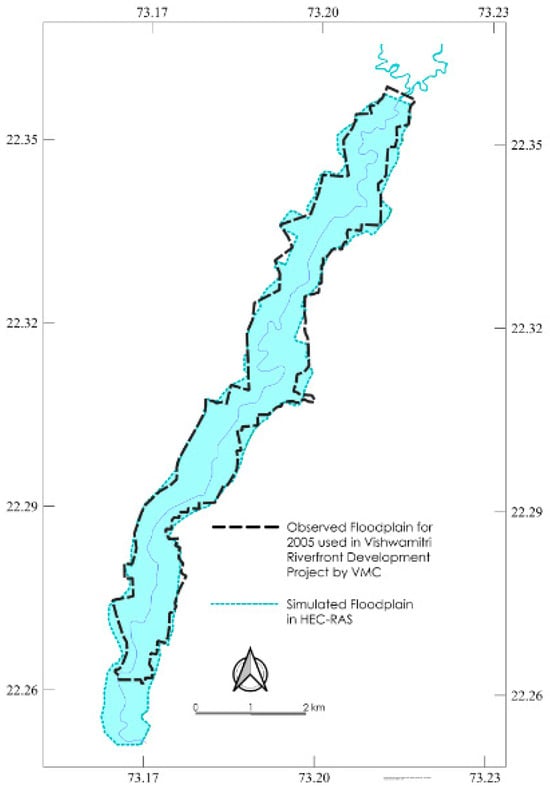
Figure 9.
Observed vs. simulated floodplains within the City.
5.2.2. Flood Survey (Primary Survey)
The floodplain map generated after HECRAS 1D modelling was used as a reference for conducting the primary/visual survey. In addition, the map was utilized for assigning attributes pertaining to the land use and built form within the floodplain. A total of 385 households were surveyed. Moreover, 90 of these households were located in slums, while the 275 remaining households belonged to residential neighbourhoods. Data recorded after the primary survey are given in Table 2.
Table 2.
Primary flood survey.
It was observed that the majority (51%) of the encroachment seen in the floodplain is due to structures that are less than two decades old. This is the reason most houses are either in good (39%) or average (32%) condition. No kutcha structures were found, as past experiences of floods have led people living within the reach of flood water towards pucca and semi-pucca construction. Vadodara City has mostly seen horizontal growth in the past, while high-rise residential and mixed-use apartments are a more recent phenomenon. Hence, the majority (72%) of buildings in the floodplain are either G or G+1 structures.
Most houses in the floodplain have incurred some kind of damage during flood events. Leakage and/or loss of paint is the most common impairment to these structures. Structural damages are less common and mostly confined to semi-pucca houses in slums.
At present, while some high-end commercial buildings are still covered by insurance, it is impossible to find flood insurance for residential properties due to increased restrictions. Some residential owners who insured their buildings a few decades ago are presently reaping its benefits.
No help was available to most residential neighbourhoods. In contrast, many households in slums received food supplies, medicines, blankets and/or some financial support during extreme flood events.
Approximately 80% of the households living in the floodplain belong to EWS and LIG, whereas the remaining 20% belong to MIG and HIG. The majority of people, regardless of their income group, are associated with the tertiary/service sector. IT workers, engineers, doctors, lawyers, business professionals, teachers, etc., are some of the common occupations seen in higher-, middle- and lower-income groups. Daily labour, house-help, etc., are the most common tertiary sector jobs seen in the EWS group. The EWS group is also involved in informal businesses and primary sector activities like fruit selling, vegetable selling and meat selling. Income group distribution based on the average income of each locality is shown in Figure 10.
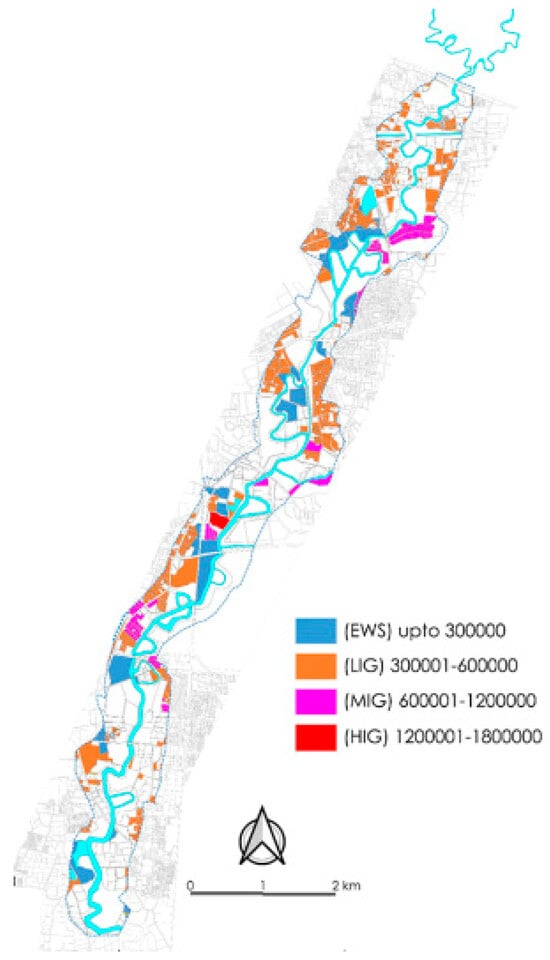
Figure 10.
Income group distribution based on average income of each locality (primary survey).
The Vishwamitri River, due to pollution and its foul smell, is more of a liability than an asset to the city. Crossing the river cannot be avoided as it passes through the city centre. However, few slum dwellers visit the river banks for purposes like dumping garbage, fishing and urination or defecation. Moreover, encounters with a crocodile are quite common during extreme flood events.
Rated on a scale of 1 to 5, no household located in the floodplain rated their flood problem as 1 star. People who rated 5 stars had to leave their homes during flood events and live somewhere else till the water cleared. Furthermore, people who rated a minimum of 2 stars could not go outside to work or perform their day-to-day chores while living in a safe environment.
The majority of households in the floodplain simply did not want to move to any other place. Families living in low-lying areas near the banks were ready to move anywhere as long as it was outside the floodplain. But, there were few households that considered relocating from their current homes to some place in close proximity to their workplaces and/or relatives.
5.2.3. Landuse
Shapefiles for the existing plots and land use inside the floodplain were created in ArcGIS. The attributes for land use of each plot were determined by the data collected from the visual survey and Google Earth. The landuse map of the floodplain is shown in Figure 11.
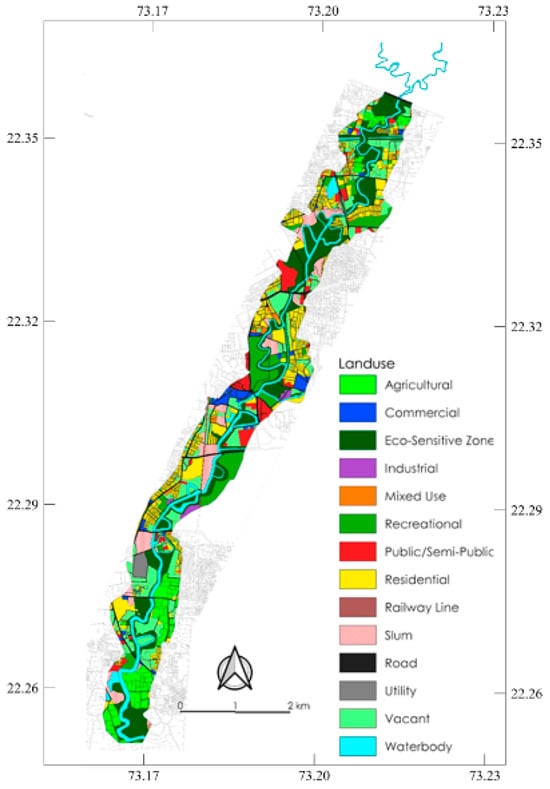
Figure 11.
Existing land use within floodplain.
Areawide landuse distribution of floodplain is given in Table 3. Eco-sensitive zones, residential zones and vacant lands are the most common forms of land use in the floodplain. The degradation of the eco-corridor is more common in the central stretch of the river near the CBD. Mixed-use plots are unevenly distributed, while commercial land use is mostly seen near the CBD area. In addition, slums are mostly located in close proximity to the river banks. Most residential neighbourhoods adjacent to the river banks have raised their sites above the flood water level, leading to a concentration of water on adjacent roads. Agricultural lands can be seen along both ends of the floodplain.
Table 3.
Land use distribution.
5.2.4. Built Form
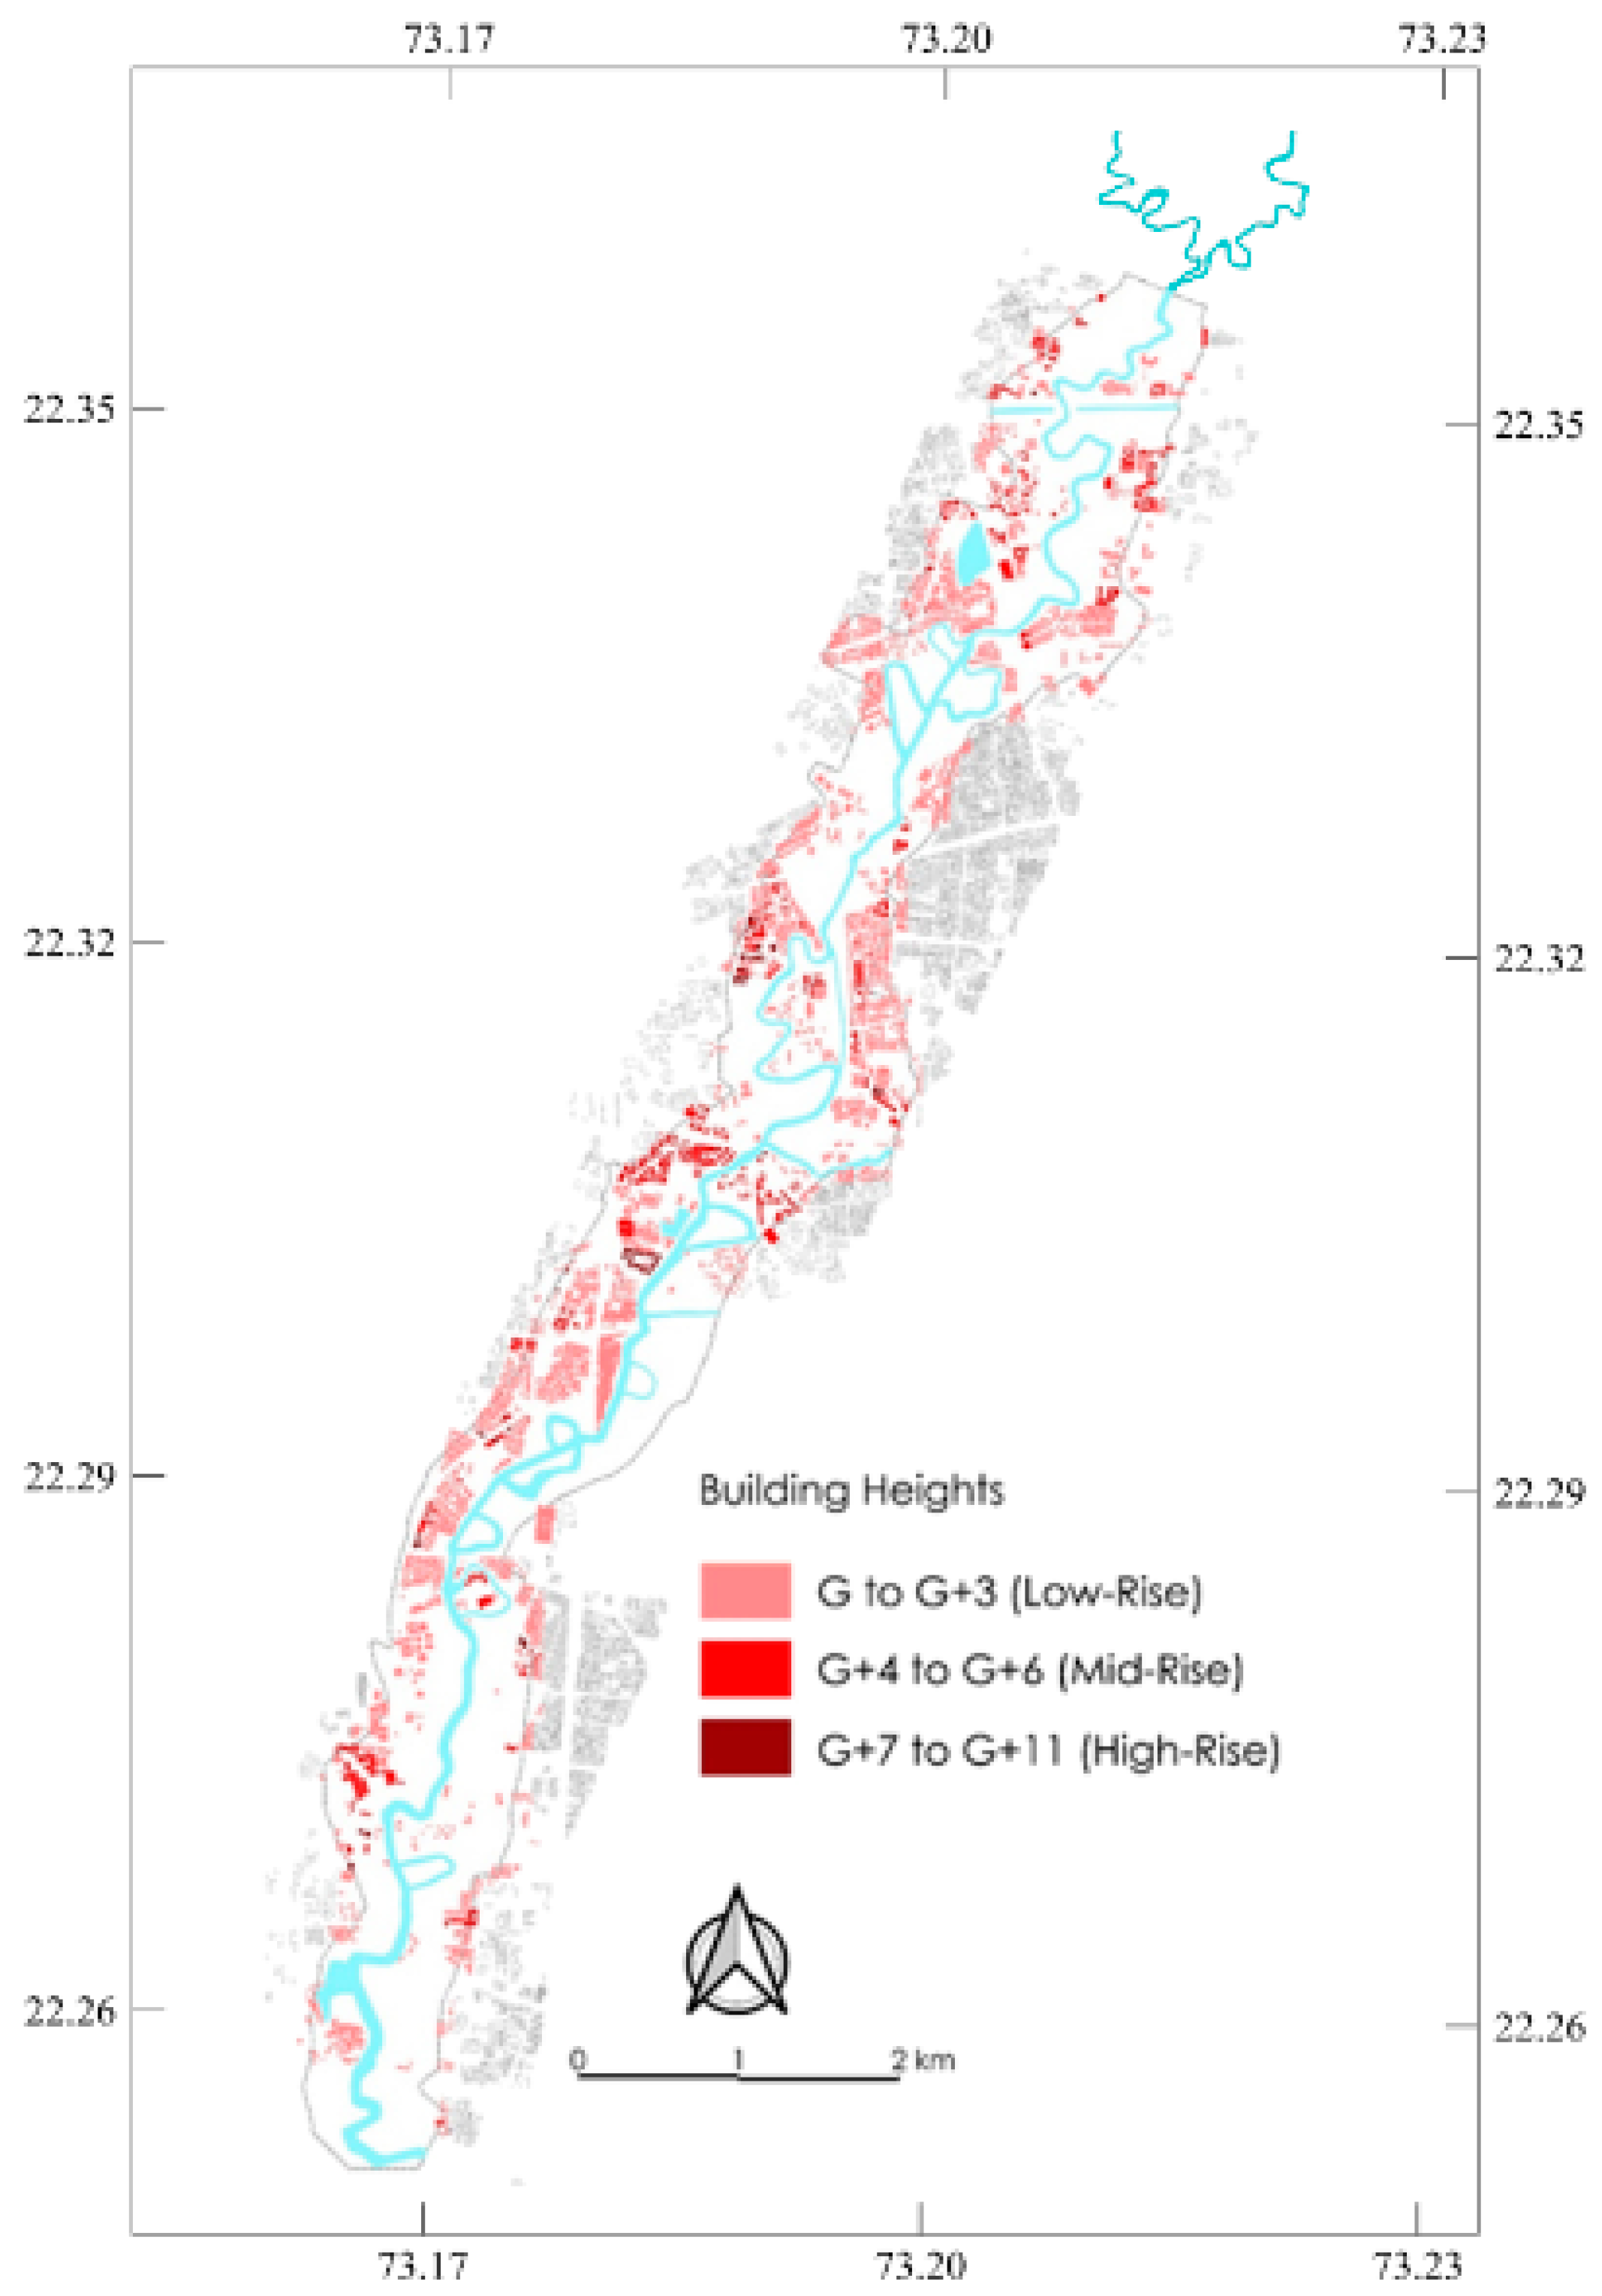
Building height for structures situated within the floodplain was marked during the visual survey. The building height map for the floodplain is shown in Figure 12. There is no uniform trend describing building heights. Structures are haphazardly scattered with a mix of high-, mid- and low-rise buildings. Mid- and high-rise buildings are mostly concentrated near the CBD area, while the southern and northern stretches of the floodplain mostly have low-rise buildings. However, mid-rise residential apartments and mixed-use buildings have grown at a fast rate in the recent past.
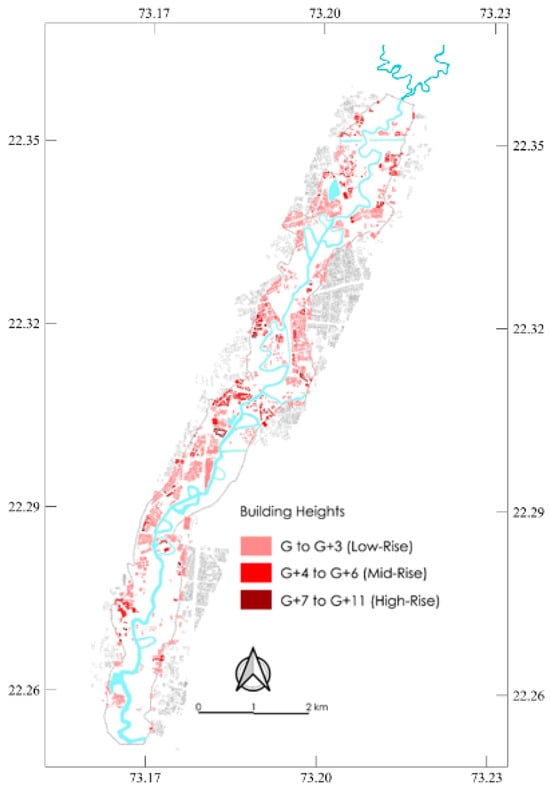
Figure 12.
Building height within floodplain.
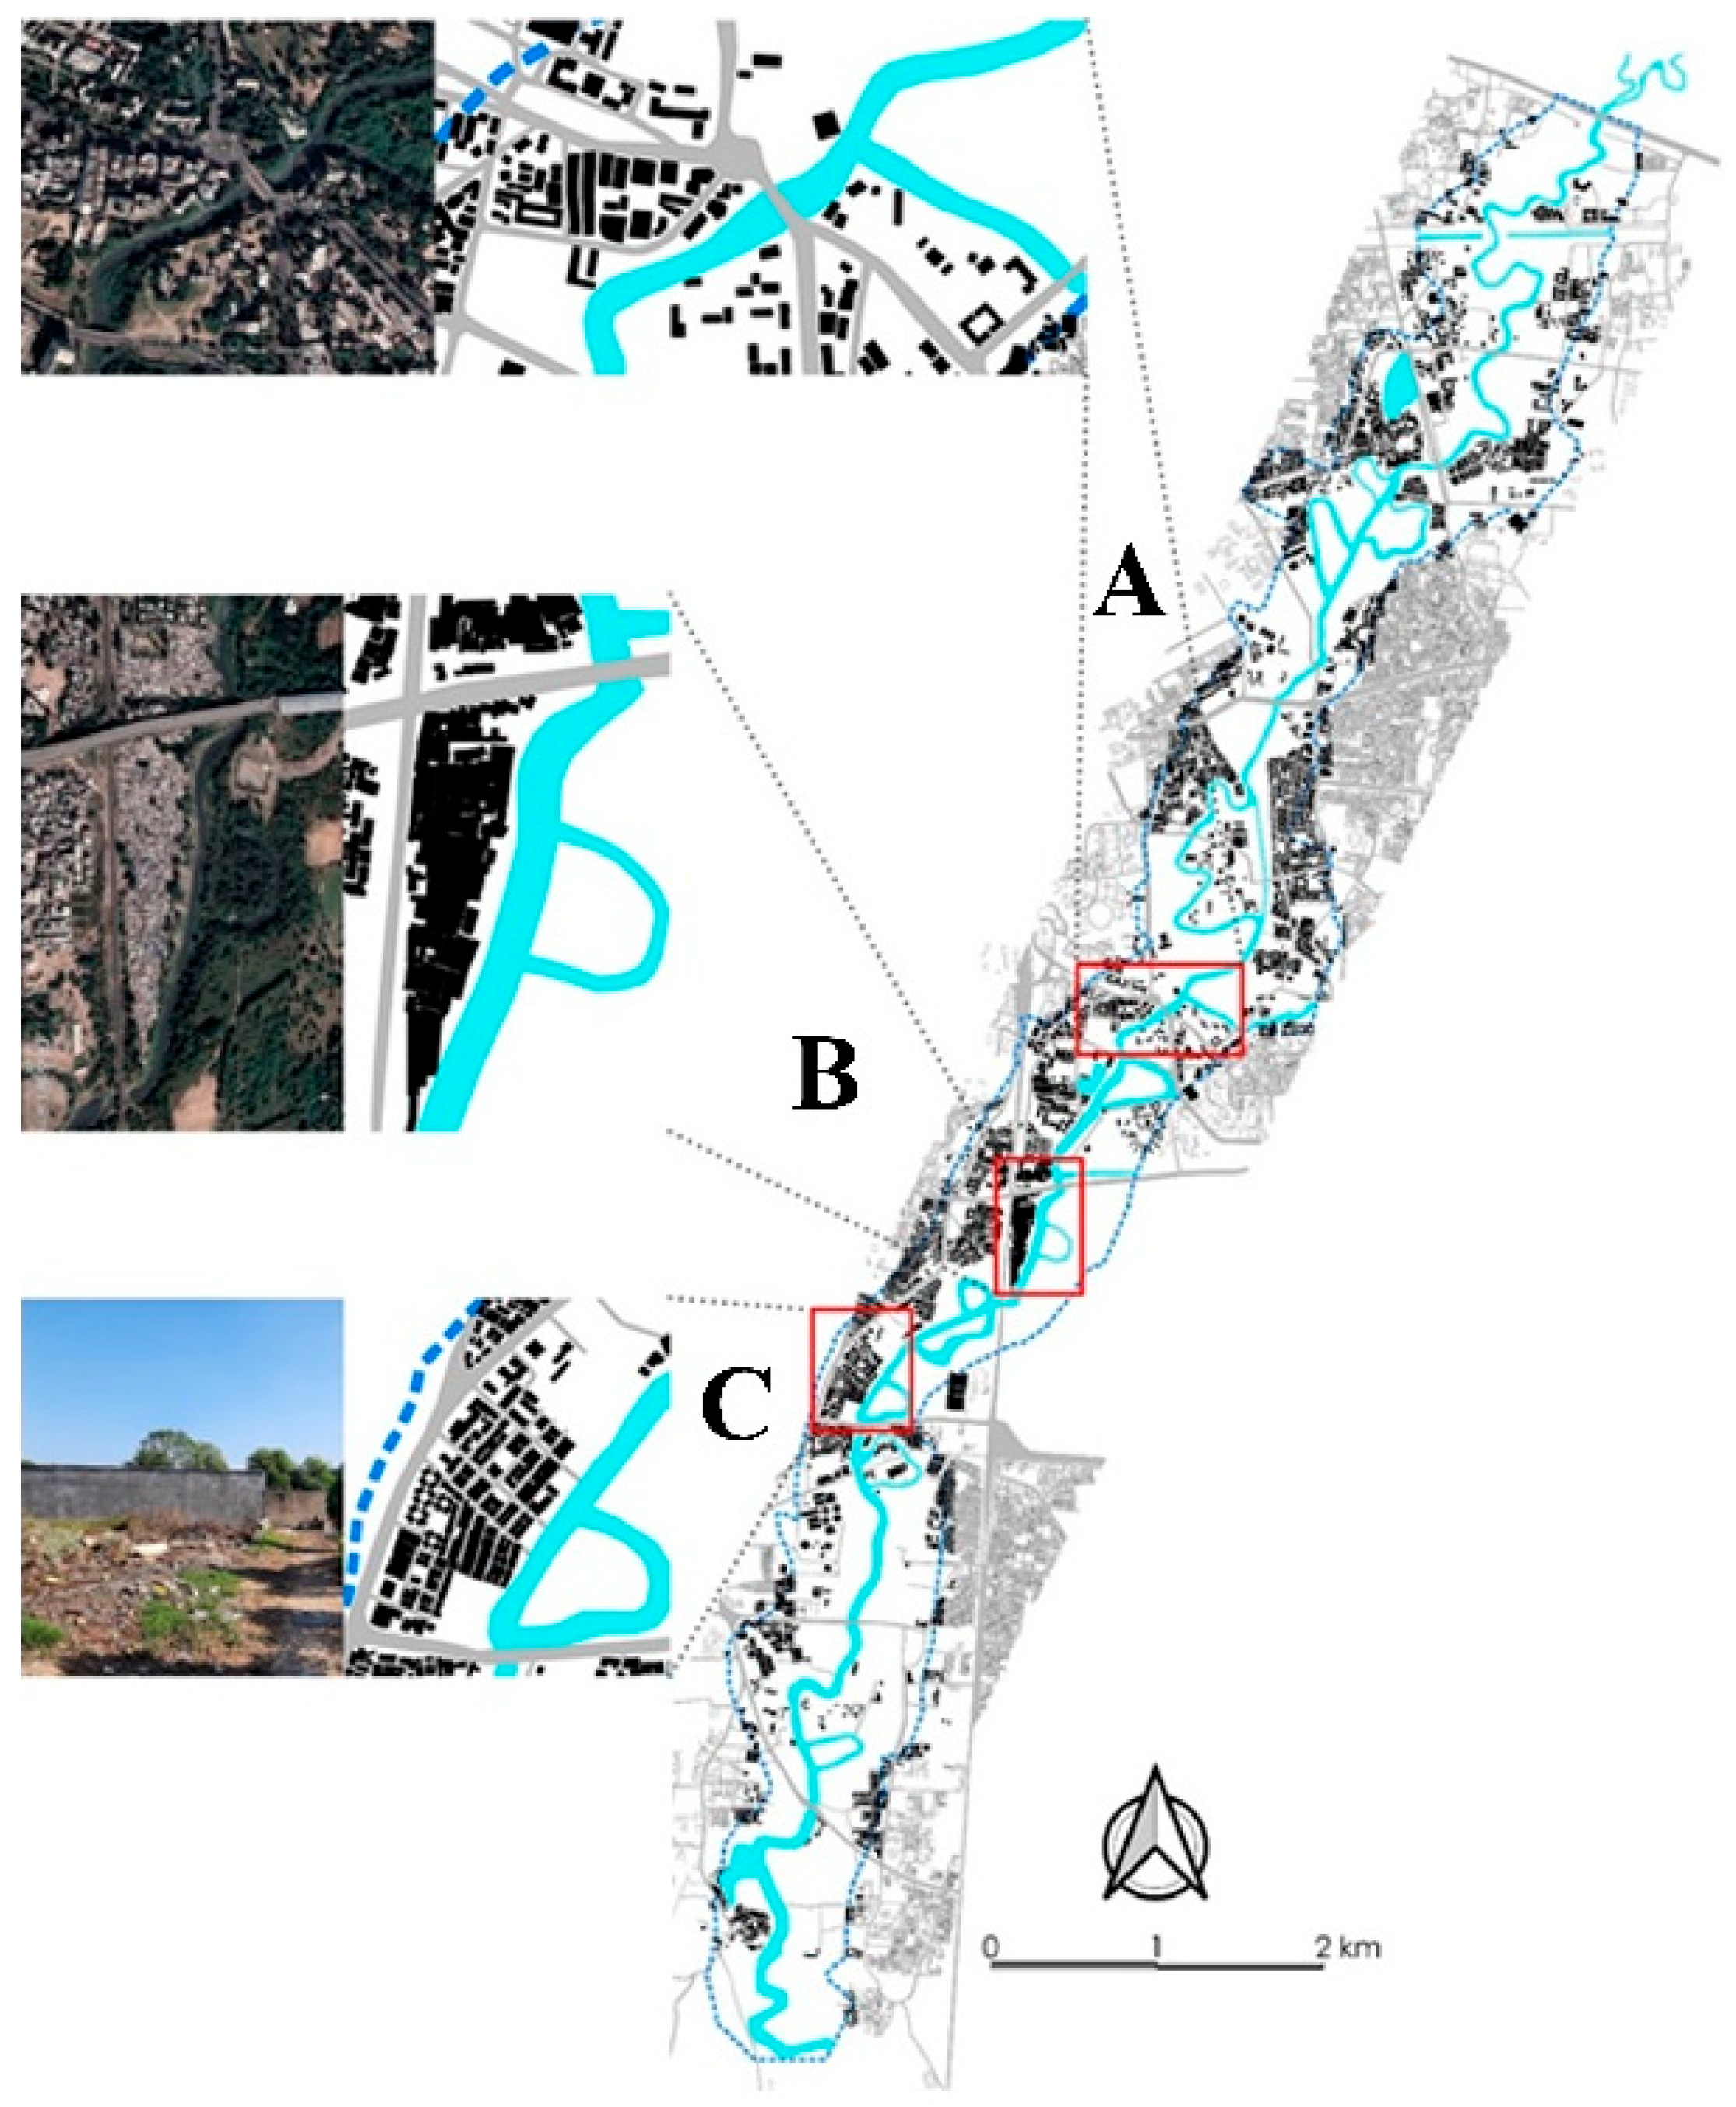
In Figure 13, the central part (A) of the city near Kala Ghoda has numerous mid/high-rise institutional and commercial buildings along the river. This part also includes some structures of historical and cultural importance. Part B shows a dense slum pocket located adjacent to the river. Many private developments (C) have also taken place in the last few decades along the banks. To protect these properties from floods, the riverbanks are lined with boundary walls.

Figure 13.
Figure ground.
5.2.5. Drains and Sewage Outlets
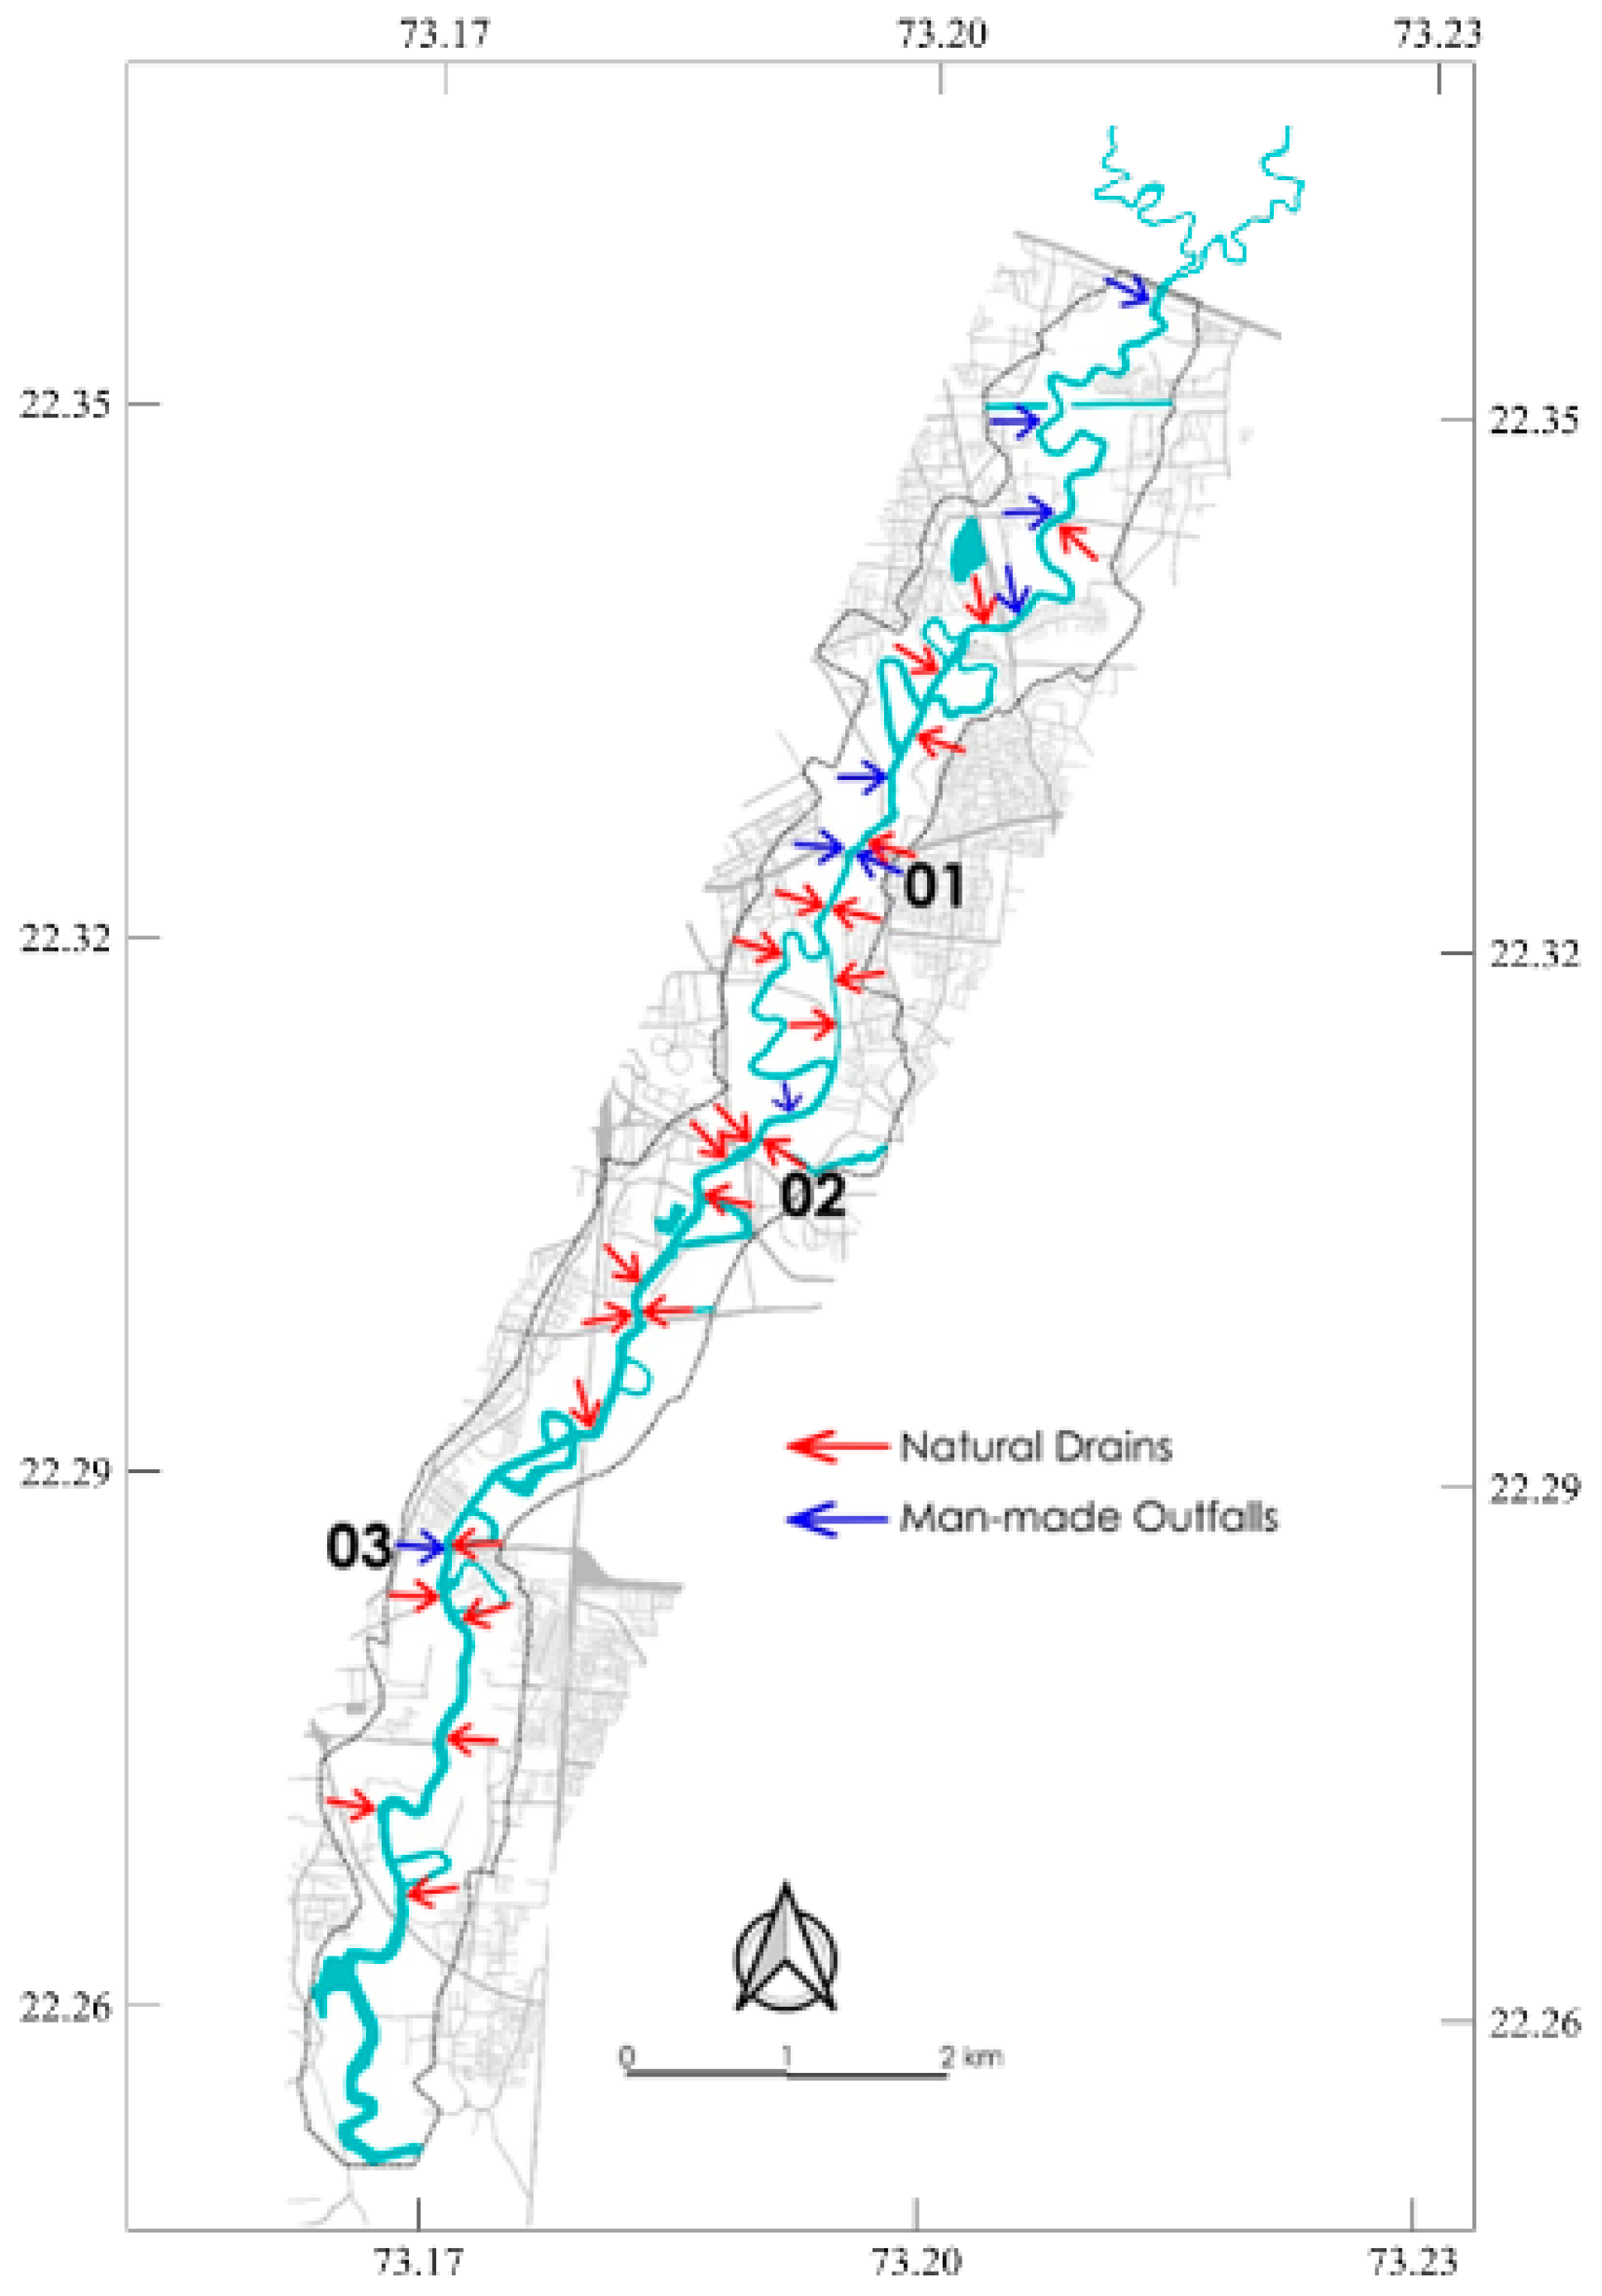
The Vishwamitri River is a seasonal river. It is mostly dry during the summer. Nevertheless, the extent of the river lying within Vadodara City is filled with sewage water coming from several natural and human-made outlets pouring directly into the river every day. The location of these drain outfalls can be seen in Figure 14. Sewage inflow has led to changes in natural cycles within the city, due to which many species of animals like crocodiles and softshell turtles have migrated within city limits, making it their permanent home. Figure 15 shows some of the drain outfalls releasing sewage water into the river.
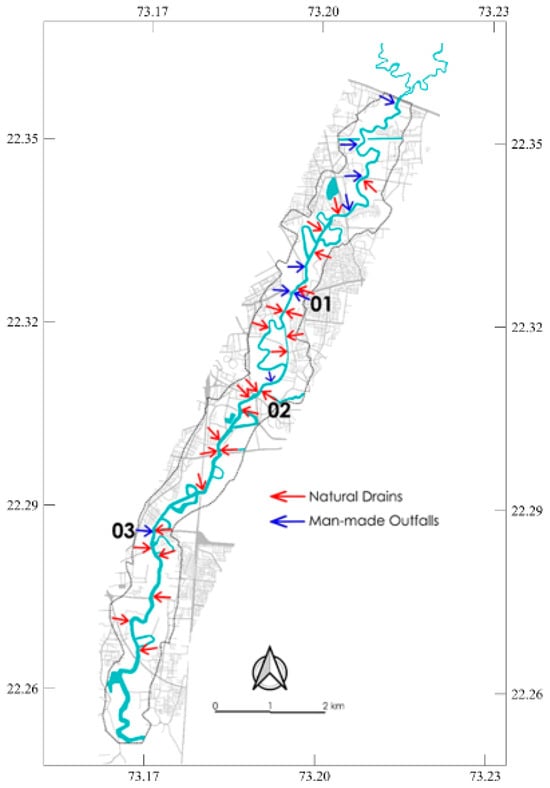
Figure 14.
Drain outfalls (source: VMC).
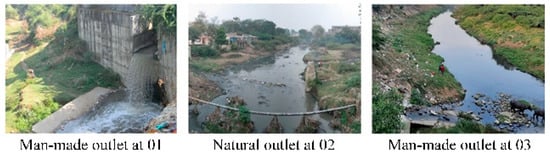
Figure 15.
Sewage/stormwater outlets.
5.2.6. Slums
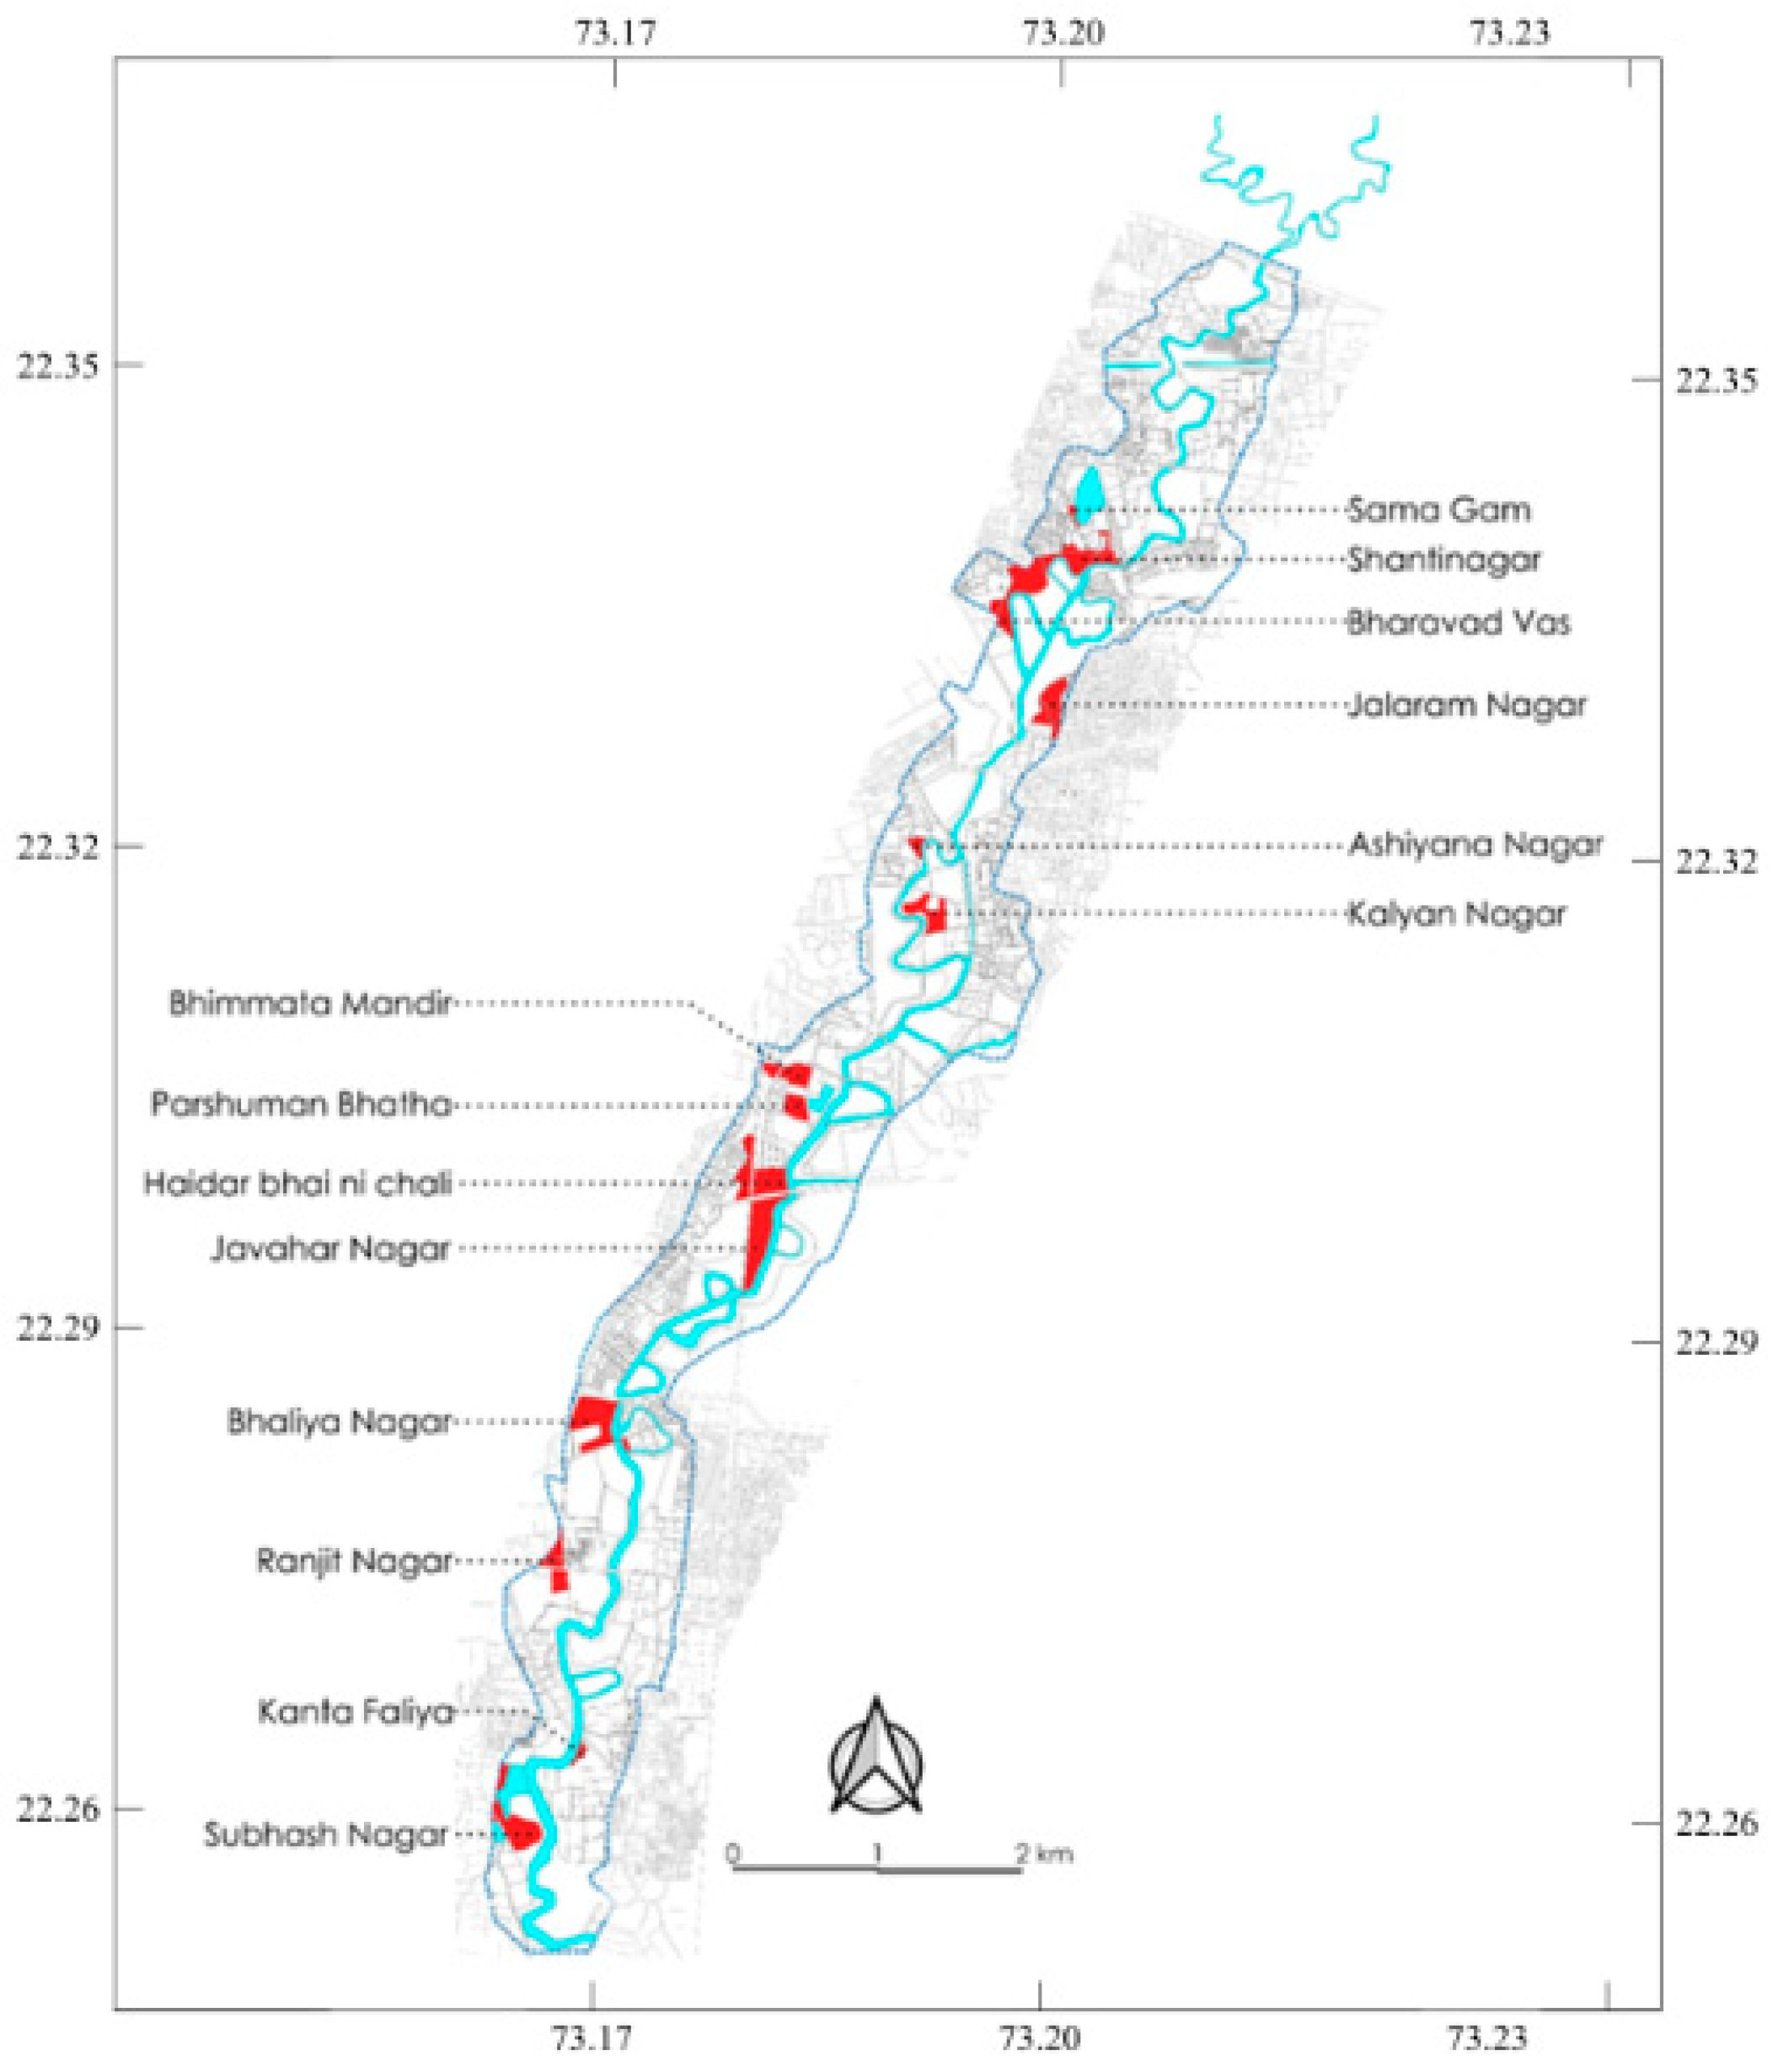
Informal settlements have a tendency to come up near water bodies like rivers and canals [20]. Slums in the floodplain are mostly located in the low-lying areas along the river. Slum dwellers are often required to vacate their homes due to high water levels and proximity to crocodiles during flood events. Nearly all the houses in slums are semi-pucca with brick–mortar walls, corrugated metal or asbestos sheet rooves and cement plaster flooring. The locations of slums are shown in Figure 16.
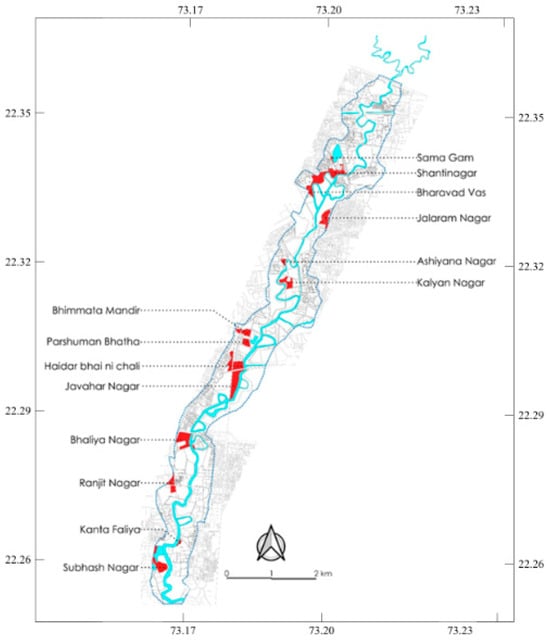
Figure 16.
Existing slums.
There are currently 14 slums along the river, with 6631 huts [21]. The number of huts in each slum pocket is shown in Table 4.
Table 4.
Number of huts.
5.2.7. Human-Made Connections
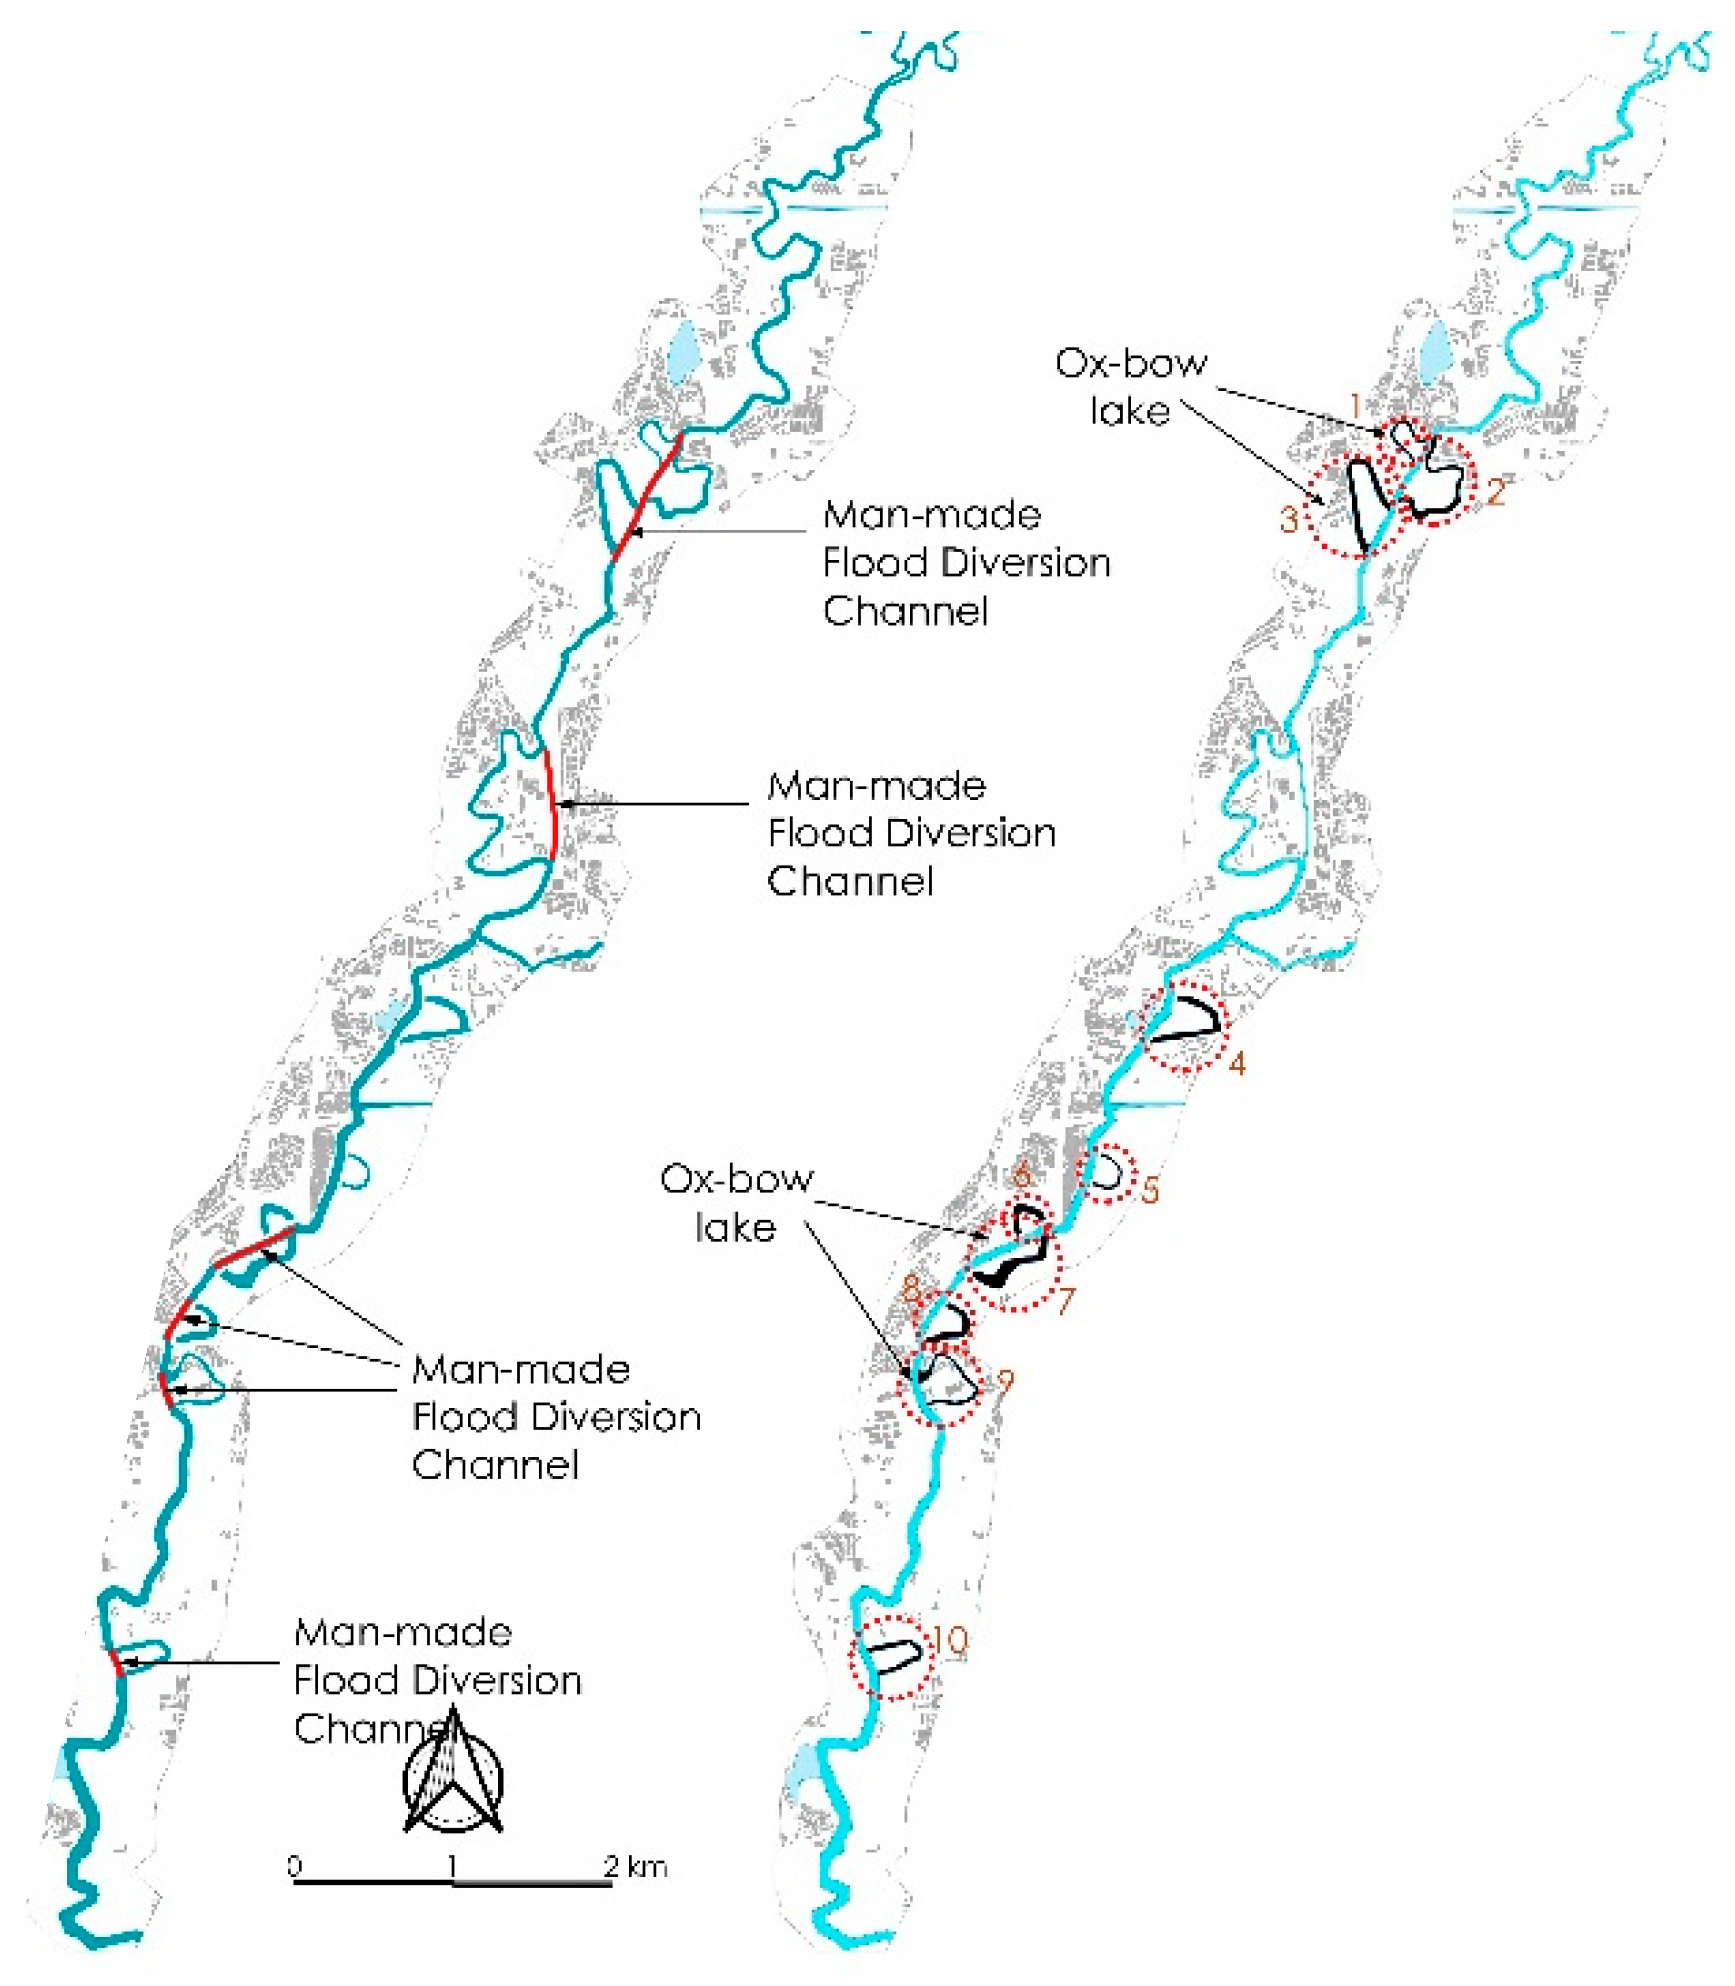
Human-made connections have been built along the meandering path of the river over the years (Figure 17). Each connection was made to act as a flood diversion channel for reducing flood impact on an urban neighbourhood.
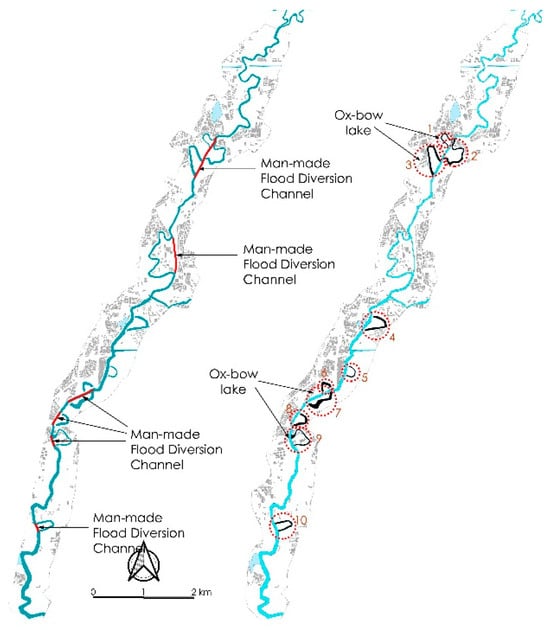
Figure 17.
Human-made diversion channels, leading to the formation of oxbow lakes.
Some of these connections have taken the place of the original path of the river, in turn leading to the formation of oxbow lakes adjacent to the river banks. A few of these loops are even used as garbage dumping grounds and are now completely disconnected from the river.
5.2.8. River Banks
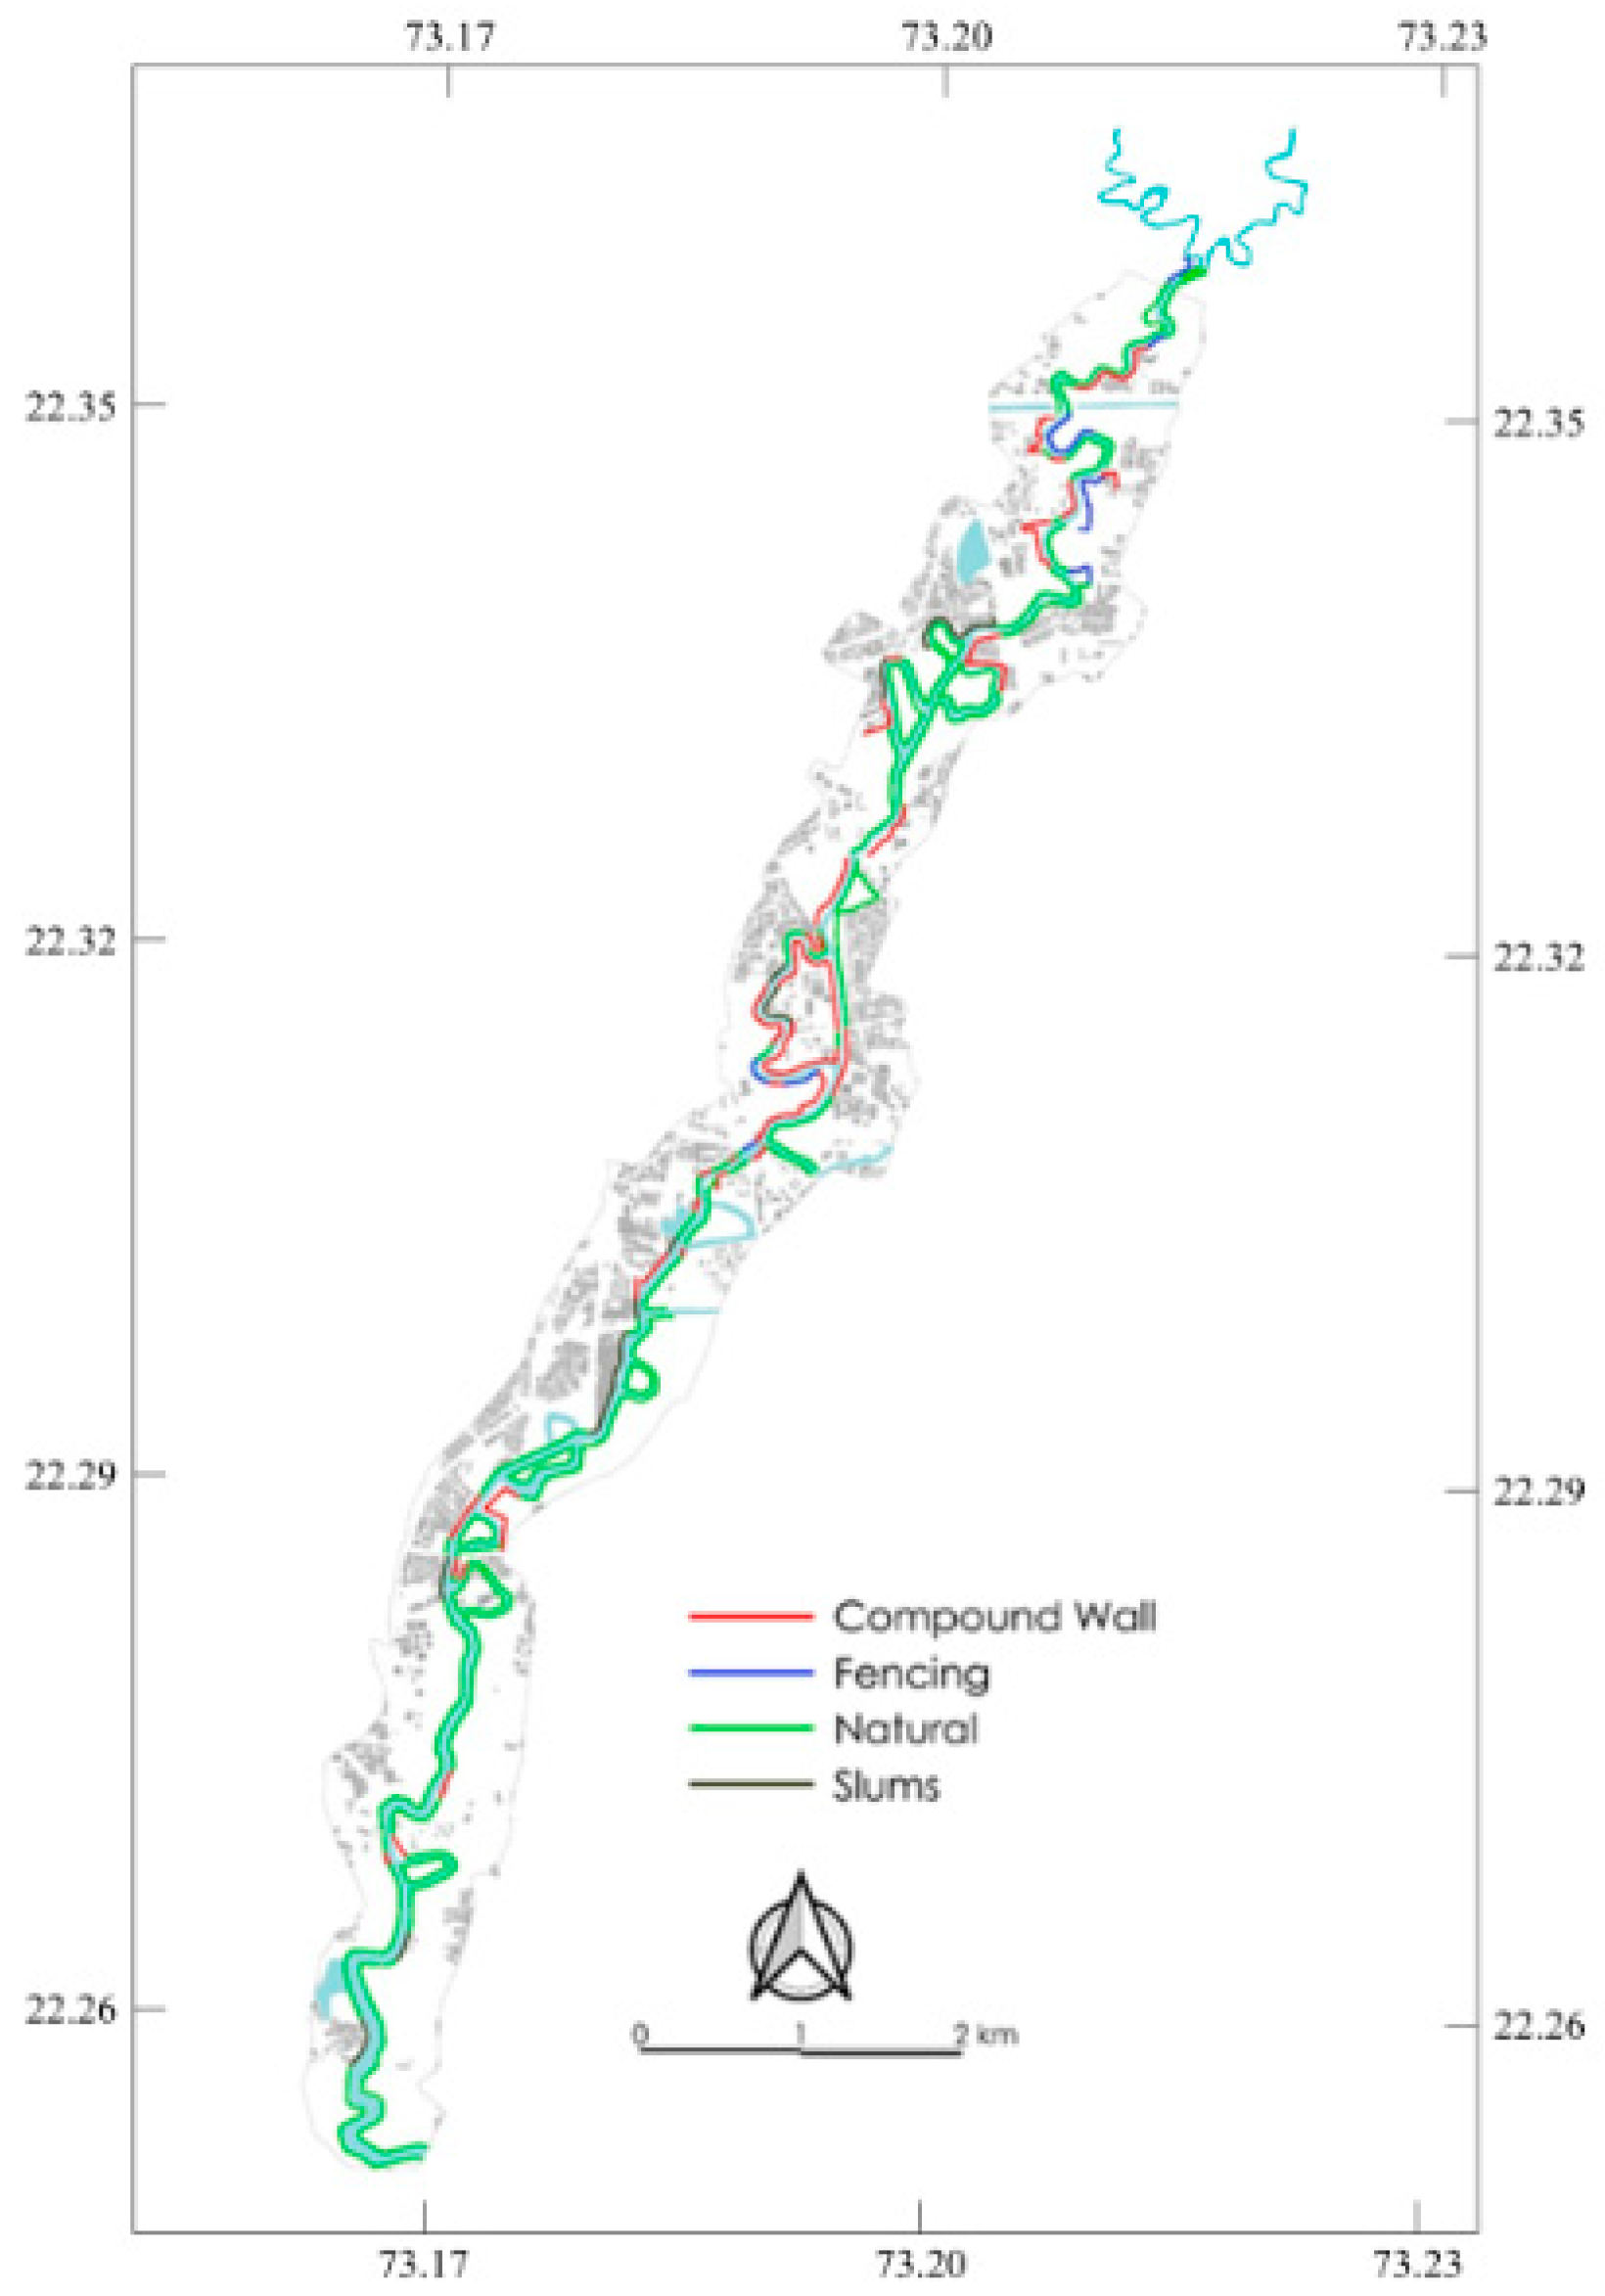
The conditions of the river edges vary in different places. While there are some stretches where the river banks are untouched by any human activity, natural features of some bank extents have been disturbed by concrete encroachment and the cutting of trees. Features of the river edges are shown in Figure 18.
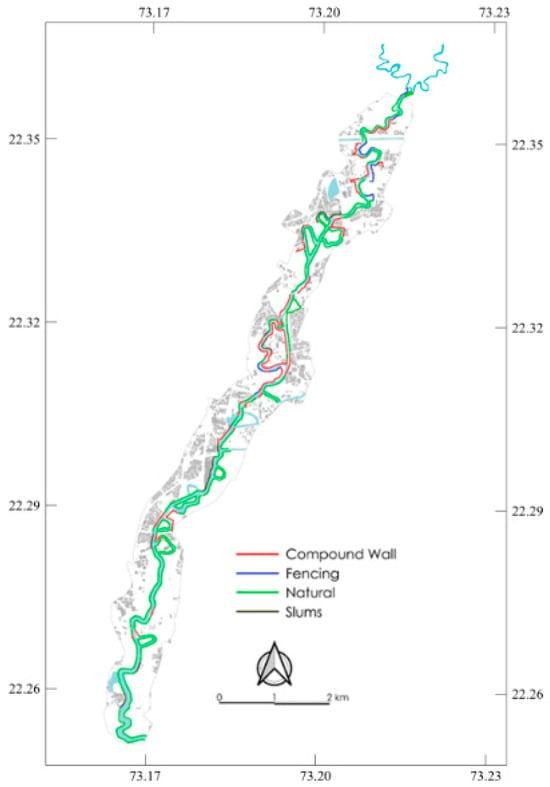
Figure 18.
Condition of banks.
Properties built on river banks protect themselves from floods by raising boundary walls. In addition, fencing has come up at places where encounters between humans and crocodiles are common. Finally, a few stretches of the river banks are taken up by slum dwellers who cannot find cheaper accommodation elsewhere in the city.
5.2.9. Habitat
The river and its surrounding is rich in flora and fauna. According to a survey carried out by Sayaji Baug Zoo, the entire valley supports 10 species of amphibians, 19 species of reptiles, 76 species of birds and 10 species of mammals [5].
Mugger/Marsh Crocodiles
Out of approximately 1000 crocodiles in Vadodara district, nearly 300 are found within city limits [22]. Mugger crocodiles are listed as vulnerable species [23]. Due to encroachment by humans into the species’ natural habitats in several places, there is an increase in human–crocodile conflict. These encounters are exacerbated during flood events in which flood water carries crocodiles along with it towards the land. Between 1960 and 2013, 41 crocodile attacks occurred within the Vishwamitri–Dhadhar River System [24].
Crocodile nesting sites have been encroached at a majority of the river stretches within the city (Figure 19). At stretch-C and stretch-D, there is a complete encroachment of crocodile habitat. However, there are two stretches where the environment is left undisturbed by humans. Extent A is such an untouched corridor where there is a rich density of crocodile nesting sites. Extent B is preserved as a central park (Sayaji Baug) for the city, where an apt condition is maintained for crocodiles with the least interference possible. The issue of crocodile habitat destruction is crucial and has led to the failure of several riverfront proposals in the past. Therefore, any future intervention must take into account the fate of the natural habitat in the Vishwamitri River.
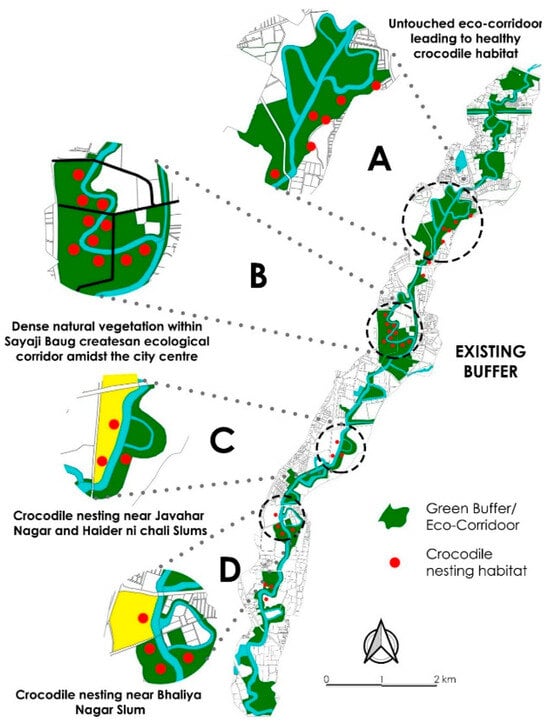
Figure 19.
Crocodile nesting sites and their condition (location source: VMC).
6. Proposal
To mitigate flooding events in Vadodara City, proper interventions and strategies are needed in the Vishwamitri watershed right from its origin (Pavagadh Hills) to the flood-affected zone (Vadodara City). The effectiveness of any proposal for the river within the city limits is restricted by the condition of the upper watershed. Keeping this in mind, the proposals for this study are divided into two parts:
- Proposals for the upper watershed;
- Proposals within the city.
6.1. Proposals for Upper Watershed
At the macro-scale, the region of the upper watershed mainly holds agricultural lands, forest cover, the Sayaji Sarovar Dam, a few urban settlements and lakes. Based on the analysis of the upper watershed for each form of land use, strategies for each are proposed, respectively.
Agriculture is the most common land use in the upper watershed. Some of these lands are located near the river banks (within the floodplain), which were developed at the cost of riparian vegetation. Therefore, the restoration of riparian buffers at river edges is required [25]. Also, the restoration of oxbow lake links and depths, which have been disconnected from the main channel, is needed. For lands located outside the floodplain, it is suggested to building a field of detention ponds to store surface runoff moving downstream. In addition, hedges and tree rows should be developed along the field perimeter to reduce the speed of the flow [26].
Forest cover should be restored along Pavagadh Hills. Plant species involved in reforestation should be local to the region since native species of flora are best suited for the natural succession of forest cover as well as the retention and infiltration of water in a region [27]. Furthermore, reforestation strategies should involve techniques that aim towards naturally stabilizing steep slopes to reduce the speed of runoff water. Also, newly grown saplings need to be protected from monsoon runoff. Some of the techniques to deal with this issue are jute erosion meshes as seed cover, gulley plugs and check ponds, etc. [28].
The first few meters (50–100 m) right after the gate of the dam should be secured with a rip-rap to reduce the sudden surge of water [29]. Lost off-channel storage (wetlands) should be restored downstream of the dam to decrease the amount of flow moving towards the city [30].
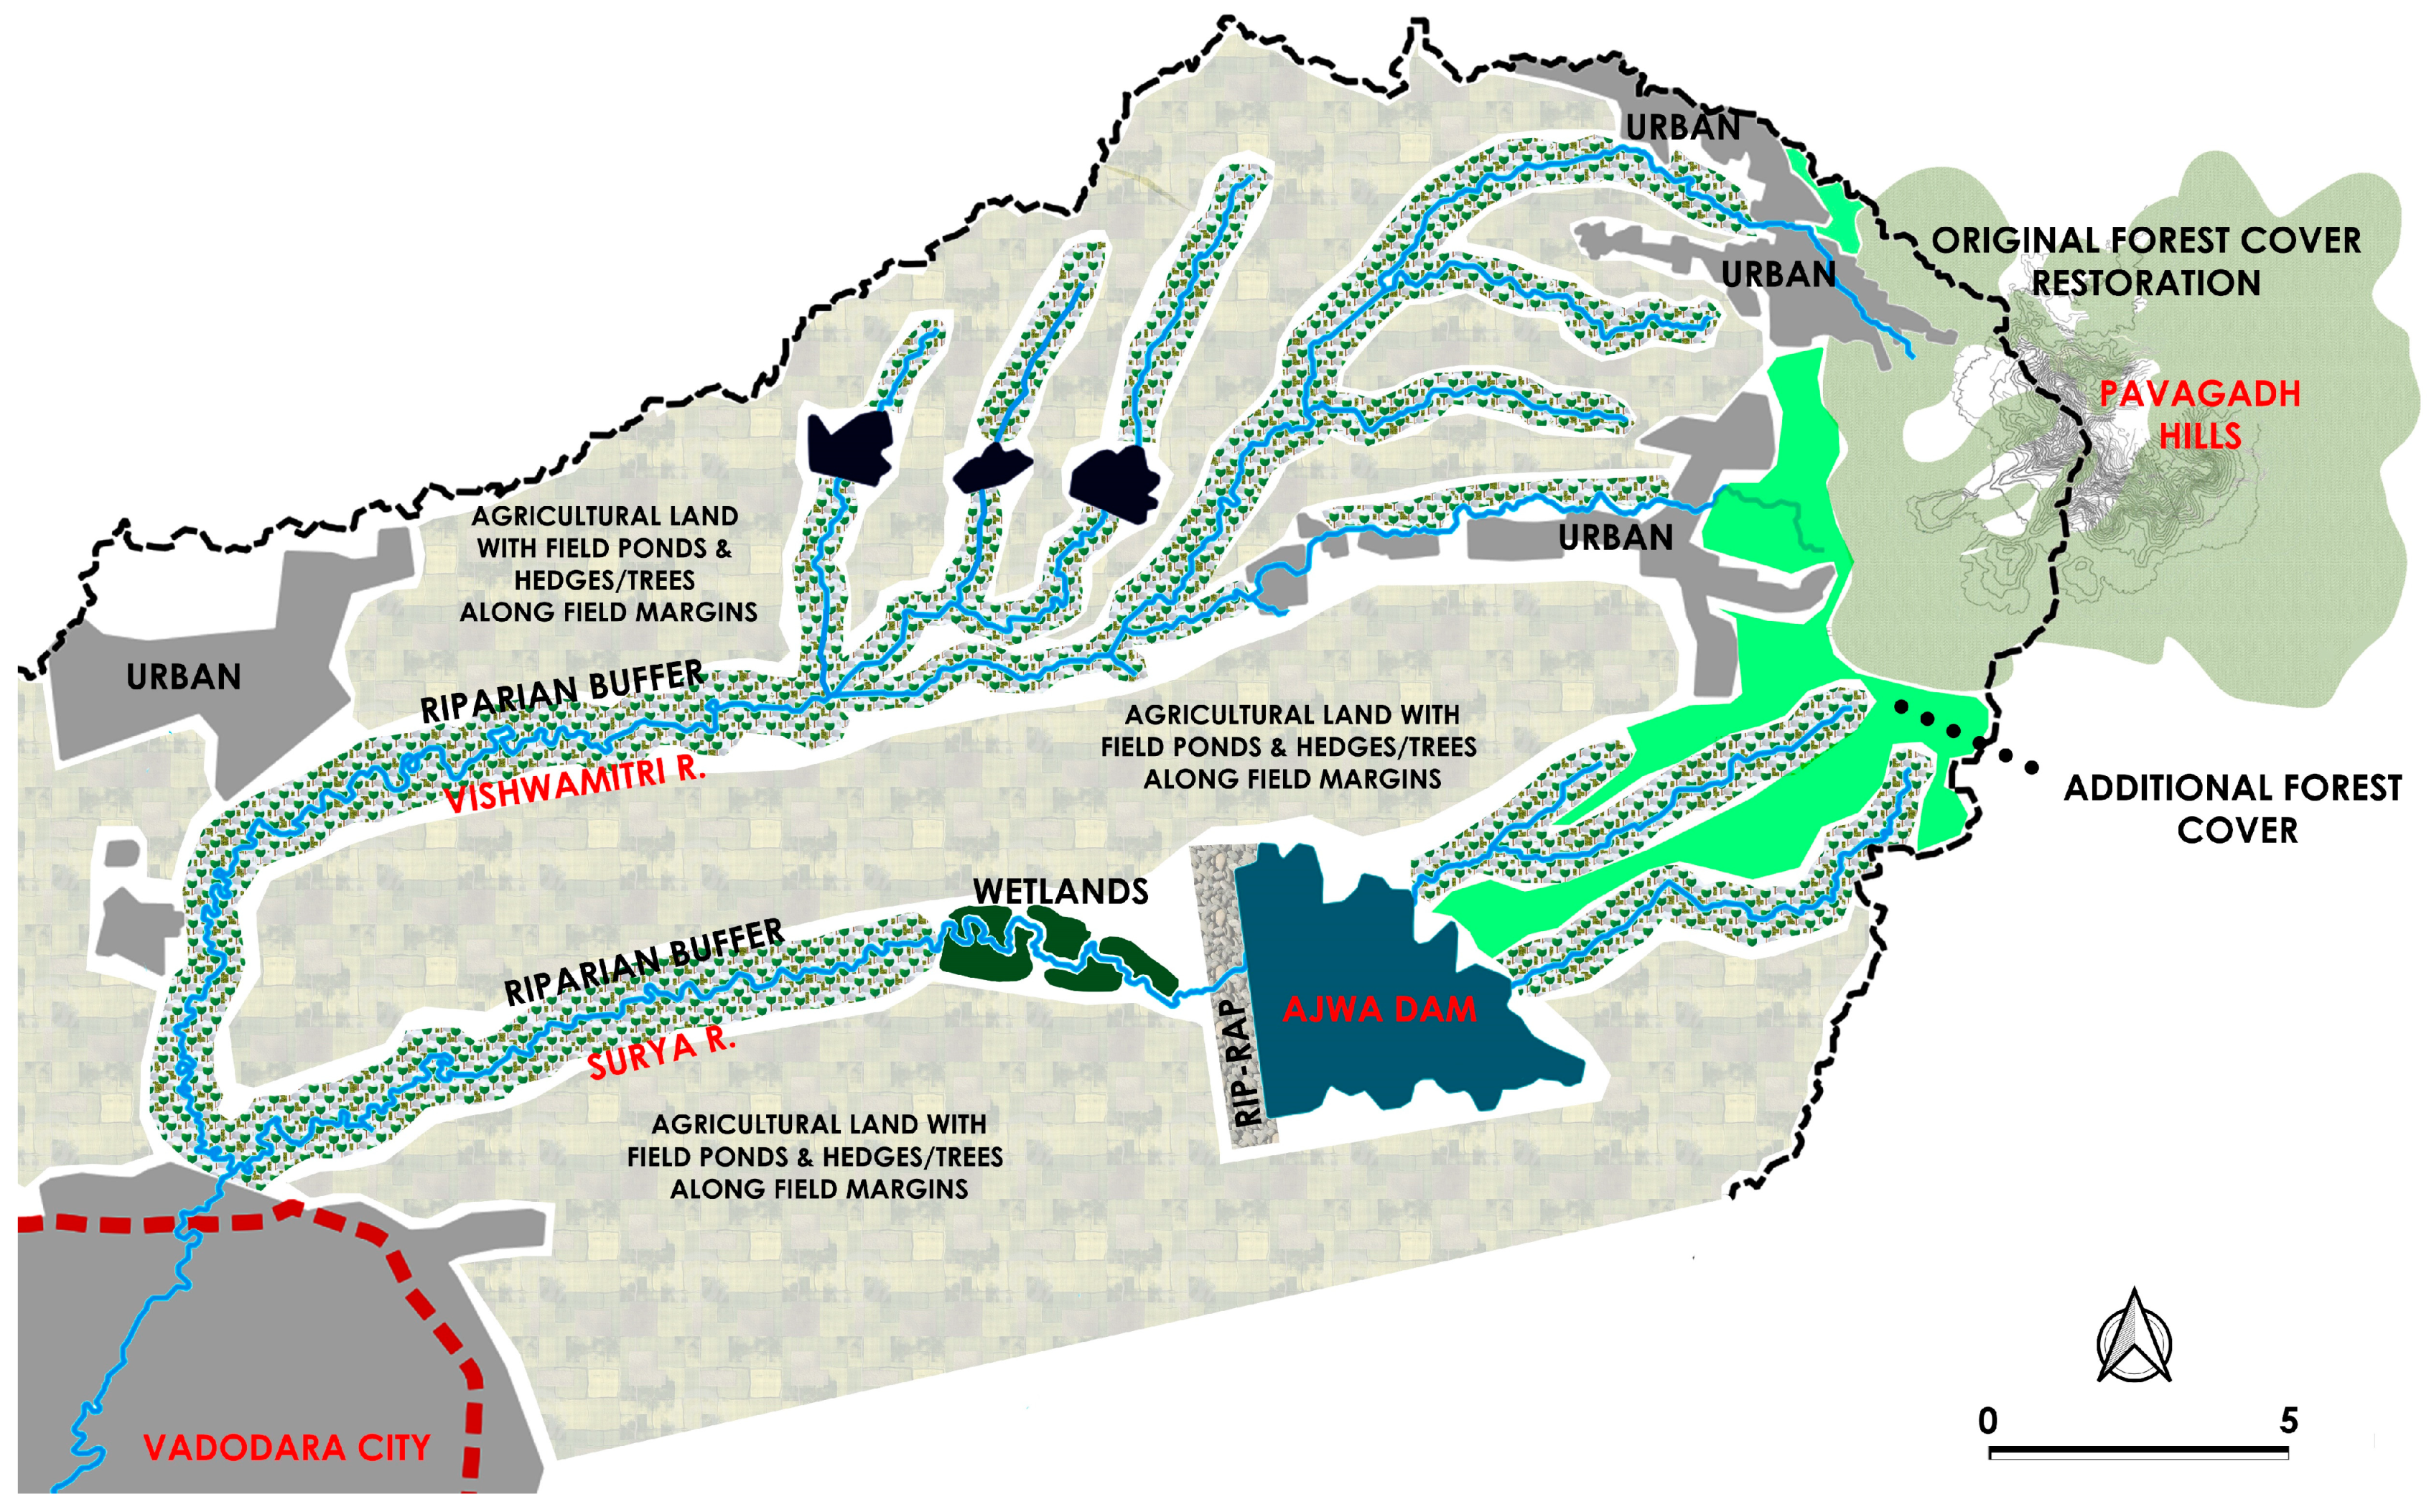
Finally, urban development inside the floodplain should be discouraged by extensively providing buffer strips along banks. Also, new developments in the upper watershed should include stormwater management in its master plan. The overall proposal scheme for the upper watershed is shown in Figure 20.

Figure 20.
Upper watershed proposal scheme.
6.2. Proposals within Vadodara City
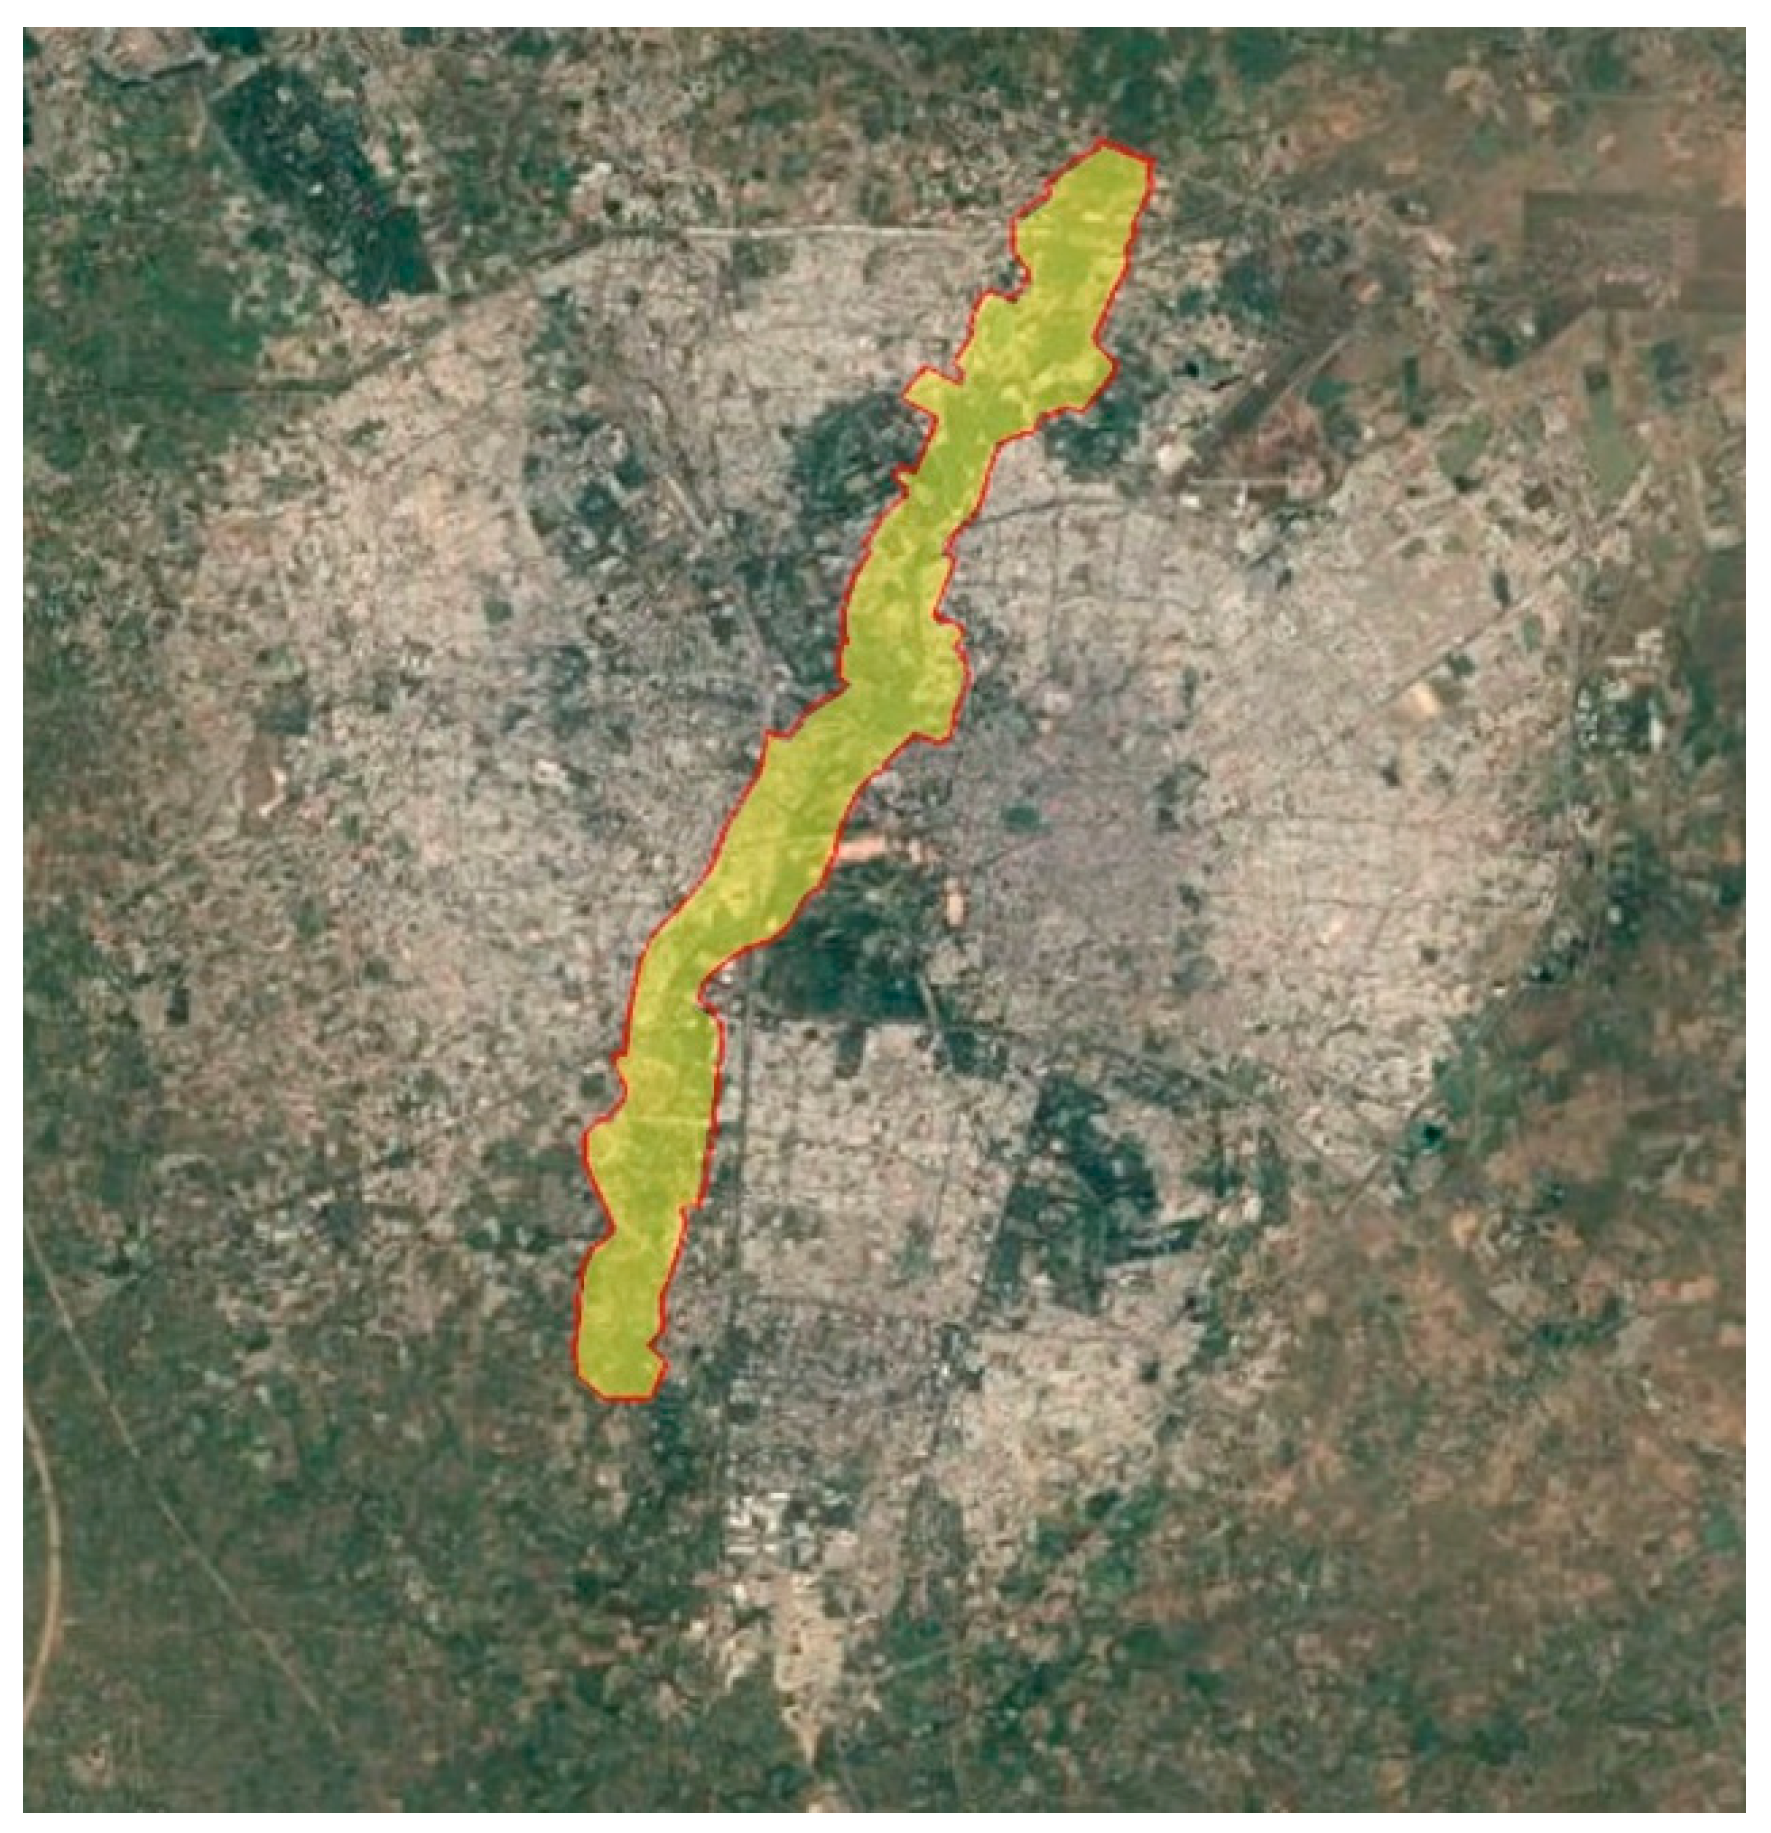
The primary objective of this study is to suggest strategies to mitigate the flood risk in Vadodara City. Nevertheless, there is a need for improvement in water and habitat quality as well. The simulated floodplain of Vishwamitri River within Vadodara City is shown in Figure 21.
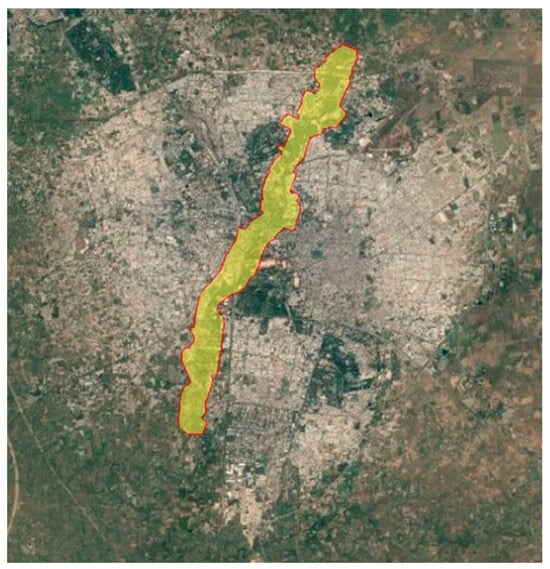
Figure 21.
Floodplain of Vishwamitri River in Vadodara City.
Flood risk can be reduced in the city by increasing the river carrying capacity, making slums safer, restoring off-channel storage, discouraging impervious encroachment, promoting infiltration by providing green buffers, etc. Furthermore, the water quality of the river stretch lying within the city can be improved by discouraging garbage dumping into the river and dealing with the sewage flow from grey infrastructure into the river. Lastly, the restoration of lost riparian cover and the reduction of human intervention in the natural environment can ensure a rich habitat quality in the river ecosystem.
6.2.1. River Carrying Capacity
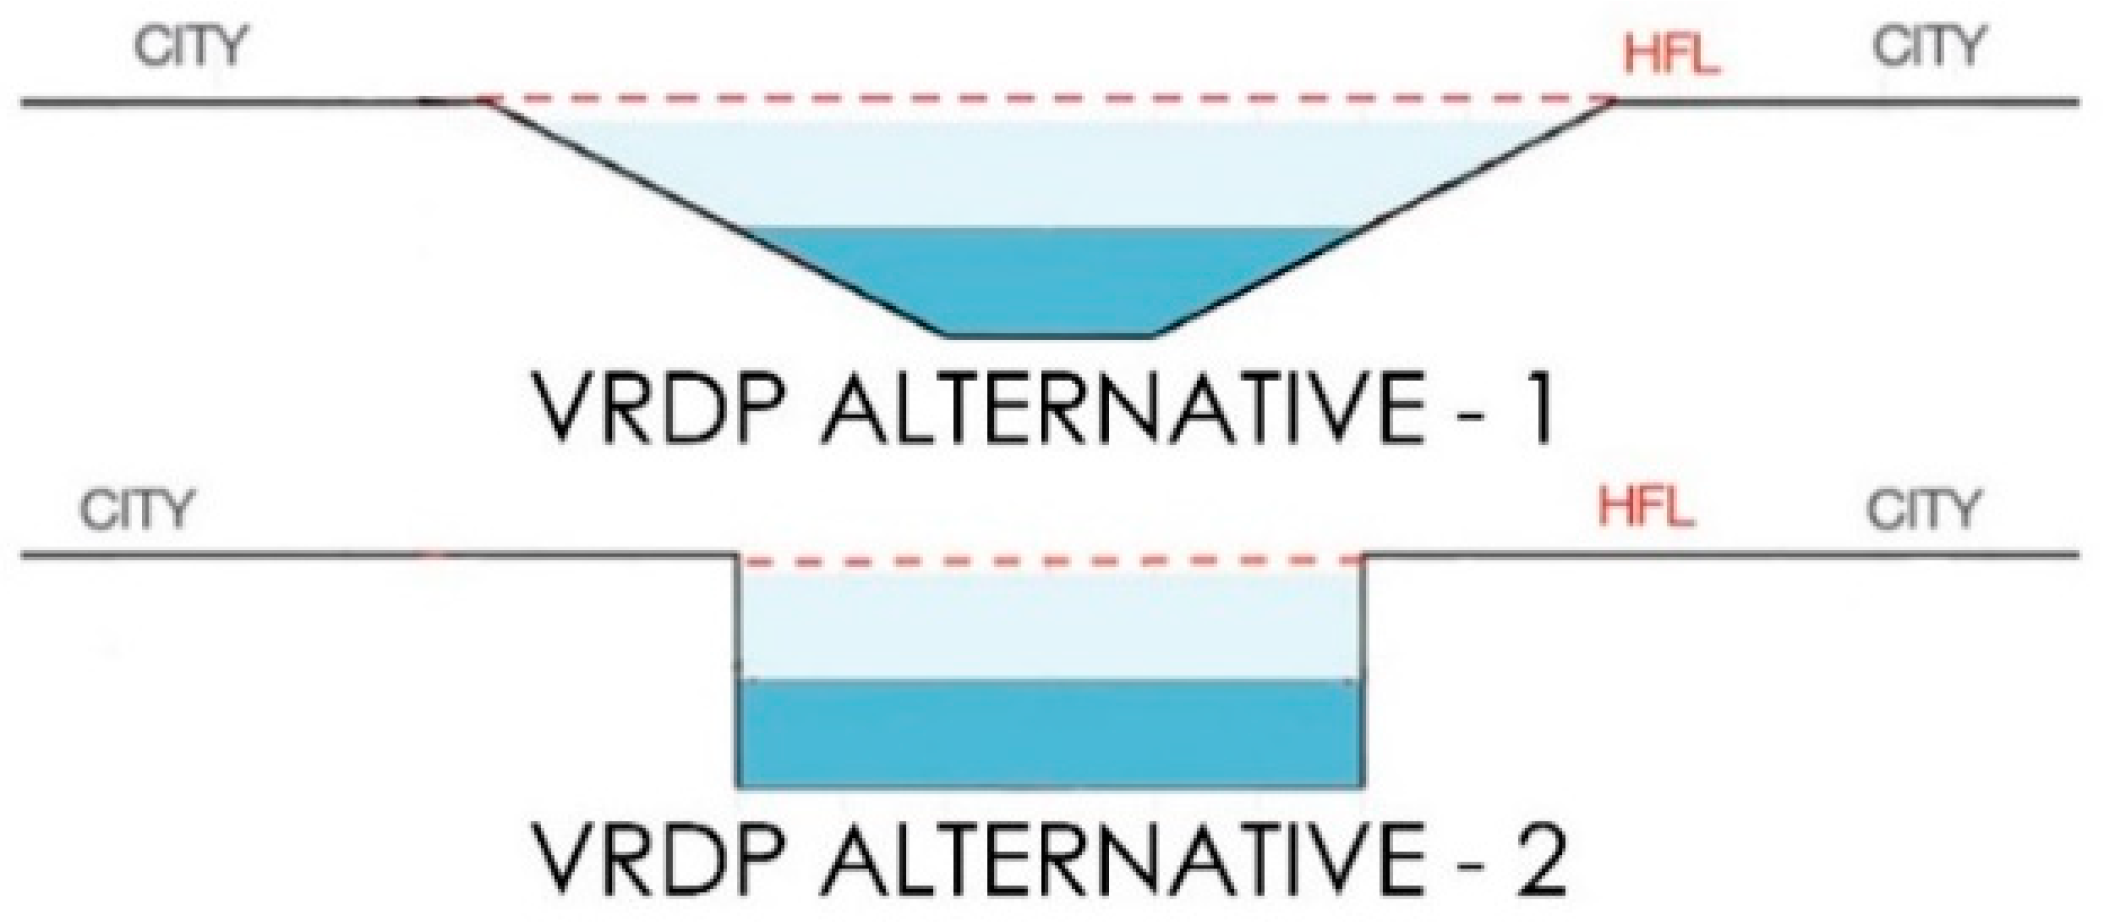
In the past, there have been several proposals for the riverfront within the city limits. Streamlining the river with rigid rectangular and trapezoidal cross-sections (Figure 22) was one of the drawbacks of previous proposals because it was supposed to be achieved at the cost of the riparian vegetation along the river banks and required digging into the river to a depth sufficient to contain the water of the highest recorded flood.
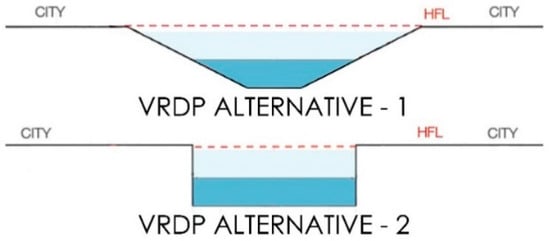
Figure 22.
Vadodara Riverfront Development Project, 2014 cross-section alternatives (Source: VMC).
Riparian vegetation plays an important role in water retention, infiltration and healthy habitat. In addition, it reduces the velocity of water and sediment flow during flood events [31]. On the other hand, river channelization will increase the speed of the flow and adversely affect the river ecosystem [32].
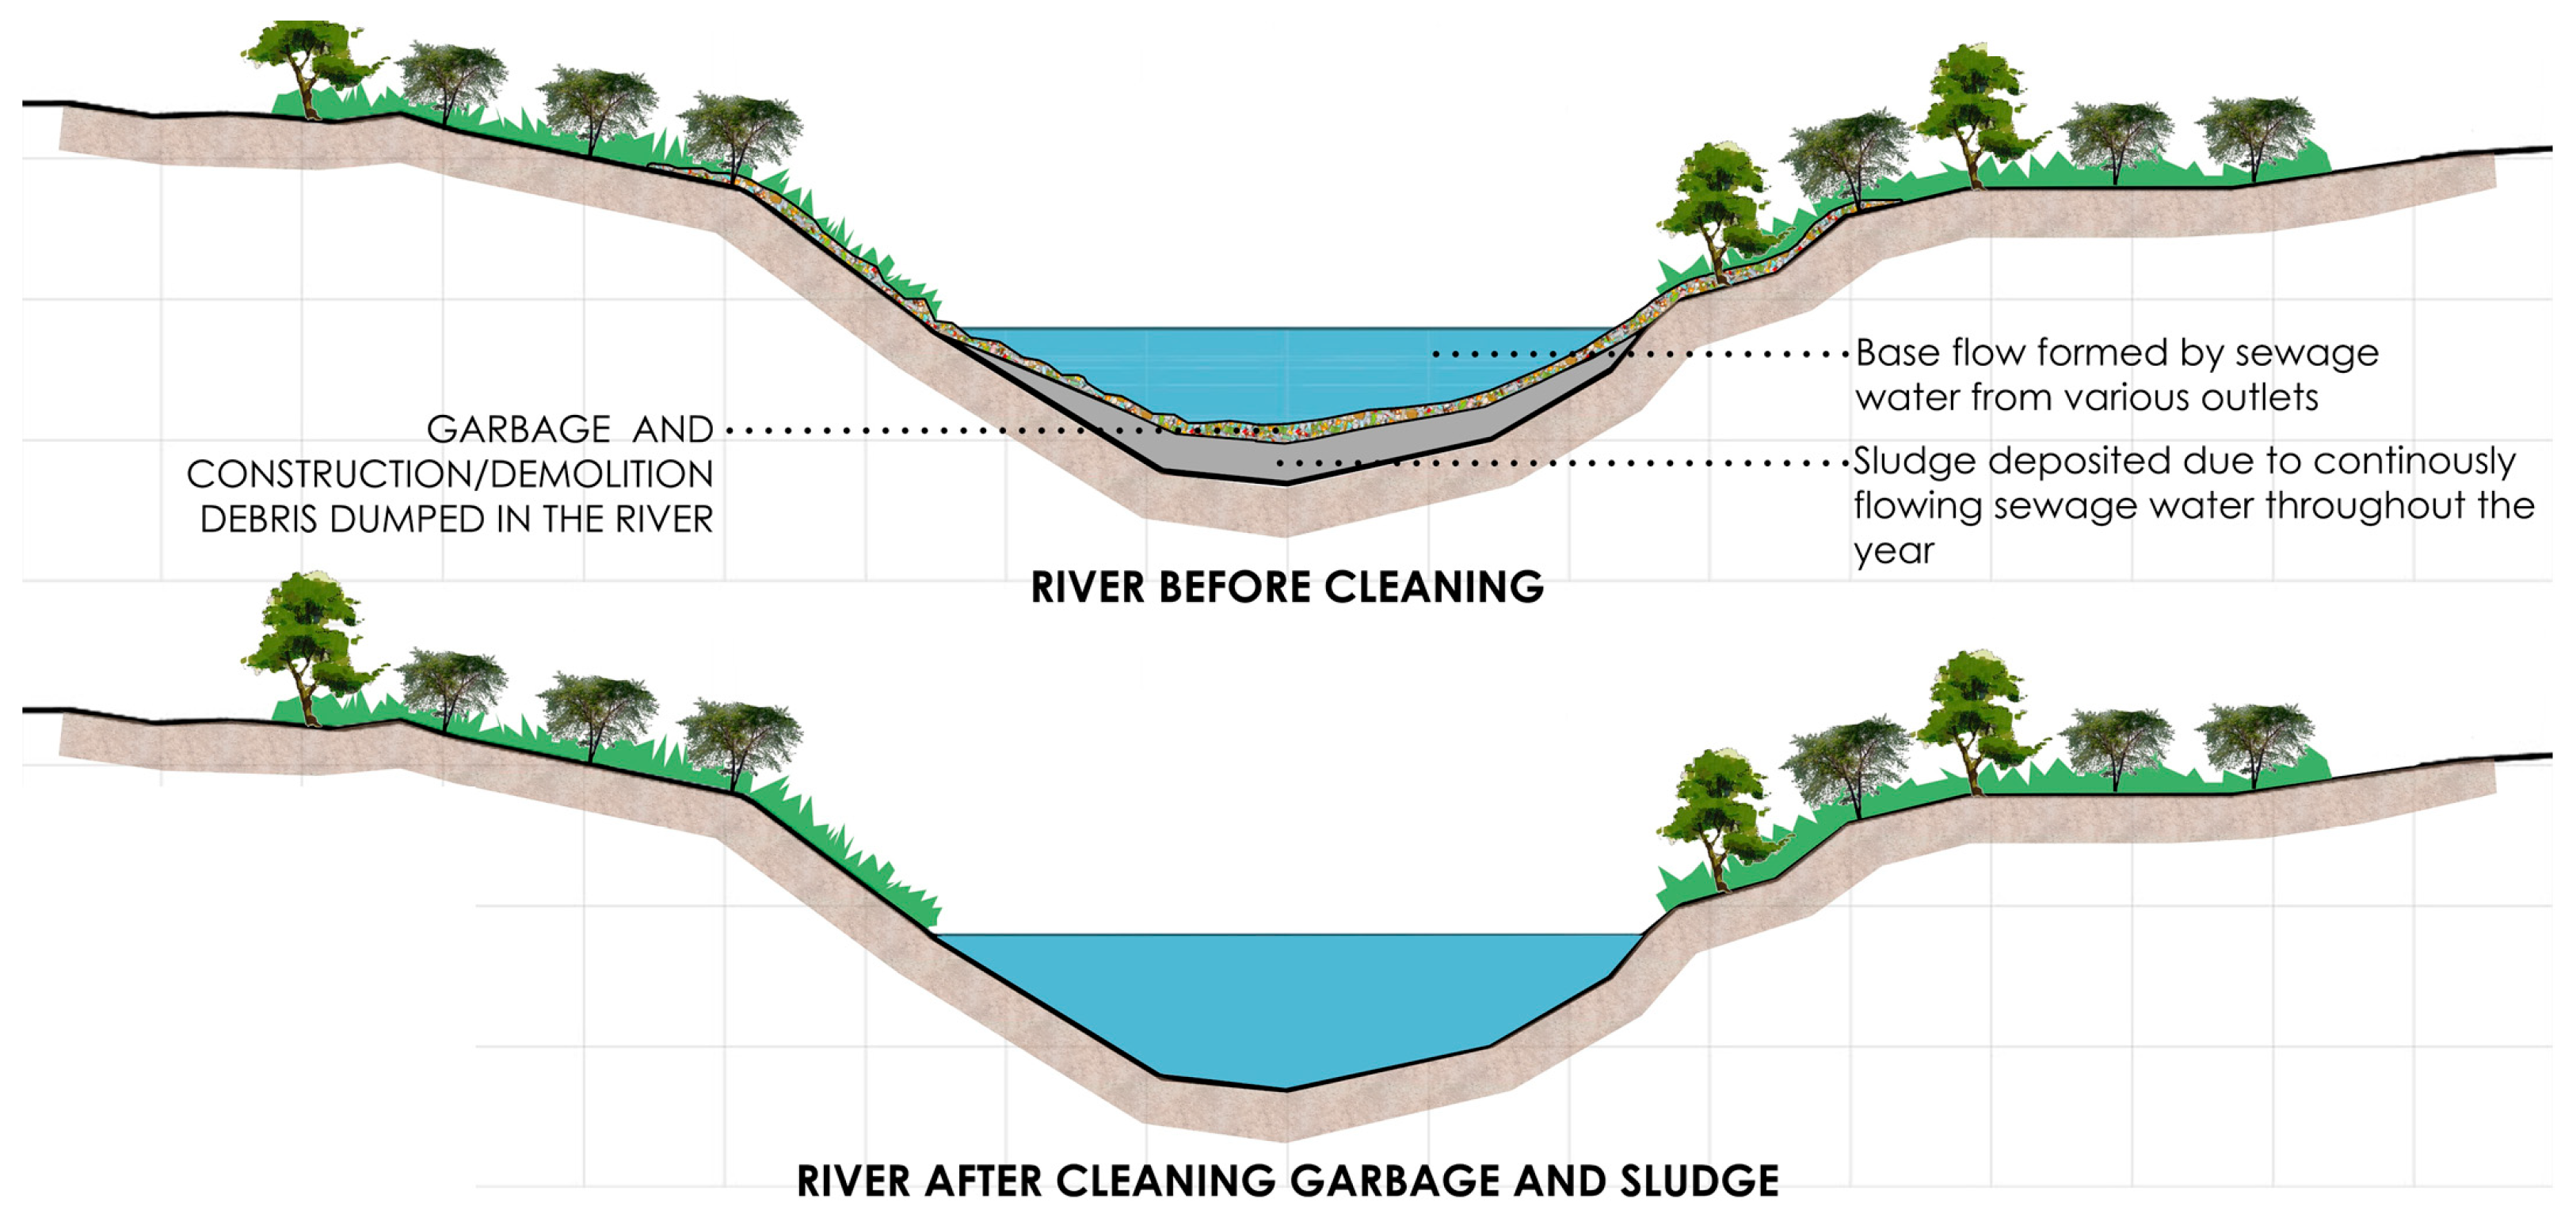
The carrying capacity of the river within the city has been reduced by 25% in the last four decades due to sedimentation, dumped garbage/debris and sewage flow into the river [6]. Thus, the original potential of the river should be restored by cleaning the river of such nuisances without causing any harm to the existing vegetation. Figure 23 shows the condition of the river before and after cleaning.

Figure 23.
Vishwamitri River, before and after cleaning.
6.2.2. River Pollution
Approximately 200 MLD of sewage flows into the river through several outlets [6]. The challenge lies in stopping the sewage water from entering the river as well as maintaining the base flow of the river for dependent species to be sustained.
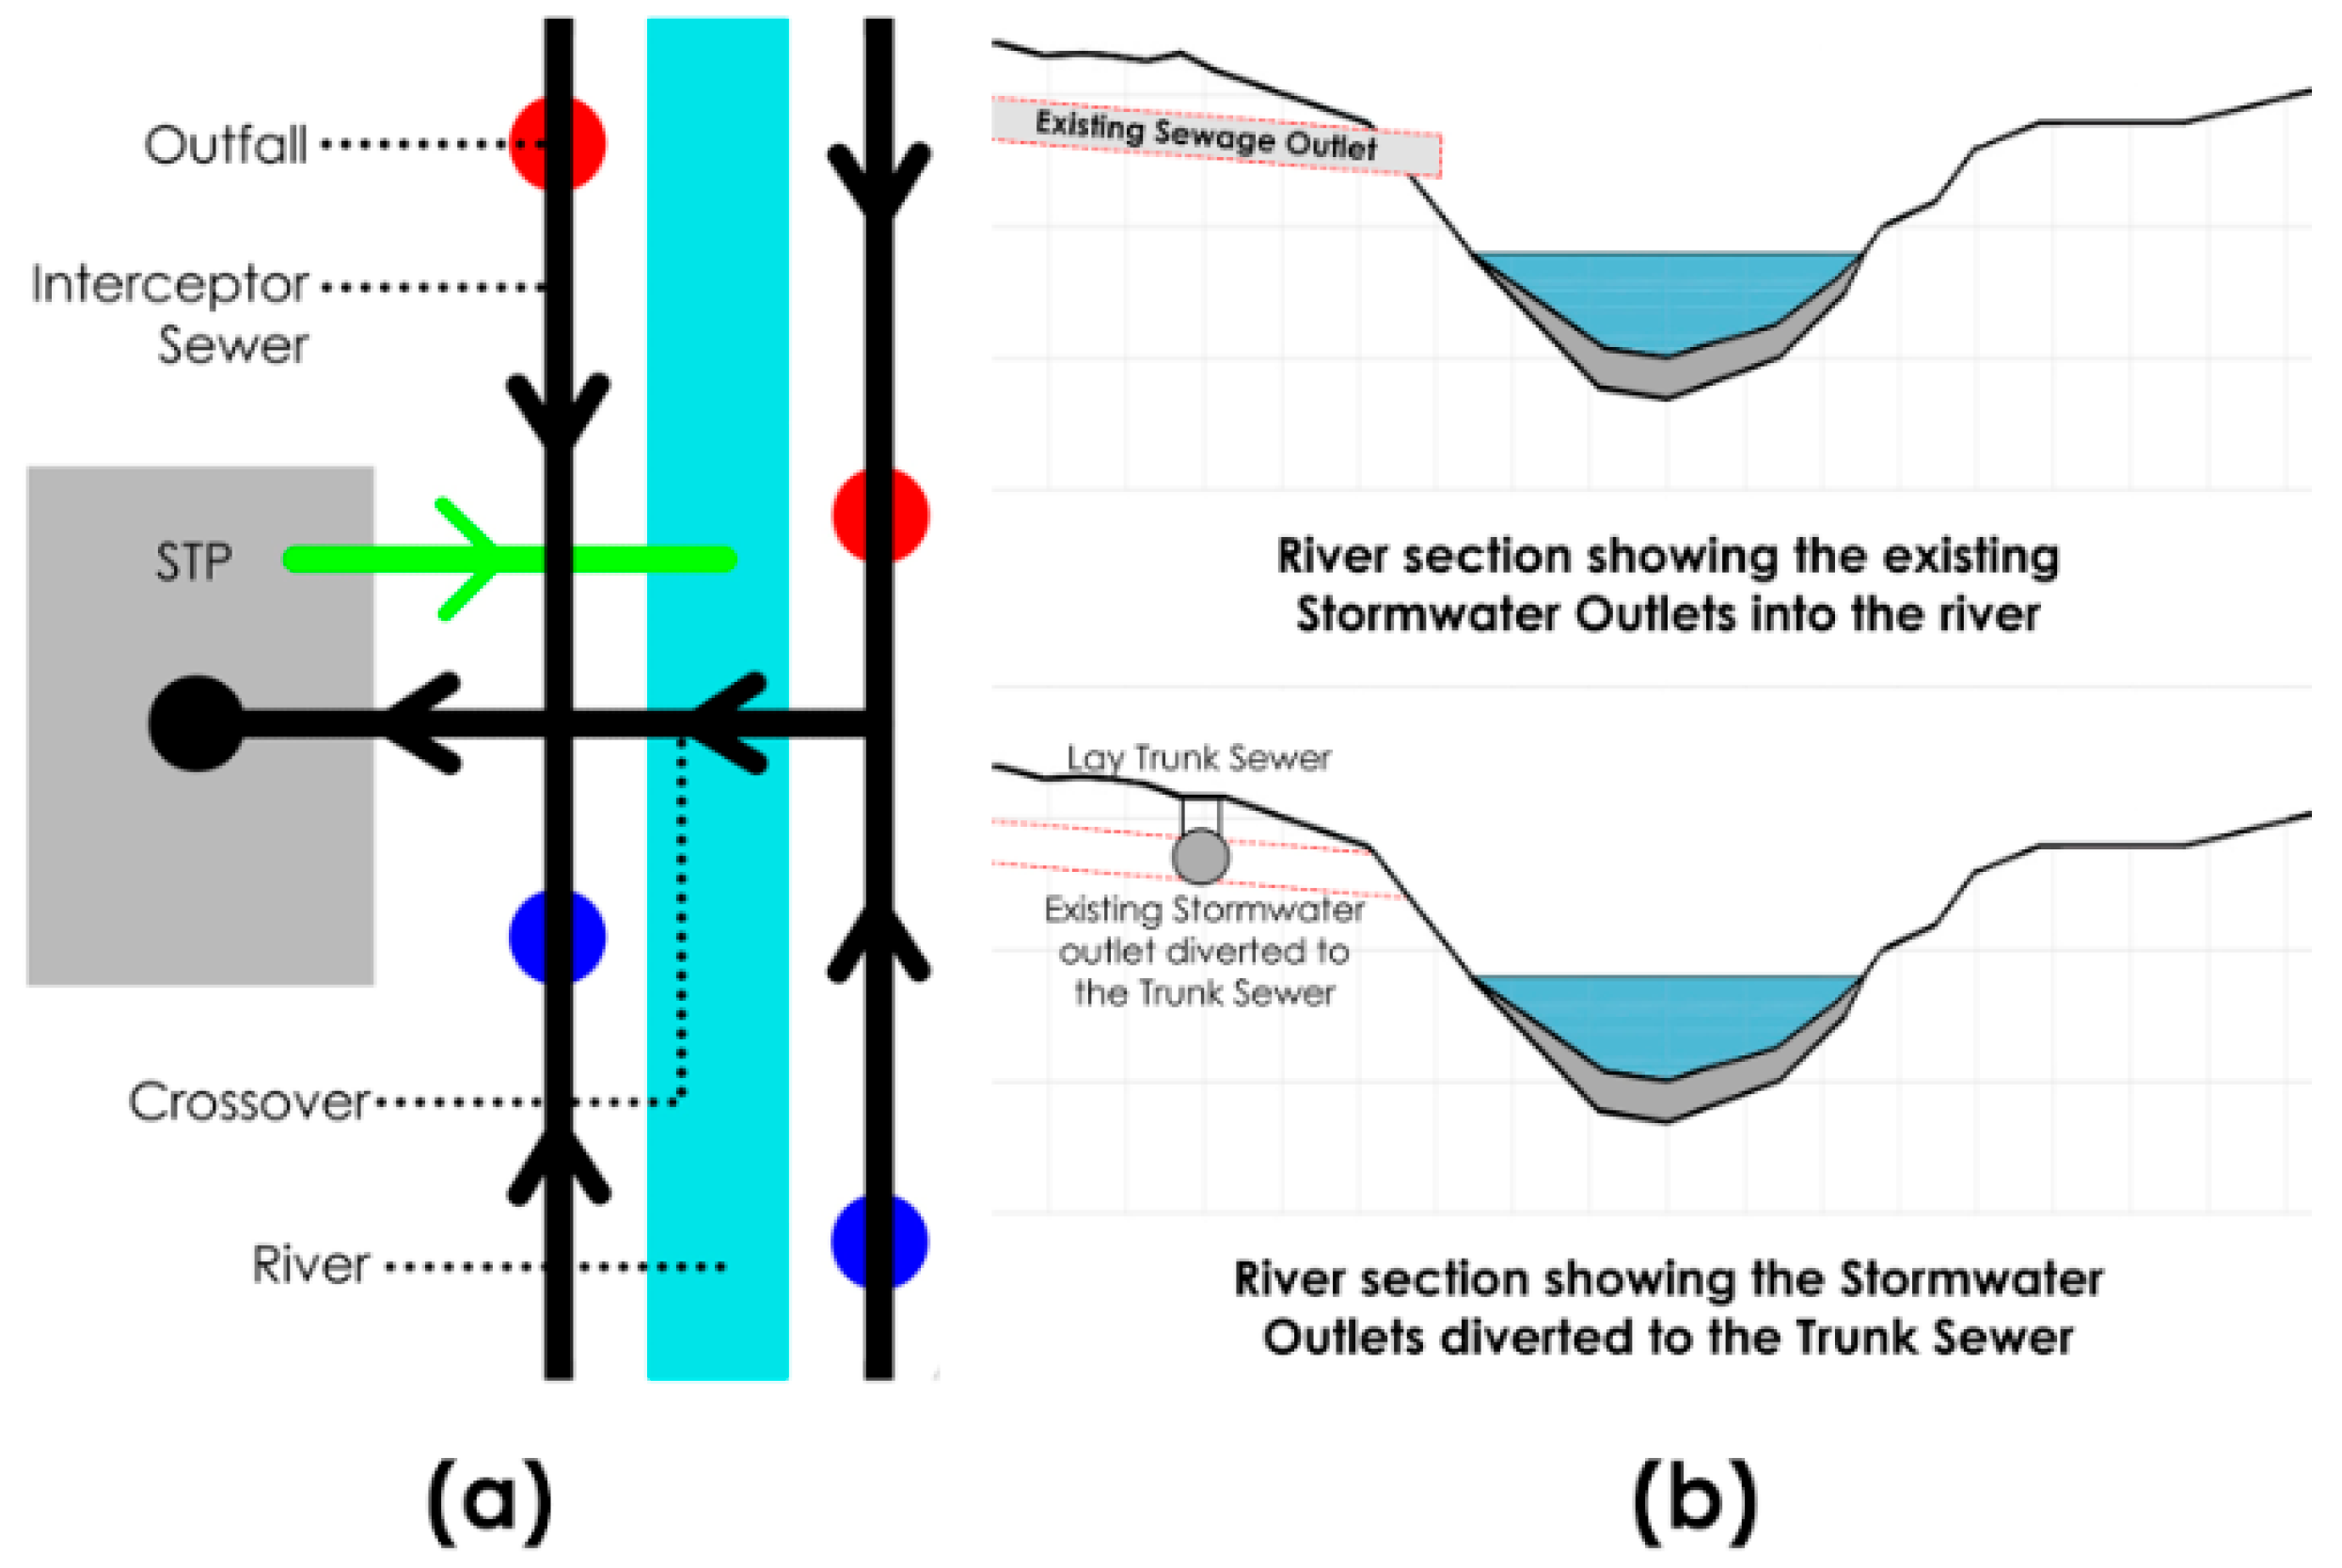
To stop the sewage water from entering the river, interceptor sewer lines parallel to the river banks are proposed to divert the flow. This diverted water will be led to nearby STPs (Sewage Treatment Plants). The treated water will then be eventually released back into the river at outlets located at a uniform interval. A conceptual diagram of this method is shown in Figure 24. A similar approach was followed in Delhi for pollution in the Yamuna River [33].

Figure 24.
(a) Flow in an interceptor sewer system; (b) sewage water diverted to a trunk line.
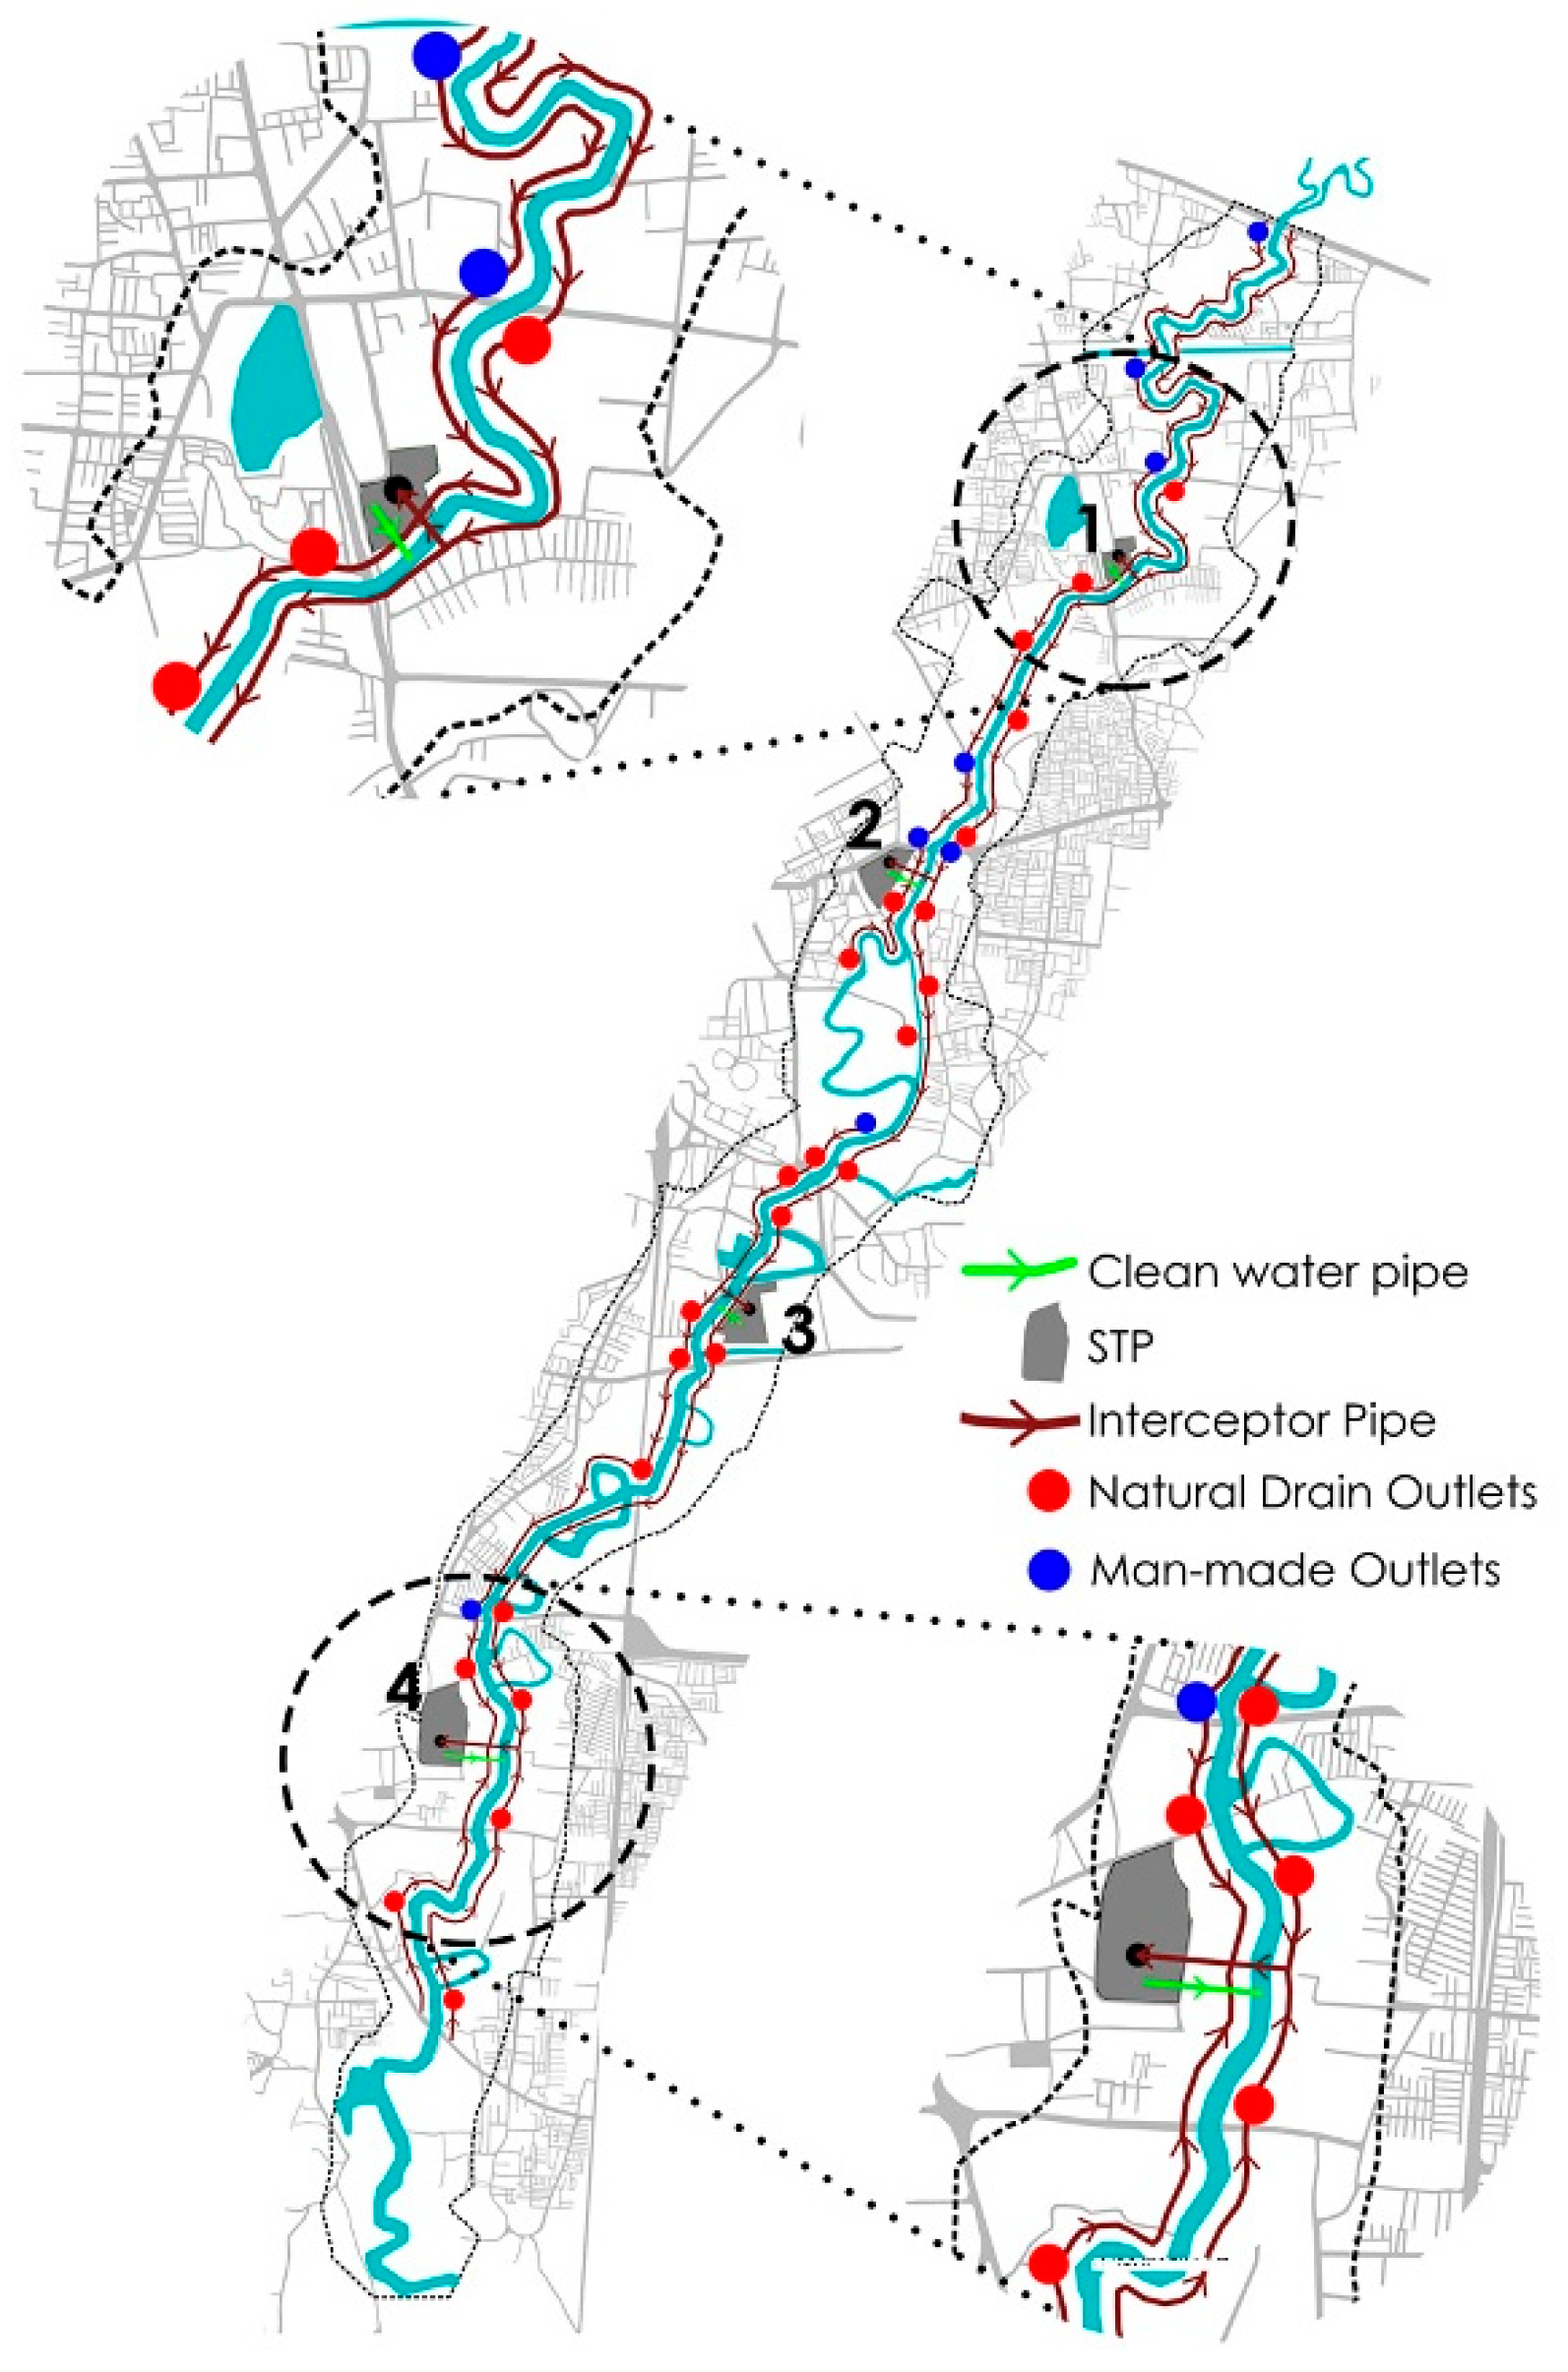
As shown in Figure 25, STP1, STP2 and STP3, each having a capacity of 50 MLD, are proposed on vacant lands along the banks without disturbing the eco-corridor. STP4 already exists and has a maximum capacity of 80 MLD. During monsoons, when the discharge is high, overflow can be diverted back into the river to avoid overload. Pumping stations need to be provided along the interceptor network as the distances are large and the slope gradient required may not be feasible on site.

Figure 25.
Interceptor sewer network.
6.2.3. Slums
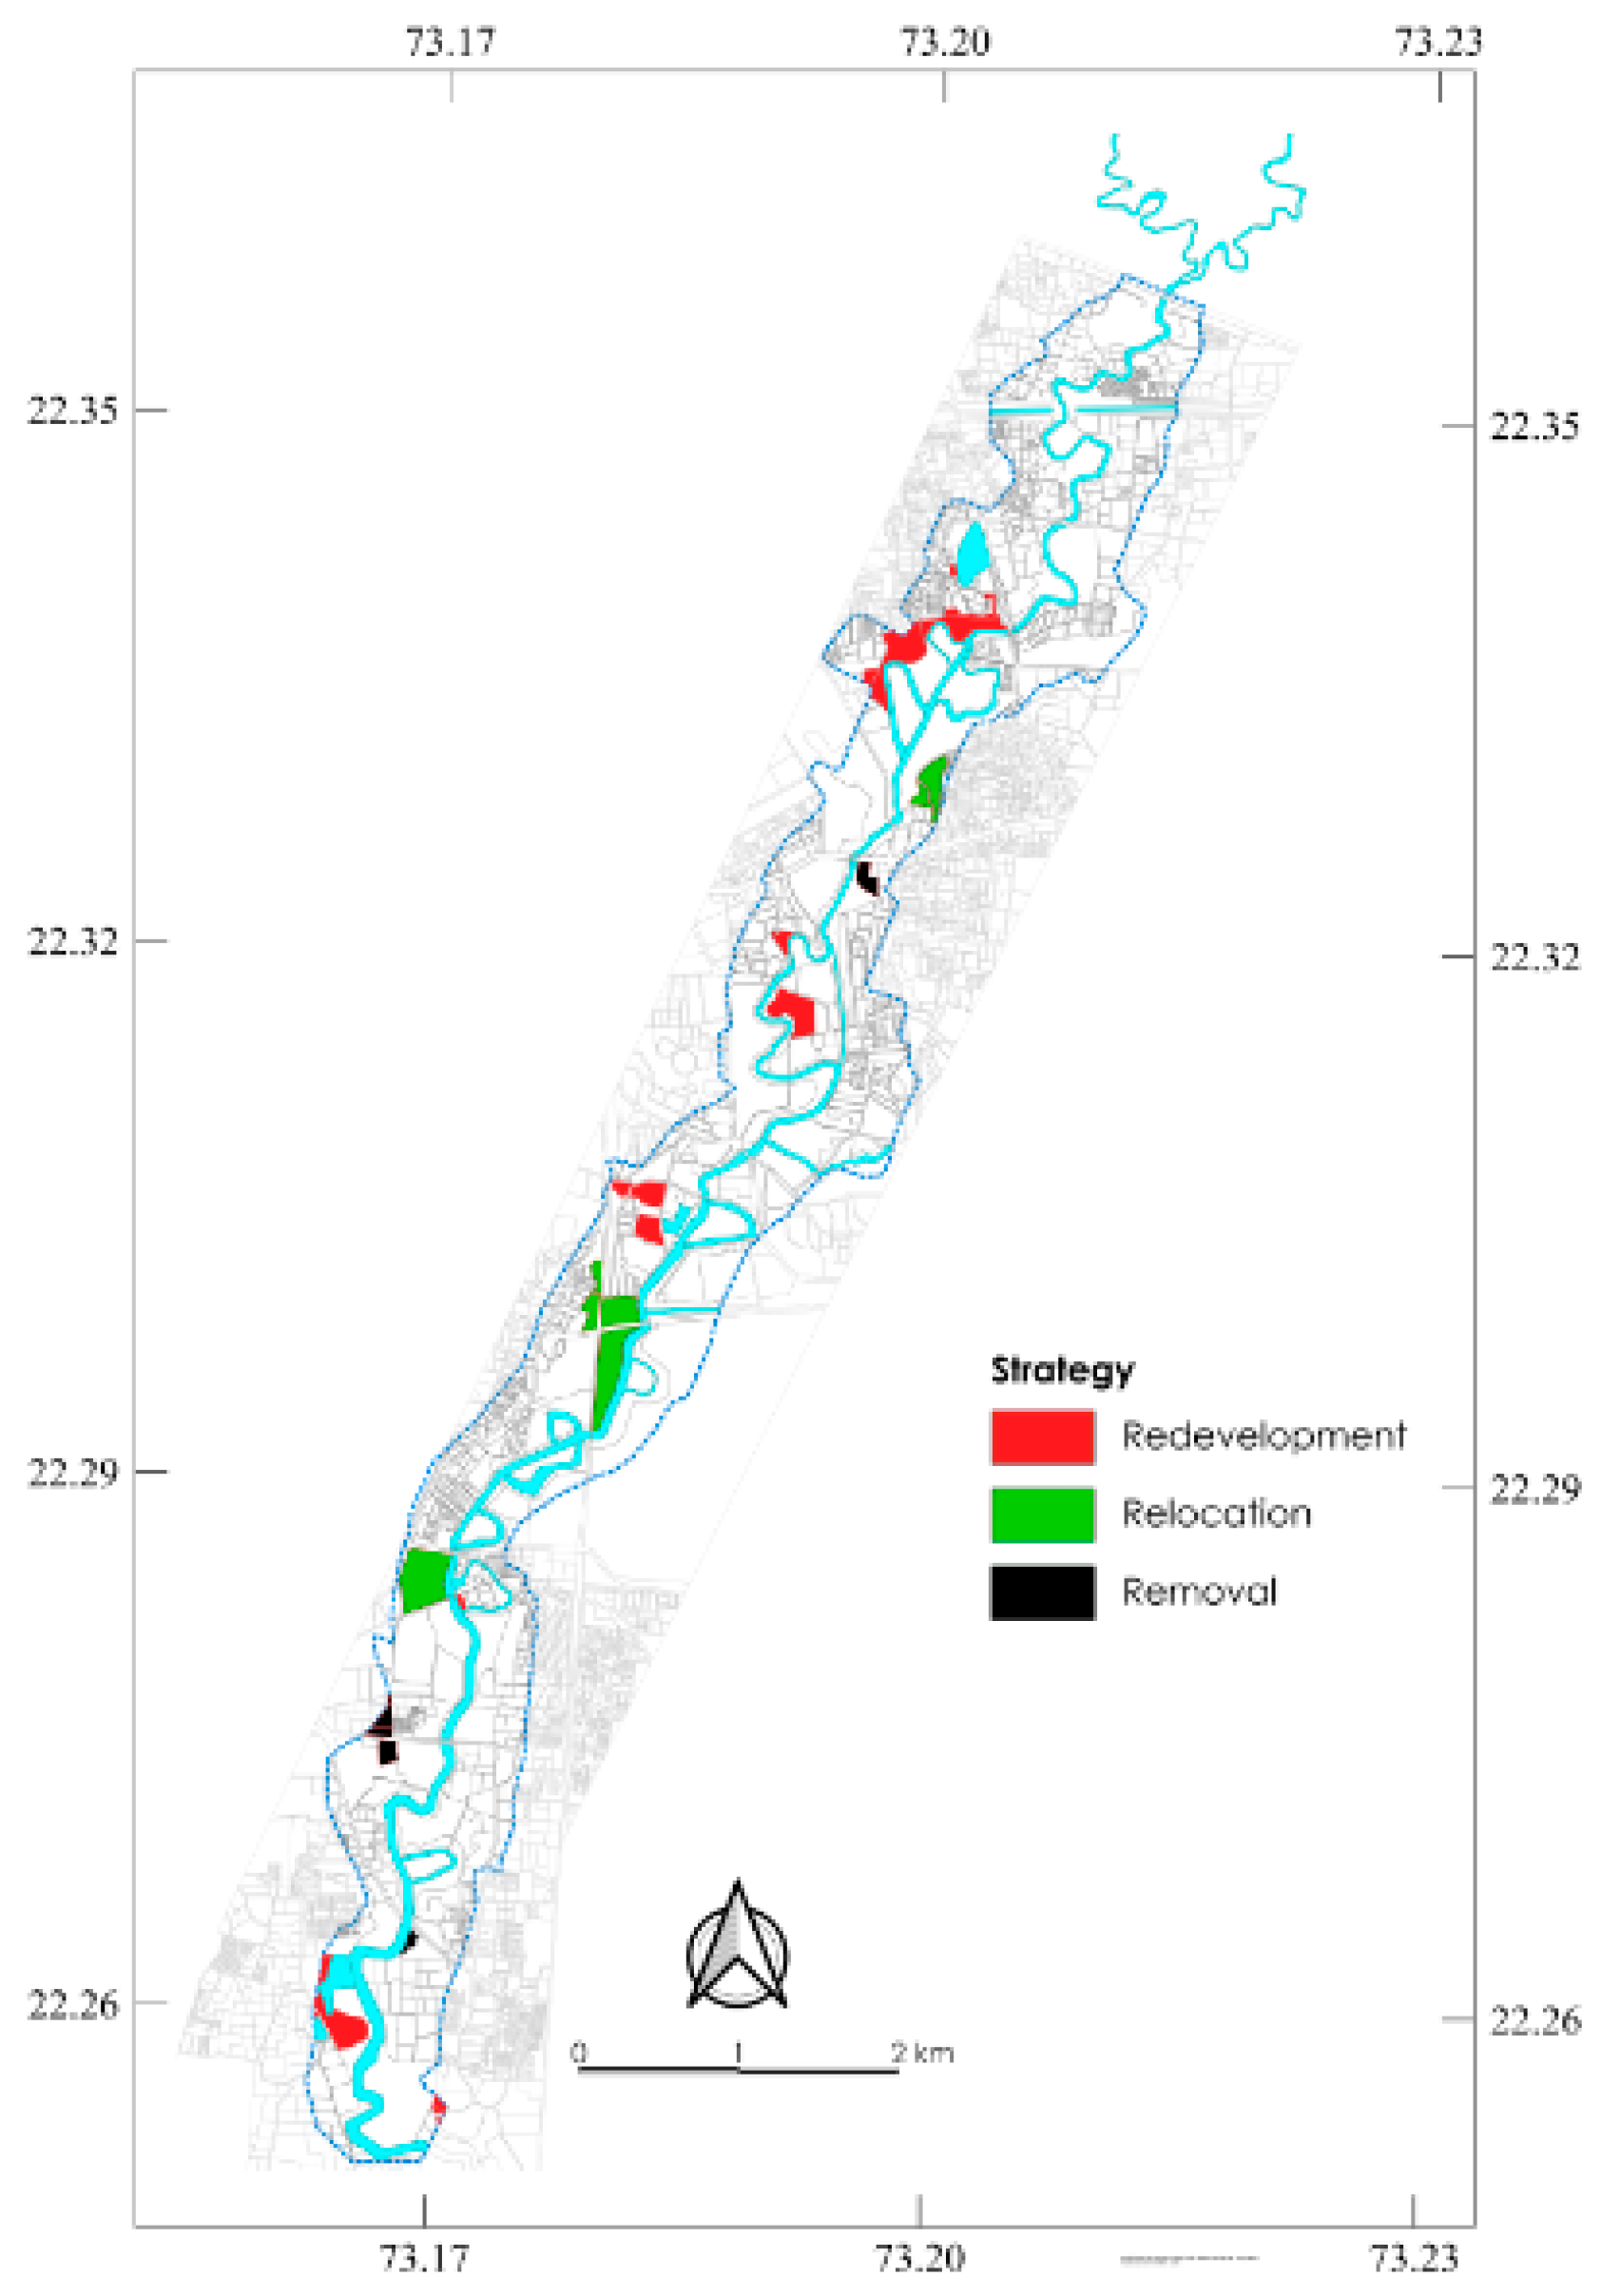
Three intervention strategies are suggested based on the location and age of the informal settlements: removal, relocation and redevelopment (Figure 26). Firstly, new slums that have come up in the last ten years should be removed as these huts were constructed despite knowledge of frequent flood events. Old encampments located on or near crocodile nesting sites should be relocated to some other place. Lastly, the remaining old slums should be redeveloped.
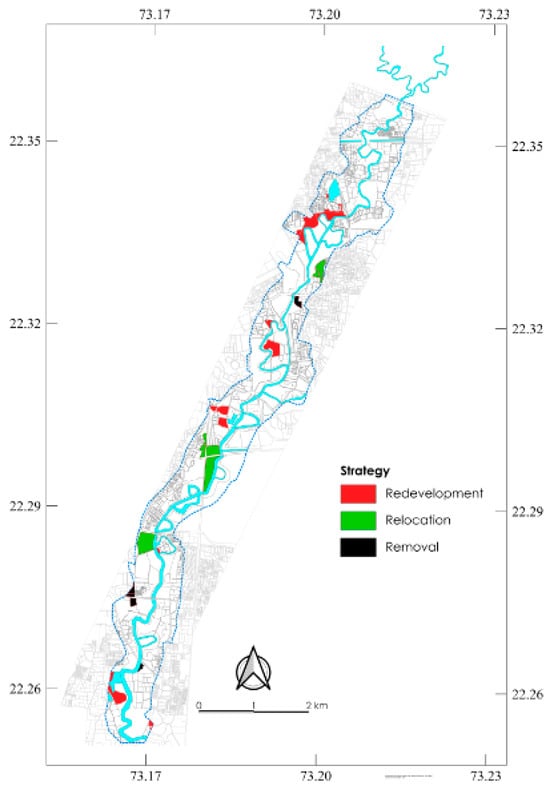
Figure 26.
Strategies for slums.
Redevelopment
Currently, old slums are in a bad state due to frequent floods and unsuitable living conditions. In addition, these informal settlements have depleted the green buffer near banks. Hence, it is necessary to restore vegetation and make it safe for people to live in these low-lying areas.
The current condition of the Shantinagar slum is shown in Figure 27. Here, the slums have encroached on river banks, depleting the original vegetation. Also, houses are all G structures, which makes it difficult for slum dwellers to stay in their homes during floods.
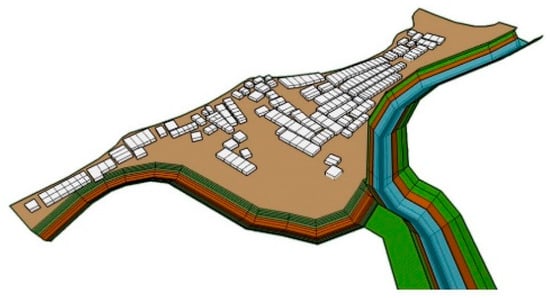
Figure 27.
Current condition of old slums.
Figure 28 shows the condition of the Shantinagar slum after redevelopment. Here, the green zone is restored, and people are given provisions to live on higher levels while the ground floor in each building is kept as a stilt parking. A community bin is also provided to mitigate garbage disposal into the river.
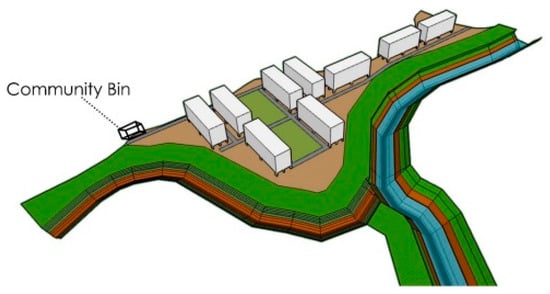
Figure 28.
Redeveloped condition.
6.2.4. Man-Made Channels
No more human-made connections are to be made against the meandering nature of the river as it can lead to further losses to the river’s length and, hence, its carrying capacity [34]. In addition, as shown in Figure 29 all lost connections should be restored and dug out to their original depths [34].

Figure 29.
Restoring lost connections.
6.2.5. River Riparian Buffer
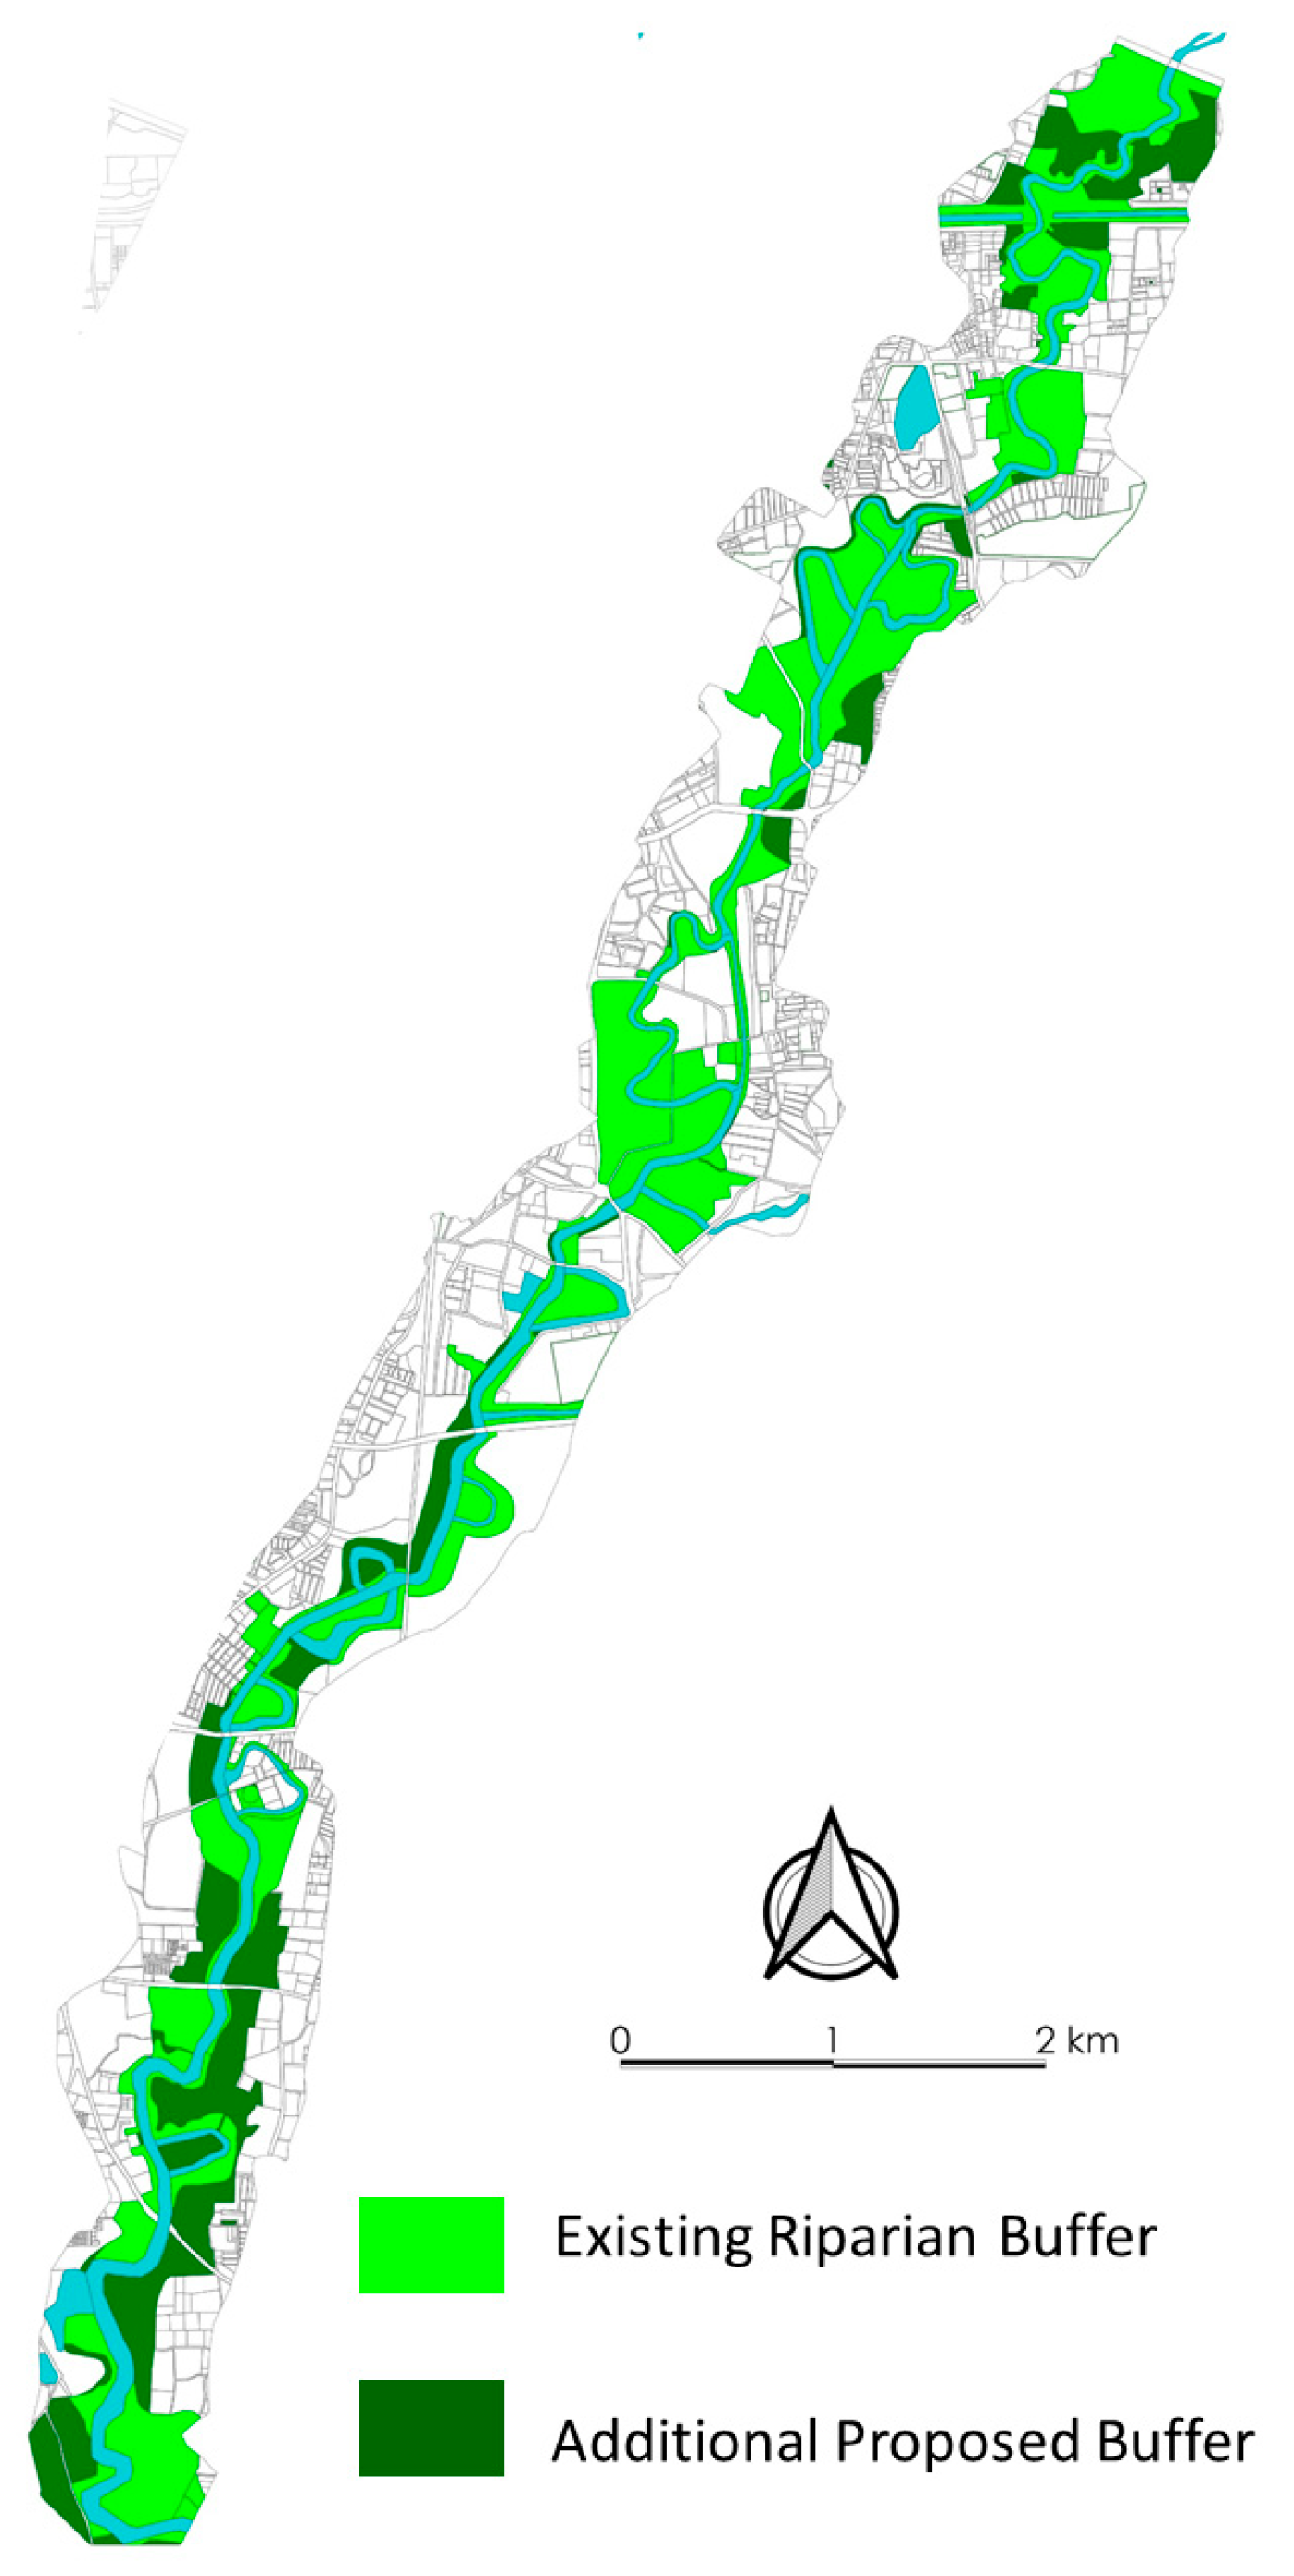
Several eco-zones/large open spaces are still found along the river in Vadodara City despite urban encroachment. But, there are river stretches where very little or no green buffer is present. At such stretches, a minimum of 50 m buffer is proposed mainly at the cost of agricultural lands, vacant lands and slums (after redevelopment, relocation and removal) [25]. Figure 30 shows existing vs proposed vegetation buffer within the simulated flood-plain.

Figure 30.
Existing vs. proposed vegetation buffer.
6.2.6. Off-Channel Storage
A significant proportion of wetlands have been lost in the city. Between 2005 and 2018, 41.04 hectares of wetlands were lost due to reclamation [35]. Wetlands store excess water, help in groundwater recharge and enrich biodiversity [36]. Consequently, lost wetlands should be restored as much as possible (Figure 31).
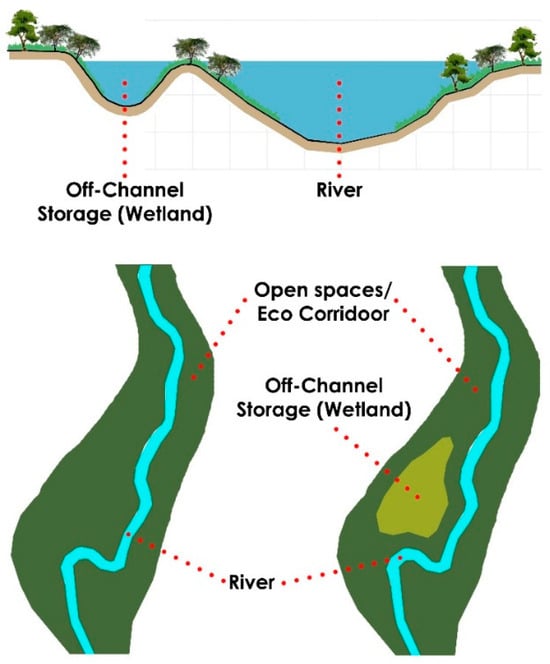
Figure 31.
Off-channel storage (wetlands).
6.2.7. Crocodile Habitat and River Accessibility
Authorities at Sayaji Baug have successfully kept its ecosystem undisturbed for a long time. Humans are treated as temporary guests in the park, and the river is made accessible only through enclosed bridges that do not require a large stretch of river banks [5].
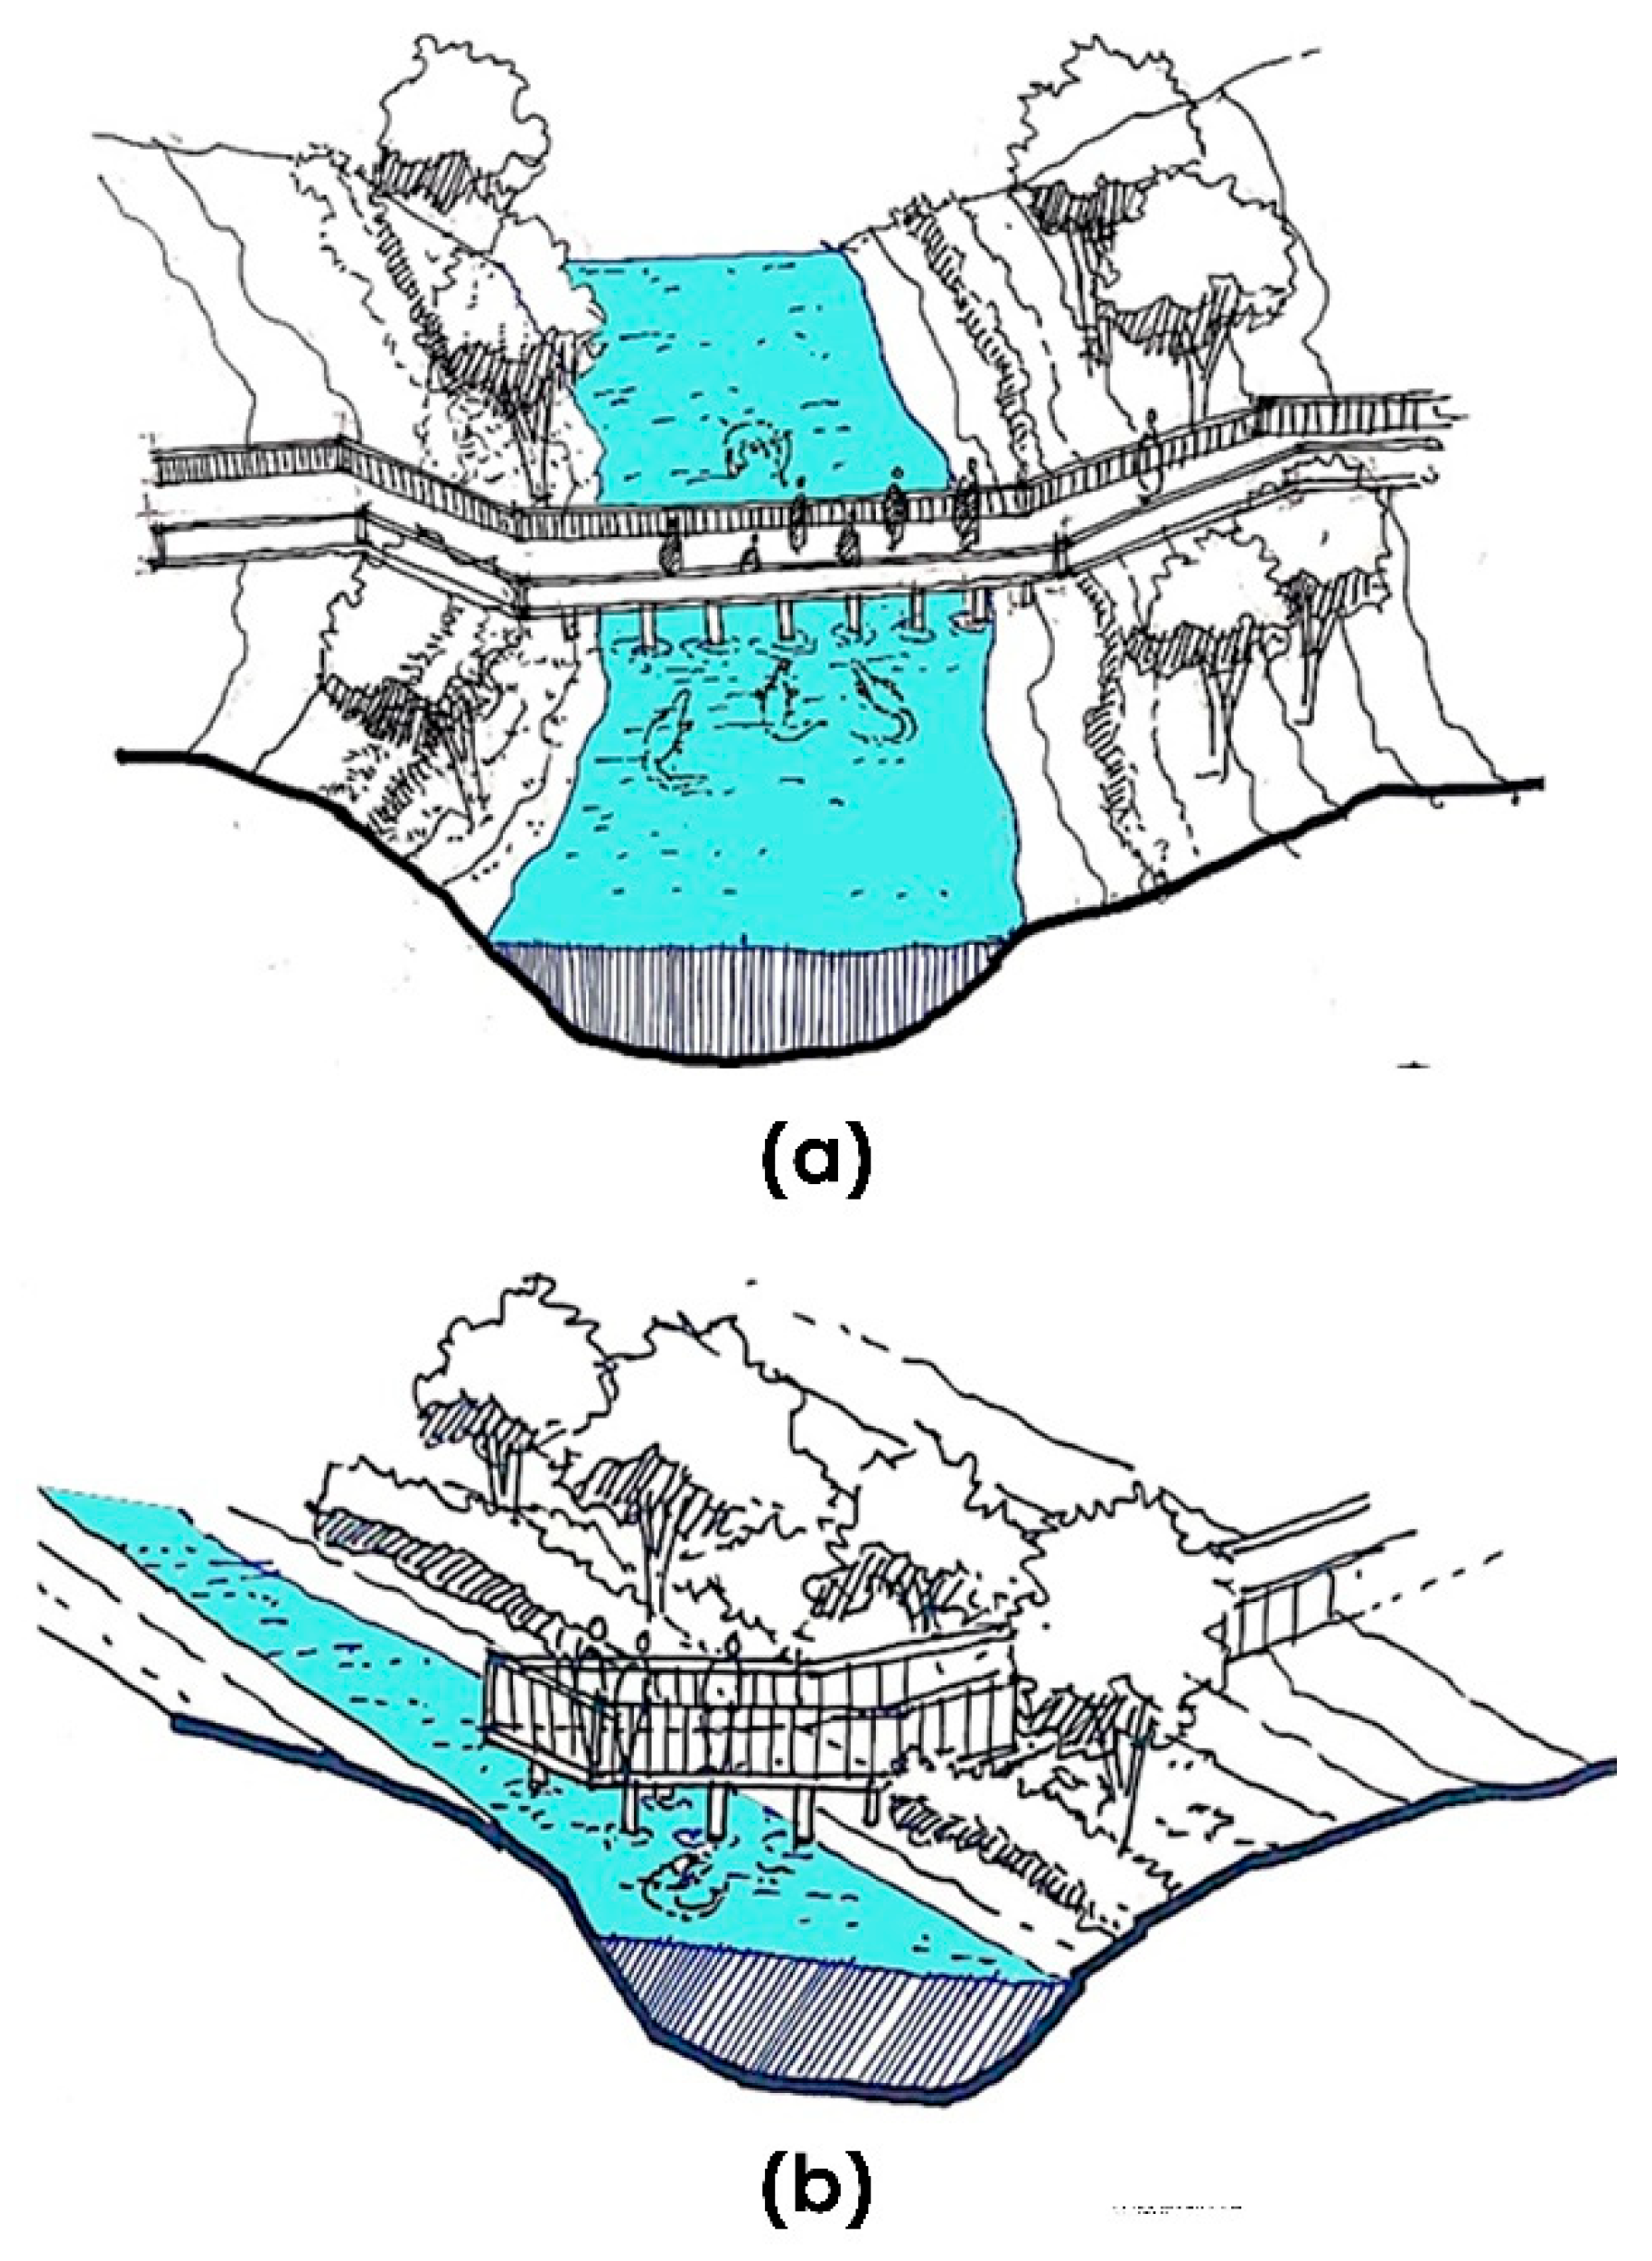
As shown in Figure 32, the idea of enclosed pedestrian bridges should be adopted from Sajayi Baug and used near crocodile habitat sites for people to see them. Half-bridges will also perform a similar job of restricting human accessibility in addition to providing recreational opportunities.
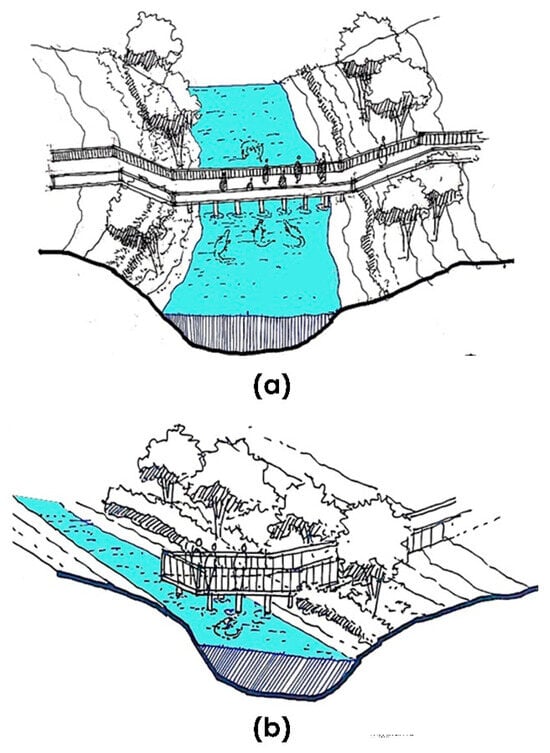
Figure 32.
View of river showing proposed (a) full bridge and (b) half bridge.
6.2.8. Miscellaneous
There are no laws governing the construction of new properties in the floodplain. New commercial buildings, as well as residential neighbourhoods, are coming up near the river each year [37]. Thus, the future of the river is in grave danger if things move in the same direction. For any construction, a minimum of 9 metres distance from the river’s floodplain must be maintained [38]. In addition, unauthorized construction needs to be either removed or relocated as required.
In 2010, the Government of India formed the National Green Tribunal as a quasi-judicial body [39]. However, a separate judicial body is needed for environmental issues in India as the existing judiciary is overloaded with cases and lacks expertise in the subject [40]. In the case of Vadodara City, thousands of people lost their homes when their huts were cleared without any strategy for them after the Vishwamitri Riverfront development project was proposed in 2014 [41].
There are acts and directives that govern inter-state rivers but not small rivers like Vishwamitri, which belongs to one state only. Specifically, issues such as deforestation leading to soil erosion downstream or the negative impact of the construction of engineered detention structures like dams on river systems have been addressed by the IWRD (Interstate River Water Disputes) Act, which limits its scope to inter-state rivers only. This domain of environmental laws needs to be expanded to smaller watersheds as well [42].
The Vishwamitri Watershed lies under the jurisdiction of two districts: upstream of Panchmahal District and downstream of Vadodara District. Vadodara Municipal Corporation (VMC) has been assigned the task of coming up with a solution to the flood problem. Nevertheless, interventions proposed in the past have been limited to the jurisdiction of VMC itself. Consequently, a separate organization should be assigned the task of coming up with a wider vision for the entire watershed by ignoring the administrative boundaries.
7. Conclusions
This study looks at the problem of fluvial flooding in Vadodara City from the perspective of the whole watershed. Authorities for the Vishwamitri River before have never adopted such an approach. Since the river-watershed system is an integrated arrangement, ignoring any fraction of it while proposing flood mitigation strategies can only lead to half measures. The data-scarce upper watershed was studied using secondary data only whereas flood mapping for the city limits was done using 1D HEC-RAS model. Furthermore, a primary flood survey was conducted within the simulated floodplain to understand its various aspects. In addition to flood modelling and scientific surveys, the inclusion of native people in creating a vision is crucial for the success of any proposal. Moreover, environmental aspects of the river ecosystem are equally important in taking an objective to fruition. Finally, engineered solutions like construction of addition detention dams or developing a riverfront after stream widening will only take the river further away from its true essence. Most that can be done for such flood-prone rivers is restoration of its ecosystem as best as possible if any man-made losses have already occurred. In an untouched river system, the possibility of flood damage is negligible as all the aspects are finely balanced by nature.
Funding
This research received no external funding.
Institutional Review Board Statement
Not applicable.
Informed Consent Statement
Informed consent was obtained from all subjects involved in the study.
Data Availability Statement
The data presented in this study are available on request from the corresponding author.
Conflicts of Interest
The authors declare no conflict of interest.
References
- Government of Gujarat. History. Available online: https://vadodara.nic.in/history/ (accessed on 3 November 2021).
- History of Vadodara. Available online: https://historyofvadodara.in/ajwa-reservoir-sayaji-sarovar/ (accessed on 2 January 2021).
- Bhatt, B.; Sharma, S.; Joshi, J.; Patel, S.; Lohar, T. The Hydrological Response of Vishwamitri River Watershed: A Spatio-Temporal Analysis of the Impact of Land Use Change on Planform. Int. J. Geol. Earth Environ. Sci. 2018, 8, 44–53. [Google Scholar]
- VMC. City Disaster Management Plan. Available online: https://vmc.gov.in/disastermanagement.aspx (accessed on 6 August 2020).
- Vyas, R. (Sayaji Baug Zoo, Vadodara, India). Private interview. 2020. [Google Scholar]
- Bhavsar, J. (Water Works Department, Vadodara Municipal Corporation, Vadodara, India). Private interview. 2020. [Google Scholar]
- Community Science Centre Vadodara. Available online: https://cscvadodara.com/project_details.php?c_id=257&name=VmFobyBWaXNod2FtaXRyaSBBYmhpeWFuIChWVkEpICAg (accessed on 18 December 2020).
- VMC. Vishwamitri Riverfront Development, Vadodara—Feasibility Report. Vadodara Municipal Corporation, Vadodara, India. 2014; Unpublished Work. [Google Scholar]
- NGT restrains Gujarat Authorities from Construction at Vadodara Riverfront without Environmental Clearance. Available online: https://www.counterview.net/2016/06/ngt-restrains-gujarat-authorities-from.html (accessed on 11 February 2021).
- Bartlett II, J.; Kotrlik, J.; Higgins, C. Determining appropriate sample size in survey research. Inf. Technol. Larning Perform. J. 2001, 19, 43–50. [Google Scholar]
- Google Earth. Available online: https://earth.google.com/web/@22.311278,73.1814228,30.89753023a,57288.67087587d,35y,0h,0t,0r (accessed on 11 December 2020).
- Lenzi, M.A.; Mao, L.; Corniti, F. Interannual variation of suspended sediment load and sediment yield in an alpine catchment. Hydrol. Sci. J. 2003, 48, 899–915. [Google Scholar] [CrossRef]
- Bhangaonkar, P.; Patel, J. Water quality zoning of Vishwamitri River to access environmental flow requirements through aggregation of water quality index. Int. J. Hum. Cap. Urban Manag. (IJHCUM) 2017, 4, 281–292. [Google Scholar]
- Gavali, D.; Shah, D.R.; Dudani, S.N.; Sankhwal, A.O.; Gavali, D.J. Riparian vegetation of Mini River in Vadodara, Gujarat IPA-Under Creative Commons license 3.0 Riparian vegetation of Mini River in Vadodara, Gujarat. Int. J. Environ. Sci. 2015, 6, 307–317. [Google Scholar]
- Pancholi, V.; Lodha, D.; Indraprakash, D.; Songara, J. Estimation of Soil Erosion for Vishwamitri River Watershed Using Universal Soil Loss Equation and GIS. IJSRD (Int. J. Sci. Res. Dev.) 2015, 3, 444–449. [Google Scholar]
- Elliot, W.J.; Dumroese, D.; Robichaud, P.R. The Effects of Forest Management on Erosion and Soil Productivity. In Soil Quality and Soil Erosion; CRC Press: Boca Raton, FL, USA, 2018; pp. 195–208. [Google Scholar]
- Water Works Department, Vadodara Municipal Corporation. Emergency Action Plan for Vadodara City Considering Vishawmitri River Basin; Vadodara Municipal Corporation: Vadodara, India, 2020.
- Walsh, C.J.; Roy, A.; Cottingham, P.; Groffman, P.M. The Urban Stream Syndrome: Current Knowledge and the Search For A Cure. J. N. Am. Benthol. Soc. 2005, 24, 706–723. [Google Scholar] [CrossRef]
- Patel, C.G.; Gundaliya, P. Floodplain delineation using HECRAS Model-A case study of Surat City. Open J. Mod. Hydrol. 2016, 6, 34–42. [Google Scholar] [CrossRef]
- Shekhar, S. Detecting Slums From Quick Bird Data in Pune Using an Object Oriented Approach. Int. Arch. Photogramm. Remote Sens. Spat. Inf.Sci. 2012, 39, 519–524. [Google Scholar] [CrossRef]
- VMC. Feasibility Survey. Vadodara Municipal Corporation, Vadodara, India. 2019; Unpublished Work. [Google Scholar]
- Tere, T. Over 1000 Crocodiles Find Cosy Homes in Vadodara District, Vadodara, Gujarat: The Times of India. Available online: https://timesofindia.indiatimes.com/city/vadodara/over-1000-crocs-find-cosy-homes-in-vadodara-district/articleshow/80755020.cms (accessed on 15 February 2021).
- WII-Marsh Crocodile. Available online: https://www.wii.gov.in/nmcg/priority-species/reptiles/marsh-crocodile (accessed on 12 November 2020).
- Vyas, R.; Stevenson, C. Review and analysis of human and Mugger Crocodile conflict in Gujarat, India from 1960 to 2013. J. Threat. Taxa 2017, 9, 11016–11024. [Google Scholar] [CrossRef]
- West Virginia Department of Environmental Protection. Importance of Riparian Buffers. Available online: https://dep.wv.gov/WWE/getinvolved/sos/Pages/RiparianMagic.aspx (accessed on 7 March 2021).
- Blanusa, T.; Garratt, M.; Cathcart-James, M.; Hunt, L.; Cameron, R.W.F. Urban hedges: A review of plant species and cultivars for ecosystem service delivery in north-west Europe. Urban For. Urban Green. 2019, 44, 126391. [Google Scholar] [CrossRef]
- Cunningham, S.C.; Mac Nally, R.; Baker, P.J.; Cavagnaro, T.R.; Beringer, J.; Thomson, J.R.; Thompson, R.M. Balancing the environmental benefits of reforestation in agricultural regions. Perspect. Plant Ecol. Evol. Syst. 2015, 17, 301–317. [Google Scholar] [CrossRef]
- Calder, I.R. Forest and Floods: Moving to an Evidence-based Approach to Watershed and Integrated Flood Management. Water Int. 2006, 31, 87–99. [Google Scholar] [CrossRef]
- Fischenich, J.C. Effects of Riprap on Riverine and Riparian Ecosystems; Engineer Research and Development Centre, US Army Corps of Engineers: Vicksburg, MS, USA, 2003. [Google Scholar]
- United States Environmental Protection Agency. Wetlands: Protecting Life and Property from Flooding; United States Environmental Protection Agency: Washington, DC, USA, 2006.
- Keesstra, S.D.; Kondrlova, E.; Czajka, A.; Seeger, M.; Maroulis, J. Assessing riparian zone impacts on water and sediment movement: A new approach. Geol. En Mijnb. Neth. J. Geosci. 2012, 91, 245–255. [Google Scholar] [CrossRef]
- Dutta, V.; Sharma, U.; Iqbal, K.; Adeeba Kumar, R.; Pathak, A.K. Impact of river channelization and riverfront development on fluvial habitat: Evidence from Gomti River, a tributary of Ganges, India. Environ. Sustain. 2018, 1, 167–184. [Google Scholar] [CrossRef]
- Interceptors Sewers Strategy: The Post-Industrial Delhi. Available online: http://www.yamunariverproject.org/interceptors-sewers-strategy-the-post-industrial-delhi.html (accessed on 22 January 2021).
- Reconnection of Oxbow Lakes and Similar Features. Available online: http://nwrm.eu/sites/default/files/nwrm_ressources/n7_-_reconnection_of_oxbow_lakes_and_similar_features_0.pdf (accessed on 14 February 2021).
- Vadodara: Loss of Wetlands Trapped the Rain? Available online: https://www.dnaindia.com/ahmedabad/report-vadodara-loss-of-wetlands-trapped-the-rain-2778438 (accessed on 29 March 2021).
- Russi, D.; Brink P ten Farmer, A.; Badura, T.; Coates, D.; Förster, J.; Kumar, R.; Davidson, N. The Economics of Ecosystems and Biodiversity for Water and Wetlands; Institute for European Environmental Policy (IEEP): Brussels, Belgium, 2013. [Google Scholar]
- Tere, T. Gujarat: Illegal Structures Cause Flood, Create Reptile Scare. The Times of India. Available online: https://timesofindia.indiatimes.com/city/vadodara/illegal-structures-cause-flood-create-reptile-scare/articleshow/85015438.cms (accessed on 10 August 2021).
- Deshpande, A.A. (National Green Tribunal, New Delhi, India). Private interview. 2020. [Google Scholar]
- NGT; FAQs. Available online: https://www.greentribunal.gov.in/faqs (accessed on 3 March 2021).
- Singh, R. Why National Green Tribunal is Not as Powerful as UK Environment Agency. Available online: https://www.downtoearth.org.in/blog/environment/why-national-green-tribunal-is-not-as-powerful-as-uk-environment-agency-75130 (accessed on 27 January 2021).
- Bhan, R. Six Months Since They Were Displaced, Slum Dwellers in Vadodara Still Waiting for Alternate Houses. Available online: https://www.ndtv.com/india-news/six-months-since-they-were-displaced-slum-dwellers-in-vadodara-still-waiting-for-houses-they-were-pr-760764 (accessed on 30 November 2020).
- Agarwal, V. Environmental Laws in India: Challenges for enforcement. Bull. Natl. Inst. Ecol. 2005, 15, 227–238. [Google Scholar]


Disclaimer/Publisher’s Note: The statements, opinions and data contained in all publications are solely those of the individual author(s) and contributor(s) and not of MDPI and/or the editor(s). MDPI and/or the editor(s) disclaim responsibility for any injury to people or property resulting from any ideas, methods, instructions or products referred to in the content. |
© 2023 by the author. Licensee MDPI, Basel, Switzerland. This article is an open access article distributed under the terms and conditions of the Creative Commons Attribution (CC BY) license (https://creativecommons.org/licenses/by/4.0/).