Abstract
Cardiovascular diseases (CVD) are the most prevalent cause of death worldwide and have become an important concern for the physicians. Clinical practices have often failed to achieve high accuracy in CVD prediction. Machine learning provides benefits not only for clinical prediction but also for feature ranking, which improves clinical professionals’ interpretation of outputs. The explainable artificial intelligence (XAI) concept seeks to address the lack of explainability in machine learning and deep learning models and provides healthcare professionals with patient-tailored decision-making tools for improving treatments and diagnostics. This paper aims to predict heart disease using a RHMIoT model in the XAI framework.
1. Introduction
CVDs are the most prevalent cause of morbidity and mortality throughout the world. CVDs enforce significant social and financial costs, including direct costs for diagnostic equipment and treatment by the specialists, as well as indirect costs resulting from decreased quality of life, morbidity, and loss of productivity. Furthermore, diagnostic equipment is primarily available in specialized hospitals in large cities. Patients that live in small towns receive a lack of such services. Computational methods can assist in identifying high-risk individuals and motivating them to change their behaviors for the purposes of preventive medicine. Based on their risk score outputs, these CVD models are divided into four groups: 1. If-then models, 2. Formula-based models, 3. Machine learning models, and 4. Chart-based models. These models either have accuracy or interoperability limitations []. Machine learning (ML) and deep learning (DL) are the subfields of artificial intelligence (AI). ML and AI are emerging technologies that play significant roles in healthcare and personalized clinical support. Clinical data in healthcare consist of electronic health data and sensor data from Internet of Things (IoT) devices. The data are available in both unstructured and structured forms. Deriving meaningful and decision-making information from these data by a human effort is difficult. The IoT and cloud-enabled technologies work together closely to provide medical assistance and maintain the electronic health records of patients. With the help of knowledge-based systems and digital medical devices, AI expert systems can be designed to provide an expert opinion. AI algorithms examine IoT data from smart watches, medicines, wearable monitoring devices, and other sources. The data assist patients, doctors, and pharmaceutical companies in evaluating medical conditions and providing feedback on treatments, medication therapy, patient outcomes, and so on.
In recent years, an additional concept known as explainability has emerged, called XAI in some contexts []. XAI is a type of AI in which the outcome can be understood by humans. Explainable ML models or interpretable ML models enable medical professionals to make reasonable and data-driven decisions to provide individualized care that may ultimately result in high-quality healthcare services. These models are part of the XAI field that defines a set of ML techniques to produce more explainable models while maintaining a high level of learning performance and enabling humans to understand, appropriately trust, and effectively manage the emerging generation of artificially intelligent partners []. The major challenges in healthcare are model interoperability and data interpretation. Another challenge is the distribution of heterogeneous data storage. Medical aid can easily reach people in remote locations and those who only need preliminary medical assistance with the aid of IoT and ML techniques. The aim of this study is to identify cardiac diseases using machine learning and deep learning algorithms using a secured remote health care application.
The aims of the study are listed below.
- A RHMIoT system is proposed using medical sensors to perform automated analysis, clustering, processing and, finally, visualize the predicted results.
- The data are transferred to cloud storage using encryption and decryption techniques to prevent unauthorized users access.
- The XAI-based SHAP and PCA feature selection techniques are applied on the dataset to select the best features, and the accuracy of the XAI-based method’s performance is evaluated using a variety of evaluation metrics, including accuracy, recall, and precision.
2. Literature Review
Moreno-Sanchez, P. A. et al. [] discussed the development of a heart failure-survival prediction model using ensemble trees and ML techniques. XGBoost outperformed with 83% accuracy in unseen data compared to the other ensemble tree options. The feature selection technique is performed to identify the relevant features and produce the model’s results. The model’s interpretability and fidelity are then quantitatively assessed, resulting in a balanced ratio between these two variables. Yang, G. et al. [] conducted a survey on XAI progress and its efficacy in the field of the healthcare sector. The authors proposed a XAI solution for multi-center and multi-model data fusion. Compared to the current model, the previously proposed models are incapable of explaining the decision-making strategy used in categorizing results. Hence, a model was proposed to classify data and can explain the outcome of the decision. Das, S. et al. [] focused on dimensionality reduction, using XAI to increase the accuracy of heart disease classification. Four SHAP-based explainable ML models were developed for classification, reflecting the feature contributions and calculating each feature’s weight to generate the final findings. With the help of dimensional reduction, the feature subset was created through FC and FW. Finally, the XGBoost classifier outperformed as the best explanation for heart diseases with a 2% increase in model accuracy. Dave, D. et al. [] proposed an interpretability technique to investigate a heart disease dataset using XAI techniques for deep learning systems. The SHAP technique was applied to explain the prediction of heart failure on a coronary heart disease dataset, which contained 1562 data items over three years. After screening six machine learning methods, the SHAP technique was applied to explain the XGBoost model. The performance of the model proved that the mortality rate had dropped over a three-year period. Chen, T. et al. [] used the LightGBM (light gradient boosting machine) to predict the failure of extubation using the MIMIC-III clinical database. By using the SHAP method, they carried out an analysis of feature importance and visualized the key features. All of the models discussed above are insufficient to explain the decision-making method used in categorizing these cases. The development of a model that can classify data while explaining the outcome of the decision made is this desired.
3. Proposed Methodology
The approaches in this paper are discussed step by step in this section. To improve the capacity of the model, XAI was introduced to increase the effectiveness of AI. Figure 1 depicts the model for predicting cardiovascular disease using the XAI system integrated with the ML and DL model in a secured RHMIoT.
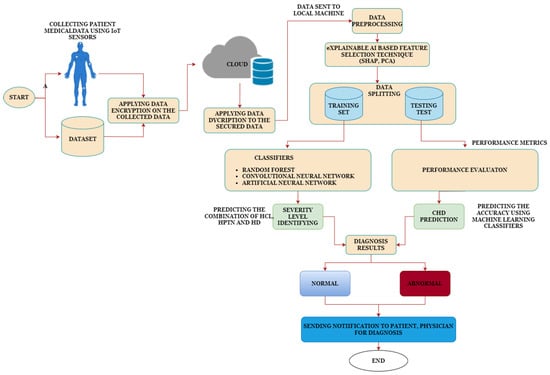
Figure 1.
Proposed RHMIoT framework.
The model comprises a sensor layer, transport layer, and an application layer. The sensor layer is used to collect the data using various medical IoT sensors. Using ML-based applications, physicians can continuously analyze their patients’ diseases and health status using IoT-medical sensors []. After the patient data are collected through the sensors, the data are transferred to cloud storage using encryption and decryption techniques to prevent unauthorized users from accessing it. A performance algorithm is used to encrypt sensitive patient data. An algorithm was designed for enhancing security with a key-dependent dynamic S-Box and a hyper elliptic curve. In the application layer, heart disease was predicted using ML and deep learning algorithms. The RHMIoT framework is divided into two phases. In phase-1, the patient’s risk of HPTN and its severity level is calculated. The DM algorithm is applied to the patient’s medical data to calculate HPTN and its severity levels []. In phase-2 heart, disease accuracy is calculated using machine learning and deep learning classifiers. The Framingham dataset was used to train our model, and was retrieved from Kaggle. The heart disease dataset contained 4238 records with 16 attributes. The data pre-processing was carried out using feature selection and classification techniques. After the training process, the IoT medical device sensor data are tested by classifying and contrasting the results. To accurately predict the presence of heart disease, the proposed RHMIoT framework used Artificial Neural Network (ANN), Convolutional Neural Network(CNN) and Random Forest (RF). The following section provides a detailed explanation of the training procedure.
3.1. Data Preprocessing
A data preprocessing method was used to replace missing data or remove noise. The missing values in the dataset were identified and updated by a median value of the attribute. A studentized residual technique was used to lower the residuals. It finds the correlation among the features and helps to find the outliers in a given dataset. The preprocessing of data aids in improving heart disease detection. After data pre-processing, the dataset is normalized using a min–max normalization technique.
3.2. Feature Selection
Explainable AI (XAI)-based feature selection techniques are used to identify and select the most relevant features from a dataset while maintaining interpretability and transparency in the feature selection process. These techniques are particularly useful when you need to understand why certain features were chosen or excluded from a predictive model. SHAP (SHapley Additive exPlanations) and PCA (Principal Component Analysis) used for feature selection.
3.2.1. SHAP (Shapley Additive Explanations)
SHAP is an extremely effective XAI approach. It assigns values to prediction characteristics, showing their contributions to the model’s output. SHAP allows for us to discover the factors that influence AI decisions, making them more interpretable and trustworthy. The following dependence plot in Figure 2 shows how a particular characteristic (in this case, ‘age’) effects the model’s output (in this case, the chance of belonging to class 1, which might signify a favorable conclusion in your binary classification problem). The y-axis (SHAP Value) displays the SHAP values for the ‘age’ characteristic. The SHAP values represent the feature’s influence on the model’s prediction for each data point. Positive SHAP values increase the model’s output, whereas negative values decrease it. The X-axis represents the values of a test data’s ‘age’ feature. Each point on the diagram represents one of the test data’s points. The point’s vertical location corresponds to the SHAP value for ‘age’ for that individual data point. If the trend line is generally flat, it suggests that the ‘age’ attribute has little to no link with the model’s output. In other words, changes in ‘age’ have no discernible effect on the model’s forecast. If the trend line is favorably sloping, it indicates that as ‘age’ increases, so does the model’s prediction (probability of belonging to class 1). According to this concept, it was suggested that older people are more likely to belong to class 1. The results ranged between −2.0 to −1.0. The dependence plot’s main function is to show how changes in the feature of interest (‘age’) affect the model’s output. The data and SHAP values for a specific dataset and model determine the specific axis values and ranges.
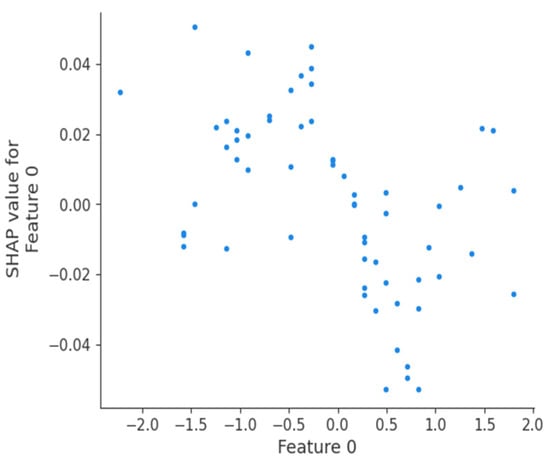
Figure 2.
Dependence plot.
3.2.2. PCA (Principal Component Analysis)
PCA is a technique for reducing dimensionality in data analysis and visualization. Reducing SHAP values can be high-dimensional, especially when features are greater in a dataset. It can be difficult to visualize high-dimensional data in a single graph. PCA aids in dimensionality reduction while maintaining as much information as feasible. PCA finds linear combinations of features that capture the most significant variances in the data. These primary components can aid in the discovery of underlying patterns and correlations between features. Figure 3 shows the PCA visualization of SHAP values. SHAP and PCA can identify the features that are most relevant for heart disease prediction in sensor data. Patients’ heart conditions were determined using training and testing dataset with an 80:20% ratio. The following research questions address how the XAI environment aids in heart disease prediction.
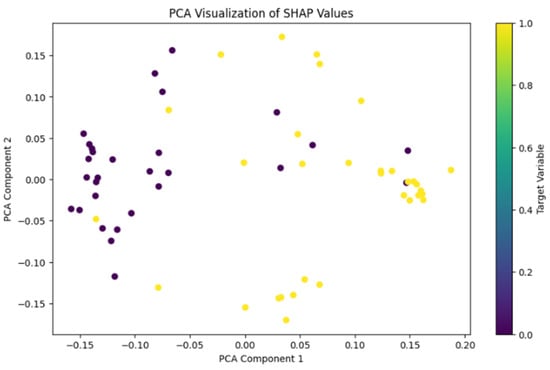
Figure 3.
Decision plot for PCA visualization.
RQ1:How can a machine learning model make predictions for a specific data point in an Explainable AI environment, in this case, “patient 0”?
Solution: The decision plot in Figure 4 shows the most critical features that influence the model’s prediction for “patient 0”. The absolute SHAP values of these attributes are ranked from top to bottom. SHAP factors: Each feature’s SHAP values are represented by horizontal bars. Positive SHAP values (on the right) indicate that the feature raises the model’s prediction (towards a positive class), whereas negative SHAP values (on the left) reduce the prediction (towards a negative class). In binary classification, the probability threshold (generally 0.5) is what distinguishes the two classes. If the projected value line is to the right of the vertical centerline, the class is predicted to be positive.
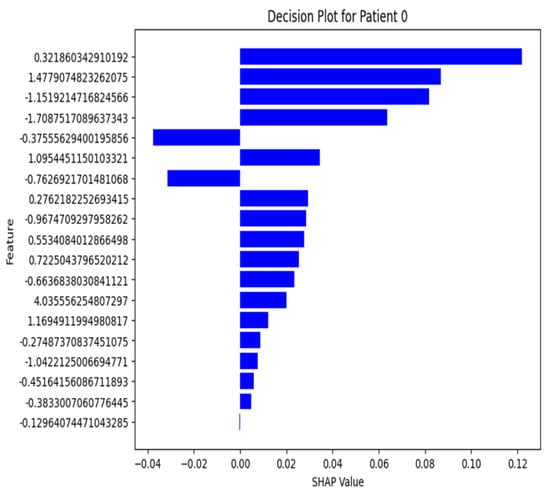
Figure 4.
Decision plot.
RQ2: How effectively does a Random Forest classifier perform in distinguishing between individuals with heart disease and those without, as demonstrated by the confusion matrix heatmap, and what insights can be gained from the distribution of TP, TN, FP, and FN predictions in the context of heart disease classification?
Solution: The confusion matrix heatmap generated using a Random Forest classifier on the heart disease dataset provides valuable insights into the model’s performance, which is shown in Figure 5. It reveals the distribution of TP, TN, FP, and FN predictions. These metrics are crucial for understanding the classifier’s ability to correctly identify individuals with heart disease TP, correctly identify those without heart disease TN, misclassify healthy individuals as having heart disease FP, and misclassify individuals with heart disease as healthy FN.
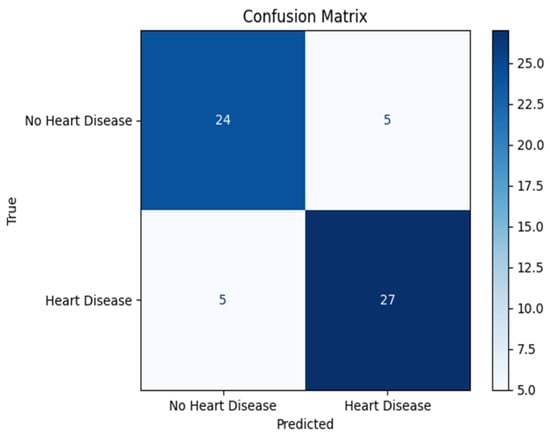
Figure 5.
Confusion matrix.
3.3. Machine Learning Algorithms
The flow of the RHMIoT model begins with the dataset’s input parameters. After data preprocessing and feature selection, the dataset is passed on to the proposed framework. For comparative analysis, RF, ANN, and CNN algorithms were used in study.
Random Forest (RF): An AI ensemble method combining several learning algorithms to produce accurate prediction. Compared to a statistical ensemble, a machine learning ensemble is typically much more flexible in its structure. During the training phase, the RF algorithm constructs multiple decision trees. The RF selects the majority decision of the trees as the final decision. The “forest” is an ensemble of decision trees, which are typically trained through the “bagging” method. Bagging is used to combine several learning models to improve the overall result.
3.3.1. Convolutional Neural Network (CNN)
CNN has the ability of feature learning. Hence, CNN is a suitable algorithm for heart disease prediction at an earlier stage. We can use CNN for binary classification. In heart disease prediction, a patient suffering from CHD is classified as “1” and not-suffering is classified as “0”, which is called a binary classification. CNN architecture operates in a single-input and single-output sequential mode. CNN architecture relies heavily on the convolution layer for feature extraction.
3.3.2. Artificial Neural Network (ANN)
ANN is interrelated with input, hidden, and output units. The patient’s risk factors are accepted as the input unit for medical diagnosis. ANN has proven to be more effective in the field of healthcare and medicine. In the proposed model, eight neurons were constructed for the input layer to correlate with eight important characteristics. The output class variable generates either 0 or 1, where 0 indicates that the person does not have heart disease and 1 indicates the person suffers with heart disease.
4. Results and Discussion
The aim of this study was to calculate the severity level of heart disease and prediction accuracy. In the proposed RHMIoT model, three different classification algorithms, RF, ANN, and CNN, were applied to a heart disease test dataset.
Table 1 shows the performance metrics of the proposed classifiers. The performance of each experiment was compared through performance metrics and statistical results. For the early diagnosis of heart disease, more attention was given to achieving maximum true positives. The deep learning algorithms performed well compared to the machine learning classifiers in terms of testing accuracy, precision, and recall. RF is recognized as a weak classifiers for the proposed work because it demonstrated low accuracy. Figure 6 shows a plot graph representation of the proposed classifiers.

Table 1.
Experimental results.
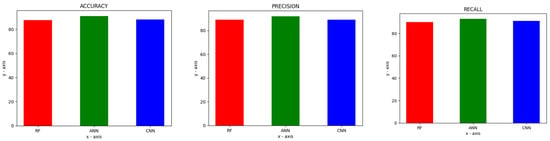
Figure 6.
Box plot bar graph for accuracy, precision, and recall.
5. Conclusions
Due to the rapid increase in CVDs, remote health monitoring has become more popular over the globe. This technique helps patients receive diagnoses at home or in a remote area. A lightweight block encryption and decryption technique is provided to secure the RHMIoT. A variety of IoT medical sensors are used to gather data to test the suggested model. XAI-based SHAP and PCA techniques were used for feature selection. Heart disease accuracy was calculated using various deep learning and machine learning algorithms. The outcomes were determined using several performance matrices. In comparison to other machine learning and deep Learning techniques, ANN provided the greatest accuracy of 91.00%. In the future, we will try to improve the speed and precision of our model by making a few dynamic adjustments in accordance with the requirements of the user.
Author Contributions
N.P., designed, directed and coordinated the study, verified the analytical methods, conceived the original idea and supervised the findings of this work; S.P.P., developed the model, preparation of images, developed the theoretical formalism, data collection, performed the analytic calculations, computational framework, analyzed the data, carried out the experiment, interpretation of the results, analysis of the results, visualization, implementation of the research and took the lead in writing-review and editing the manuscript. All authors have read and agreed to the published version of the manuscript.
Funding
The research received no external funding.
Institutional Review Board Statement
Not applicable.
Informed Consent Statement
Not applicable.
Data Availability Statement
The data support the findings of this study are openly available in “Kaggle” at https://www.kaggle.com/datasets/aasheesh200/framingham-heart-study-dataset (accessed on 15 March 2023).
Conflicts of Interest
The authors declare no conflicts of interest.
References
- Ordikhani, M.; Saniee Abadeh, M.; Prugger, C.; Hassannejad, R.; Mohammadifard, N.; Sarrafzadegan, N. An evolutionary machine learning algorithm for cardiovascular disease risk prediction. PLoS ONE 2022, 17, e0271723. [Google Scholar] [CrossRef] [PubMed]
- Guleria, P.; Naga Srinivasu, P.; Ahmed, S.; Almusallam, N.; Alarfaj, F.K. XAI framework for cardiovascular disease prediction using classification techniques. Electronics 2022, 11, 4086. [Google Scholar] [CrossRef]
- Ahsan, M. Heart Attack Prediction Using Machine Learning and XAI. Ph.D. Thesis, Brac University, Dhaka, Bangladesh, 2022. [Google Scholar]
- Moreno-Sanchez, P.A. Development of an explainable prediction model of heart failure survival by using ensemble trees. In Proceedings of the 2020 IEEE International Conference on Big Data (Big Data), Atlanta, GA, USA, 10–13 December 2020; pp. 4902–4910. [Google Scholar]
- Yang, G.; Ye, Q.; Xia, J. Unbox the black-box for the medical explainable AI via multi-modal and multi-centre data fusion: A mini-review, two showcases and beyond. Inf. Fusion 2022, 77, 29–52. [Google Scholar] [CrossRef] [PubMed]
- Das, S.; Sultana, M.; Bhattacharya, S.; Sengupta, D.; De, D. XAI–reduct: Accuracy preservation despite dimensionality reduction for heart disease classification using explainable AI. J. Supercomput. 2023, 79, 18167–18197. [Google Scholar] [CrossRef] [PubMed]
- Dave, D.; Naik, H.; Singhal, S.; Patel, P. Explainable ai meets healthcare: A study on heart disease dataset. arXiv 2020, arXiv:2011.03195. [Google Scholar]
- Chen, T.; Xu, J.; Ying, H.; Chen, X.; Feng, R.; Fang, X.; Gao, H.; Wu, J. Prediction of extubation failure for intensive care unit patients using light gradient boosting machine. IEEE Access 2019, 7, 150960–150968. [Google Scholar] [CrossRef]
- Patro, S.P.; Padhy, N.; Sah, R.D. An improved ensemble learning approach for the prediction of cardiovascular disease using majority voting prediction. Int. J. Model. Identif. Control 2022, 41, 68–86. [Google Scholar] [CrossRef]
- Patro, S.P.; Padhy, N. An RHMIoT Framework for Cardiovascular Disease Prediction and Severity Level Using Machine Learning and Deep Learning Algorithms. Int. J. Ambient. Comput. Intell. 2022, 13, 1–37. [Google Scholar] [CrossRef]
Disclaimer/Publisher’s Note: The statements, opinions and data contained in all publications are solely those of the individual author(s) and contributor(s) and not of MDPI and/or the editor(s). MDPI and/or the editor(s) disclaim responsibility for any injury to people or property resulting from any ideas, methods, instructions or products referred to in the content. |
© 2023 by the authors. Licensee MDPI, Basel, Switzerland. This article is an open access article distributed under the terms and conditions of the Creative Commons Attribution (CC BY) license (https://creativecommons.org/licenses/by/4.0/).