Proceeding Paper

Plant Disease Prognosis Using Spatial-Exploitation-Based Deep-Learning Models †

by
Jayavani Vankara
1,*,
Sekharamahanti S. Nandini
1,
Murali Krishna Muddada
1,
N. Satya Chitra Kuppili
2 and
K Sowjanya Naidu
3
1
Department of Computer Science and Engineering, GITAM School of Technology GITAM (Deemed to Be University), Visakhapatnam 500020, India
2
Department of Computer Science and Engineering, Dr. Lankapalli Bullayya College of Engineering, Visakhapatnam 500020, India
3
Department of CSE-IoT, Malla Reddy Engineering College(A), Malkajgiri 500015, India
*
Author to whom correspondence should be addressed.
Presented at the International Conference on Recent Advances in Science and Engineering, Dubai, United Arab Emirates, 4–5 October 2023.
Eng. Proc. 2023, 59(1), 137; https://doi.org/10.3390/engproc2023059137
Published: 21 December 2023
(This article belongs to the Proceedings of Eng. Proc., 2023, RAiSE-2023)

Abstract

:
There have been several initiatives taken to guarantee higher yields and higher-quality crops as the agriculture sector grows. The agriculture industry is severely impacted by plant and agricultural illnesses and deficits. Several techniques and technologies have been developed to aid in the diagnosis, management, and eventual eradication of plant diseases. The efficient and accurate identification of plant diseases could be aided by the development of a quick and accurate model. The use of deep convolutional neural networks for image categorization has greatly improved accuracy. In this paper, we present a framework for automating disease detection by the use of a tailored DL architecture. Both the Plant Village dataset and the real-time field dataset are utilized in the testing process. Our model’s results are compared to those of other spatial exploitation models. The results show that the proposed method is superior to the standard deep-learning classifier. This proves the network’s potential for usage in real-time applications by extracting high-level features that boost the efficiency and accuracy while reducing the risk introduced by a manual procedure. In order to enable a prompt reaction, and perhaps a targeted pesticide application, the suggested method has the ability to provide the early diagnoses of plant vital health.

1. Introduction

Agriculture, a vital income source for many countries, relies on mechanized systems and techniques for efficient production and high standards [1]. Plant diseases and abnormalities can lead to substantial economic losses, often caused by insect infestation promoting pathogen spread [2]. Climate changes further complicate crop production, causing diseases and pests to escalate globally [3]. Traditional visual inspections by farmers lack accuracy, highlighting the need for advanced methods. Neural networks and spatial-exploitation-based CNN networks offer promising solutions for disease detection and early diagnosis. These models leverage spatial patterns in plant images, capturing intricate features and enhancing disease prognosis accuracy. Utilizing deep-learning techniques, like convolutional neural networks (CNNs), these models extract complex spatial features, enabling precise disease identification in crops. The focus is on harnessing plant image spatial characteristics to improve disease detection, bolstering agricultural practices, and reducing losses. The sections below detail our methodology, training procedures, measurements, disease diagnosis approach, and effectiveness assessment.
The remaining sections include: Section 2, where we cover our methodology, training procedure, and measurements. Section 3 covers our proposed method, our process for diagnosing disease, and our knowledge-based expert systems. Our study’s effectiveness is assessed in Section 4, and the discussion is wrapped up in Section 5.

2. Literature Review

This review highlights recent research endeavors in the field of plant disease prognosis, showcasing various methodologies, findings, limitations, and advantages (Table 1).

3. Methodology

In this study, tomato plant images were collected from the “Plantvillage” dataset and a farm in Jalgaon, Maharashtra, India, to evaluate the proposed method’s viability in real-world scenarios [5]. To enhance the dataset’s quality and diversity, augmentation and annotations were applied to 67,437 images, ensuring variation in image characteristics. The images underwent preprocessing, including cleaning, scaling, and normalization, before being used for training [7].
Automatic plant identification is crucial due to factors such as climate change, habitat shifts, and species diversity [17]. This need is exacerbated by the practice of introducing genes from wild plant relatives into crops for improvement, necessitating the tracking of various plant taxonomies. The study emphasizes the importance of automated plant classification, especially in regions with unique species facing extinction. Understanding plant names aids conservation efforts and ecological system preservation [14].
To assess the model’s robustness and prevent overfitting, various train–test–validation set splits were explored, ensuring the nonrepetition of images within the same category. Parameters were fine-tuned using the validation set, and the test set was utilized for the final model evaluation. Evaluation metrics, such as accuracy, precision, recall, F1-score, AUC-ROC, AUC-PR, the confusion matrix, the mean average precision (mAP), and visualizations, like the confusion matrix heatmap, the ROC curve, the precision–recall curve, feature maps, class activation mapping (CAM), Grad-CAM, and t-SNE visualization, were employed to assess the model performance comprehensively [3].
Transfer learning (TL) techniques, utilizing both new data and existing models, were employed in training the convolutional neural networks (CNNs). TL capitalizes on generic, low-level features learned by early CNN layers, enhancing the generalizability, especially when data is limited. Feature extraction and fine-tuning were utilized based on the dataset size and characteristics. The evaluation metrics and visualizations enabled the effective comparison of different spatial-exploitation-based deep-learning models for plant disease prognosis, offering valuable insights into their performance and areas for enhancement. The proposed model demonstrated real-time disease detection accuracy, identifying complex patterns in plant images and facilitating efficient disease management in agriculture [5].

4. Proposed Approach

4.1. Infrastructure and Tools

To conduct our research, we utilized high-performance computing resources, specifically the Nvidia DGX100 server, renowned for its multimode GPU capability. The server configuration included 4 CPUs, 2 GPUs with 32 GB memory, and a system memory of 64 GB, equipped with 10,000 Cuda cores and 5000 tensor cores. Our research leveraged the Python programming language and prominent deep-learning frameworks, such as TensorFlow and Keras, for model implementation.

4.2. Predictive Analytics Process

We employed a predictive analytics process [11] to forecast the outcomes of our model. This comprehensive approach involved utilizing historical data related to plant leaf disease detection, statistical modeling, data-mining techniques, and deep-learning algorithms. The predictive process encompassed several stages as depicted in Figure 1:
  • Defining a Project: Identification and definition of research objectives, scope, and datasets used for experimentation.
  • Data Gathering: Preparation and formulation of data through data-mining techniques from multiple sources.
  • Data Analysis: Preprocessing stages, such as resizing, normalizing, and modeling data, to extract usable information and draw conclusions.
  • Statistics: Validation of hypotheses and assumptions through statistical analysis using appropriate models.
  • Modelling: Creation of precise predictive models automatically, allowing for multiple evaluations to select the optimal solution.
  • Deployment: Automating decisions based on the models to integrate analytical results into routine decision-making processes, generating results, reports, and output.
Figure 1. Predictive analytics process.
Engproc 59 00137 g001

4.3. Knowledge-Based Expert Systems for Crop Disease Diagnosis

Our research delved into knowledge-based expert systems designed to tackle complex tasks using deep knowledge foundations. These systems utilize artificial intelligence techniques to assist human decision-making processes, learning, and problem-solving within a specific domain. Unlike replicating the problem domain, these systems simulate human reasoning and employ heuristic or approximation methods to solve problems. In agriculture, knowledge-based expert systems find extensive applications, aiding tasks such as land management, water resource management, nutrient management, and crop disease detection and management.

4.4. Plant Disease Diagnosis

The plant disease diagnosis process involves several precise steps, regardless of the disease type or circumstances. Each phase demands meticulous observations and inquiries:
  • Accurate Plant Identification: Identifying the infected plants, including scientific and generic names.
  • Distinguishing Characteristics: Recognizing the distinctive traits of healthy and diseased parts, accounting for variations in patterns, coloration, and growth rates.
  • Symptom and Sign Analysis: Identifying specific symptoms, such as stunted growth, tissue overgrowth, tissue death, and variations in appearance. Differentiating between symptoms and analyzing ecological causative agents.
  • Affected-Plant-Part Detection: Noting which plant parts are affected, such as roots, leaves, or stems.
  • Symptom Distribution: Observing the spread of affected plants in the area, noting patterns and distributions.
  • Host Specificity: Determining if the issue affects specific plant species or multiple species, aiding in understanding potential causes.

4.5. Plant Disease Management

Plant disease management aims to mitigate the financial and aesthetic impact of diseases. Various principles guide disease management strategies, including:
  • Exclusion: Preventing disease spread through geographical barriers and local prevention methods.
  • Eradication: Eliminating the disease after introduction but before widespread dissemination.
  • Protection: Implementing barriers, either mechanical, temporal, or economic, to prevent infection.
  • Resistance: Using disease-resistant plants as a primary prevention method.
  • Integrated Disease Management (IDM): Employing a combination of tactics, methods, disease diagnosis, and environmental monitoring to manage diseases effectively.

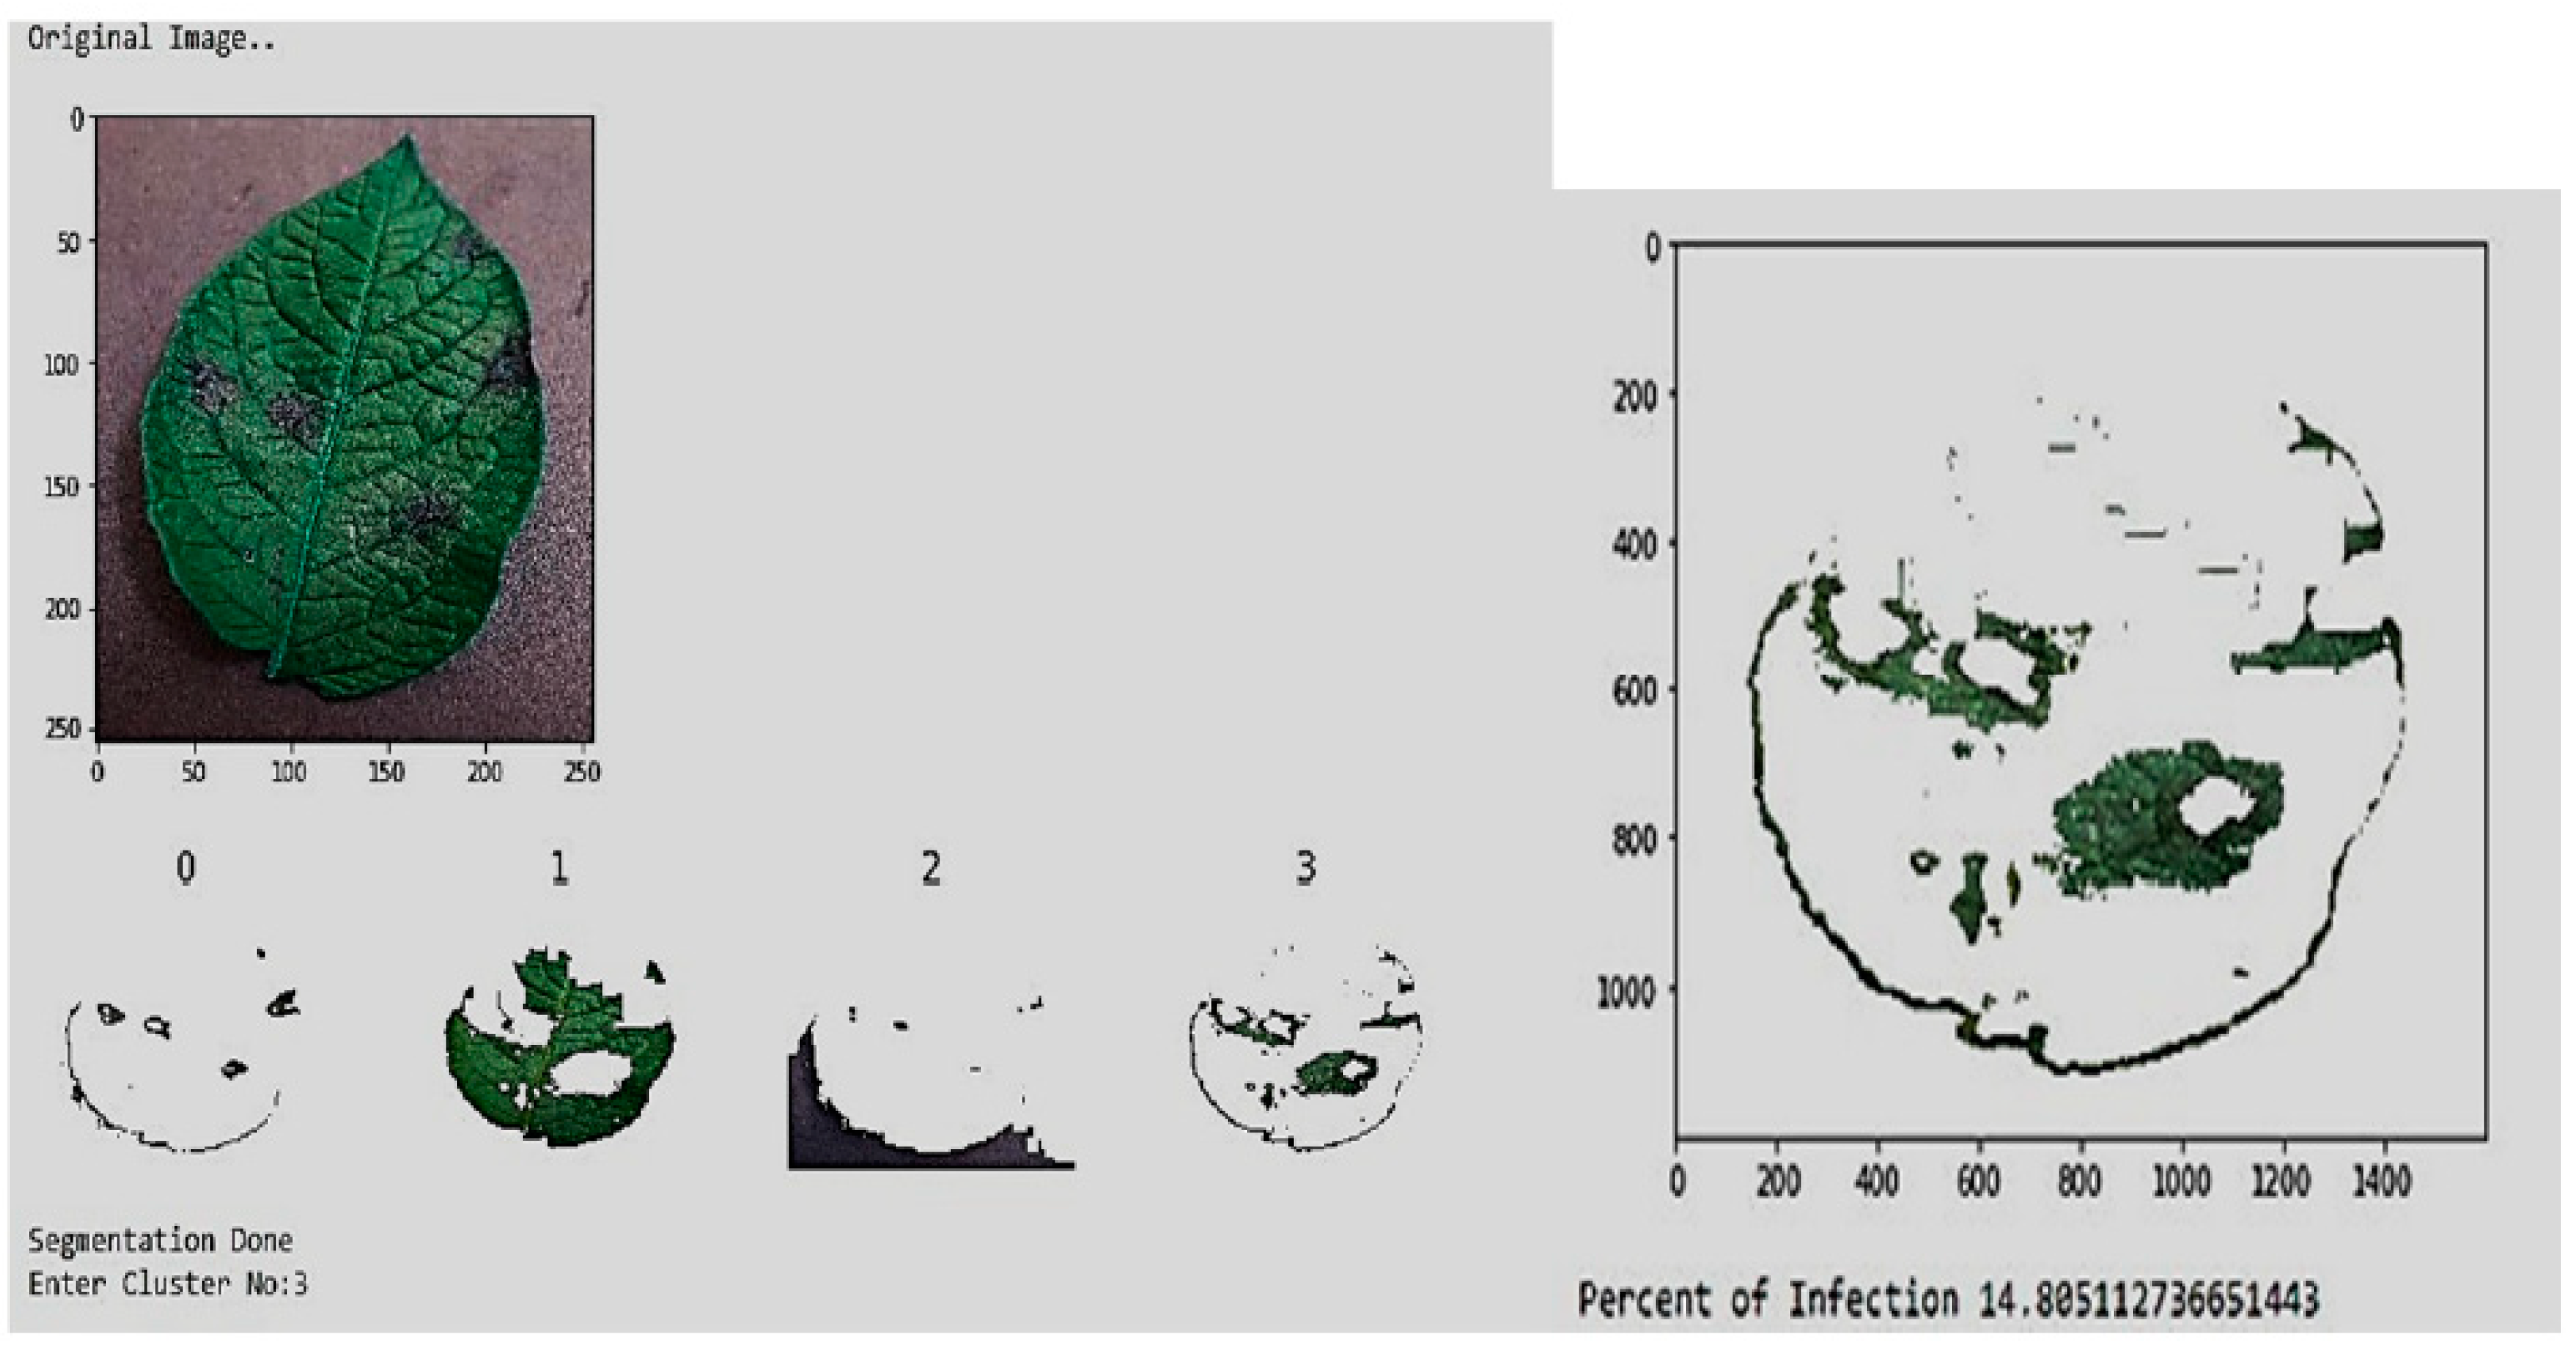
4.6. Methodology: Deep CNN and Otsu-Based Image Segmentation

In our research, we opted for deep convolutional neural networks (CNNs) due to their effectiveness in replicating real-world data. We utilized the Keras machine-learning API and TensorFlow framework to develop our deep CNN model. The methodology included the following steps which are depicted in Figure 2:
  • Data Acquisition: Utilizing real-time field images and the “PlantVillage” dataset, dividing the data into training, validation, and testing sets.
  • Model Construction: Creating a multiclass multilayer CNN architecture suited for processing various images independent of size or orientation.
  • Training and Validation: Scaling, normalizing, and training the model iteratively on the dataset to adapt to different images.
  • Classification: Employing the trained deep CNN to categorize images into predefined classes, assessing its real-time performance on unseen images.
Figure 2. Framework used for training the model.
Engproc 59 00137 g002
Additionally, we incorporated Otsu-based image segmentation, a variance-based method, to compute disease severity. This technique distinguished foreground pixels from background pixels by calculating the threshold value with the least variance between them, ensuring precise segmentation.

4.7. Algorithm

The algorithm repeatedly finds the threshold that reduces the variance belonging to the same class determined by the weighted sum of the spread [13]. Grayscale typically has hues between 0 and 255 (0 and 1 in case of float).
The following equation is utilized to calculate the variance at threshold t:
σ 2 t = ω b g t σ b g 2 t + ω f g t σ f g 2 t
where ω b g t and ω f g t represent the probability of pixels for a value of t, and σ 2 represents the deviation of color values.
Let Pall: total pixel count, and PBG(t) and PFG(t): background and foreground pixels, count at t. So, the updates are given by,
ω b g t = P b g ( t ) / P a l l
ω f g t = P f g ( t ) / P a l l
The variance is calculated using the formula below.
σ 2 t = 1 N 1 ( x i x ¯ ) 2
where xi and x bar: the pixel value and its mean at i in the group (bg or fg); N: the number of pixels. Figure 3 shows some of the instances from the Otsu-based segmentation process.

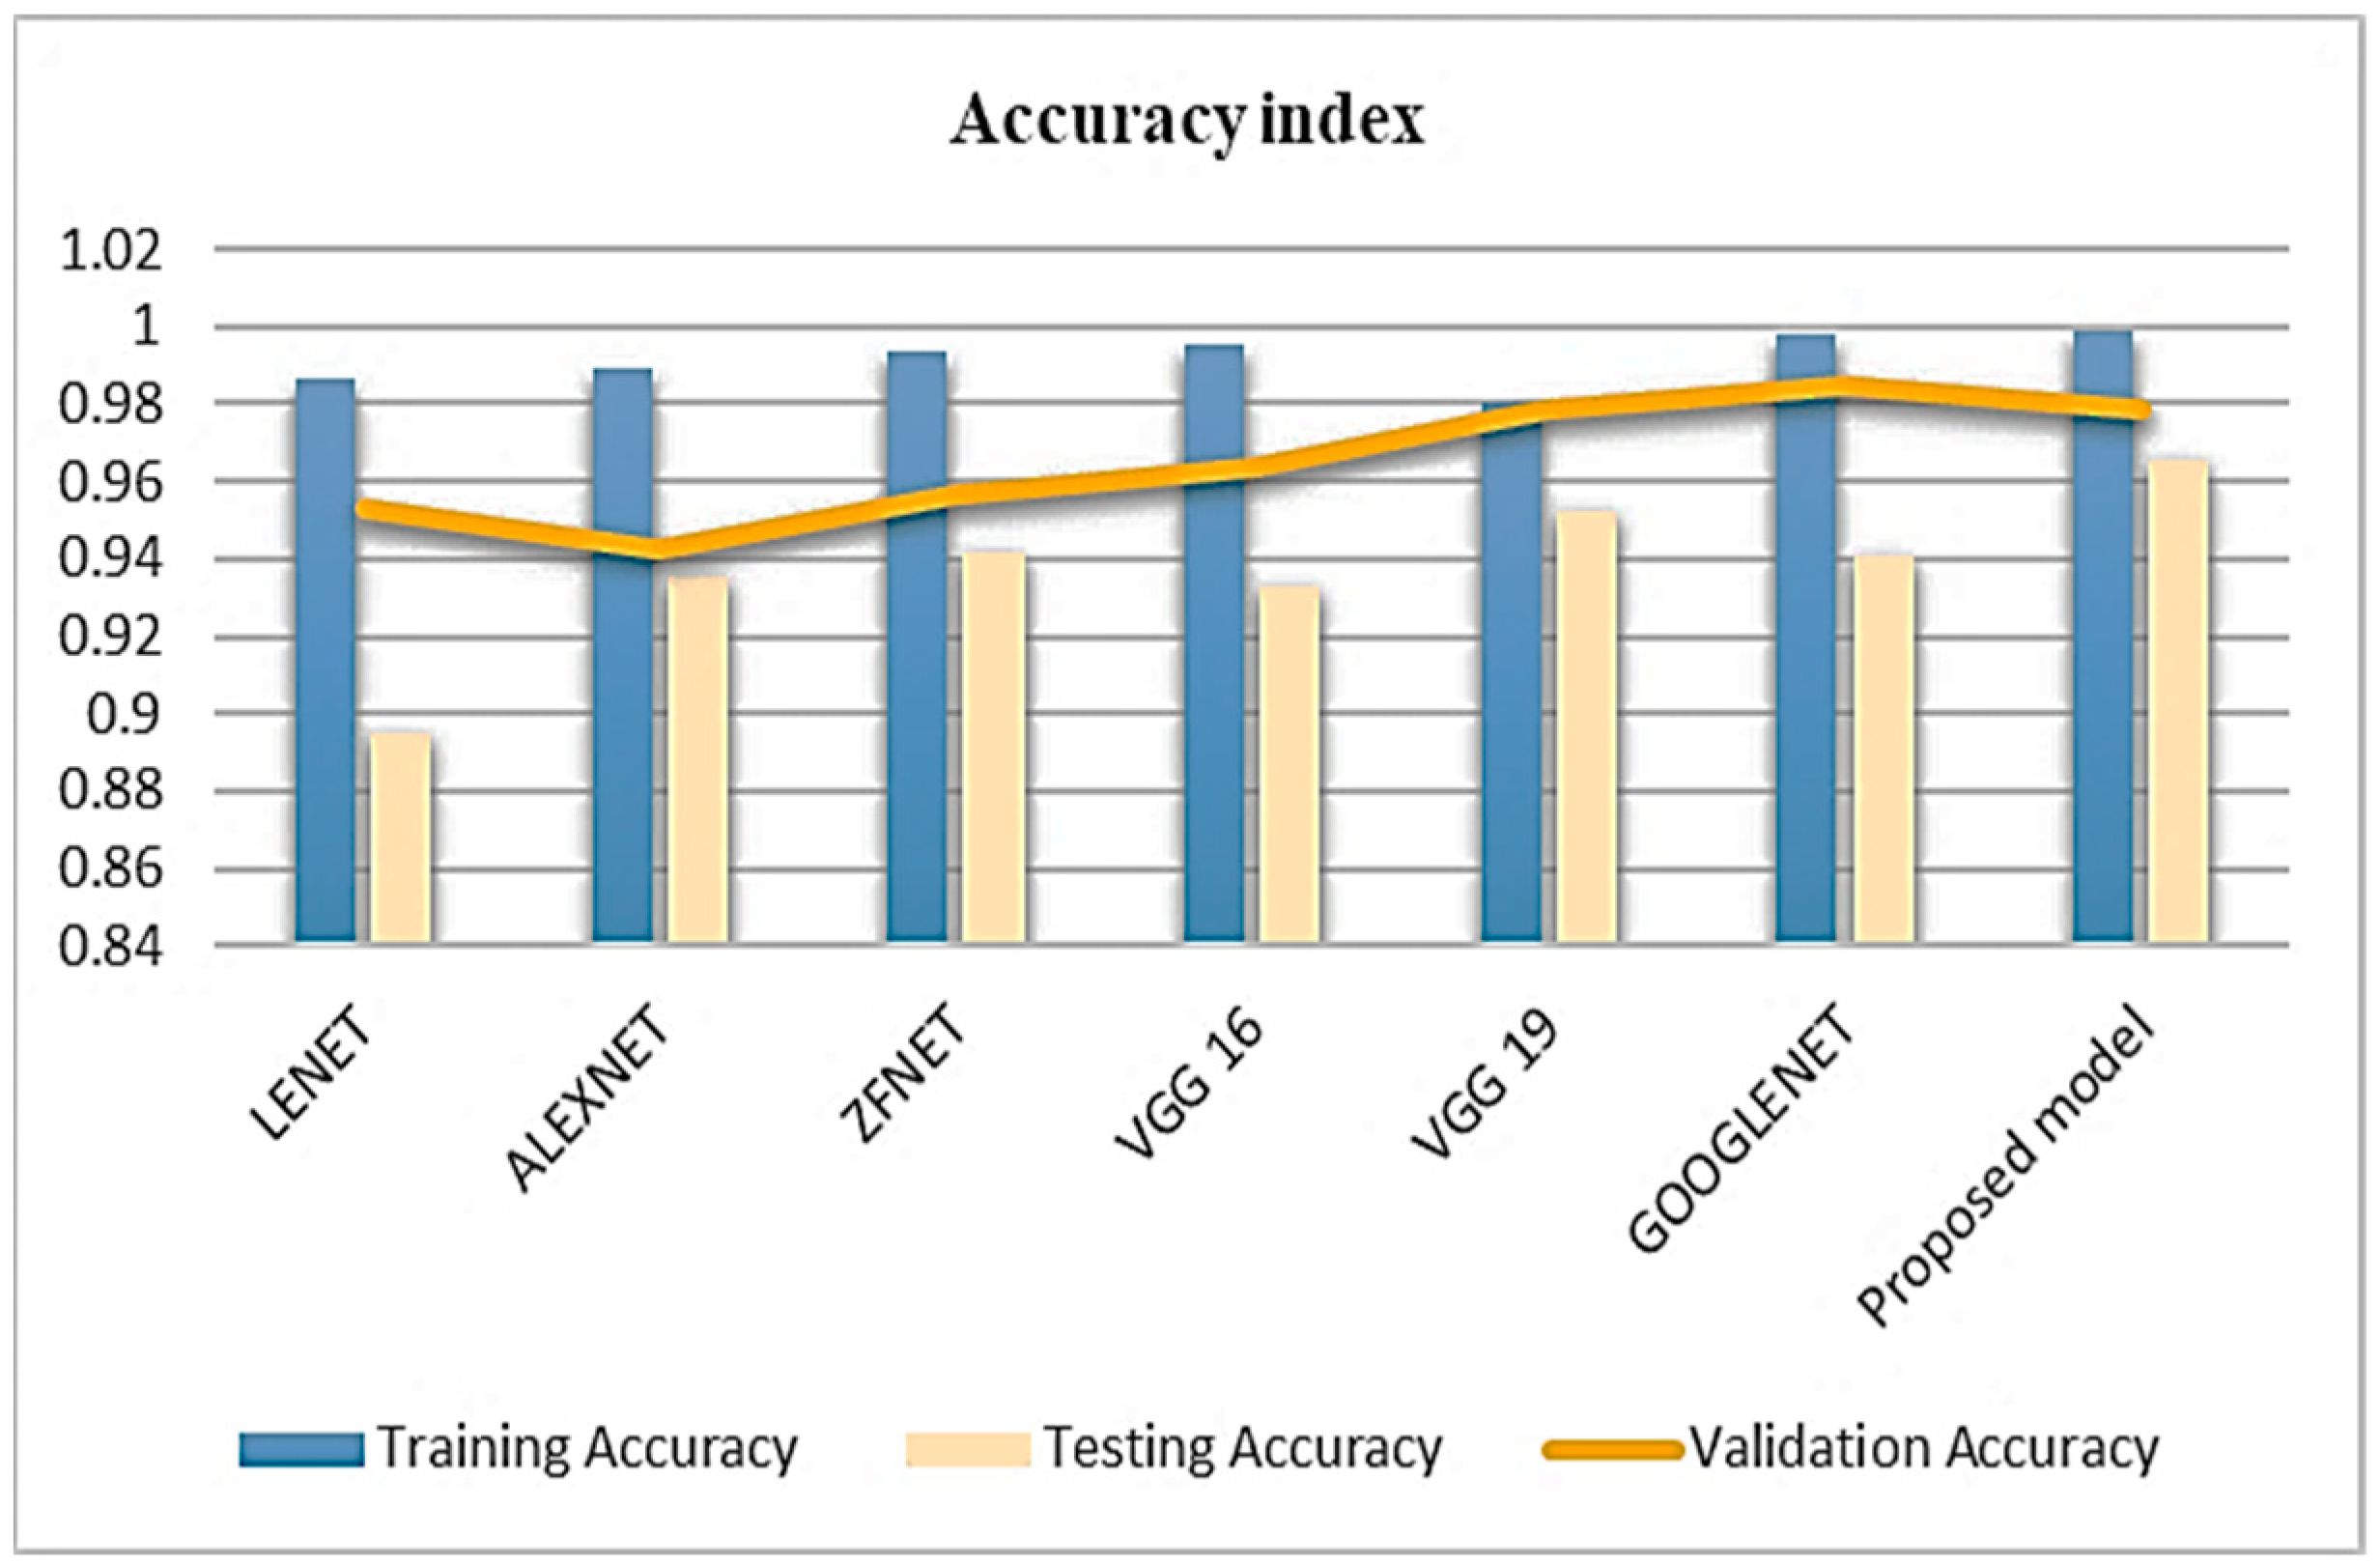
5. Results and Discussion

Data splitting is a crucial component in artificial intelligence domain applications, especially when building models from data. This method ensures the development of data models and the processes that rely on data models. If the same dataset is used for the training and testing procedure, we could unknowingly encounter issues like overfitting. To overcome this issue, we have tested the performance of our implemented model on the varied dataset distribution ratio. From Figure 4, it is observed that the 70-10-20 train–test–valid split provides the maximum accuracy as compared to the other distributions. We therefore considered this distribution for further evaluating all the model’s performance.
We implemented two choices of training mechanism strategies: implementation and training using the transfer learning method and training the model from scratch. From Table 2, it is observed that the performance indicators for the spatial-based models are higher for the models trained using TL. Also, the time required for training the model using TL is much less as compared to the model development from scratch. All the models are trained for 75 epochs, and then the accuracy starts converging after a decrease in the learning rate.
Figure 5 depicts the accuracy of the existing spatial models and the implemented network evaluated on our dataset. It is observed that the existing models are finely tuned to improve the parameter indices. But, merely increasing the depth of the model does not necessarily improve the accuracy. Deeper models performed well in the case of a larger dataset. As compared to the existing model, the proposed model, through proper selection of hyperparameters, provided the maximum accuracy.
When we retain the remaining hyperparameter choices at a constant, the three variations in the dataset (color: Category 1, grayscale: Category 2, and segmented: Category 3), as shown in the Figure 6, exhibit a distinctive variance in performance across all experiments. When applied to Category 1, the models perform best. To evaluate the network flexibility in the lack of Category 1 information, and its capacity to acquire significant characteristics of specific diseases, we experimented with the grayscale version of the same dataset. Additionally, Category 3 of the entire dataset is developed to examine how the background affects the total results. As reflected from the diagram, the performance of Category 3 persistently outperforms that of Category 2, but only marginally less to that of Category 1.
Hyperparameters have a significant impact on the models’ performance. Table 3 and Table 4 depict the performance of our proposed model for the different values of the epochs, the learning rate, and the dropout rate. It is observed that, as we keep increasing the dropout rate, the model’s convergence rate is slowed down, affecting the overall performance, whereas too low a value of the dropout rate does not show any improvement in the generalization capability and performance of the model. A higher dropout rate has higher variance, thus degrading the performance. The learning rate is another important parameter to improve the overall performance of the model. It determines the capability of the model to adapt to the problem. It is observed that the smaller the changes made to the weights with each update, the smaller the LR required for more epochs, whereas a higher LR provides fast adaptability and requires few epochs.
It is observed that, during the higher learning rate, we did not reach the optimal solution, whereas, when we tried for low values, we required too many iterations to reach the best value. Another important parameter is the number of epochs to be set for training the model. It helps to refine our network parameters. It is observed that setting a high value for epochs never increases the accuracy. It boosts the performance only up to certain limit, after which the accuracy again starts to degrade, resulting in model overfitting.

6. Conclusions

Identifying plant diseases is a challenging task that spans numerous academic disciplines. Growing businesses have the potential to save a significant amount of money by identifying diseases early in a crop field, but more importantly, they may be able to improve livelihoods. Deep-learning image classifiers can now be used in the early diagnosis of plant diseases because of advancements in computing power. There is a considerable amount of literature that has been published that claims very accurate levels of performance on newly developed image classifiers in the quest to enhance existing models for plant disease identification [20]. However, a significant proportion of this literature lacks a set of predefined methodologies, making comparisons between works challenging. In this paper, we outlined the performance of all spatial-exploitation-based CNN models, along with our developed model, on our generated dataset. We achieved higher and more resilient shared visual characteristics through our implemented architecture. The multidisease approaches for plant disease characterization have been demonstrated in this work. By stimulating the development of huge datasets and models that can easily make use of new crop-specific contextual information, few-shot, or incremental-learning techniques, new research directions are opened. To avoid water pollution and production losses, future research efforts should strive to incorporate a proper proportion of fungicides and pesticides depending on the disease severity.

Author Contributions

Conceptualization, J.V. and S.S.N.; methodology, N.S.C.K., M.K.M. and K.S.N.; validation, J.V. and S.S.N.; formal analysis, N.S.C.K., M.K.M. and K.S.N.; investigation, J.V. and S.S.N.; resources, N.S.C.K., M.K.M. and K.S.N.; data curation, J.V. and S.S.N.; writing—original draft preparation, J.V. and S.S.N.; validation, N.S.C.K., M.K.M. and K.S.N.; writing—review and editing, J.V. and S.S.N.; validation, N.S.C.K., M.K.M. and K.S.N.; visualization, J.V. and S.S.N.; supervision, N.S.C.K., M.K.M. and K.S.N. All authors have read and agreed to the published version of the manuscript.

Funding

This research received no external funding.

Institutional Review Board Statement

Not applicable.

Informed Consent Statement

Not applicable.

Data Availability Statement

The dataset used in this research is publicly available on Kaggle.

Conflicts of Interest

The authors declare no conflicts of interest.

References

  1. Picon, A.; Seitz, M.; Alvarez-Gila, A.; Mohnke, P.; Ortiz-Barredo, A.; Echazarra, J. Crop conditional Convolutional Neural Networks for massive multi-crop plant disease classification over cell phone acquired images taken on real field conditions. Comput. Electron. Agric. 2019, 167, 105093. [Google Scholar] [CrossRef]
  2. Chaudhury, A.; Barron, J.L. Plant species identification from occluded leaf images. IEEE/ACM Trans. Comput. Biol. Bioinform. 2018, 17, 1042–1055. [Google Scholar] [CrossRef] [PubMed]
  3. Richey, B.; Majumder, S.; Shirvaikar, M.; Kehtarnavaz, N. Real-time detection of maize crop disease via a deep learning-based smartphone app. In Real-Time Image Processing and Deep Learning; SPIE: Bellingham, DC, USA, 2020; Volume 11401, pp. 23–29. [Google Scholar]
  4. Yang, C.K.; Lee, C.Y.; Wang, H.S.; Huang, S.C.; Liang, P.I.; Chen, J.S.; Kuo, C.F.; Tu, K.H.; Yeh, C.Y.; Chen, T.D. Glomerular disease classification and lesion identification by machine learning. Biomed. J. 2022, 45, 675–685. [Google Scholar] [CrossRef] [PubMed]
  5. Shrestha, Y.R.; Krishna, V.; von Krogh, G. Augmenting organizational decision-making with deep learning algorithms: Principles, promises, and challenges. J. Bus. Res. 2021, 123, 588–603. [Google Scholar] [CrossRef]
  6. Cevallos, C.; Ponce, H.; Moya-Albor, E.; Brieva, J. Vision-based analysis on leaves of tomato crops for classifying nutrient deficiency using convolutional neural networks. In Proceedings of the 2020 International Joint Conference on Neural Networks (IJCNN), Glasgow, UK, 19–24 July 2020; pp. 1–7. [Google Scholar]
  7. Veys, C.; Chatziavgerinos, F.; AlSuwaidi, A.; Hibbert, J.; Hansen, M.; Bernotas, G.; Smith, M.; Yin, H.; Rolfe, S.; Grieve, B. Multispectral imaging for presymptomatic analysis of light leaf spot in oilseed rape. Plant Methods 2019, 15, 4. [Google Scholar] [CrossRef] [PubMed]
  8. Argüeso, D.; Picon, A.; Irusta, U.; Medela, A.; San-Emeterio, M.G.; Bereciartua, A.; Alvarez-Gila, A. Few-Shot Learning approach for plant disease classification using images taken in the field. Comput. Electron. Agric. 2020, 175, 105542. [Google Scholar] [CrossRef]
  9. Ashourloo, D.; Aghighi, H.; Matkan, A.A.; Mobasheri, M.R.; Rad, A.M. An investigation into machine learning regression techniques for the leaf rust disease detection using hyperspectral measurement. IEEE J. Sel. Top. Appl. Earth Obs. Remote Sens. 2016, 9, 4344–4351. [Google Scholar] [CrossRef]
  10. Nazki, H.; Yoon, S.; Fuentes, A.; Park, D.S. Unsupervised image translation using adversarial networks for improved plant disease recognition. Comput. Electron. Agric. 2020, 168, 105117. [Google Scholar] [CrossRef]
  11. Chen, J.; Zhang, D.; Nanehkaran, Y.A. Identifying plant diseases using deep transfer learning and enhanced lightweight network. Multimed. Tools Appl. 2020, 31, 497–515. [Google Scholar] [CrossRef]
  12. Golhani, K.; Balasundram, S.K.; Vadamalai, G.; Pradhan, B. A review of neural networks in plant disease detection using hyperspectral data. Inf. Process. Agric. 2018, 5, 354–371. [Google Scholar] [CrossRef]
  13. Krishnan, V.G.; Deepa, J.R.; Rao, P.V.; Divya, V.; Kaviarasan, S. An automated segmentation and classification model for banana leaf disease detection. J. Appl. Biol. Biotechnol. 2022, 10, 213–220. [Google Scholar]
  14. Ngugi, L.C.; Abelwahab, M.; Abo-Zahhad, M. Recent advances in image processing techniques for automated leaf pest and disease recognition–A review. Inf. Process. Agric. 2021, 8, 27–51. [Google Scholar] [CrossRef]
  15. Brahimi, M.; Arsenovic, M.; Laraba, S.; Sladojevic, S.; Boukhalfa, K.; Moussaoui, A. Deep learning for plant diseases: Detection and saliency map visualisation. In Human and Machine Learning: Visible, Explainable, Trustworthy and Transparent; Springer: Cham, Switzerland, 2018; pp. 93–117. [Google Scholar]
  16. Lamba, M.; Gigras, Y.; Dhull, A. Classification of plant diseases using machine and deep learning. Open Comput. Sci. 2021, 11, 491–508. [Google Scholar] [CrossRef]
  17. Harakannanavar, S.S.; Rudagi, J.M.; Puranikmath, V.I.; Siddiqua, A.; Pramodhini, R. Plant leaf disease detection using computer vision and machine learning algorithms. Glob. Transit. Proc. 2022, 3, 305–310. [Google Scholar] [CrossRef]
  18. Vadivel, T.; Suguna, R. Automatic recognition of tomato leaf disease using fast enhanced learning with image processing. Acta Agric. Scand. Sect. B—Soil Plant Sci. 2022, 72, 312–324. [Google Scholar] [CrossRef]
  19. Sujatha, R.; Chatterjee, J.M.; Jhanjhi, N.Z.; Brohi, S.N. Performance of deep learning vs machine learning in plant leaf disease detection. Microprocess. Microsyst. 2021, 80, 103615. [Google Scholar] [CrossRef]
  20. Essah, R.; Anand, D.; Singh, S. An intelligent cocoa quality testing framework based on deep learning techniques. Meas. Sens. 2022, 24, 100466. [Google Scholar] [CrossRef]
Figure 3. Otsu segmentation for disease severity grading.
Engproc 59 00137 g003
Figure 4. Performance of implemented model on varied dataset distribution ratio.
Engproc 59 00137 g004
Figure 5. Comparison of existing and implemented model accuracy.
Engproc 59 00137 g005
Figure 6. Performance analysis with three variations in the dataset.
Engproc 59 00137 g006
Table 1. Plant disease prognosis studies.
ReferenceMethodologyFindingLimitationAdvantage
[4]Machine learning for disease detectionEnhanced accuracy in diagnosisDependent on data quality and quantityRapid, noninvasive diagnosis
[5]Automated diagnosis challenges and opportunitiesIntegration of technology in agricultureLimited access to advanced technologyPotential for early intervention
[6]Convolutional neural networksImproved early detectionModel complexity and training timeHigh accuracy and speed
[7]Multi spectral image processingTraining and testing processModel complexityProof of concept
[8]Few shot learning approachFast processingComplex modelImproved Speed
[9]Regression techniqueHyperspectral imagesLess accuracyImproved speed
[10]Deep learning for disease detectionAccurate multiclass classificationRequires large labeled datasetsRobust and scalable detection
[11]Deep transfer learningEnhanced networkRequires less dataImproved Accuracy
[12]Hyperspectral images and machine learningEnhanced spectral disease detectionHardware and cost limitationsImproved spectral resolution
[13]Deep-learning model for citrus diseasesHigh accuracy in citrus disease identificationLimited to specific diseasesAccurate and quick diagnosis
[14]New image processing TechniquesImproved accuracyTime delay in processingAccuracy improved
[15]Review of deep-learning techniquesComprehensive overview of deep-learning applicationsLack of standardizationWide applicability and effectiveness
[16]AI and ML applicationsDiverse AI and ML applicationsLack of interpretabilityBroad coverage of AI techniques
[17]Computer vision with ML algorithmsIntegration of techniqueImproved interpretabilityImproved accuracy
[18]Machine learning in smart agricultureIntegration of AI in agricultureInfrastructure constraintsEnhanced efficiency and productivity
[19]Deep learning for disease classificationHigh accuracy in classificationData imbalance issuesEffective for large datasets
Table 2. Performance indicators for the spatial-exploitation-based models.
Models Transfer Learning Training from Scratch
APRF1APRF1
LENET0.970.960.970.940.920.940.900.90
ALEXNET0.980.970.980.960.940.920.920.90
ZFNET0.970.990.990.980.940.910.910.91
VGG-160.990.990.990.980.940.930.910.91
VGG-190.990.990.990.990.950.950.930.94
GOOGLENET0.990.990.990.990.970.960.940.95
Table 3. Effect of the number of epochs on the accuracy.
Number of EpochsTraining
Accuracy
Training LossValidation
Accuracy
Validation Loss
250.89650.38650.90250.2145
400.92510.24560.93650.156
500.95640.09520.96570.123
750.97650.13650.98980.1021
1000.86780.58620.87420.4658
Table 4. Experimental indices for different hyperparameter values.
Number
of Epochs
Learning RateDropout RateTraining
Accuracy
Validation
Accuracy
Training LossValidation Loss
250.0010.250.93540.86240.43620.4521
500.00010.250.92640.89510.35610.3125
750.10.150.90210.89990.25310.2001
750.0010.250.99850.98540.12540.1564
750.00010.400.86940.8320.32140.2154
750.000010.500.82160.80210.21450.5641
Disclaimer/Publisher’s Note: The statements, opinions and data contained in all publications are solely those of the individual author(s) and contributor(s) and not of MDPI and/or the editor(s). MDPI and/or the editor(s) disclaim responsibility for any injury to people or property resulting from any ideas, methods, instructions or products referred to in the content.

