

Spectrophotometric Determination of Amaranth Dye Using a Two-Step Green Cloud Point and Magnetic Solid-Phase Extraction Approach †

Abstract
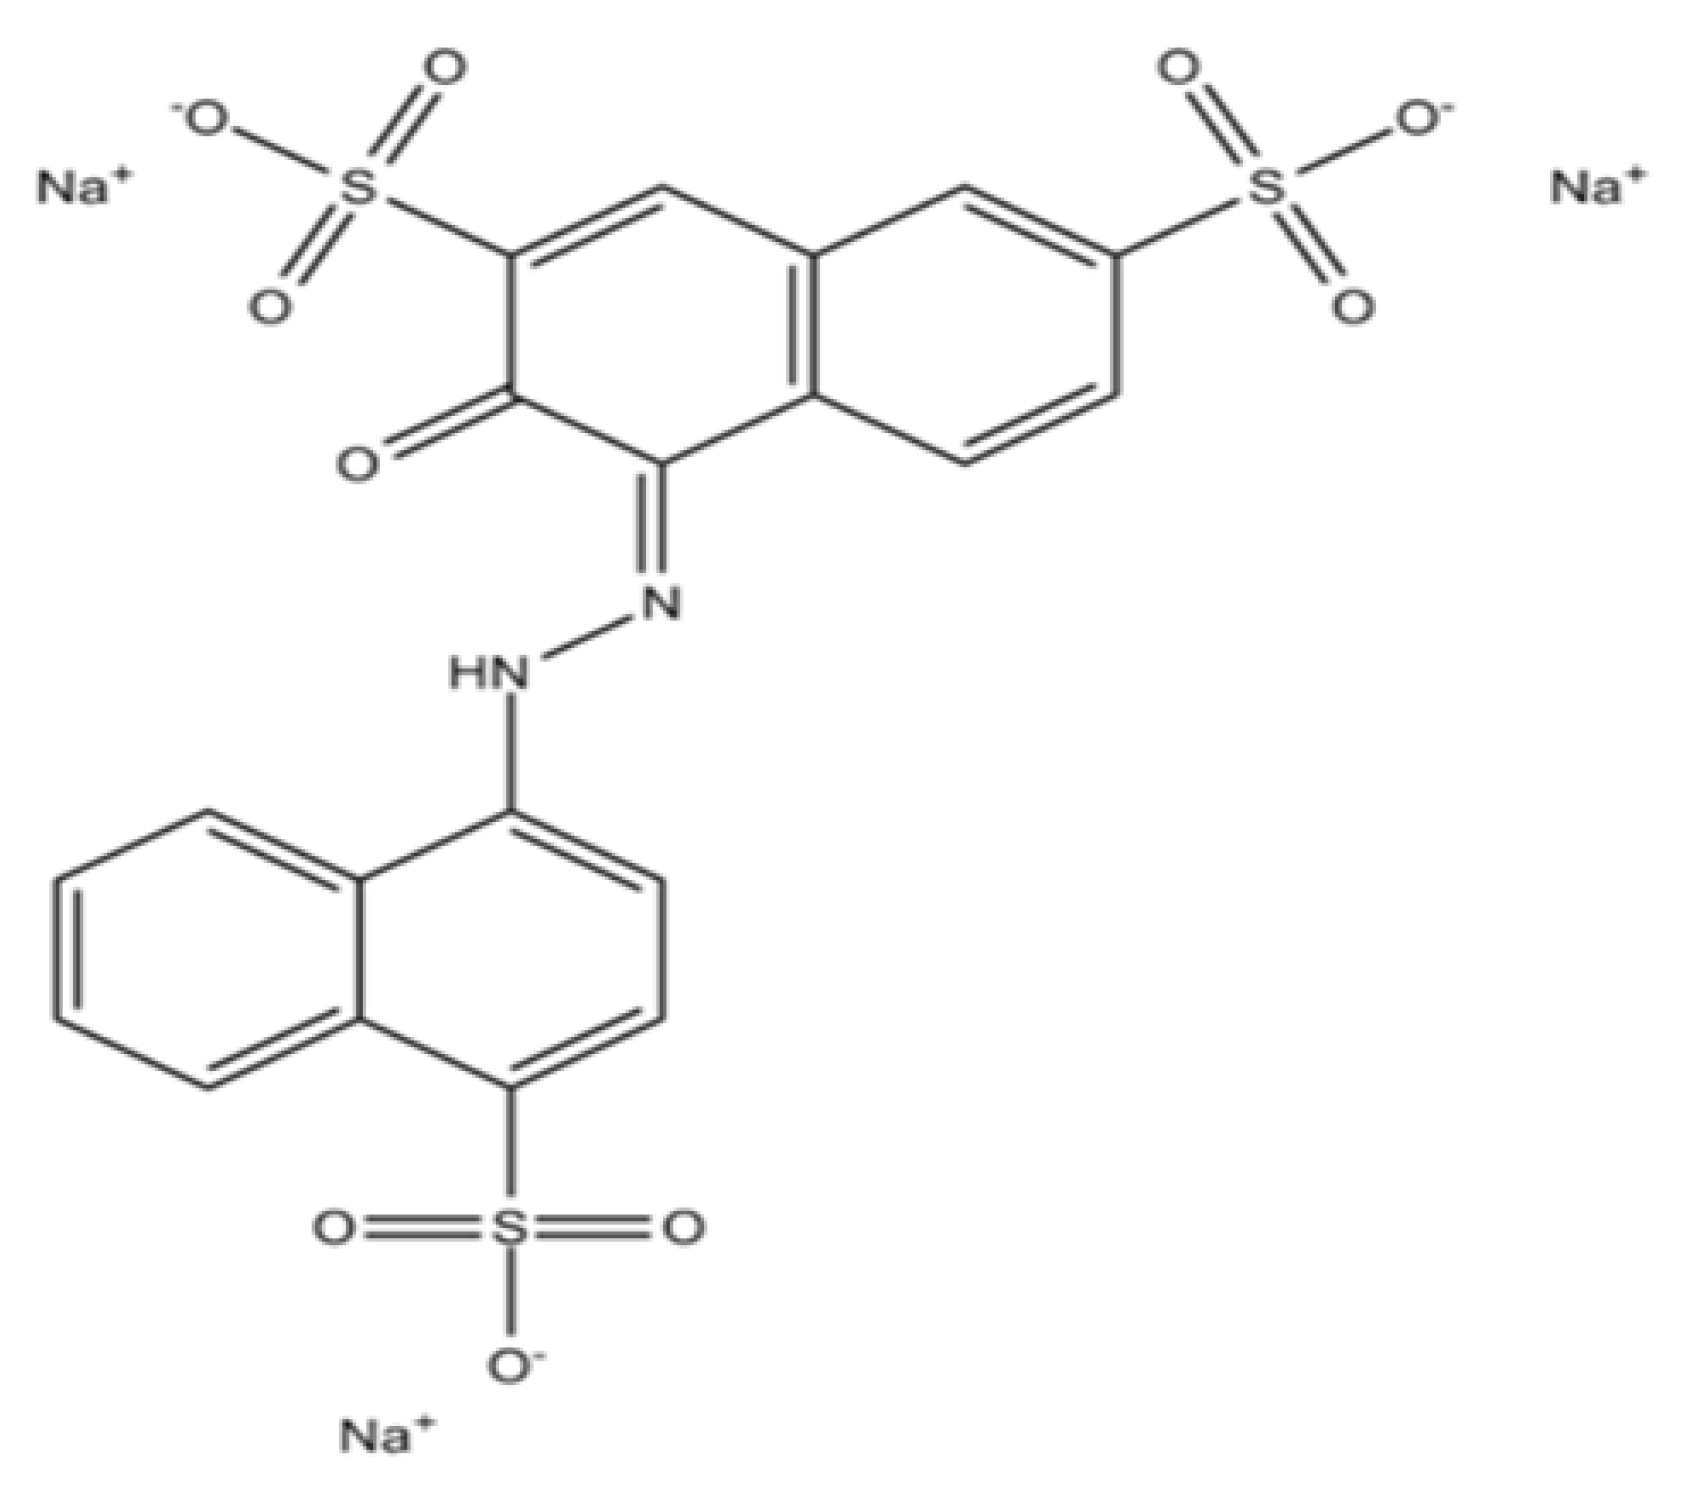
:1. Introduction
2. Materials and Methods
2.1. Apparatus
2.2. Chemicals
2.3. Synthesis of TEOS Functionalized Magnetic Nanoparticles
2.4. Recommended Extraction Procedure
3. Result and Discussion
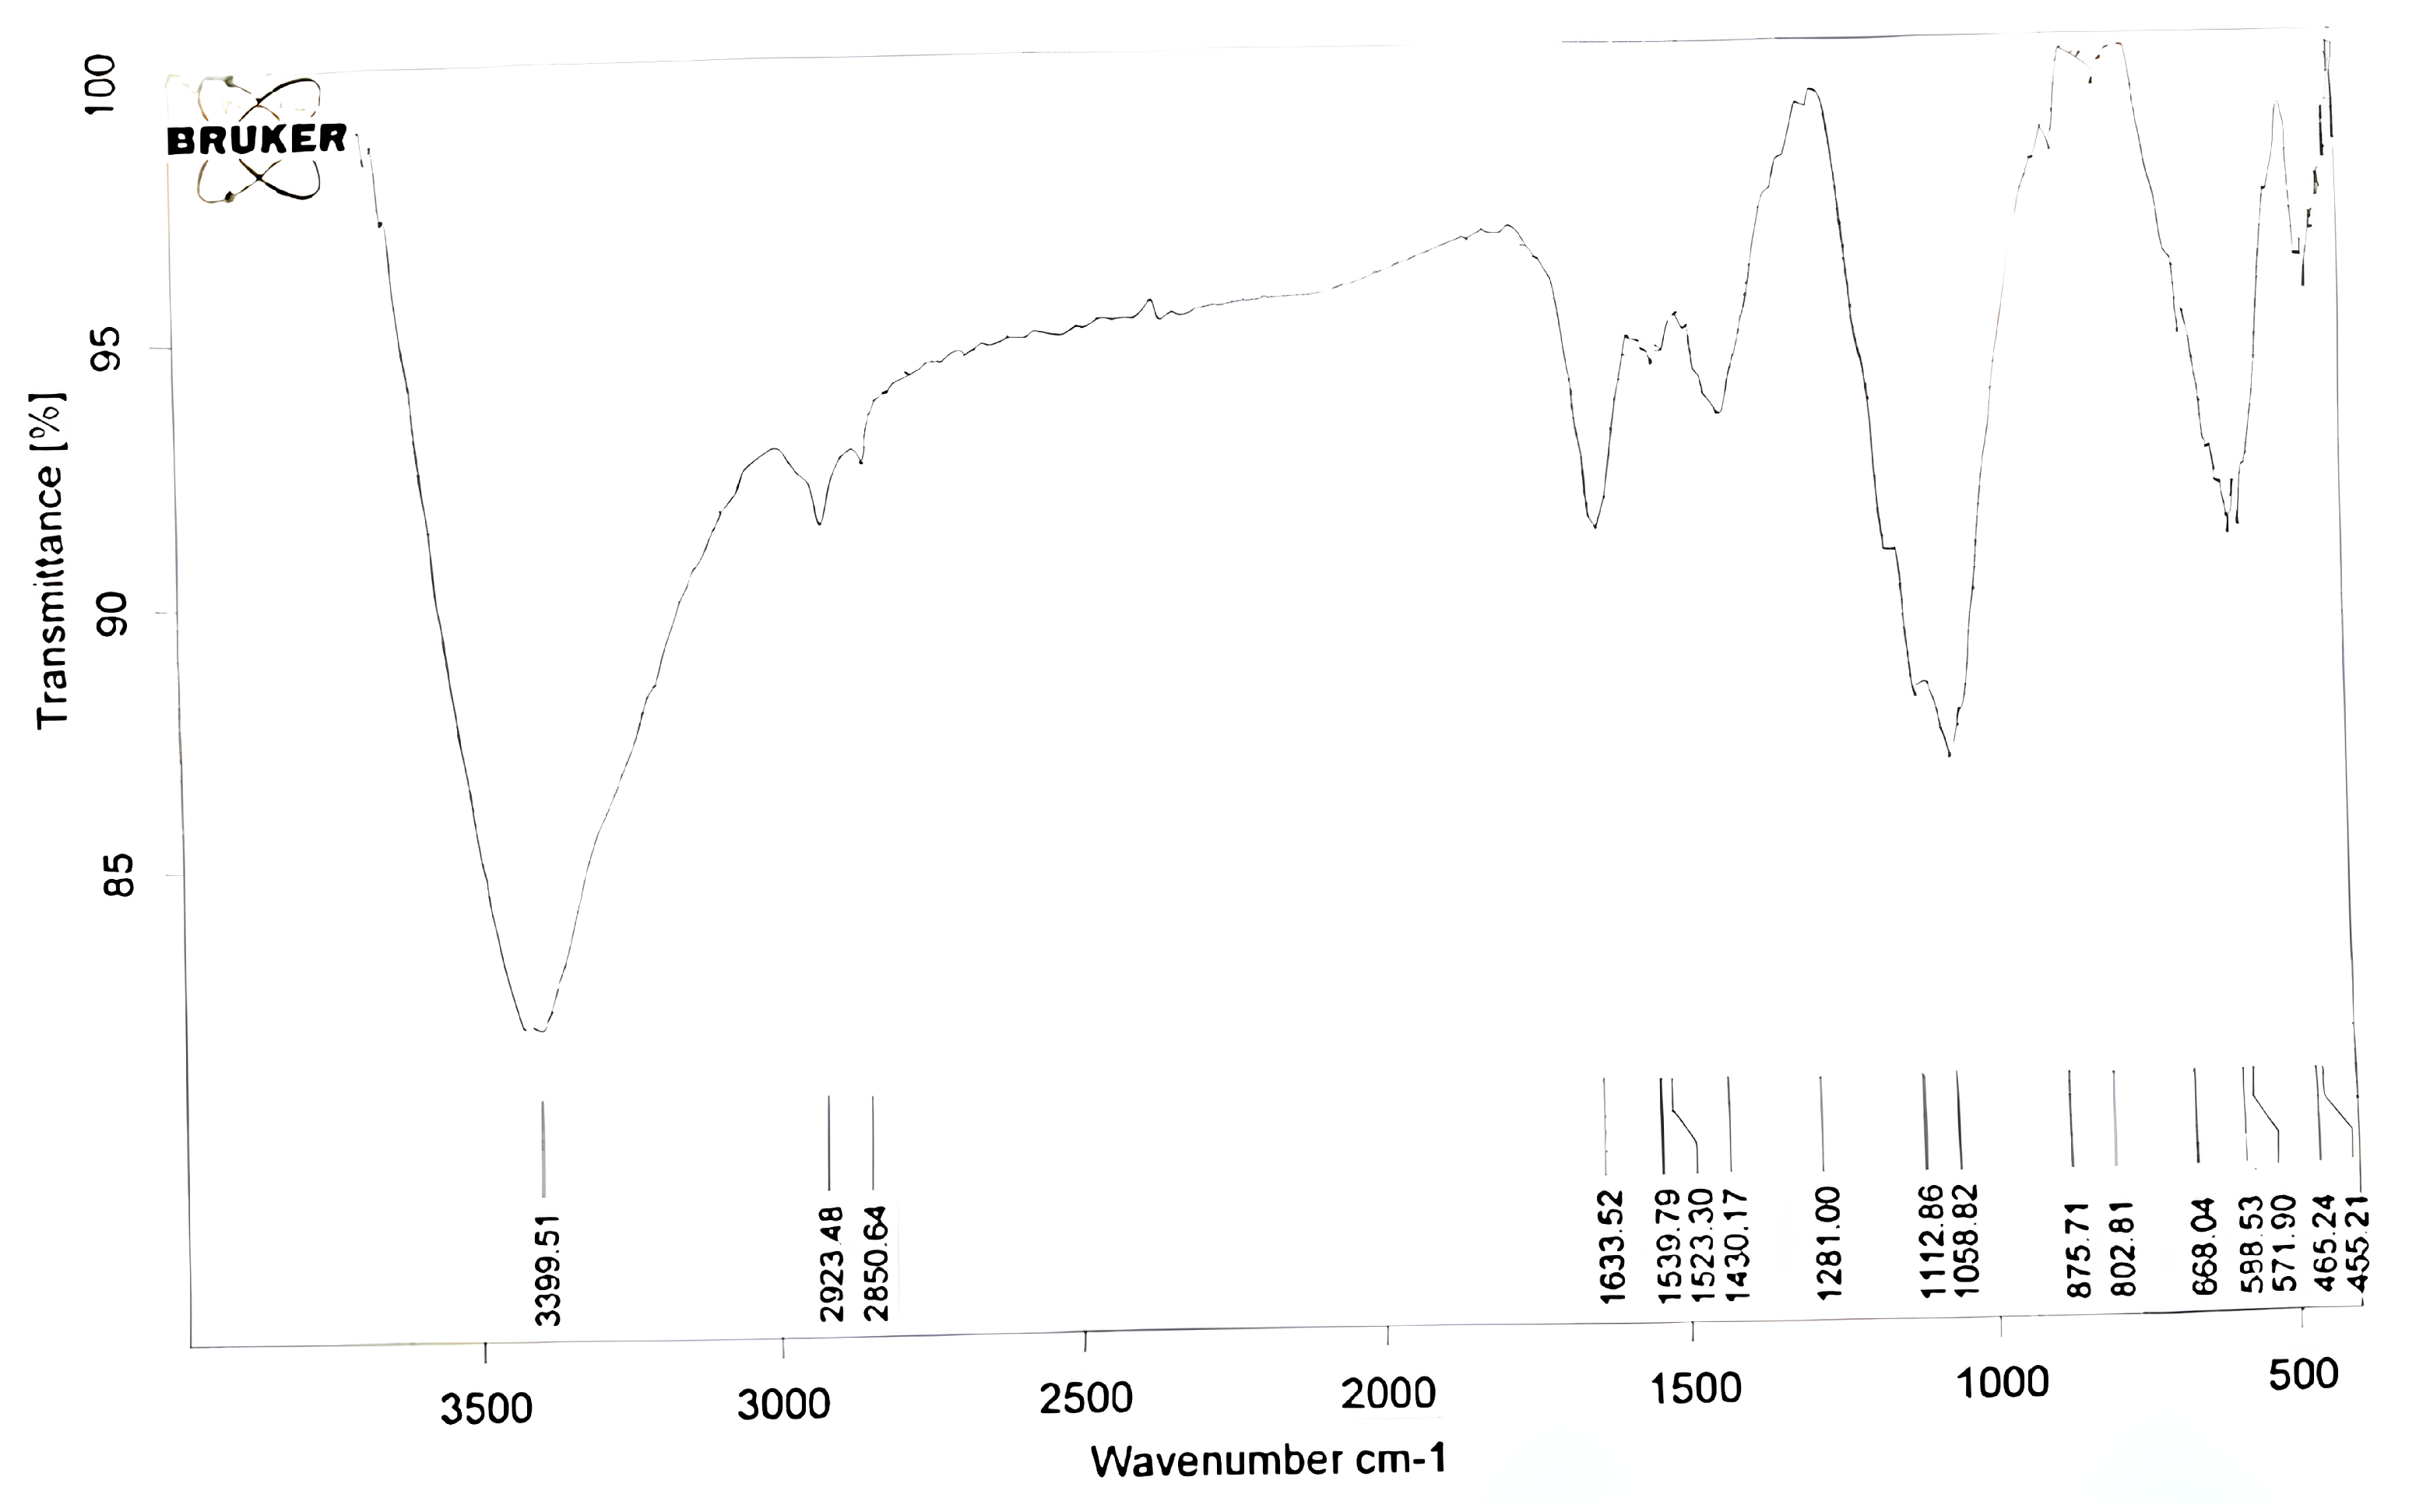
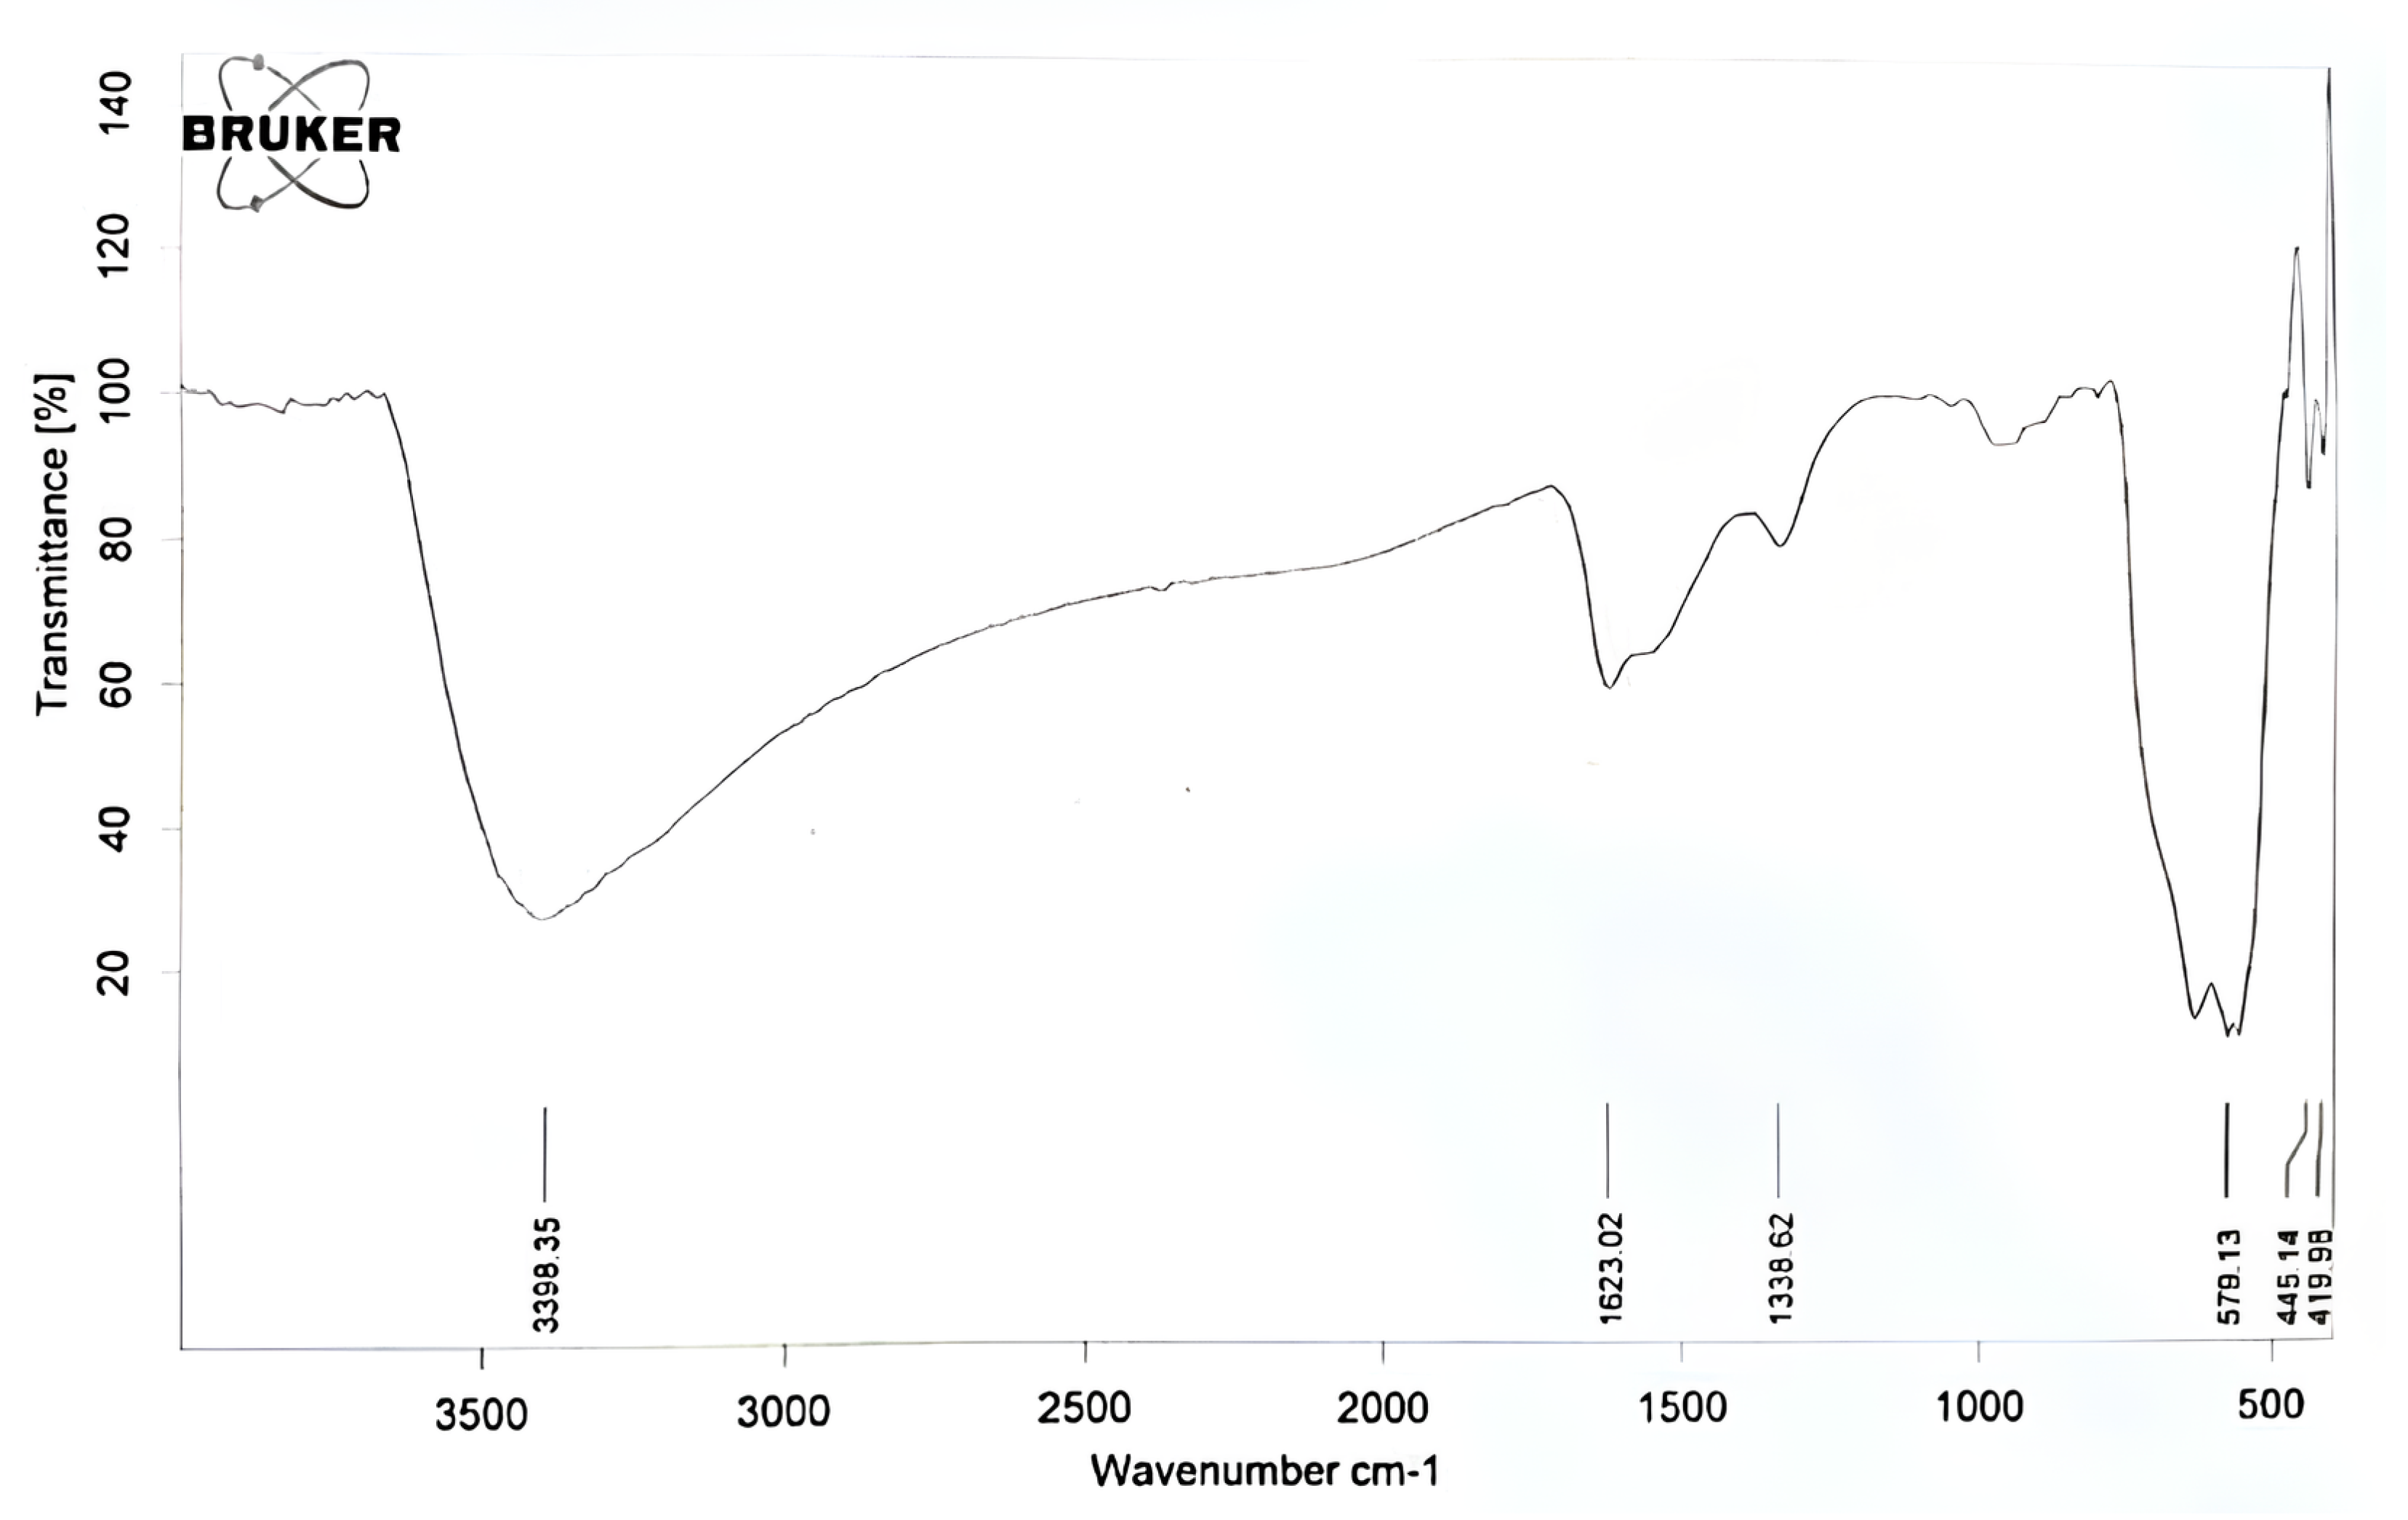
3.1. Fourier Transform Infrared Spectroscopy (FTIR) Analysis
- 579 cm: stretching vibration of Fe-O bonds.
- 670 cm: bending vibration of Fe-O bonds (not observed in this study).
- 1100–1200 cm: stretching vibration of the O-Fe-O bridges in the spinel structure (not observed in this study).
- 1623 cm: bending vibration of the O-Fe-O bridges in the spinel structure.
- 3398 cm: O-H stretching, associated with water molecules adsorbed on the surface of FeO.
- (A)
- TEOS:
- 1058 cm: Si-O-Si stretching;
- 875 cm: Si-O-C stretching;
- 850 cm: Si-O-CH bending;
- 2923 cm: C-H stretching of ethyl groups.
- (B)
- FeO:
- 588–465 cm: Fe-O stretching;
- 1539 cm: O-H bending (associated with water molecules on the surface of FeO);
- 3399 cm: O-H stretching (associated with water molecules on the surface of FeO).
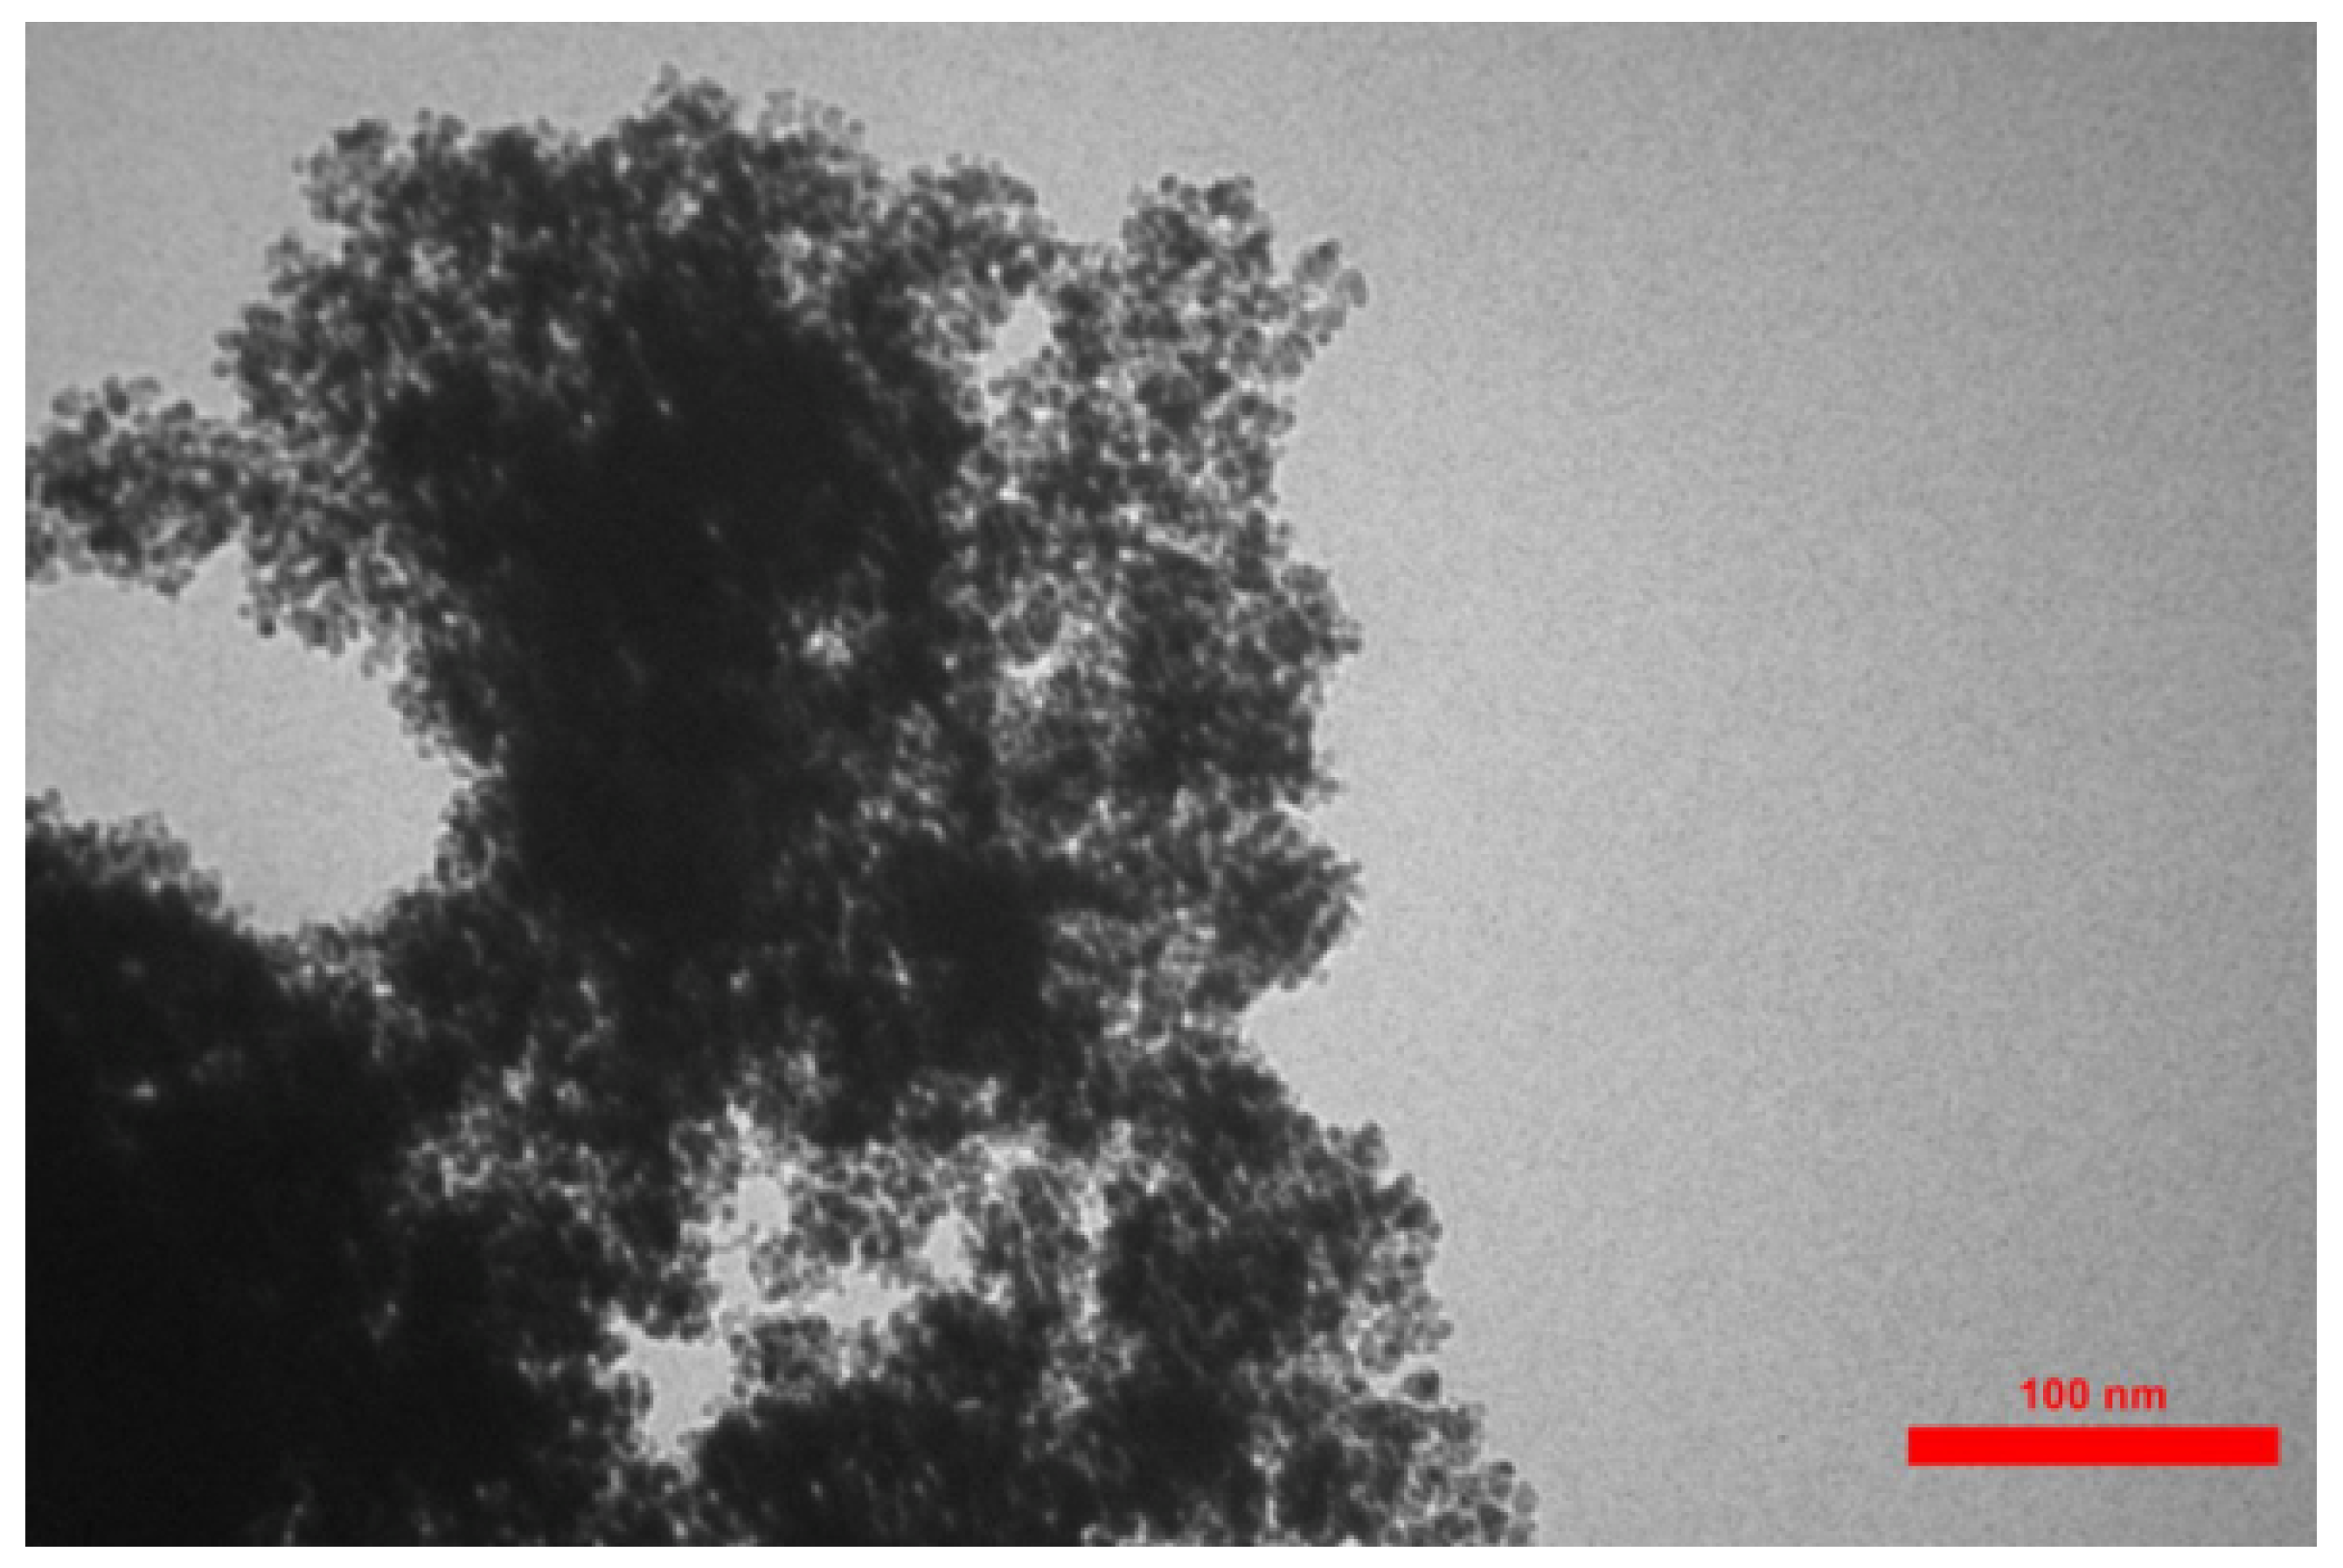
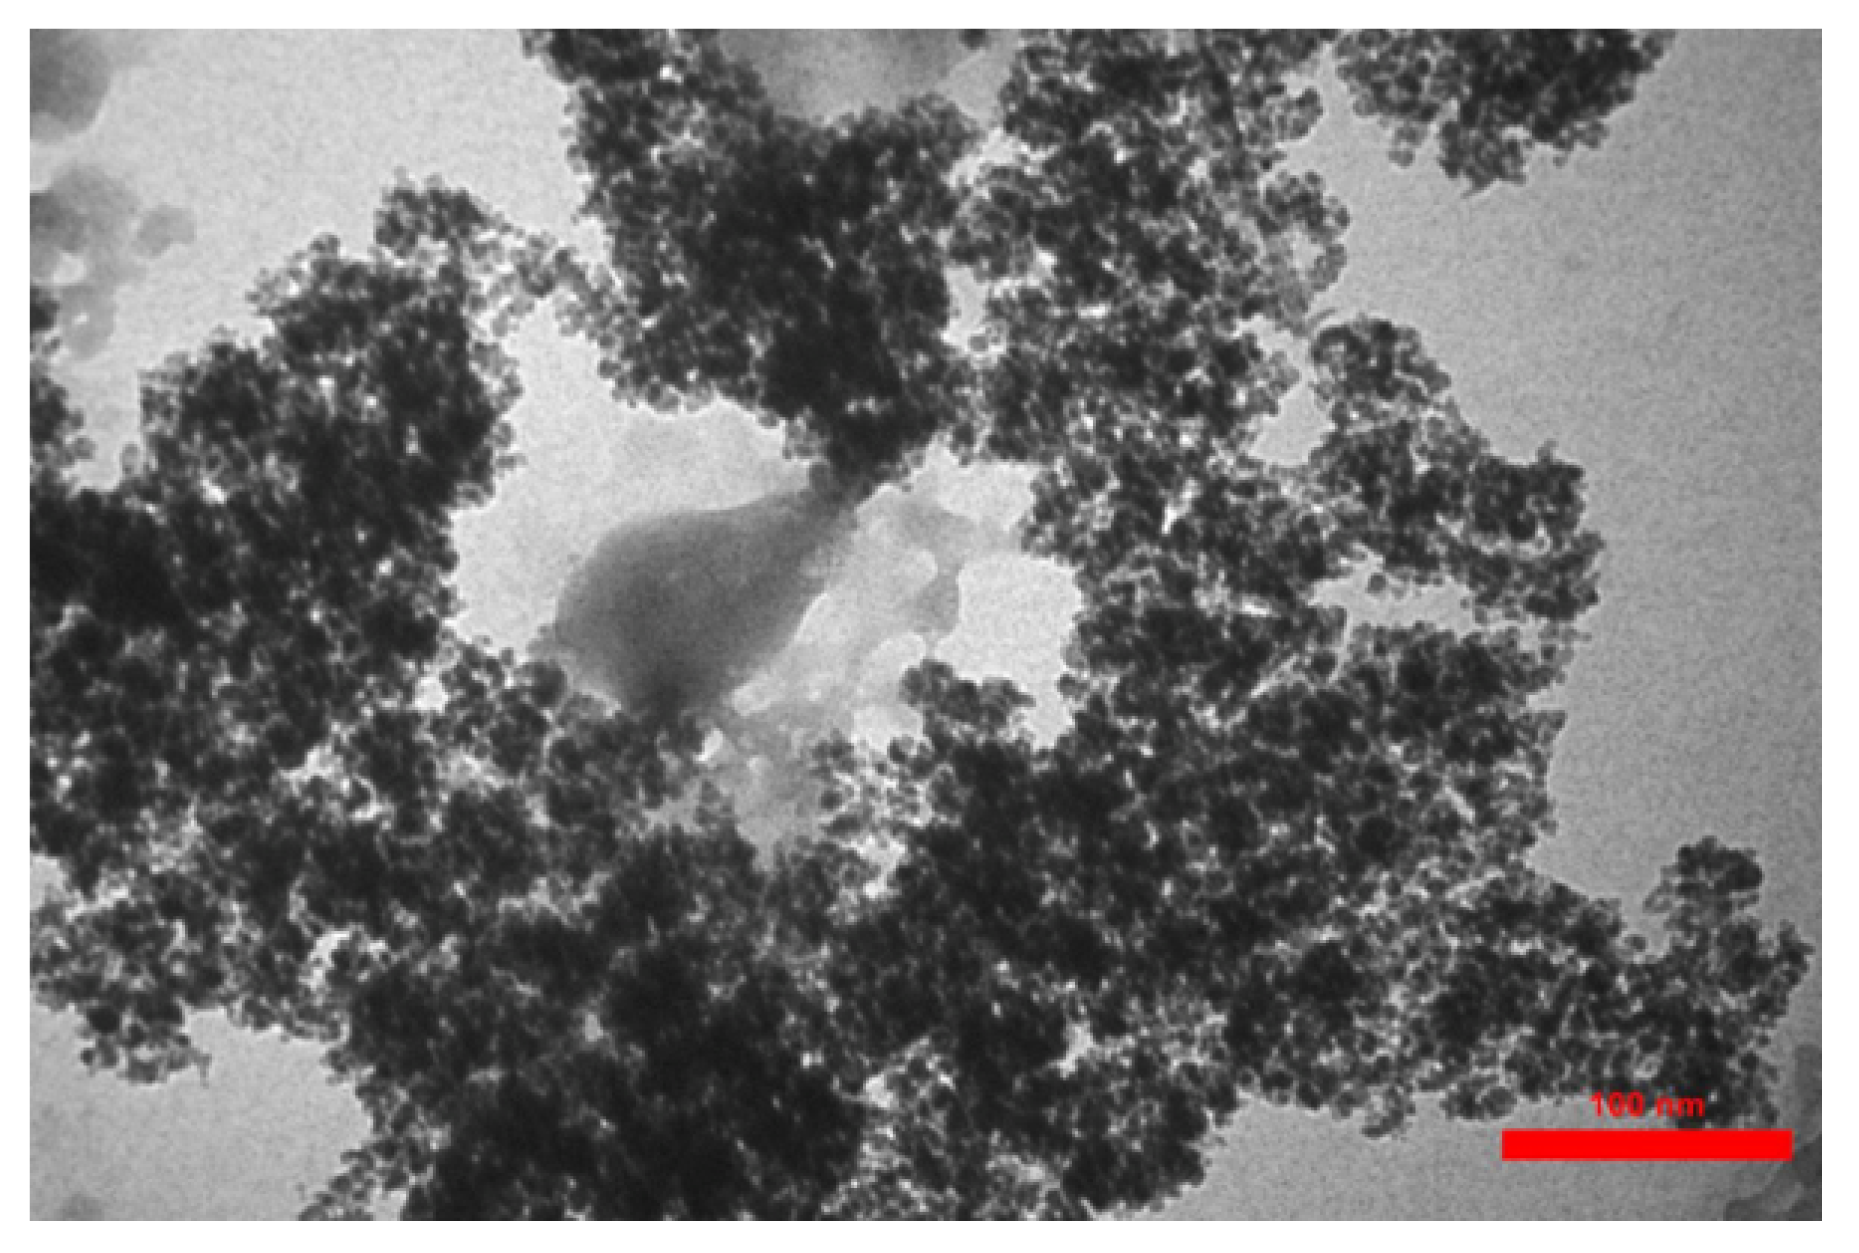
3.2. Transmission Electron Microscopy (TEM)
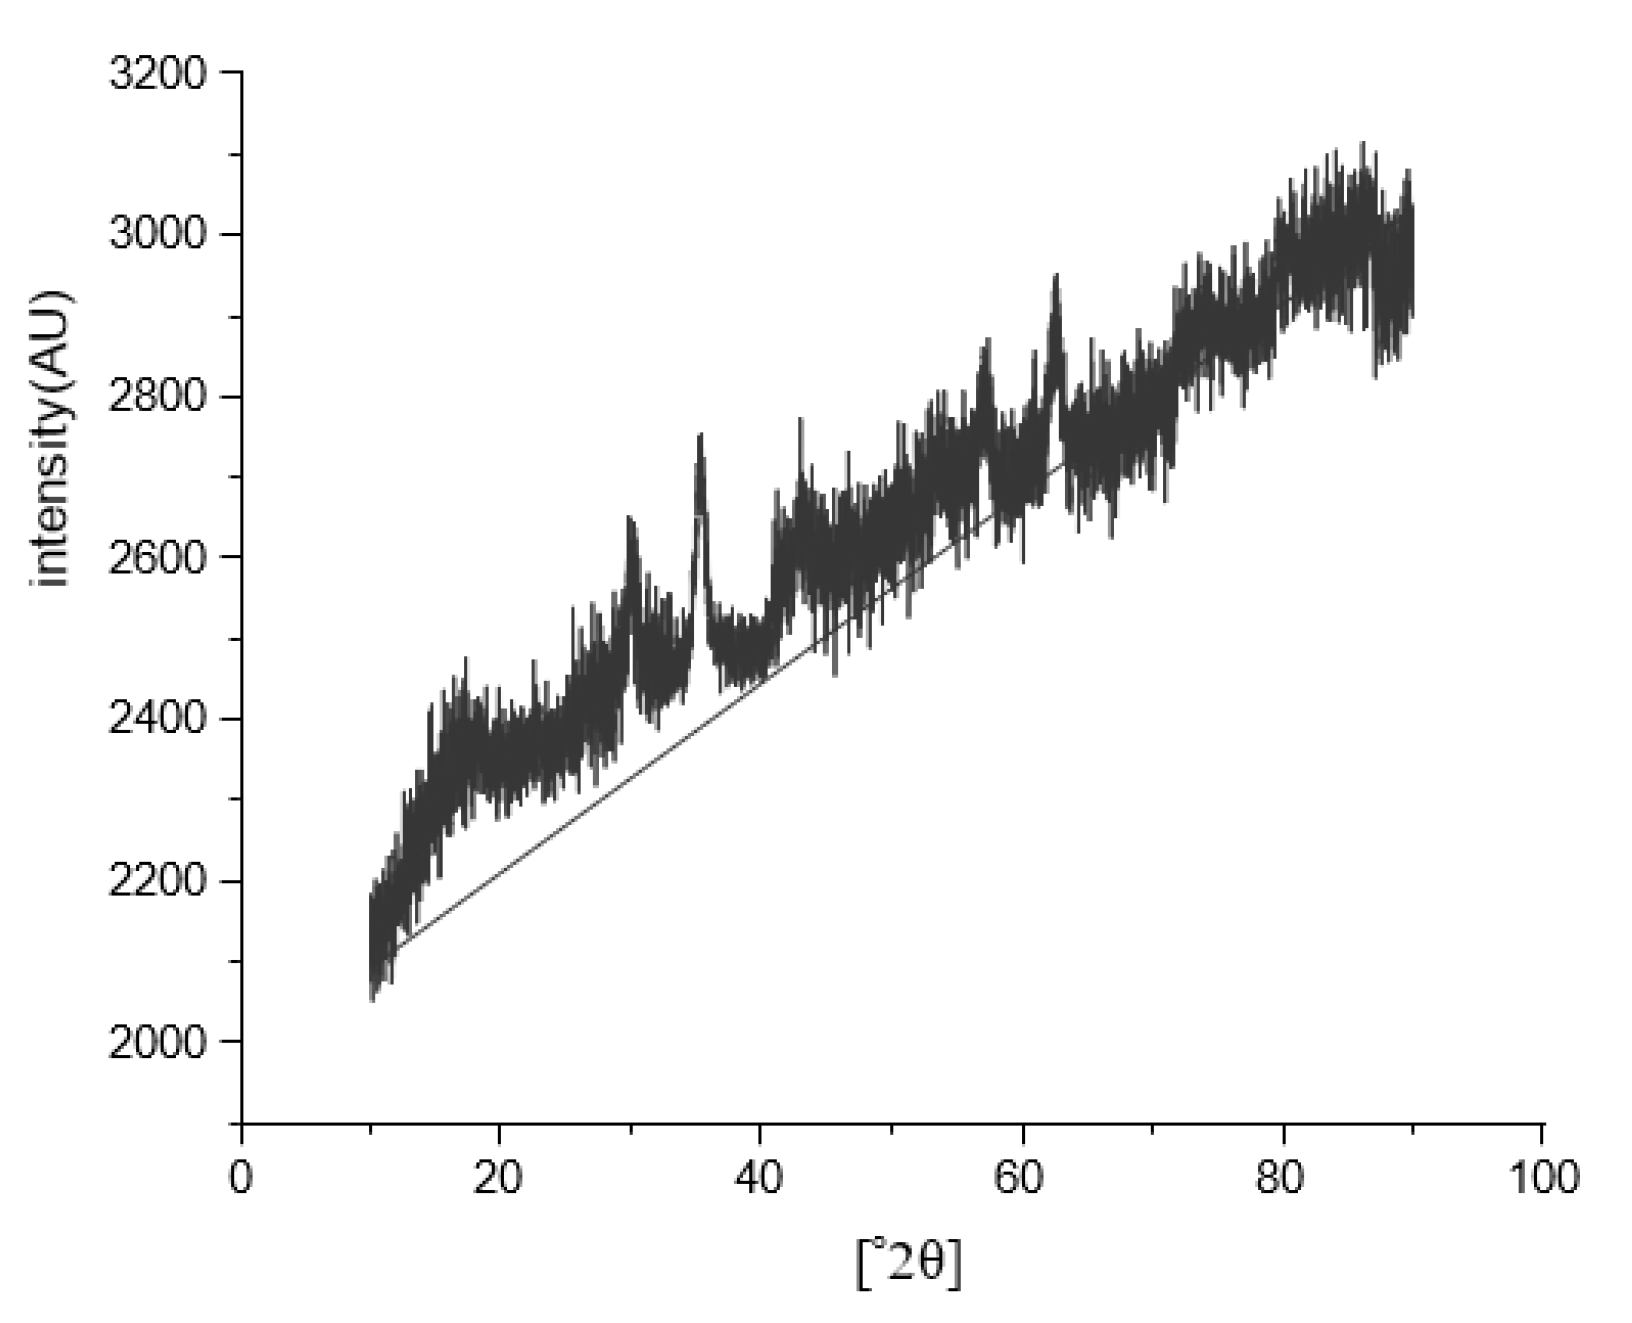
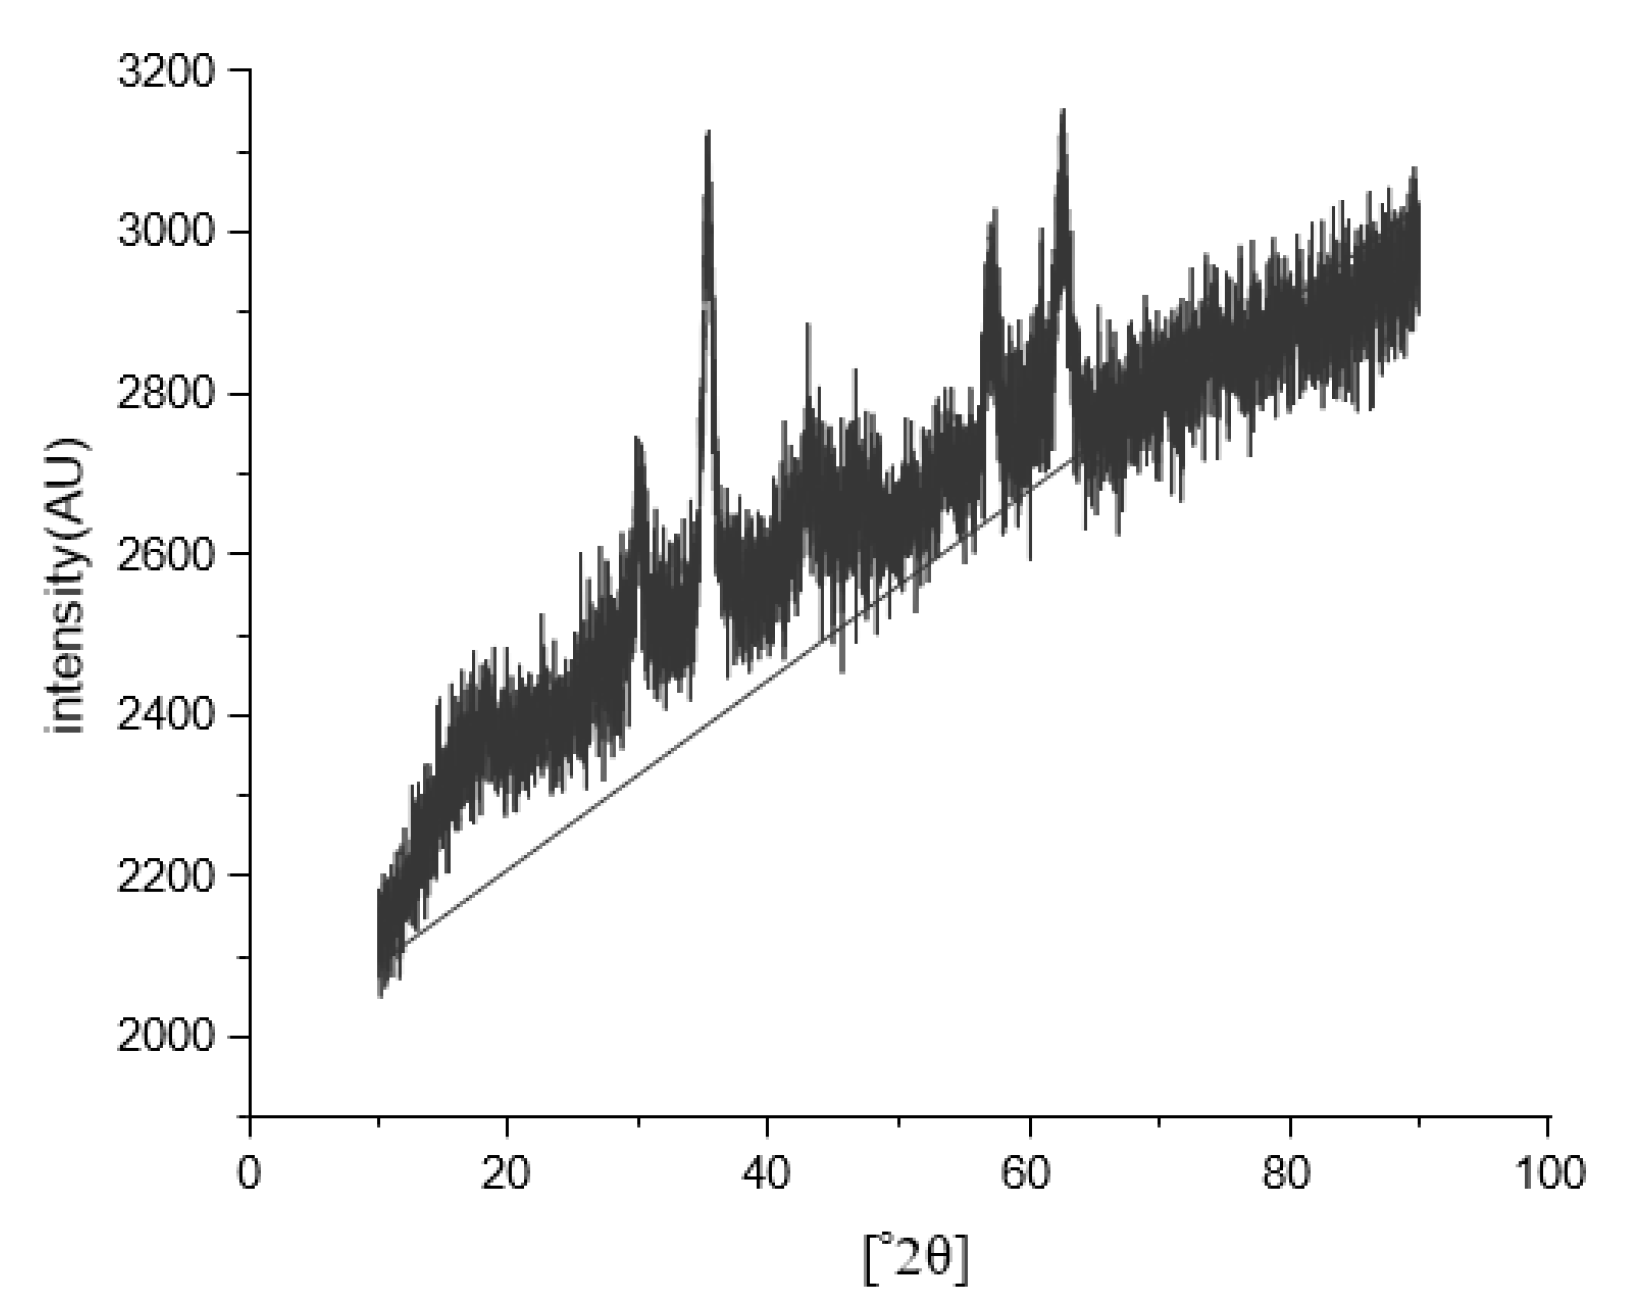
3.3. X-Ray Diffraction (XRD)
3.4. Optimization of CPE Procedure
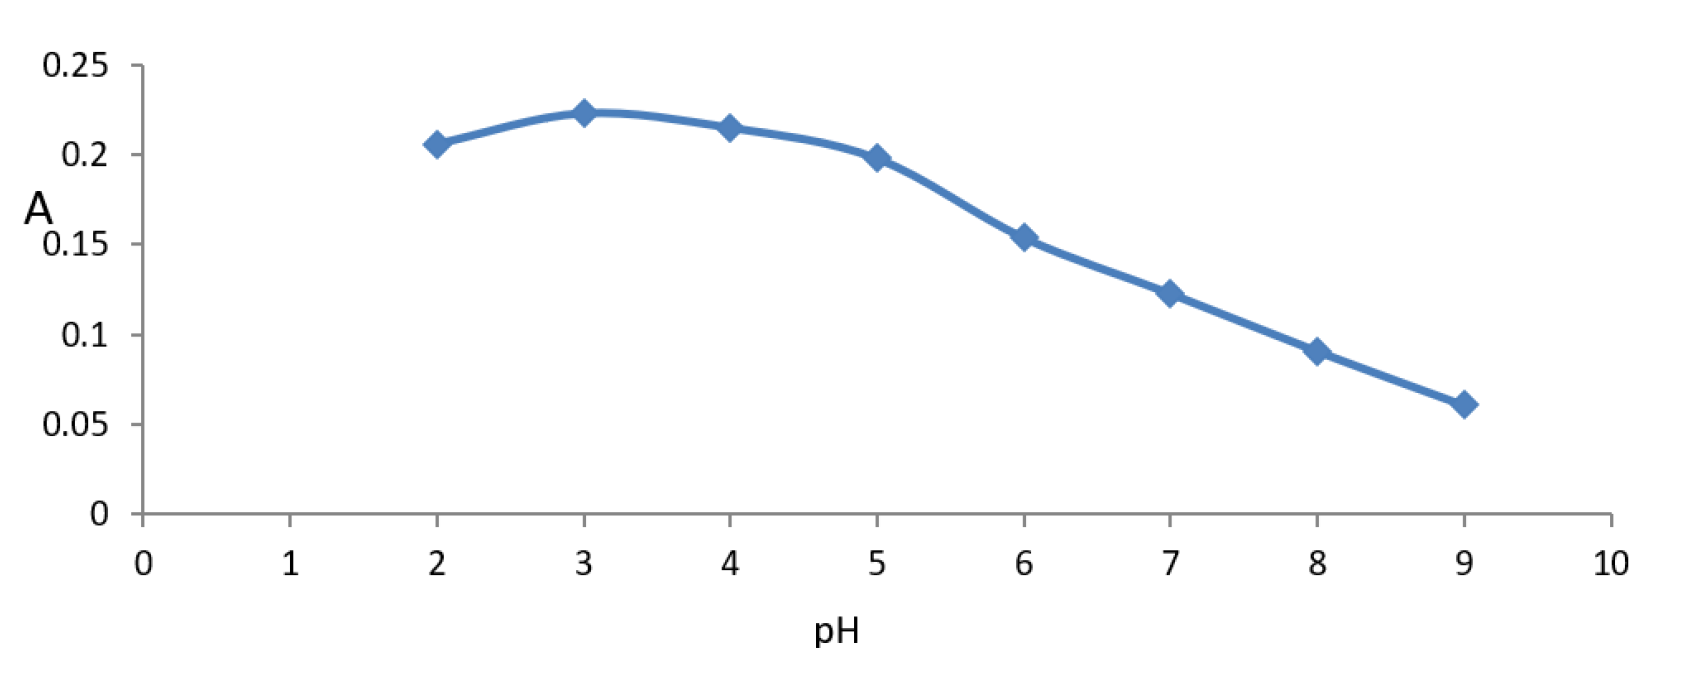
3.4.1. Effect of pH
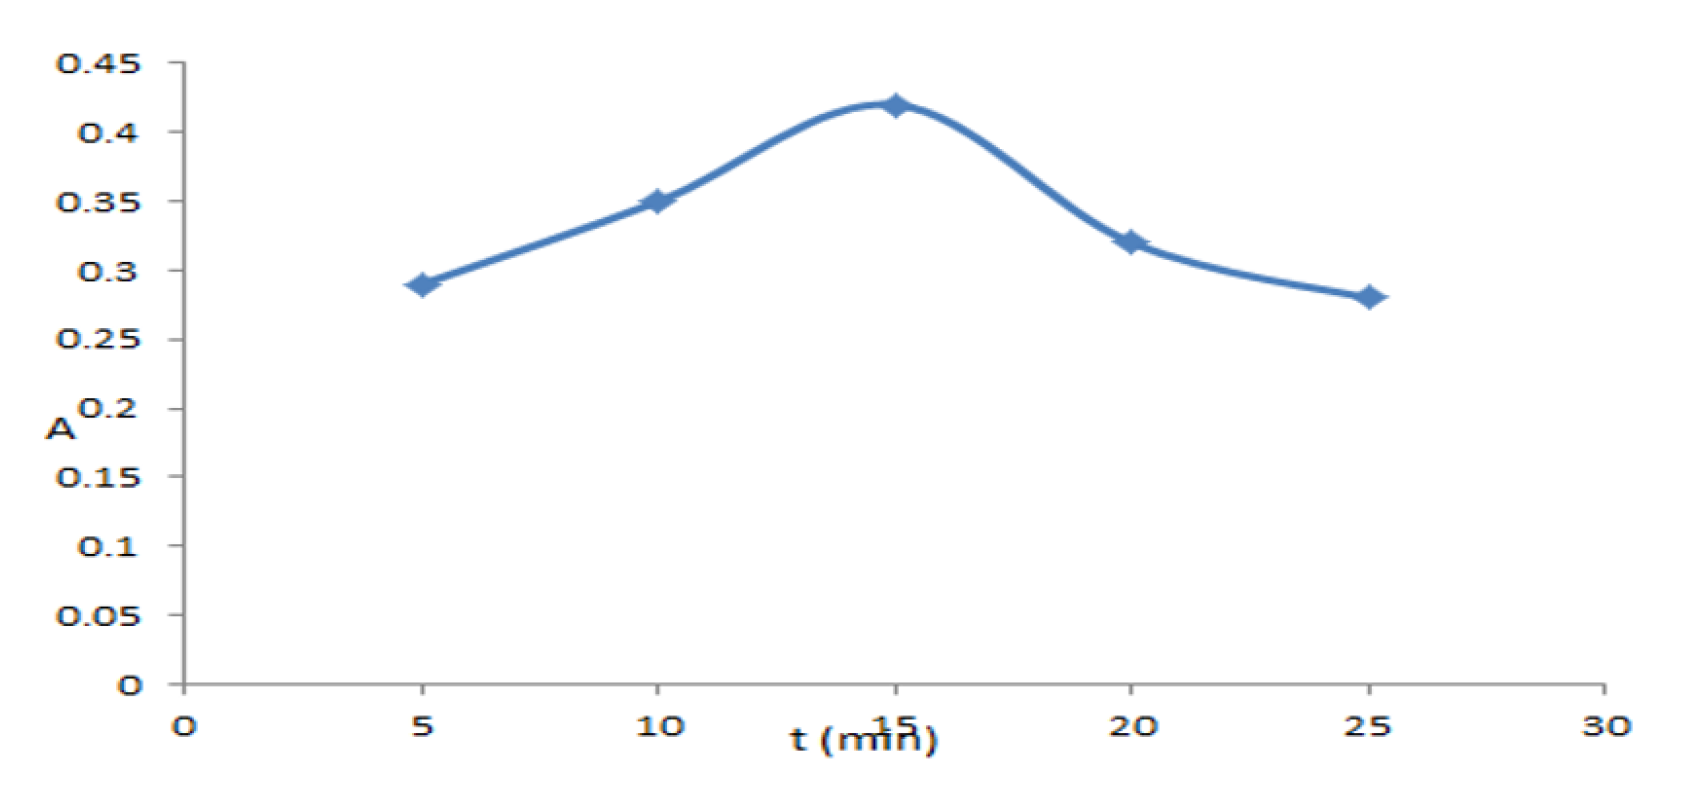
3.4.2. Effect of Time
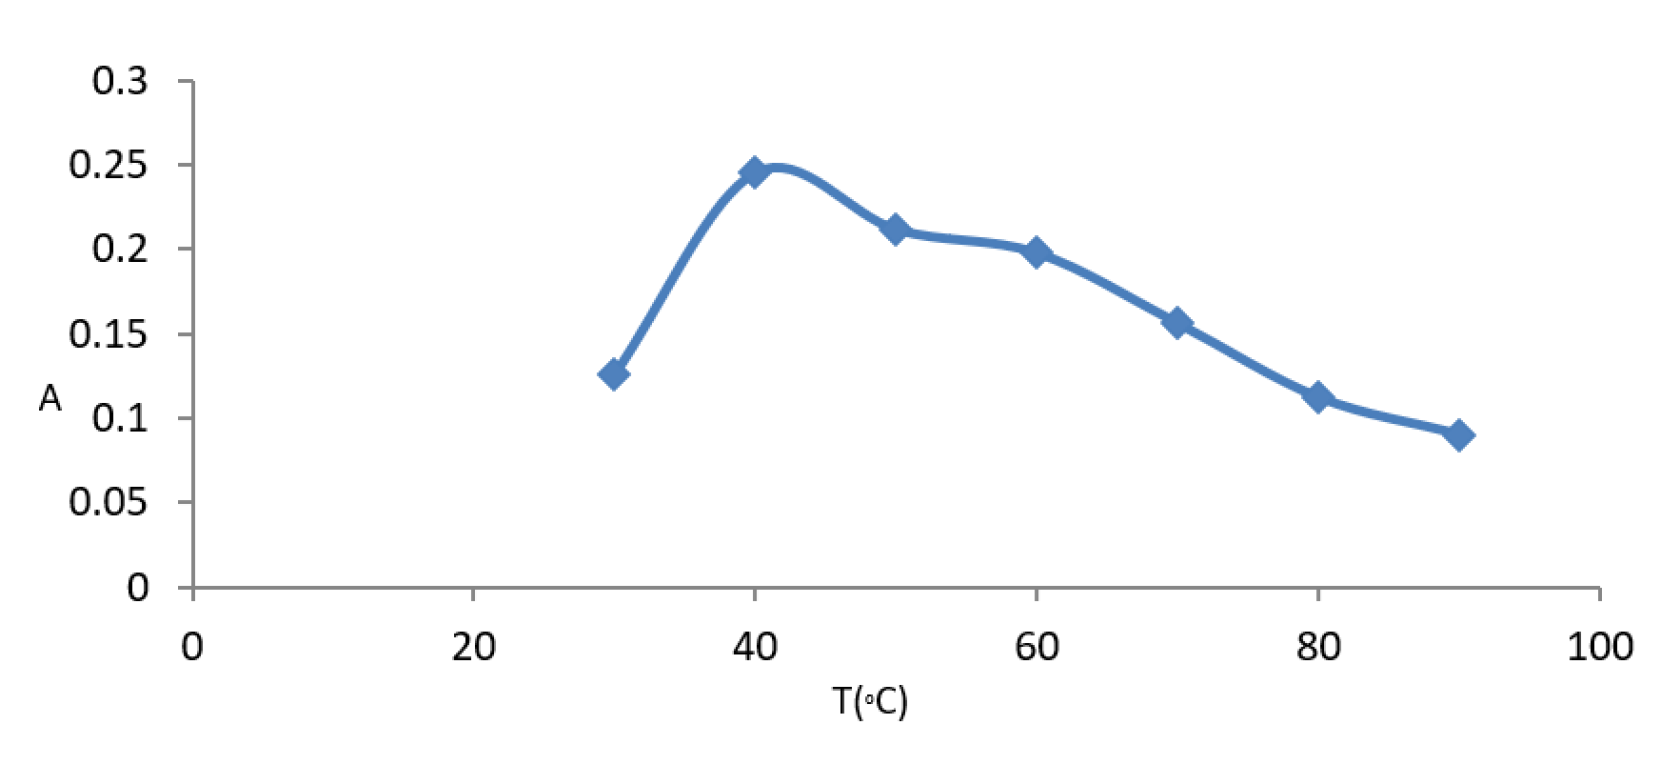
3.4.3. Effect of Temperature
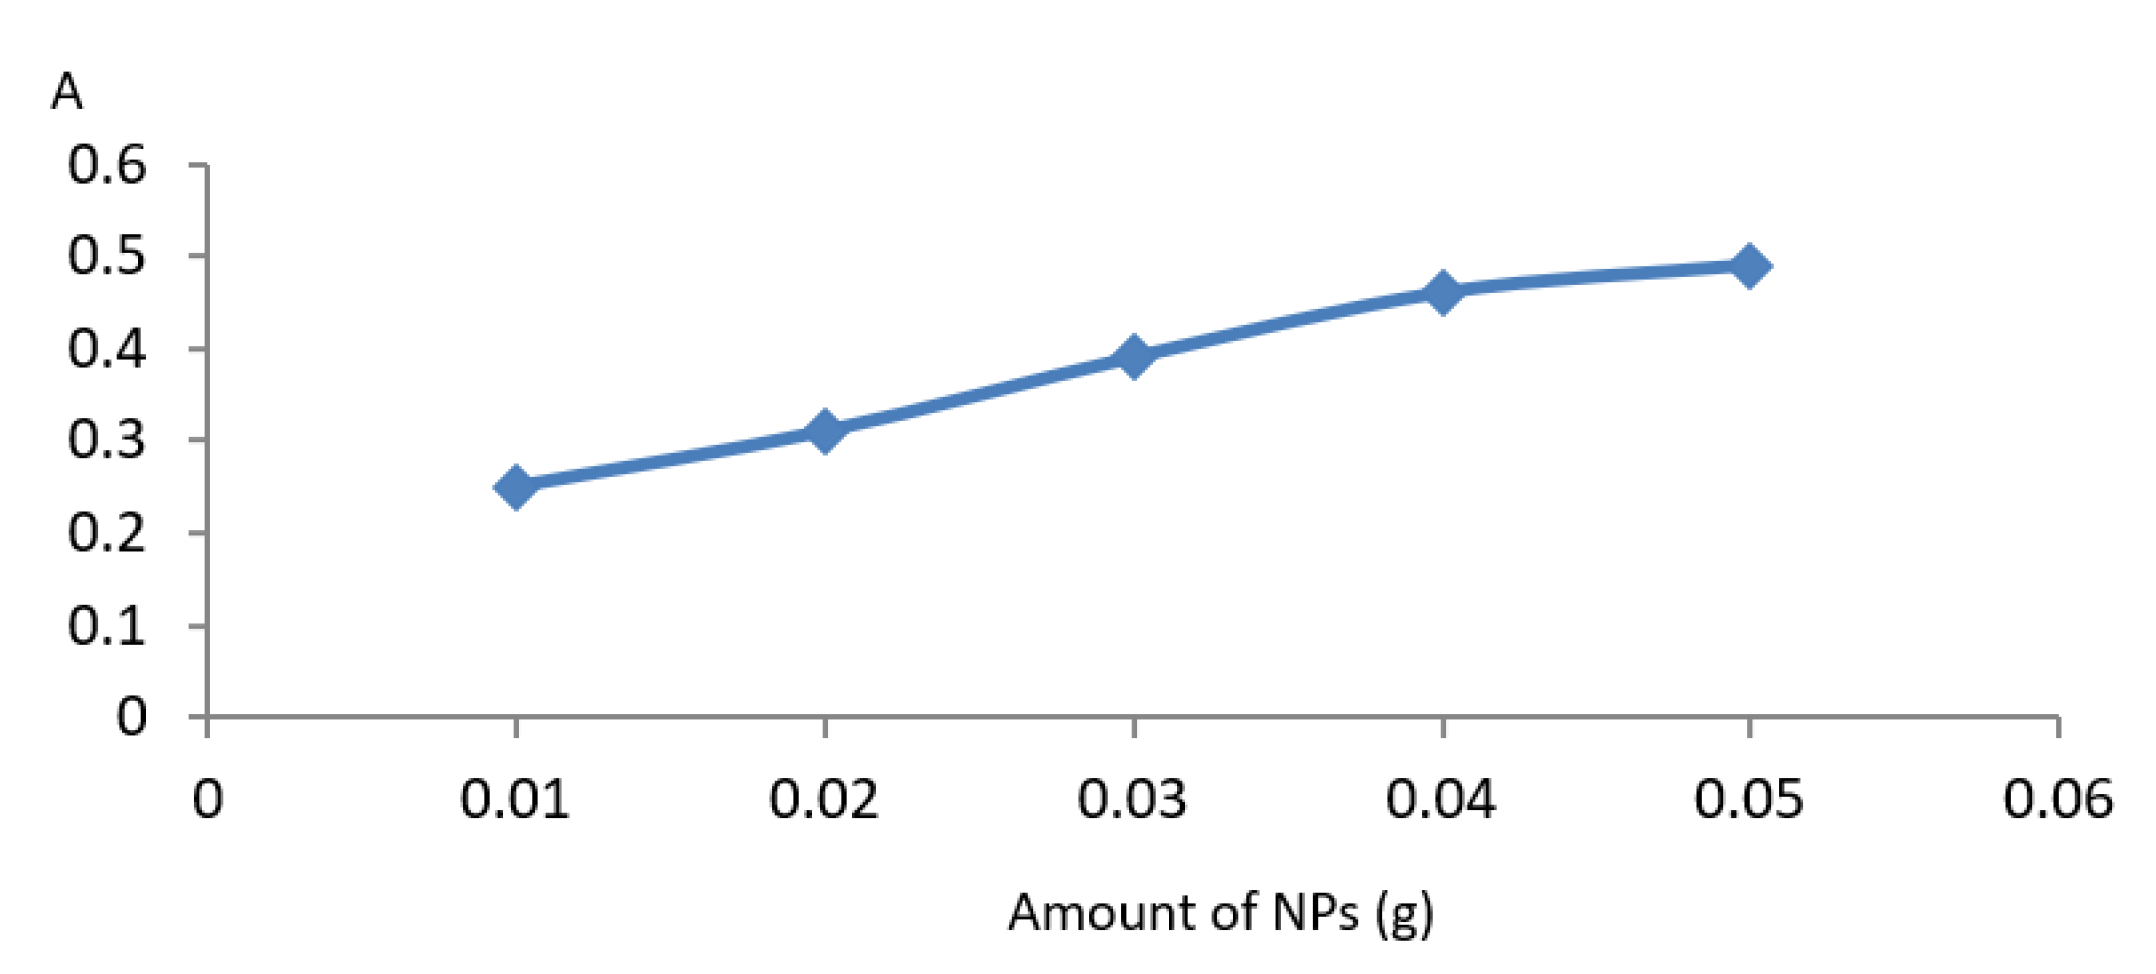
3.4.4. Effect of Amount of Nanomaterials
3.4.5. Analytical Performance of the Optimized Method
4. Conclusions
Author Contributions
Funding
Institutional Review Board Statement
Informed Consent Statement
Data Availability Statement
Conflicts of Interest
References
- Puzenat, E.; Lachheb, H.; Karkmaz, M.; Houas, A.; Guillard, C.; Herrmann, J.M. Fate of nitrogen atoms in the photocatalytic degradation of industrial (congo red) and alimentary (amaranth) azo dyes. Evidence for mineralization into gaseous dinitrogen. Int. J. Photoenergy 2003, 5, 51–58. [Google Scholar] [CrossRef]
- Christodoulou, P.; Kareli, D.; Poliliou, S. Cytogenetic evaluation and DNA interaction studies of the food colorants amaranth, erythrosine and tartrazine. Food Chem. Toxicol. 2010, 48, 2934–2944. [Google Scholar]
- Ma, M.; Luo, X.; Chen, B.; Su, S.; Yao, S. Simultaneous determination of water-soluble and fat-soluble synthetic colorants in foodstuff by high-performance liquid chromatography–diode array detection–electrospray mass spectrometry. J. Chromatogr. A 2006, 1103, 170–176. [Google Scholar] [CrossRef] [PubMed]
- Ghanbari, P.K.; Roushani, M.; Farzadfar, F.; Goicoechea, H.; Jalalvand, A.R. Developing a four-dimensional voltammetry as a powerful electroanalytical methodology for simultaneous determination of three colorants in the presence of an uncalibrated interference. Chemom. Intell. Lab. Syst. 2019, 189, 27–38. [Google Scholar] [CrossRef]
- Ahmadh, A. A Square-Wave Adsorptive Stripping Voltammetric Method for the Determination of Amaranth, a Food Additive Dye. J. AOAC Int. 2005, 88, 788–793. [Google Scholar]
- Ryvolová, M.; Táborský, P.; Vrábel, P.; Krásenský, P.; Preisler, J. Sensitive determination of erythrosine and other red food colorants using capillary electrophoresis with laser-induced fluorescence detection. J. Chromatogr. A 2007, 1141, 206–211. [Google Scholar] [CrossRef] [PubMed]
- Wang, P.; Hu, X.; Cheng, Q.; Zhao, X.; Fu, X.; Wu, K. Electrochemical detection of amaranth in food based on the enhancement effect of carbon nanotube film. J. Agric. Food Chem. 2010, 58, 12112–12116. [Google Scholar] [CrossRef] [PubMed]
- Pogacean, F.; Rosu, M.-C.; Coros, M.; Magerusan, L.; Moldovan, M.; Sarosi, C. Graphene/TiO2-Ag based composites used as sensitive electrode materials for amaranth electrochemical detection and degradation. J. Electrochem. Soc. 2018, 165, 3054–3059. [Google Scholar] [CrossRef]
- Liu, L.; Mi, Z.; Li, H.; Li, C.; Hu, Q.; Feng, F. Highly selective and sensitive detection of amaranth by using carbon dots-based nanosensor. RSC Adv. 2019, 9, 26315–26320. [Google Scholar] [CrossRef] [PubMed]
- Xia, X.; Zhu, C.; Luo, J.; Zeng, Z.; Guan, C.; Ng, C.F.; Fan, H.J. Synthesis of Free-Standing Metal Sulfide Nanoarrays via Anion Exchange Reaction and Their Electrochemical Energy Storage Application. Small 2014, 10, 766–773. [Google Scholar] [CrossRef] [PubMed]
- Hong, J.G.; Zhang, B.; Glabman, S.; Uzal, N.; Dou, X.; Zhang, H.; Chen, Y. Potential ion exchange membranes and system performance in reverse electrodialysis for power generation: A review. J. Membr. Sci. 2015, 486, 71–88. [Google Scholar] [CrossRef]
- Qi, P.; Zeng, T.; Wen, Z.; Liang, X.; Zhang, X. Interference-free simultaneous determination of Sudan dyes in chili foods using solid phase extraction coupled with HPLC–DAD. Food Chem. 2011, 125, 1462–1467. [Google Scholar] [CrossRef]
- Soylak, M.; Unsal, Y.E.; Yilmaz, E.; Tuzen, M. Determination of rhodamine B in soft drink, waste water and lipstick samples after solid phase extraction. Food Chem. Toxicol. 2011, 49, 1796–1799. [Google Scholar] [CrossRef] [PubMed]
- Zaghdoudi, K.; Pontvianne, S.; Framboisier, X.; Achard, M.; Kudaibergenova, R.; Ayadi-Trabelsi, M.; Guiavarc, Y. Accelerated solvent extraction of carotenoids from: Tunisian Kaki (Diospyros kaki L.), peach (Prunus persica L.) and apricot (Prunus armeniaca L.). Food Chem. 2015, 184, 131–139. [Google Scholar] [CrossRef] [PubMed]
- Altunay, N.; Gürkan, R. A new cloud point extraction procedure for determination of inorganic antimony species in beverages and biological samples by flame atomic absorption spectrometry. Food Chem. 2015, 175, 507–515. [Google Scholar] [CrossRef] [PubMed]
- Gürkan, R.; Korkmaz, S.; Altunay, N. Preconcentration and determination of vanadium and molybdenum in milk, vegetables and foodstuffs by ultrasonic-thermostatic-assisted cloud point extraction coupled to flame atomic absorption spectrometry. Talanta 2016, 155, 38–46. [Google Scholar] [CrossRef] [PubMed]
- Altunay, N.; Gürkan, R.; Orhan, U. A new ultrasonic-assisted cloud-point-extraction procedure for pre-concentration and determination of ultra-trace levels of copper in selected beverages and foods by flame atomic absorption spectrometry. Food Addit. Contam. Part A 2015, 32, 1475–1487. [Google Scholar] [CrossRef] [PubMed]
- Elik, A.; Altunay, N.; Gürkan, R. Determination of trace levels of nitrite in beverages samples through micellar improved catalytic kinetic spectrophotometry. Cumhur. Sci. J. 2017, 38, 400–411. [Google Scholar] [CrossRef]
- Mpountoukas, P.; Pantazaki, A.; Kostareli, E.; Sha, O.; Zhu, X.; Feng, Y.; Ma, W. Aqueous two-phase based on ionic liquid liquid–liquid microextraction for simultaneous determination of five synthetic food colourants in different food samples by high-performance liquid chromatography. Food Chem. 2015, 174, 380–386. [Google Scholar]
- Wang, M.; Sun, Y.; Yang, X.; Zhao, J. Sensitive determination of amaranth in drinks by highly dispersed cnt in graphene oxide “water” with the aid of small amounts of ionic liquid. Food Chem. 2015, 179, 318–324. [Google Scholar] [CrossRef] [PubMed]
- Gürkan, R.; Altunay, N. Quantification of 5-hydroxymethylfurfural in honey samples and acidic beverages using spectrophotometry coupled with ultrasonic-assisted cloud point extraction. J. Food Compos. Anal. 2015, 42, 141–151. [Google Scholar] [CrossRef]
- Cruz-Vera, M.; Lucena, R.; Cárdenas, S.; Valcárcel, M. Sample Treatments Based on Dispersive (Micro)Extraction. Anal. Methods 2011, 3, 1719–1728. [Google Scholar] [CrossRef]
- Mahdi, H.; Zohreh, T.; Sara, P.; Mohammad, T. Spectrofluorimetric determination of zearalenone using dispersive liquid–liquid microextraction coupled to micro-solid phase extraction onto magnetic nanoparticles. RSC Adv. 2014, 4, 45065–45073. [Google Scholar]


| Wave Number (cm) | IR Bond |
|---|---|
| 3398 | O-H |
| 1623 | O-Fe-O |
| 579 | Fe-O |
| Wave Number (cm) | IR Bond |
|---|---|
| 3399 | O-H stretching |
| 1539 | O-H bending |
| 1058 | Si-O-Si |
| 850 | CH-Si-O- |
| 2923 | CH- |
| 588–465 | Fe-O |
| 875 | Si-O-C |
Disclaimer/Publisher’s Note: The statements, opinions and data contained in all publications are solely those of the individual author(s) and contributor(s) and not of MDPI and/or the editor(s). MDPI and/or the editor(s) disclaim responsibility for any injury to people or property resulting from any ideas, methods, instructions or products referred to in the content. |
© 2024 by the authors. Licensee MDPI, Basel, Switzerland. This article is an open access article distributed under the terms and conditions of the Creative Commons Attribution (CC BY) license (https://creativecommons.org/licenses/by/4.0/).
Share and Cite
Hassan, R.A.; Tariq, Z. Spectrophotometric Determination of Amaranth Dye Using a Two-Step Green Cloud Point and Magnetic Solid-Phase Extraction Approach. Eng. Proc. 2023, 59, 244. https://doi.org/10.3390/engproc2023059244
Hassan RA, Tariq Z. Spectrophotometric Determination of Amaranth Dye Using a Two-Step Green Cloud Point and Magnetic Solid-Phase Extraction Approach. Engineering Proceedings. 2023; 59(1):244. https://doi.org/10.3390/engproc2023059244
Chicago/Turabian StyleHassan, Remah A., and Zianab Tariq. 2023. "Spectrophotometric Determination of Amaranth Dye Using a Two-Step Green Cloud Point and Magnetic Solid-Phase Extraction Approach" Engineering Proceedings 59, no. 1: 244. https://doi.org/10.3390/engproc2023059244
APA StyleHassan, R. A., & Tariq, Z. (2023). Spectrophotometric Determination of Amaranth Dye Using a Two-Step Green Cloud Point and Magnetic Solid-Phase Extraction Approach. Engineering Proceedings, 59(1), 244. https://doi.org/10.3390/engproc2023059244