Abstract
This paper aims to emphasize the necessity for policy reform, improvements in vehicle design and enhanced public awareness through the projection of future trends in road accidents, injuries and fatalities. The statistical methods that are used in this study are the empirical laws of Smeed and Andreassen. The main gap that the researchers identify is the lack of a standardized methodology with the help of which the appropriate forecasting method can be chosen in the area of traffic accidents. In the present study, the authors propose such a methodology that can be generalized, being suitable for use for any urban agglomeration at the micro and macro level.
1. Introduction
The issue of road safety has become a major global priority, as evidenced by numerous studies investigating mortality trends on both a global and national level. These studies, alongside statistics compiled by organizations like the World Health Organization, the Romanian Police and Eurostat, consistently highlight road accidents as a significant contributor to the loss of young lives.
According to the World Health Organization [1],
- Each year, road traffic accidents result in the deaths of approximately 1.19 million people;
- For individuals aged 5–29 years, road traffic injuries are the primary cause of death;
- Although low- and middle-income countries account for about 60% of the world’s vehicles, they experience 92% of the global road fatalities;
- Vulnerable road users, such as pedestrians, cyclists and motorcyclists, represent more than half of all road traffic deaths;
- The economic impact of road traffic crashes amounts to 3% of the gross domestic product in most countries;
- The United Nations General Assembly aims to reduce the global number of deaths and injuries from road traffic accidents by 50% by 2030 (A/RES/74/299).
Investigating the factors contributing to accidents, their causes and their impacts is crucial in identifying effective strategies to enhance traffic safety. The EU is confronted with a range of interlinked demographic, public health and environmental challenges. These include the shifting climate, the persistent stagnation in reducing road fatalities, escalating urbanization rates, deteriorating air quality, upward trends in obesity rates and the demographic shift towards an aging population.
This paper aims to emphasize the necessity for policy reform, improvements in vehicle design and enhanced public awareness through the projection of future trends in road accidents, injuries and fatalities.
The statistical methods that are used in this study are the empirical laws of Smeed and Andreassen [2].
The Smeed law establishes that as the traffic volume increases (reflected by an increase in motor vehicle registrations), there is an increase in fatalities per capita and a decrease in fatalities per vehicle (as motor vehicle ownership increases, the death rates per vehicle decrease). The corrected Smeed law addresses the overestimation in the original Smeed law by considering that an increase in the vehicle fleet typically leads to investments in vehicle safety and infrastructure improvements, which subsequently reduce road fatalities. Andreassen’s law links the population and the number of vehicles to the fatalities on the roads.
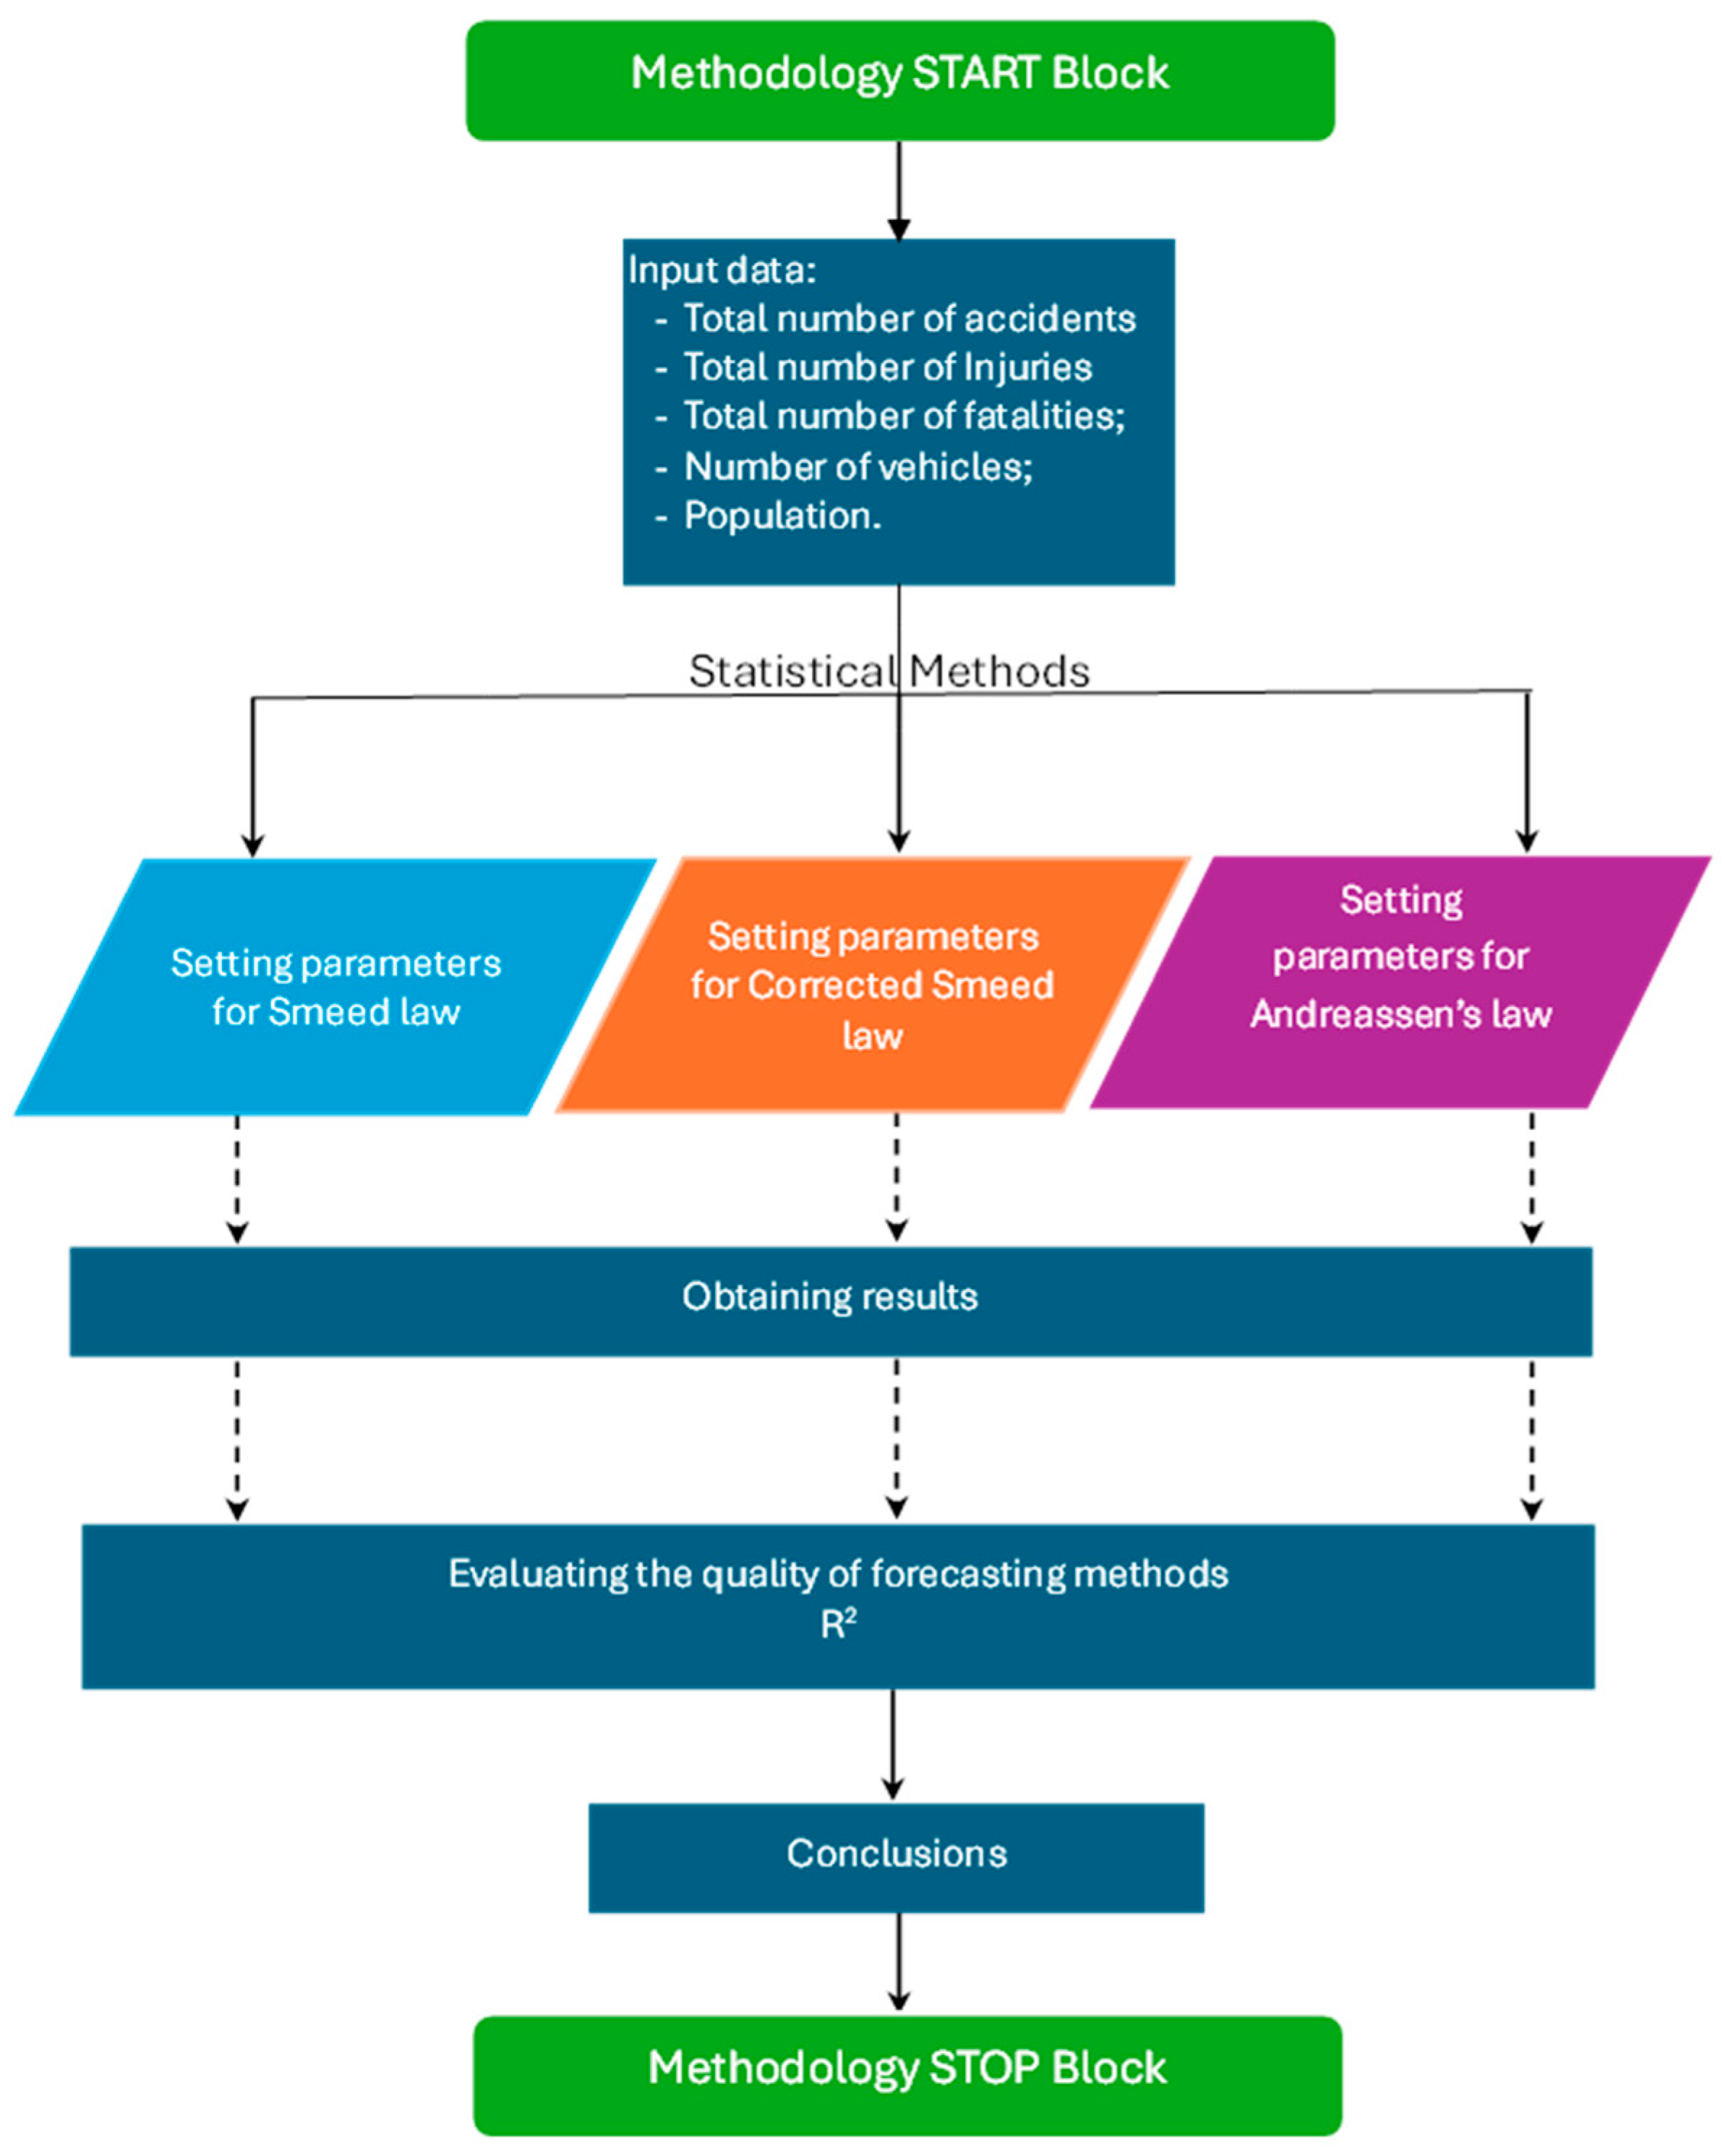
The functional diagram of the used methodology is presented in Figure 1.
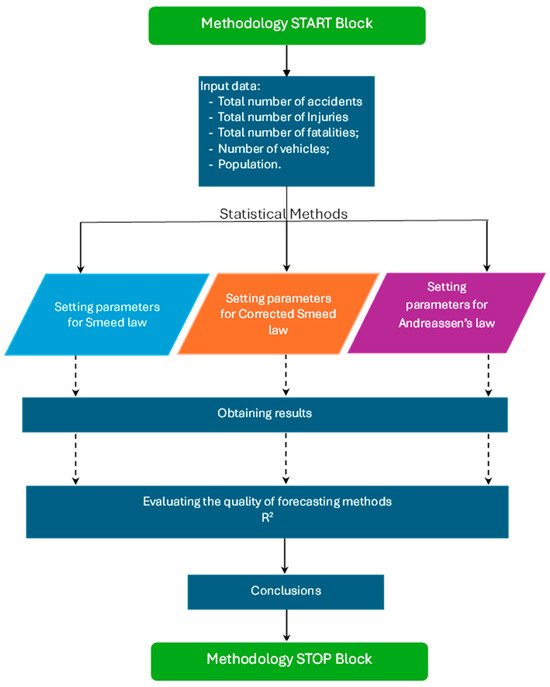
Figure 1.
The functional diagram of the used methodology.
The use of a prediction model depends on the specifics of the input data, the parameters of the system for which the forecast is generated and the external factors that influence them. The primary gap that researchers identify is the lack of a standardized methodology with the help of which the appropriate forecasting method can be chosen. The present authors propose such a methodology that can be generalized, being suitable for use for any urban agglomeration at the micro and macro level.
Romania holds the highest position in the European ranking concerning the frequency of road accidents per capita [3]. A case study carried out in Bucharest sheds light on the seriousness of its road safety problems. Finally, the results of the case study serve as a crucial catalyst for policymakers, urban planners and community stakeholders to collaborate in developing effective strategies to reduce the incidence of accidents and create safer streets.
2. Literature Background
Research into the forecasting of road accidents and fatalities is currently a dynamic field. While individual accidents are inherently unpredictable, the aggregate annual number of accidents tends to exhibit discernible trends that can be modeled. Additionally, road accidents can be considered in terms of factors such as road conditions, driver awareness and vehicle safety. The literature background seeks to identify suitable methodologies for the modeling of road accidents, along with the parameters relevant to these models.
A pioneering and enduring principle in road safety research for the forecasting of fatalities is Smeed’s law [4], which elucidates the functional correlation between the fatality rate and the rate of motorization. Numerous authors have studied the applicability of Smeed’s law [5,6,7,8,9,10,11,12]. In 1980, John Adams re-evaluated Smeed’s law and determined that the total vehicle distance traveled (in vehicle-kilometers) provided a better indication of risk exposure [5]. A recent study discovered that Smeed’s formula accurately depicts the alteration in fatalities up to a motorization rate of 0.2–0.3 vehicles per person. However, beyond this threshold, the formula appears to overestimate the fatality rate [6].
Persia et al. (2015) used Smeed’s law for Italy. They reached the conclusion that calibrating the Smeed model yielded excellent outcomes, given that the experimental curve closely aligned (in terms of parameters) with the theoretical formulation proposed by Smeed [7].
Andreassen suggested another equation for the prediction of fatalities [13]. Studies have confirmed a notable trend whereby the fatality rate per person is declining faster than Smeed’s law predicts. Moreover, there has been a decline in fatalities per vehicle observed in numerous countries, especially in developed nations, contradicting the forecasts of Smeed’s law.
Other studies regarding forecasting methods for road accidents include Gorzelanczyk et al. In their paper, they outline an approach to assessing the impact of various factors on road accidents in Poland. They use multi-criteria optimization methods [14]. Hossain and Faruque applied an additive time series model approach, incorporating trend estimation, seasonal variation and random variation through the use of the triple exponential smoothing method [15]. Imran and Nasir utilized a series of eleven curve fitting models, including linear, cubic, quadratic, inverse, logarithmic, exponential growth model, logistic curve and compound models, to forecast road traffic accidents in Pakistan [16].
Borsos [17] used the methodology for 26 countries. The conclusions of the study were the following:
- A country-level analysis indicated that the model could be effectively applied to most countries;
- Road safety is increasingly becoming a priority, occupying a prominent position on the agenda of both developed and developing nations.
3. Methodology
In this study, the statistical analysis relies on the empirical laws formulated by Smeed and Andreassen and on parametric methods.
3.1. The Smeed Law
Smeed’s law describes the functional connection between the annual number of deaths, the number of vehicles and the population [4].
where
D = annual deaths; N = number of vehicles; P = population.
If we log the equation, we will have
If , b a = β and , then
3.2. The Corrected Smeed Law
Koren and Borsos contemplated whether Smeed’s law remains applicable in the present context [5]. They modified Smeed’s formula by introducing a negative exponential term to accommodate the reduction in fatalities with the increase in the motorization rate. Their rationale was that, with an increase in the number of vehicles, there is often an associated improvement in infrastructure, which contributes to a reduction in road accident deaths. The corrected Smeed’s law according to them is
represents the increasing exposure as the vehicle numbers increase. When is relatively low, then is approximately 1, making the first part of the formula predominant.
describes a negative exponential function. It signifies that an increase in vehicle ownership tends to coincide with improvements in vehicle safety and the quality of road infrastructure, as well as improvements in education and law enforcement measures.
If we log the equation, we will have
We consider the following equation as the linear model:
where ; , and c = ln(a).
The parameters for both Smeed’s law and the corrected Smeed’s law model are estimated using linear regression.
3.3. The Andreassen Law
Andreassen revised Smeed’s law. He argued that the values of the parameters α and β provided by Smeed are inaccurate because they arise from an erroneous relationship between the variables N/P and D/P. Both variables include the population P in the denominator [18]. Andreassen suggested taking into account not only the number of deaths but also the number and severity of accidents, particularly when generating results for accident reduction purposes. Andreassen’s law [19] links the population and the number of vehicles to the fatalities as follows [2]:
where
D represents the number of deaths per year, N is the number of vehicles and P is the population.
If we log the equation, we will have
We consider the following linear model:
where
; , , and .
Linear regression is used to estimate the parameters of the model.
4. Case Study: Bucharest City
The case study conducted in Bucharest illuminates the gravity of road safety issues. To implement the forecasting methods outlined, the following data from Table 1 were used.

Table 1.
Number of accidents in Bucharest from 2010 to 2023.
The results for Smeed’s law, Andreassen’s law and the corrected Smeed’s law (Koren–Borsos) using linear regression are presented in Table 2, Table 3 and Table 4.
Table 2.
Smeed’s law with linear regression: (a) model fit measures; (b) model coefficients—ln(D).
Table 3.
Results for corrected Smeed’s law (Koren–Borsos) with linear regression: (a) model fit measures; (b) model coefficients—ln(D/P).
Table 4.
Results for Andreassen’s law with linear regression: (a) model fit measures; (b) model coefficients—ln(D).
The R2 coefficient is 0.388; therefore, 38.8% of the variance of is due to ’s variance. N·P2 is a significant predictor of the number of fatalities (P = 0.023).
The resulting Smeed’s law for Bucharest is
The R2 coefficient is 0.583; therefore, 58.3% of the variance of is predicted by the variance of . is a significant predictor of the number of fatalities (P = 0.002). The model is verified for the linear regression.
The resulting corrected Smeed’s law for Bucharest is
Because the R2 in the corrected Smeed’s law model is greater than the R2 in the Smeed’s law model, we can conclude that the first one is more appropriate to describe the evolution of fatalities relative to the population and vehicle number.
The corrected Smeed’s law can be characterized as a strong model for the prediction of the number of fatalities.
The R2 coefficient is 0.681, so 68.1% of the variance in fatalities is due to the predictors, namely the population and number of vehicles. Still, in the linear regression, ln(N) and ln(P) are weak predictors of ln(D).
The resulting Andreassen’s law for Bucharest is
5. Conclusions
The increased number of severe accidents in Bucharest could be due to the following.
- Romania has not made significant progress in utilizing technology in the field of road traffic or in modernizing the road infrastructure. This could contribute to maintaining an old vehicle fleet and poor traffic management in cities, including Bucharest.
- The vehicle fleet is old. Older vehicles may be less fuel-efficient and emit more pollutants, and the safety technologies may be less advanced. Additionally, these vehicles may require more maintenance and repairs, leading to a higher frequency of road incidents.
- The levels of road education among the population and adherence to traffic rules in Romania are not at the levels of other European countries. Poor road education can contribute to unsafe behaviors on roads and a higher frequency of road accidents.
The results from the case study are explicable as follows. Smeed’s law and the corrected Smeed’s law applied to Bucharest’s accident statistics are robust models. Given the high traffic density in Bucharest [24], the applicability of both Smeed’s law and the corrected Smeed’s law is verified. Smeed’s law states that the higher the traffic density, the lower the probability of road accidents. This is due to drivers becoming more attentive and cautious in heavy traffic conditions.
Author Contributions
Conceptualization, C.O. and E.R.; methodology, C.O. and F.R.; resources, I.P.; writing—original draft preparation, C.O.; writing—review and editing, A.I. and M.R.; project administration, C.O. All authors have read and agreed to the published version of the manuscript.
Funding
This work was supported by a grant from the National Program for Research of the National Association of Technical Universities—GNAC ARUT 2023.
Data Availability Statement
Additional data can be obtained from the authors.
Conflicts of Interest
The authors declare no conflicts of interest.
References
- Road Traffic Injuries. Available online: https://www.who.int/news-room/fact-sheets/detail/road-traffic-injuries (accessed on 28 January 2024).
- George, M. Development of a Forecasting Model of Indian Road Traffic Scenario to Predict Road User Share, Injuries and Fatalities. Master’s Thesis, Linköping University, Linköping, Switzerland, 2020. Available online: https://liu.diva-portal.org/smash/get/diva2:1437174/FULLTEXT01.pdf (accessed on 28 January 2024).
- Road Safety Statistics. 2022. Available online: https://transport.ec.europa.eu/background/road-safety-statistics-2022-more-detail_en (accessed on 28 January 2024).
- Smeed, R.J. Some Statistical Aspects of Road Safety Research. J. R. Stat. Soc. Ser. A 1949, 112, 1–34. [Google Scholar] [CrossRef]
- Adams, J.G.U. Smeed’s Law: Some Further Thoughts. 1987. Available online: http://john-adams.co.uk/wp-content/uploads/2006/smeed%27s%20law.pdf (accessed on 28 January 2024).
- Koren, C.; Borsos, A. Is Smeed’s law still valid? A world-wide analysis of the trends in fatality rates. J. Soc. Transp. Traffic Stud. 2010, 1, 64–76. [Google Scholar]
- Persia, L.; Gigli, R.; Usami, D.S. Smeed’s law and expected road fatality reduction: An assessment of the Italian case. J. Saf. Res. 2015, 55, 121–133. [Google Scholar] [CrossRef]
- Elvik, R. The non-linearity of risk and the promotion of environmentally sustainable transport. Accid. Anal. Prev. 2009, 41, 849–855. [Google Scholar] [CrossRef]
- Al-Reesi, H.; Ganguly, S.S.; Al-Adawi, S.; Laflamme, L.; Hasselberg, M.; Al-Maniri, A. Economic Growth, Motorization, and Road Traffic Injuries in the Sultanate of Oman, 1985–2009. Traffic Inj. Prev. 2013, 14, 322–328. [Google Scholar] [CrossRef] [PubMed]
- Huang, H.; Yin, Q.; Schwebel, D.C.; Li, L.; Hu, G. Examining Road Traffic Mortality Status in China: A Simulation Study. PLoS ONE 2016, 11, e0153251. [Google Scholar] [CrossRef] [PubMed]
- Kakizawa, Y. A dynamic model for Smeed’s equation. J. Transp. Econ. Policy 2002, 36, 265–284. [Google Scholar]
- Hakamies-Blomqvist, L.; Wiklund, M.; Henriksson, P. Predicting older drivers’ involvement—Smeed’s law revisited. Accid. Anal. Prev. 2005, 37, 675–680. [Google Scholar] [CrossRef]
- David, C.A. Linking deaths with vehicles and population. Traffic Eng. Control 1985, 26, 547–549. [Google Scholar]
- Gorzelanczyk, P.; Tylicki, H. Methodology for Optimizing Factors, Affecting Road Accidents in Poland. Forecasting 2023, 5, 336–350. [Google Scholar] [CrossRef]
- Hossain, S.; Faruque, O. Road Traffic Accident Scenario, Pattern and Forecasting in Bangladesh. J. Data Anal. Inf. Process. 2019, 7, 29–45. [Google Scholar] [CrossRef]
- Imran, M.; Nasir, J.A. Road traffic accidents; prediction in Pakistan. Prof. Med. J. 2015, 22, 705–709. [Google Scholar]
- Borsos, A. Long-Term Safety Trends Related to Vehicle Ownership in 26 Countries, Fulbright Grant 2010–2011. Available online: https://www.fulbright.hu/book6/borsosattila.pdf (accessed on 28 January 2024).
- Cabrera-Arnau, C.; Prieto Curiel, R.; Bishop, S.R. Uncovering the behaviour of road accidents in urban areas. R. Soc. Open Sci. 2020, 7, 191739. [Google Scholar] [CrossRef] [PubMed]
- Andreassen, D. Population and registered vehicles data vs. Road deaths. Accid. Anal. Prev. 1991, 23, 342–351. [Google Scholar] [CrossRef] [PubMed]
- Preda, I. (Romanian Police Institution, Bucharest, Romania); Accidents’ statistics for period 2011–2024. (Unpublished work).
- INSSE, Tempo-Online. Available online: http://statistici.insse.ro/shop/?page=catD&lang=ro&category_id=30 (accessed on 28 January 2024).
- Available online: https://dgpci.mai.gov.ro/news-and-media/statistica (accessed on 28 January 2024).
- Available online: https://data.gov.ro/dataset/parc-auto-romania (accessed on 28 January 2024).
- Costescu, D.; Roşca, M.; Burciu, S.; Ruscă, F. On accident prediction functions for urban road intersections. UPB Sci. Bull. Ser. D Mech. Eng. 2016, 78, 55–64. [Google Scholar]
Disclaimer/Publisher’s Note: The statements, opinions and data contained in all publications are solely those of the individual author(s) and contributor(s) and not of MDPI and/or the editor(s). MDPI and/or the editor(s) disclaim responsibility for any injury to people or property resulting from any ideas, methods, instructions or products referred to in the content. |
© 2024 by the authors. Licensee MDPI, Basel, Switzerland. This article is an open access article distributed under the terms and conditions of the Creative Commons Attribution (CC BY) license (https://creativecommons.org/licenses/by/4.0/).