Abstract
This article presents the preliminary results of my daily birth time series studies in eight Canadian provinces for 2011–2019. An extensive review of the available literature shows that researchers usually analyse the monthly birth time series, perhaps because of the unavailability of daily birth data. Statistics Canada started releasing daily birth data records for Canadian provinces and territories in 2011. Using the Fourier analysis of daily birth time series, I revealed new cycles on birth time series that, to my knowledge, were not observed in previous works. This research was conducted at the Regina and Saskatoon Research Data Centres (RDC) of Statistics Canada. It was supported by the University of Regina, the First Nations University of Canada and Statistics Canada.
1. Introduction
Human birth seasonality was observed in the 17th century in France [1,2]. Although the seasonality of birth has remained an object of intensive study by various disciplines for centuries, a consensus about the determinants of seasonality has not been achieved by researchers. Some authors insist on the dominance of social demographic characteristics (e.g., [3]), while others give greater importance to biological [4,5] and environmental factors [6,7].
A fairly consistent finding in the literature is the early spring peak in the incidence of births across many national settings [6,7,8]. According to Lam, D. and Miron, J., an important underlying cause involves the role of summer holidays, which are more conducive for couples to conceive a child [8]. A reasonable supposition is that summer holidays may afford couples intent on having a baby a more relaxed context [9].
Another common observation is the September birth peak [6,8,10]. In his early studies of the American context, Seiver, D.A. found a significant trough in the country’s births in April and May [6,7]. He also noted a peak in births centred on September in every section of the country. Over time, there was also a reduction in the magnitude of the April–May trough in those regions exhibiting one (i.e., the southern states) attributed to the introduction of air conditioning, thereby reducing the negative effects of high summer temperatures on conception probabilities. It was also noted that there was almost no reduction over time in the September peak nationwide and in most geographic divisions. This phenomenon is thought to reflect the influence of the Christmas/New Year holidays on conception probabilities. It has been surmised that during this time of the year, the social context is conducive to an increased number of unplanned pregnancies, though they are not necessarily unwanted [2,8,9,10].
2. Methodology
In all the works mentioned above, the authors refer to the monthly birth time series. Since the Fourier analysis is considered one of the most suitable for time series studies [11], researchers mainly apply this method to the birth time series to determine the frequencies of birth oscillations [12]. The authors also analyzed monthly birth time series in Canada and the United States of America from 1991 to 2000. For both countries, the power spectrum obtained using the Fast Fourier Transform (FFT) had a strong peak at a frequency of 1 year−1, reflecting the primarily annual pattern. Thesecondary peak at a frequency of 2 years−1 reflects the rise in births in September in Canada and May in the USA.
Statistics Canada has made available data containing the records of daily births in Canadian provinces and territories since 2011. Using Excel software, I counted the daily births from 2011 to 2019 and analysed the daily birth data for the provinces of Nova Scotia, New Brunswick, Quebec, Ontario, Manitoba, Saskatchewan, Alberta and British Columbia. Then, I calculated monthly births for these provinces, adding up the total of daily births.
3. Results
The frequency spectrums of all sixteen (eight monthly and eight daily) time series were computed using Fast Fourier Transform (FFT) on Excel, R and Logger Pro programs. The obtained spectrums did not depend on the choice of programs, which, in my opinion, confirms the results’ reliability.
However, the frequency spectrums slightly differed for provinces with relatively lower (less than 4 million) and higher (greater than 4 million) populations. The first group of provinces includes Nova Scotia, New Brunswick, Manitoba and Saskatchewan. Quebec, Ontario, Alberta and British Columbia belong to the second group. Figure 1 shows the frequency spectrum for monthly births in Nova Scotia and Ontario.
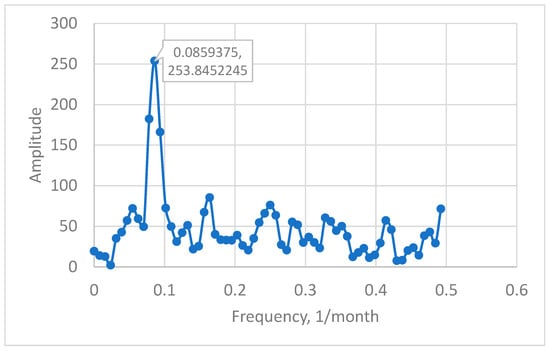
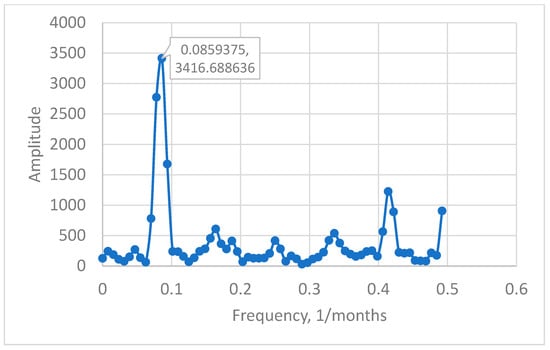
Figure 1.
FFT of monthly birth time series for Nova Scotia (above) and Ontario (below), 2011–2019.
The frequency of the primary peak is the same for all spectrums of provinces and approximately equals 0.086 month−1, corresponding to a cycle of 12 months or 1 year. This result is in good agreement with the cycle evaluated for 1991–2000 in Canada and the United States [12]. Both spectrums (Nova Scotia and Ontario) contain some higher frequencies. However, the relative amplitudes of corresponding frequencies are different.
More differences were observed in frequency spectrums of daily birth time series of provinces with lower and higher populations. The spectrums of provinces with lower populations contain three peaks, whereas the spectrums of provinces with higher populations clearly indicate four peaks. Figure 2 presents the typical spectrums for lower (in the example of Nova Scotia) and higher (in the example of Ontario) populated provinces.
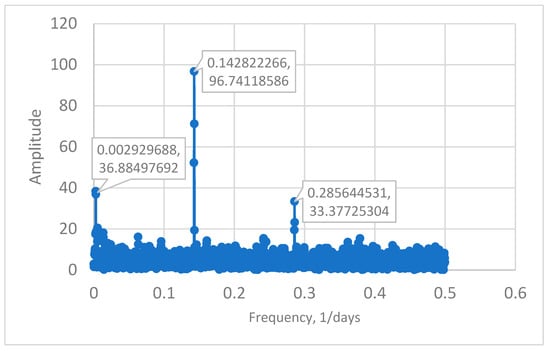
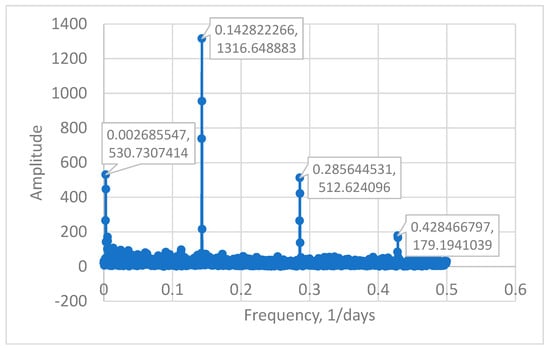
Figure 2.
FFT of daily birth time series for Nova Scotia and (above) Ontario (below), 2011–2019.
The frequencies of all primary peaks of spectrums of the daily birth time series of all provinces were approximately equal to 0.14 day−1, corresponding to the cycle of 7 days or 1 week. The frequencies of two other peaks, which existed in all spectrums, were 0.0027 day−1 and 0.2856 day−1, which approximately correspond to cycles of 370 days and 4 days, respectively. Within the accuracy of our calculations, it was not possible to determine which of these peaks were secondary and which one was tertiary.
The quaternary peak was observed only in spectrums of daily birth time series of provinces with higher populations (Quebec, Ontario, Alberta and British Columbia). Its frequency is approximately equal to 0.4285 day−1 or the cycle of 2 days.
4. Conclusions and Future Goals
To my knowledge, this is the first attempt to study the frequency spectrums of daily birth time series, which became possible due to the release of daily birth records by Statistics Canada. The availability of daily birth data allowed me to show that the weekly cycles are primary in the birth time series. In contrast, the annual cycles, which have always been considered primary, might be secondary or even tertiary. I did not intend to provide a detailed analysis of newly observed cycles in this article, which is my future study objective. I also plan to study the birth time series obtained for various ethnic groups to test if ethnicity affects their frequency spectrums. Considering the novelty of my findings, I decided to publish the preliminary results with the plan of submission of a research paper with more details in the near future.
Funding
This research was supported by the University of Regina President’s Research Seed Grant and The Social Sciences and Humanities Research Council of Canada Explore Grant.
Informed Consent Statement
Not Applicable.
Data Availability Statement
The data were obtained from the Statistics Canada database. The raw data cannot be released from the Research Data Centers of the Canadian Research Data Centre Network, and public access to the row data is restricted.
Acknowledgments
I would like to take this opportunity to express my sincere gratitude to Jennifer McConnell-Nzunga, who was formerly an Analyst in the Data Access Division of Statistics Canada, for her invaluable support during my work at the Regina Research Data Centre. Additionally, I would like to extend my appreciation to my graduate students for their assistance in organizing the data that I obtained from Statistics Canada.
Conflicts of Interest
The author declares no conflict of interest.
References
- Quetelet, A. A Treatise on Man and the Development of His Faculties; W. and R. Chambers: Edinburgh, UK, 1842; 126p. [Google Scholar]
- Régnier-Loilier, A.; Rohrbasser, J.-M. Is there a childbearing season? Popul. Soc. 2011, 474, 1–4. [Google Scholar]
- Bobak, M.; Gjonca, A. The seasonality of live birth is strongly influenced by sociodemographic factors. Hum. Reprod. 2001, 16, 1512–1517. [Google Scholar] [CrossRef] [PubMed]
- Brewis, A.; Laycock, J.; Huntsman, J. Birth non-seasonality on the Pacific Equator. Curr. Anthropol. 1996, 37, 842–851. [Google Scholar] [CrossRef]
- Pascual, J.; Garcia-Moro, C.; Hernandez, M. Non-seasonality of births in Tierra del Fuego (Chile). Annu. Hum. Biol. 2000, 27, 517–524. [Google Scholar]
- Seiver, D.A. Trend and variation in the seasonality of U.S. fertility, 1947–1976. Demography 1985, 22, 89–100. [Google Scholar] [CrossRef] [PubMed]
- Seiver, D.A. Seasonality of fertility: New evidence. Popul. Environ. 1989, 10, 245–257. [Google Scholar] [CrossRef]
- Lam, D.; Miron, J. Temperature and the seasonality of birth. In Temperature and the Environmental Effects on the Testis; Plenum Press: New York, NY, USA, 1991; pp. 73–88. [Google Scholar]
- Cesario, S.K. The “Christmas Effect” and Other Biometeorologic Influences on Childbearing and the Health of Women. J. Obstet. Gynecol. Neonatal Nurs. 2002, 31, 526–535. [Google Scholar] [CrossRef] [PubMed]
- Trovato, F.; Odynak, D. The seasonality of births in Canada and the Provinces, 1881–1989: Theory and analysis. Can. Stud. Popul. 1993, 20, 1–41. [Google Scholar] [CrossRef]
- Cryer, J.D.; Chan, K.-S. Time Series Analysis with Applications in R, 2nd ed.; Springer Texts in Statistics; Springer: Berlin/Heidelberg, Germany, 2008; 491p. [Google Scholar]
- He, D.; Earn, D.J.D. Epidemiological effects of seasonal oscillations in birth rates. Theor. Popul. Biol. 2007, 72, 274–291. [Google Scholar] [CrossRef] [PubMed]


Disclaimer/Publisher’s Note: The statements, opinions and data contained in all publications are solely those of the individual author(s) and contributor(s) and not of MDPI and/or the editor(s). MDPI and/or the editor(s) disclaim responsibility for any injury to people or property resulting from any ideas, methods, instructions or products referred to in the content. |
© 2024 by the author. Licensee MDPI, Basel, Switzerland. This article is an open access article distributed under the terms and conditions of the Creative Commons Attribution (CC BY) license (https://creativecommons.org/licenses/by/4.0/).