Proceeding Paper

Evaluation of Economic Interventions in Economic Blocks during an Economic and Sanitary Crisis †

by
Carmin Montante
* and
Clemente Hernandez-Rodriguez
Department of Economics, CUCEA (Economics and Administrative Science University Center), Mexico Universidad de Guadalajara, Zapopan 45100, Mexico
*
Author to whom correspondence should be addressed.
Presented at the 10th International Conference on Time Series and Forecasting, Gran Canaria, Spain, 15–17 July 2024.
Eng. Proc. 2024, 68(1), 55; https://doi.org/10.3390/engproc2024068055
Published: 19 July 2024
(This article belongs to the Proceedings of The 10th International Conference on Time Series and Forecasting)

Abstract

:
The purpose of this study is to evaluate the economic interventions that took place during the initial stages of the pandemic in 2020 in the US, Mexico, and Canada. These countries share a free trade agreement that indicates their willingness to cooperate in economic terms with each other and that they should adopt similar economic policies due to both their shared agreements and proximity. However, the economic interventions adopted by two of the three countries were not considered by the other, which makes for an interesting comparison. Interrupted time series analysis is a quasi-quantitative method that has recently been used in evaluating policy during a specific time. This study is interested in focusing on the economic interventions that were put into practice in neighboring countries that have formed a free trade alliance named USMCA. The method of a systematic analysis of interrupted time series will be used as a basis for organizing the article to provide further validity to the study.

1. Introduction

The economic interventions that were implemented under the effects of the COVID-19 pandemic aimed at adequately adjusting fiscal and monetary policy in Canada, the US, and Mexico, which varied more than would have been expected. In the case of Canada and the US, major stimulus packages were introduced and developed, whereas in Mexico, no major package was rolled over during 2020 [1]. Canada and the US began introducing these economic interventions as early as March of 2020, once COVID-19 began to significantly affect families, individuals, and small businesses.
The proximity of countries is thought to have a spill-over effect that can probably be observed in their ways of tackling certain common issues with similar policies. In the case of Mexico and the US, their shared history is more evident in how they have collaborated [2,3]. Additionally, Canada has had a historical connection with both countries, but from a more reserved perspective. However, recently, with the rise of neoliberalism in the early 1990s, the introduction of NAFTA, and the eventual evolution into USMCA, all three countries have become economically interdependent in certain areas of economic demand such as agriculture, technology, and the automotive industry, amongst others [4]. Such interdependence might be reflected in their GDP. These spillovers are part of the ability or inability of a neighboring country to imitate and improve certain aspects of another country. Economic crisis and volatility have required new models to be formulated that will help analyze and understand the surrounding market. Innovation, economic demand, government intervention, and the role of credit have been considered in recent models of fiscal and monetary policies.
In the US, there were a total of 3,390,029 deaths, with an annual numeric change of 535,191 and an annual percent change of 18.75%, which is the highest in the past 100 years [5]. Of these deaths, 336,802 are confirmed and are probably due to COVID-19 [6]. The US response included mandatory unemployment insurance, and the Coronavirus Aid, Relief, and Economic Security (CARE) Act of 2020, which added to discretionary spending [7,8]. The Federal Reserve allowed for limited lending and extended credits to banks for small businesses; provided short-term funding to state and local governments; and supplied credit to larger enterprises [9]. This extreme credit policy has been fraught with a lot of controversies but also with much acceptance, with some saying it is not enough [10,11]. These responses have been blamed for a large-scale increase in bank reserves, hence causing unwanted inflation today [12].
In Canada, the confirmed deaths of COVID-19 were 590,249 for the year 2020 [13]. Unlike the US, Canada has universal benefits and services, which include unemployment protection. The Canada Emergency Wage Subsidy covered up to 75% of an employee’s salaries [14]. Along with this subsidy, the Canada Emergency Response Benefit (CERB) is provided for unemployed individuals including seasonal and part-time workers [15,16]. Additionally, support was provided for SMEs and corporations such as credit and liquidity support that increased the deficit to CAD 325.5 billion or 14.8% of GDP, with the federal government accounting for CAD 274.4 billion and the consolidated provincial and territorial governments (PTLGs) accounting for a deficit of CAD 51.2 billion [17]. Canada’s response was bolder and faster than that of the US, mostly due to the existing infrastructure that allowed for this and due to a unified view of the pandemic by the Canadian government [18].
In Mexico, the federal government deferred the responsibility for the health system and decision-making to local governments [1]. The confirmed COVID-19 deaths were 1.43 million in total for 2020 [19]. Some help for small businesses was introduced in September of 2020 in terms of loan restructuring options and access to loans, and little to no help was provided to the overall population [17]. The economic expenditure in 2020 for a government avoiding spending at all cost amounted to no more than 0.4% of GDP to support health care and 0.2% of GDP to protect household firms, with loans being offered to formal workers and laid-off employees, which added up to 1.2% of the GDP [20].

2. Literature Review

The purpose of this study is to evaluate the economic interventions that took place during the initial stages of the pandemic in 2020 in the US, Mexico, and Canada. These countries share a free trade agreement that indicates their willingness to cooperate in economic terms with each other and that they should adopt similar economic policies due to both their shared agreements and proximity [21]. However, the economic interventions adopted by two of the three countries were not taken into account by the other, which makes for an interesting comparison.
Interrupted time series analysis is a quasi-quantitative method that has recently been used in evaluating policy during a specific time. This provides an insight into its effects and its intended consequences [22,23]. In addition, it has been used in measuring the impacts of initiatives that would be the case of economic stimulus that changed the fiscal budget and monetary policies during the 2020 economic chaos [24]. In the case of the year 2020, certain events triggered reaction periods from various countries in regard to their economic infrastructure, which was affected by the COVID-19 pandemic due to the implementation of restrictions that were put in place to prevent its further spread using various approaches. These policies initially included non-pharmaceutical and economic interventions [18]. This study is interested in focusing on the economic interventions that were put into practice in neighboring countries that have formed a free trade alliance named USMCA. A systematic analysis of interrupted time series will be used as the basis for organizing this article to provide further validity to the study [25].

3. Data and Indicators

Indicators of the economic state for each country and the GDP were taken from International Monetary Fund (IMF) data and were retrieved from FRED from the quarterly GDP data for 2018 up to 2021. There was a total of 192 observations that included the GDP, quarter for time, intervention level, and the intervention’s trend, making it 64 observations per country. Table 1 shows the GDP general statistics and variance levels per each country’s currency.

4. Methodology

Interrupted time series analysis is a quasi-quantitative method that provides an insight into the impacts of an intervention that is presented within a limited period [22,23]. As mentioned before, it is a means of measuring the effects based on a Bayesian space and time model in which the prior timing of the intervention and post-intervention data are considered in the analysis [26].
In the case of the US, the time of the intervention was in the first quarter of 2020, which was also the case for Canada, whereas for Mexico, such an economic intervention was introduced in the third quarter of 2020. First, we take into account the structural linear regression model for each country considering their observational data and the local linear trend µ over time plus the statistical error.
yt = βt, 1GDPtUS,1 + βt, 2GDPtUS,2 + μt + εt
yt = βt, 1GDPtMX,1 + βt, 2GDPtMX,2 + μt + εt
yt = βt, 1GDPtCA,1 + βt, 2GDPtCA,2 + μt + εt
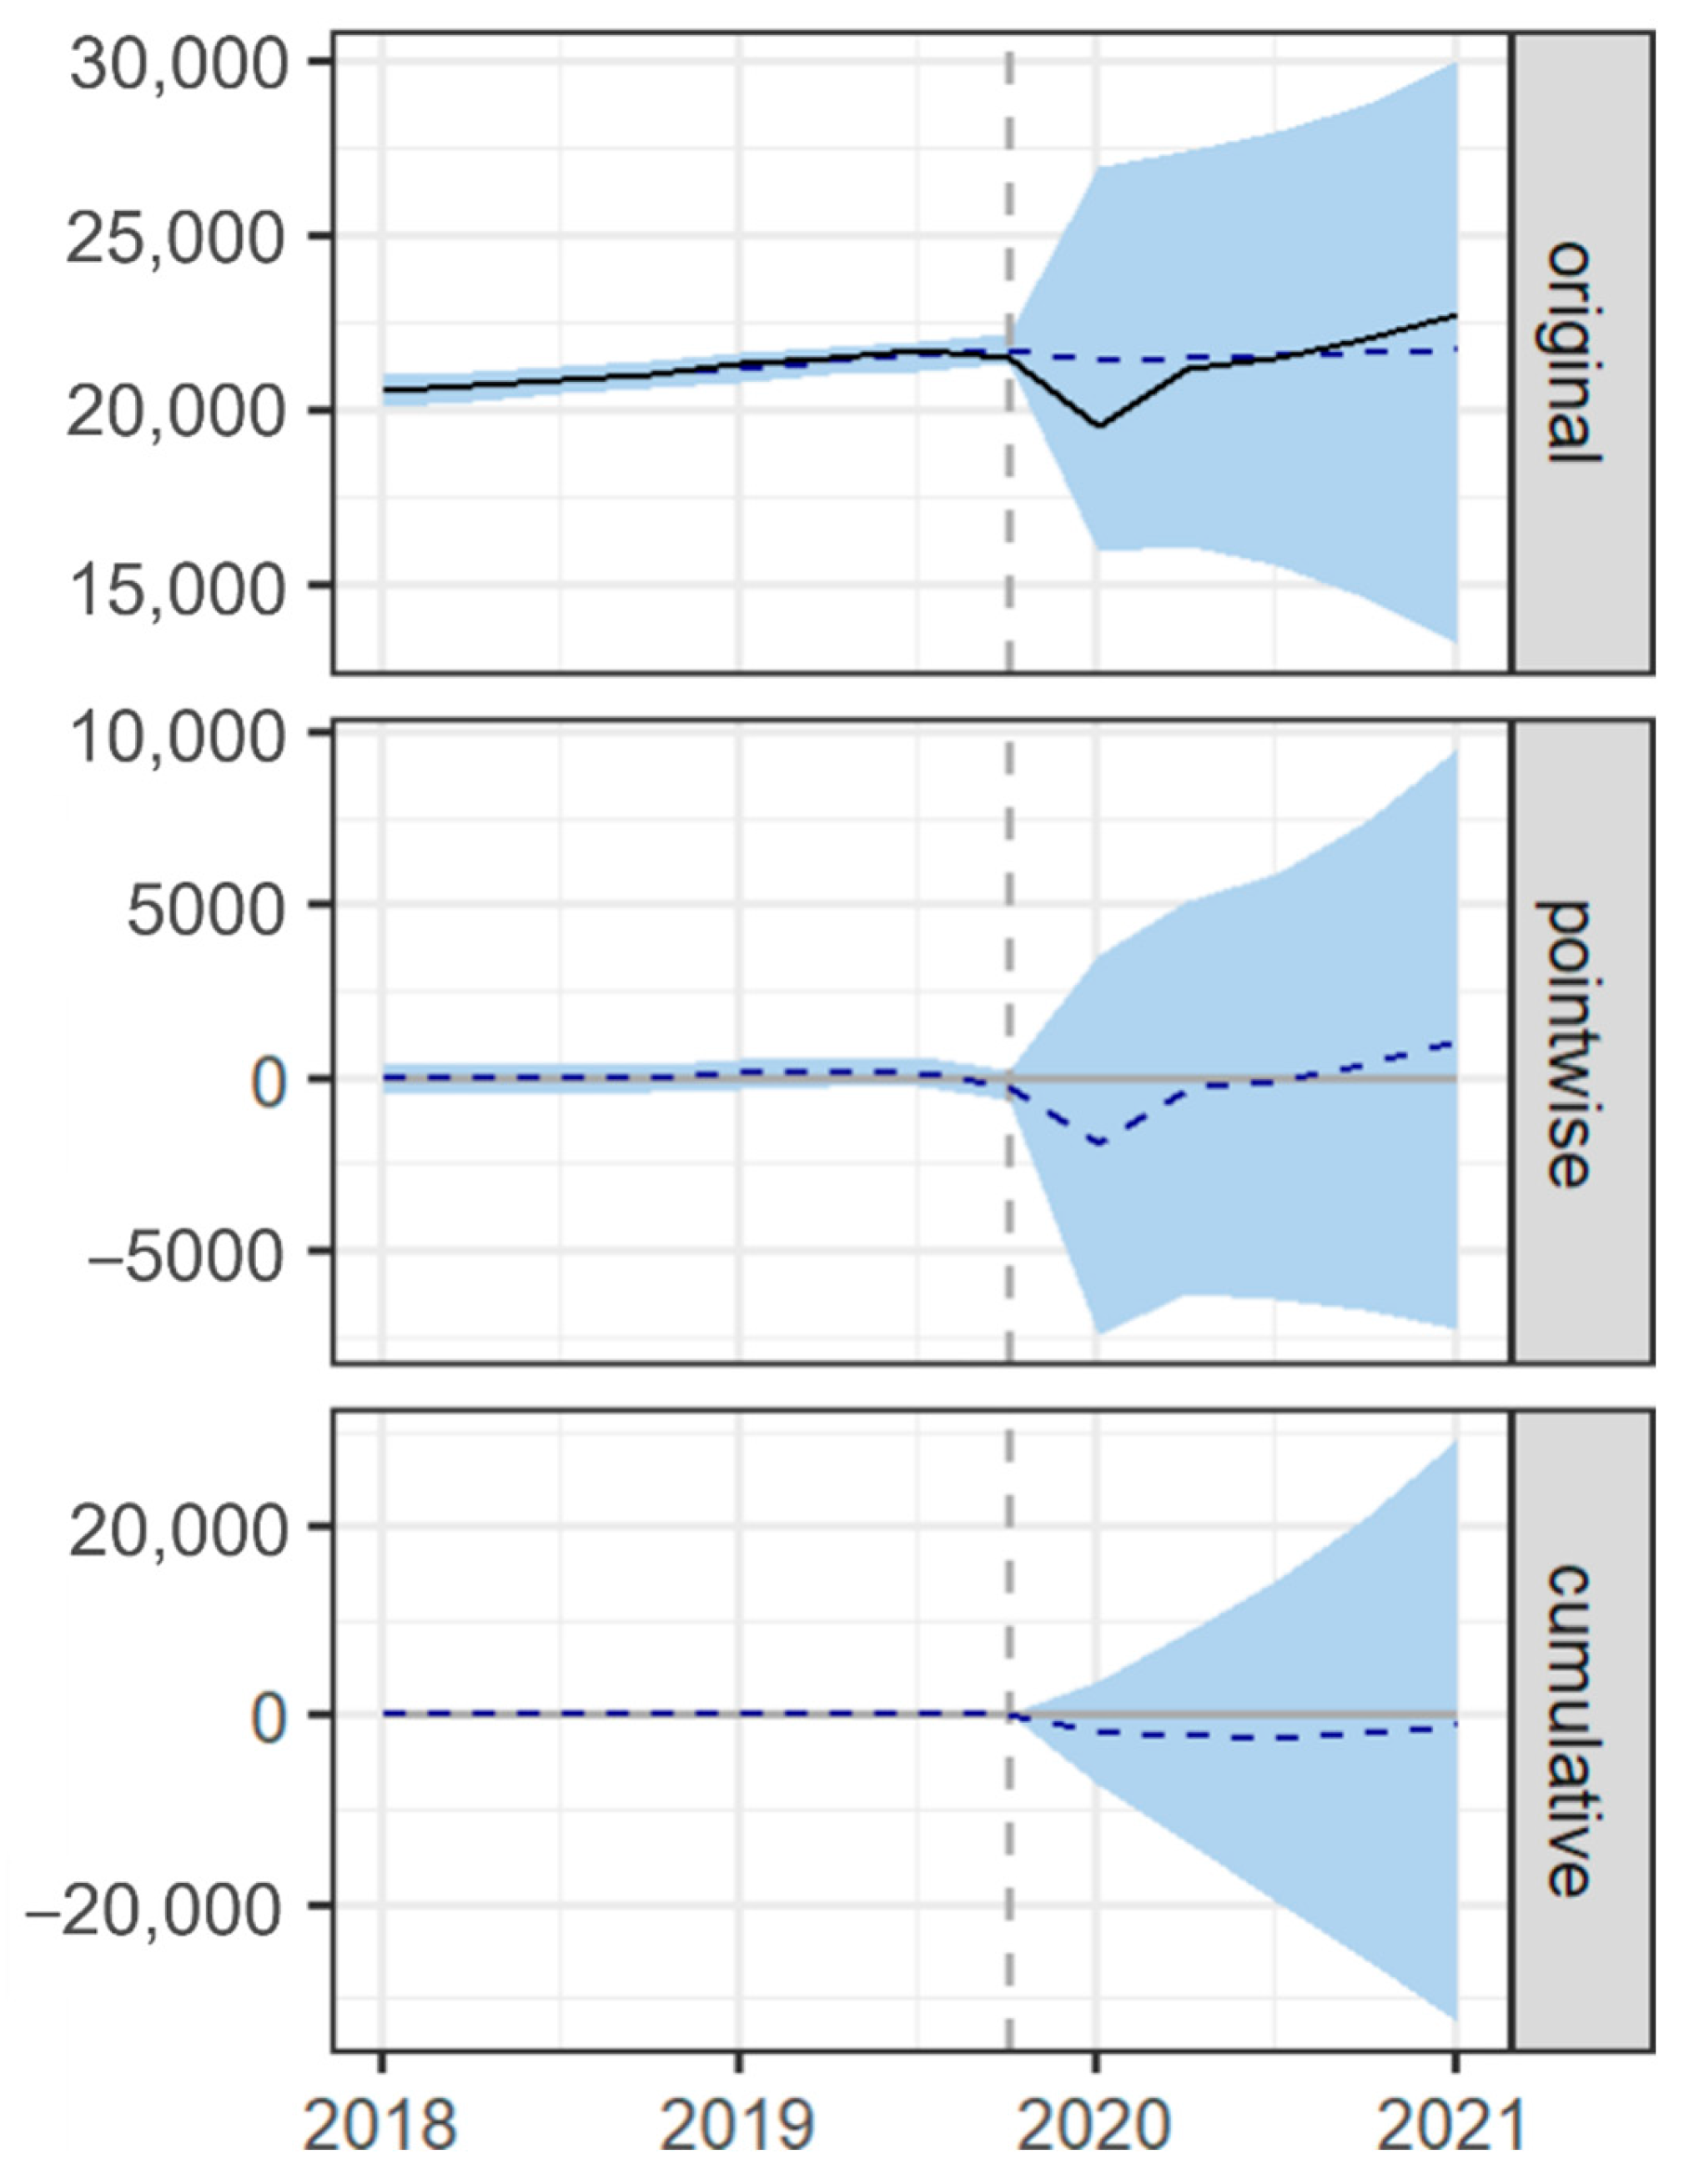
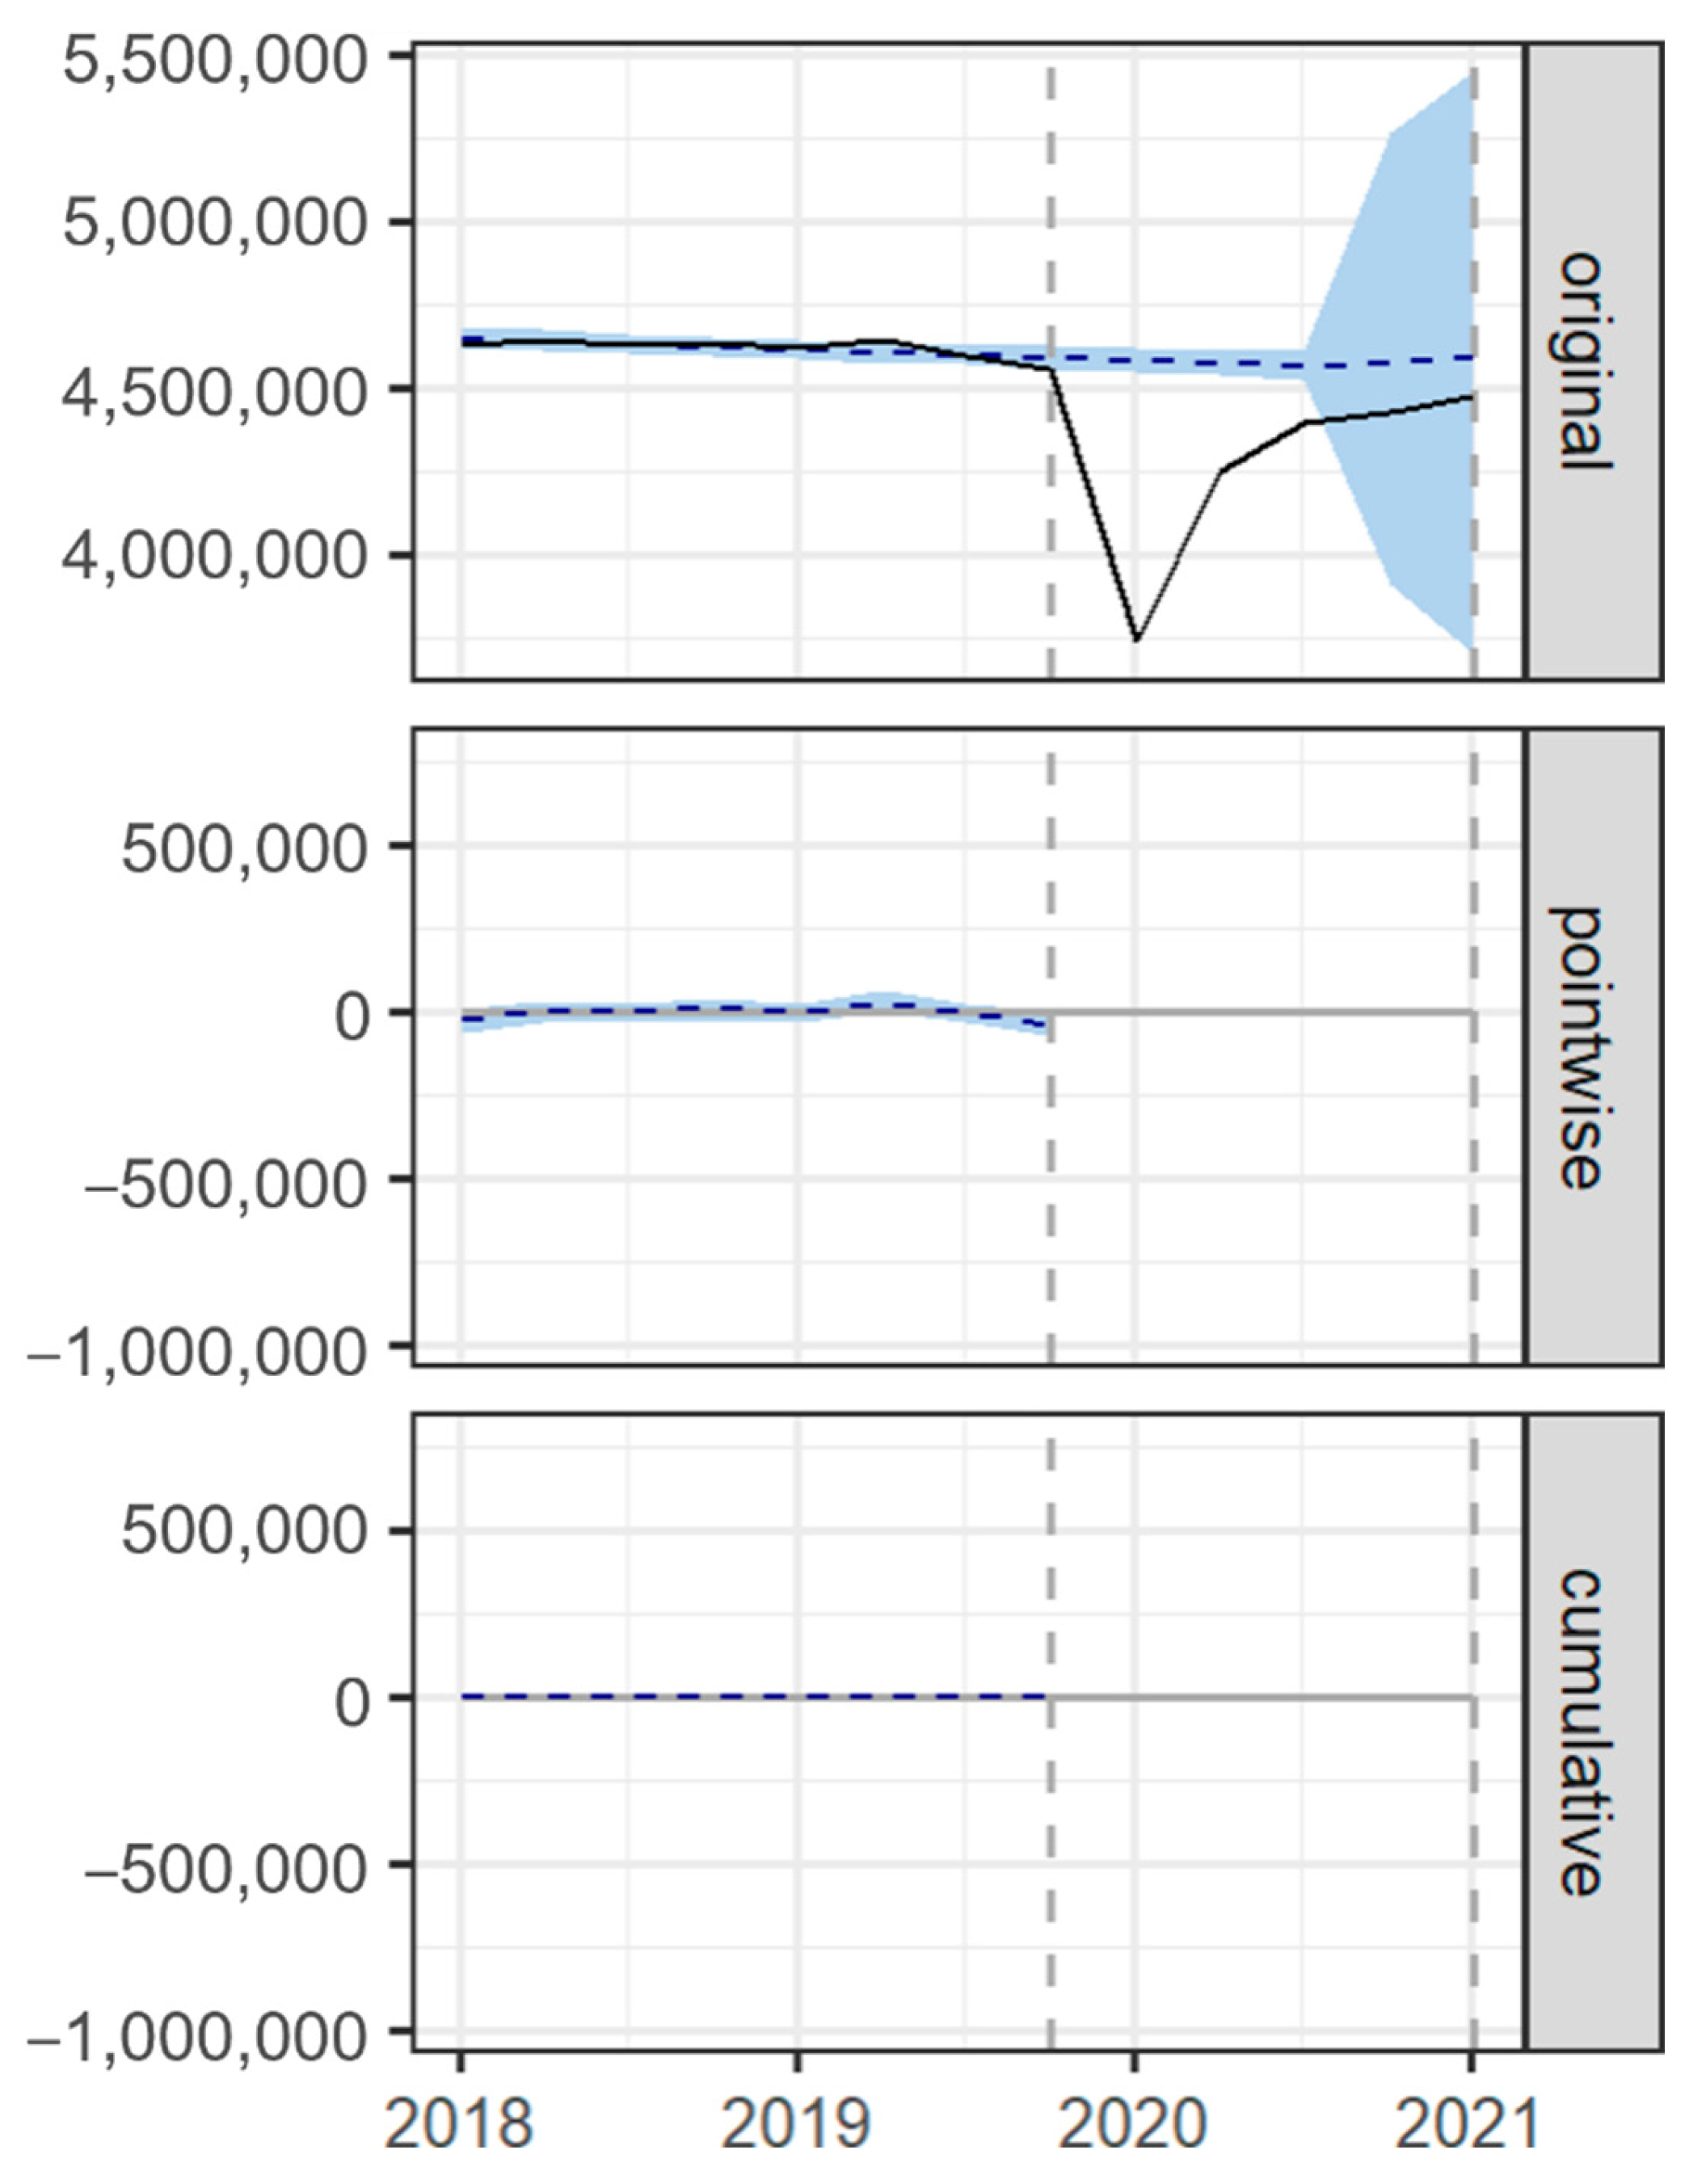
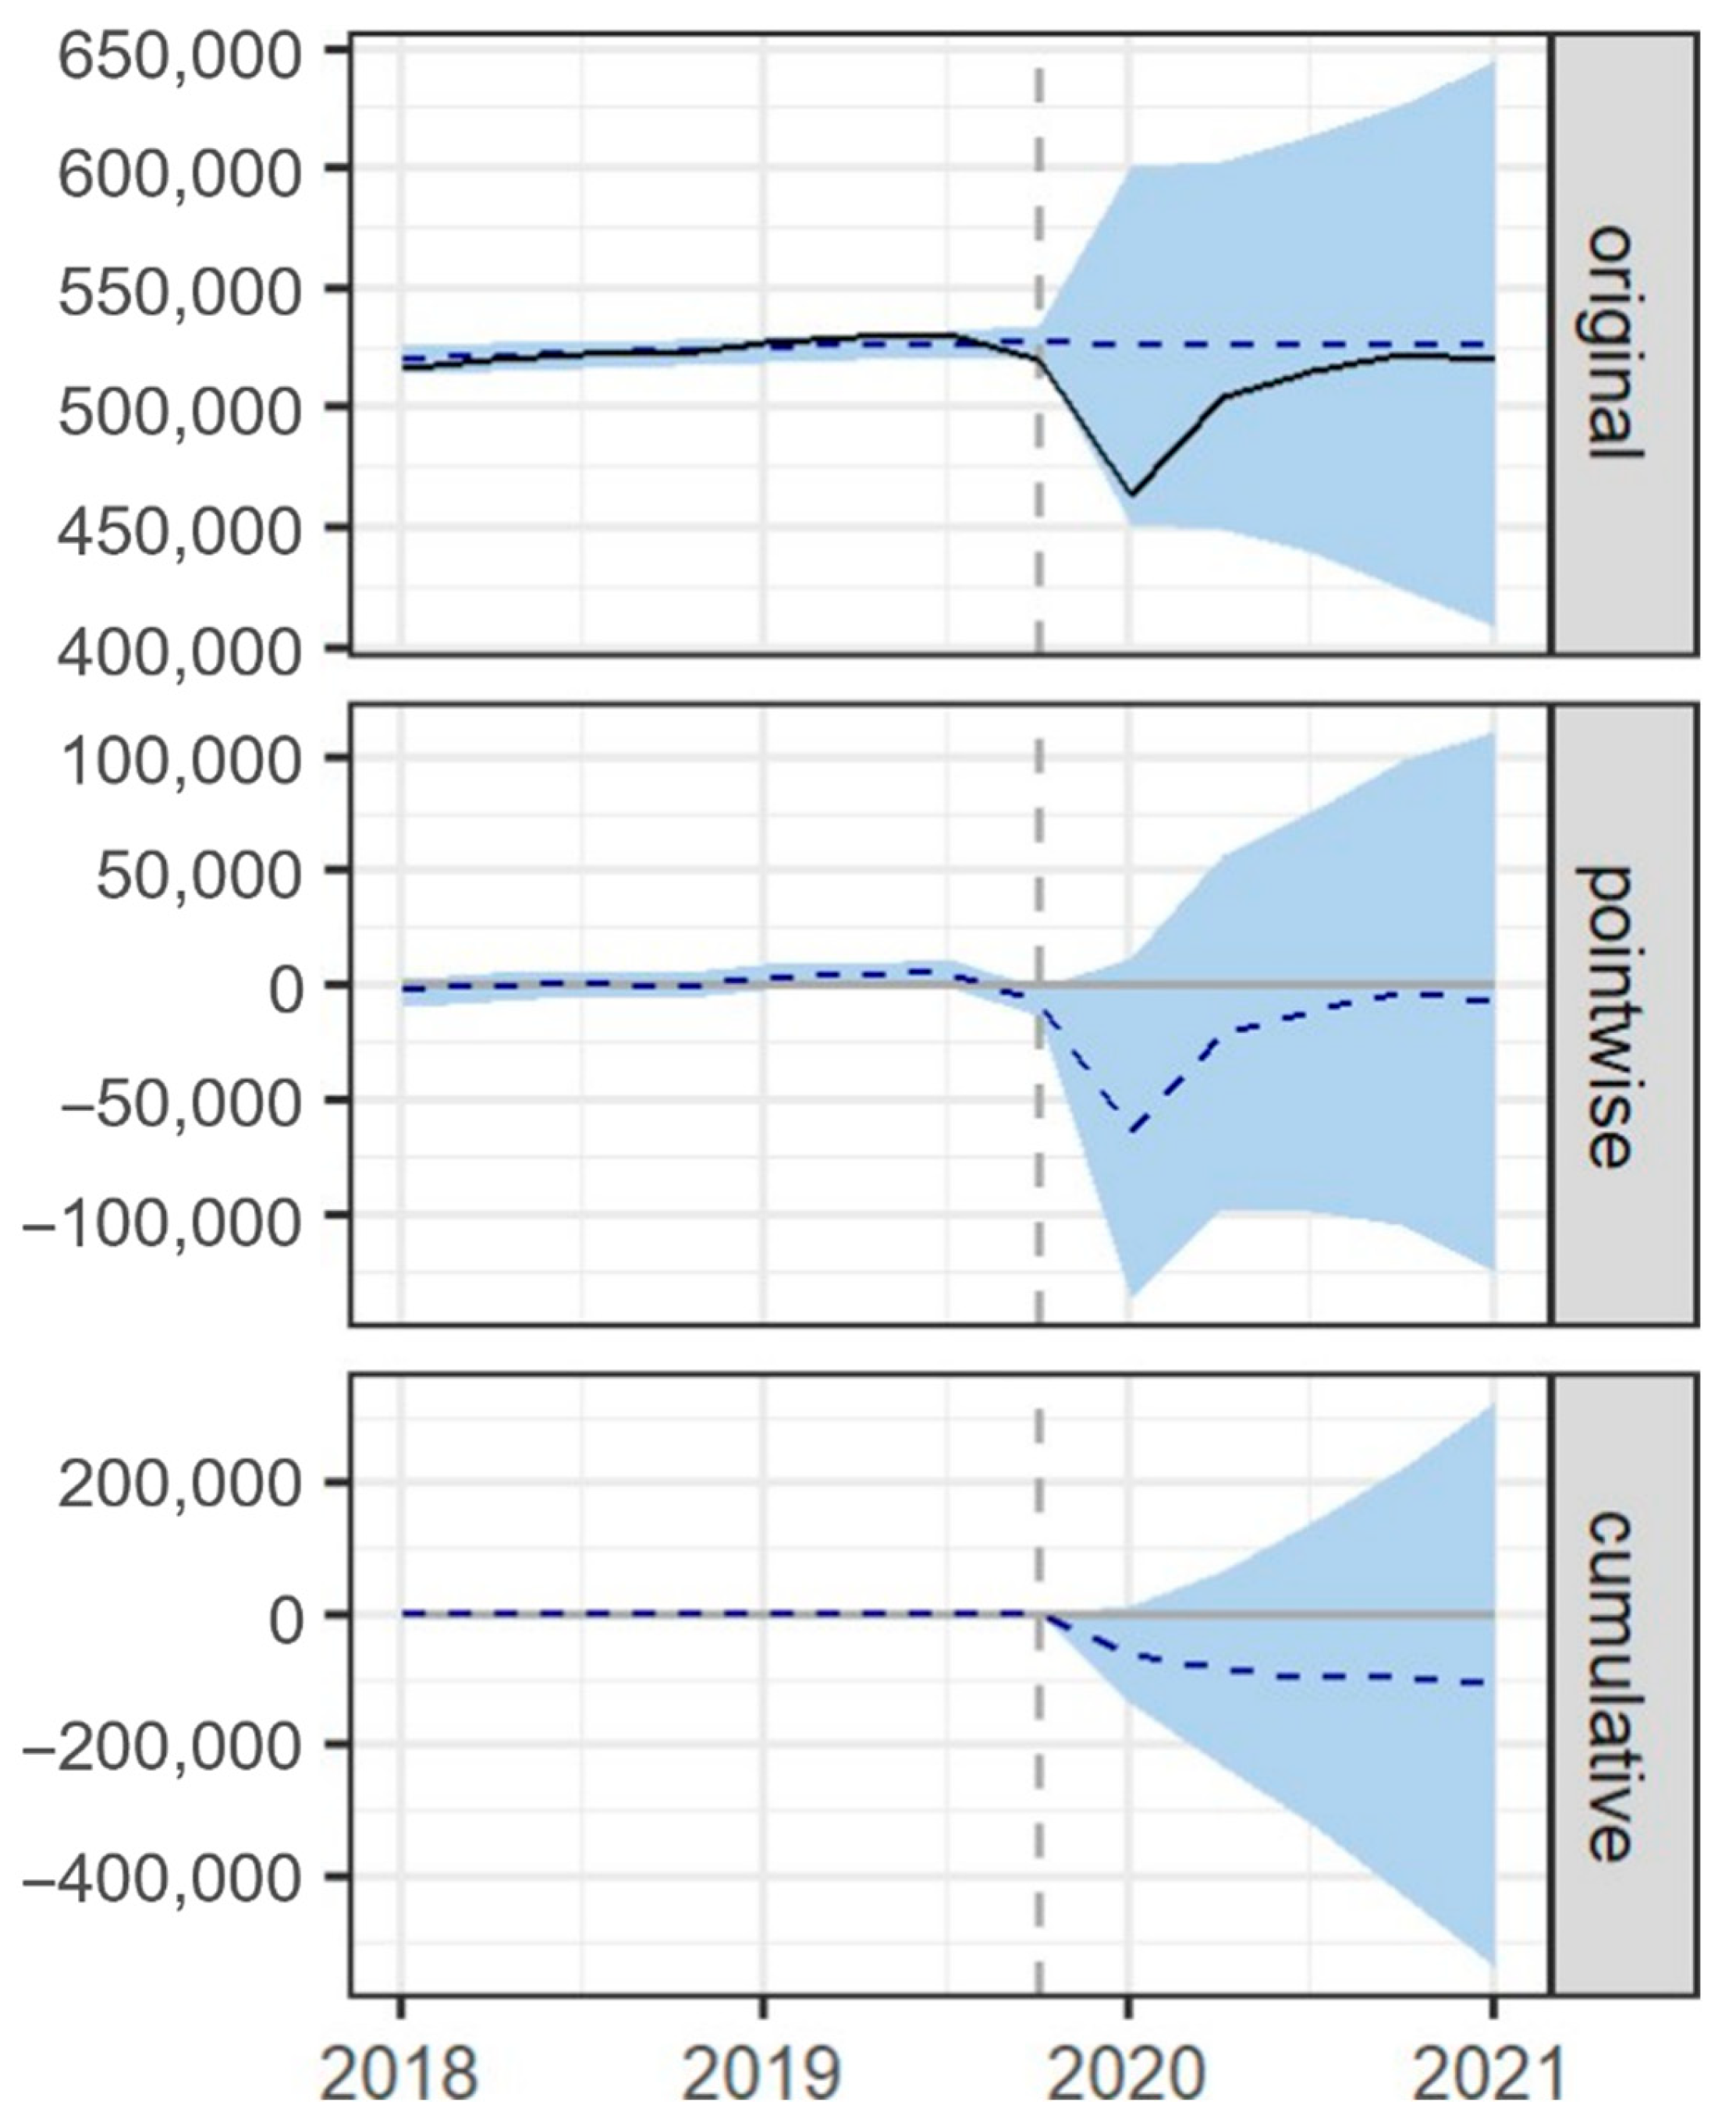
For structural times series models, the functions between a state and observation and the previous state and observation are subject to Gaussian noise, which can be seen as follows:
y t = Z U S G D P t T α t 1 + ϵ t , ϵ N 0 , H t y t = Z M X G D P t T α t 1 + ϵ t , ϵ N 0 , H t y t = Z C A G D P t T α t 1 + ϵ t , ϵ ~ N 0 , H t
The following is the transition equation that links an internal state to each previous internal state, which allows for the incorporation of seasonality.
αt+1 = Ttαt + Rt, ηt, ηt~N(0,Qt)
We need to consider the local linear trend, which can be defined with the value of the trend at a set time:
µt+1 = µt + δt−1 + ηµ,t
This is followed by the slope at time t. The D refers to the long-term slope and by doing so, balances the short-term information with information from the past.
δt+1 = D + ρ(δtD) + ηδ,t
The seasonality of the data is accounted for using quarters. Q represents the number of quarters and t represents the observed response in the data. A value of q = 4 refers to the four quarters per year that the data holds.
Y t + 1 = q = 4 Q 2 γ t s + η Y , t ,
To obtain the estimation accuracy in order to calculate the causal effect for each time point, we need the overall posterior predictive density effect on the intervention, which is measure in a pointwise impact.
ϕ ^ i , t : = ϕ t | y 1 , , y m , x 1 , . , x m t = n + 1 , , m ; i = 1 , , 16
Finally, we need to calculate the absolute percentage estimation error to measure the discrepancy between the estimated and the true impact in the intervention.
a i , t : = ϕ ^ i , t ϕ t ϕ t
We set each intervention to be respective of the quarter that it was implemented in between the years 2019 and 2021, while also conducting a counterfactual sensitivity analysis based on the Brodersen et al., 2015 [26] model.

5. Results

As can be seen in Figure 1, for the US, the post-intervention response period shows an average value of approximately USD 21.37 thousand. In the absence of intervention, the response would be expected to be USD 21.57 thousand. A 95% confidence interval of [USD 15.62 thousand to USD 28.00 thousand] was determined for this counterfactual prediction. If we subtract the prediction from the observed response, it yields an estimated causal effect on the response variable of USD −0.19 thousand with a 95% confidence interval of [USD −6.6 thousand to USD 5.75 thousand]. When we sum up the individual data points during the post-intervention period, overall, the response variable has a value of USD 106.7 thousand. Had the intervention not taken place, we would expect a sum of USD 107.38 thousand with a 95% confidence interval of [USD 78.11 thousand to USD 139.98 thousand] for the prediction. In relative terms, the response variable showed a decrease of −1% with a 95% confidence percentage interval of [−31% to positive 27%]. Although the intervention might have a probability of causal effect of 55%, the probability of p = 0.4519. What this means is that although the intervention might seem that it had a negative effect, the response variable, when considered with the intervention period as a whole, has no statistically significant interpretation, which might include the fact that there are factors that are unrelated to the intervention.
Figure 2 shows the case of Mexico. For Mexico the post-intervention period had a response variable of an average value of approximately MXN 4.48 million and the average response would be expected to be MXN 4.20 million. A 95% confidence interval between [MXN −5.16 million and MXN 13.91 million] was found for the counterfactual prediction. Subtracting this prediction from the observed response yields an estimate of the causal effect response variable of 0.28M with a 95% confidence interval between [MXN −9.43 million and MXN 9.63 million]. If we see each data point and sum each of them up, the response variable is an overall MXN 4.48 million. Had the intervention not taken place, it would be 4.20 M, with a 95% confidence interval between [−5.16 M and 13.91 M]. If we put this in relative terms, the variable showed an increase of 7%, with a 95% confidence percentage interval between [−225% and positive 229%]. Although it seems that the intervention caused a positive effect with a probability of causal effect at 54%, it is not statistically significant at a probability of p = 0.4563.
Finally, Figure 3 shows the result for Canada, for which, during the post-intervention period, the response had an average of approximately CND 2.01 million. We estimate the absence of the intervention to have a response of CND 2.09 million. A 95% confidence interval between [CND 1.75 million and CND 2.44 million] was found for the counterfactual prediction. When subtracting this prediction from the observed response, it gives us an estimate of causal effect intervention at CND −0.08 million, with a 95% confidence interval between [CND −0.43 million and CND 0.26 million]. Summing up the individual data points during the post-intervention period, the response variable has an overall value of CND 10.04 million. Had the intervention not occurred, then the sum would be CND 10.46 million with a 95% confidence interval between [CND 8.75 million and CND 12.20 million]. In relative terms, the response variable showed a decrease of −4%, which was representative of a 95% confidence percentage interval of [−21% to positive 12%]. The probability that the intervention had a causal effect is estimated at 71%; however, the probability p = 0.29453 means that it is, overall, not statistically significant.

6. Discussion

The results of this study show that each intervention was insufficient in itself to provide an adequate evaluation of its effectiveness and to share some of the views of what was found in the OECD policy response to coronavirus (COVID-19) that was published on January 22 [27]. A few reasons for the insufficient response include the major human and financial cost that the pandemic gave rise to for some sectors and the fact that it has been difficult to find evidence or to properly evaluate the overall impact and effectiveness of each intervention. Certain studies are offering a way of inferring the effectiveness of an intervention using various types of models [22,28]. The continuation of modeling and evaluating the cost-effectiveness of policies in order to be better prepared for the future, countries, especially those in regional free trade agreements like the US, Mexico, and Canada, might help to strengthen cooperation and contingency policies for unexpected shocks, partly due to the spill-over effect that is most likely to affect the region [2,3,21]. The limitation of this study is looking at the effect of each sector within the countries, since their trade might be stronger on some fronts than others.
Studies have proposed that during a situation of economic crisis, government interventions, specifically economic ones, can benefit the most vulnerable during a crisis [29,30], especially if they are targeted toward suffering sectors and groups that are affected harder [31,32]. Support for local banks can help provide loans, restructure payments and provide various subsidies that can benefit individuals and business owners, hence stimulating economic activity [11,33,34]. Some studies argue that such fiscal policy and monetary policy changes made during difficult times have a long-term effect and are of more benefit during trying times. In the case of the US and Canada, there are criticisms of racial and discriminatory disparities during COVID-19 [12,35], however, in the case of Mexico, it would need further study as to which population was most affected by COVID-19.

7. Conclusions

In the study, the US, Mexico, and Canada were evaluated on their economic response to COVID-19. Evaluating interventions provides a cost-effective analysis of what policies impacted its ability to recover sooner rather than later. In addition, it provides insights as to what needs to be improved in the future in similar regional trade-block countries, such as the US, Mexico, and Canada. Although it is still too soon to judge the results of the interventions, in the case of Mexico, in which the avoidance of spending provoked a lack of meaningful intervention, what can be analyzed is that the impact and nature of the contagion, which should be considered when opting for certain interventions.

Author Contributions

Conceptualization, C.M. and C.H.-R.; methodology, C.M. and C.H.-R.; software, C.M.; validation, C.M. and C.H.-R.; formal analysis, C.M.; investigation, C.M.; resources, C.M.; data curation, C.M.; writing—original draft preparation, C.M.; writing—review and editing, C.H.-R.; visualization, C.M. and C.H.-R.; supervision, C.H.-R.; project administration, C.M. and C.H.-R. All authors have read and agreed to the published version of the manuscript.

Funding

This research received no external funding.

Institutional Review Board Statement

Not applicable.

Informed Consent Statement

Not applicable.

Data Availability Statement

Data are contained within the article.

Conflicts of Interest

The authors declare no conflicts of interest.

References

  1. Knaul, F.M.; Touchton, M.; Arreola-Ornelas, H.; Atun, R.; Calderon Anyosa, R.J.C.; Frenk, J.; Martínez-Valle, A.; McDonald, T.; Porteny, T.; Sánchez-Talanquer, M.; et al. Punt Politics as Failure of Health System Stewardship: Evidence from the COVID-19 Pandemic Response in Brazil and Mexico. Lancet Reg. Health Am. 2021, 4, 100086. [Google Scholar] [CrossRef] [PubMed]
  2. Coronado, S.; Martínez, J.; Venegas-Martínez, F. Spillover Effects of the US Economic Policy Uncertainty in Latin America. Estud. Econ. 2020, 47, 273–293. [Google Scholar] [CrossRef]
  3. Gómez-Zaldívar, M.; Fonseca, F.; Mosqueda, M.; Gómez-Zaldívar, F. Spillover effects of economic complexity on the per capita GDP growth rates of Mexican states, 1993–2013. Estud. Econ. 2020, 47, 221–243. Available online: https://estudiosdeeconomia.uchile.cl/index.php/EDE/article/view/59171/64326 (accessed on 11 March 2022). [CrossRef]
  4. Ciuriak, D. From NAFTA to USMCA and the Evolution of US Trade Policy (June 25, 2019). Verbatim, C.D. Howe Institute (2019). Available online: https://ssrn.com/abstract=3369291 (accessed on 4 March 2022).
  5. U.S. Census Bureau. 2020 Census Results. 2023. Available online: https://www.census.gov/programs-surveys/decennial-census/decade/2020/2020-census-results.html (accessed on 15 July 2024).
  6. U.S. Department of the Treasury. COVID-19 Economic Relief. (n.d.). Frontpage. Available online: https://home.treasury.gov/policy-issues/coronavirus (accessed on 6 March 2022).
  7. SBA’s Office of Advocacy. Small Businesses Generate 44 Percent of U.S. Economic Activity. 30 January 2019. Available online: https://advocacy.sba.gov/2019/01/30/small-businesses-generate-44-percent-of-u-s-economic-activity/ (accessed on 4 March 2022).
  8. Baig, A.S.; Butt, H.A.; Haroon, O.; Rizvi, S.A. Deaths, panic, Lockdowns and US equity markets: The case of Covid-19 pandemic. Financ. Res. Lett. 2021, 38, 101701. [Google Scholar] [CrossRef] [PubMed]
  9. IMF. Policy Responses to COVID19; IMF: Washington, DC, USA, 2020; Available online: https://www.imf.org/en/Topics/imf-and-covid19/Policy-Responses-to-COVID-19 (accessed on 11 March 2022).
  10. Hetzel, R. COVID-19 and the Fed’s Credit Policy; Working Paper; Mercatus Center, George Mason University: Arlington, VA, USA, 2020. [Google Scholar]
  11. Oyewale, A.; Adebayo, O.; Kehinde, O. Estimating the Impact of COVID-19 on Small and Medium Scale Enterprise: Evidence from Nigeria. OJBM 2020, 9, 1–19. [Google Scholar] [CrossRef]
  12. Selgin, G. The fiscal and monetary response to COVID-19: What the Great Depression has—and hasn’t—taught us. Econ. Aff. 2021, 41, 3–20. [Google Scholar] [CrossRef]
  13. Ritchie, H.; Mathieu, E.; Rodés-Guirao, L.; Appel, C.; Giattino, C.; Ortiz-Ospina, E.; Hasell, J.; Macdonald, B.; Dattani, S.; Roser, M. Canada: Coronavirus Pandemic Country Profile. Our World in Data. 2022. Available online: https://ourworldindata.org/coronavirus/country/canada (accessed on 26 March 2022).
  14. Consolidated Canadian Government Finance Statistics, 2020; Statistics Canada: Canada’s National Statistical Agency/Statistique Canada: Organisme Statistique National du Canada: Ottawa, ON, Canada, 2021. Available online: https://www150.statcan.gc.ca/n1/daily-quotidien/211122/dq211122a-eng.htm (accessed on 5 March 2022).
  15. Harris, K. Part-Time, Contract, and Seasonal Workers Now Qualify for COVID-19 Emergency. CBC News, 15 April 2020. Available online: https://www.cbc.ca/news/politics/cerb-emergency-benefits-trudeau-1.5532767(accessed on 5 March 2022).
  16. Government of Canada. Claims to Date—Canada Emergency Wage Subsidy (CEWS). 2020. Available online: https://www.canada.ca/en/revenue-agency/services/subsidy/emergency-wage-subsidy/cews-statistics.html (accessed on 10 March 2022).
  17. International Monetary Fund. Real Gross Domestic Product for Canada [NGDPRSAXDCCAQ], Retrieved from FRED, Federal Reserve Bank of St. Louis. Available online: https://fred.stlouisfed.org/series/NGDPRSAXDCCAQ (accessed on 22 May 2023).
  18. Béland, D.; Dinan, S.; Rocco, P.; Waddan, A. Social policy responses to COVID-19 in Canada and the United States: Explaining policy variations between two liberal welfare state regimes. Soc. Policy Adm. 2020, 55, 280–294. [Google Scholar] [CrossRef]
  19. Ritchie, H.; Mathieu, E.; Rodés-Guirao, L.; Appel, C.; Giattino, C.; Ortiz-Ospina, E.; Hasell, J.; Macdonald, B.; Dattani, S.; Roser, M. Mexico: Coronavirus Pandemic Country Profile. Our World in Data. 2022. Available online: https://ourworldindata.org/coronavirus/country/mexico (accessed on 16 March 2022).
  20. Hannan, S.A.; Honjo, K.; Raissi, M. Mexico needs a fiscal twist: Response to COVID-19 and beyond. Int. Econ. 2022, 169, 175–190. [Google Scholar] [CrossRef]
  21. Wagner, A.K.; Soumerai, S.B.; Zhang, F.; Ross-Degnan, D. Segmented regression analysis of interrupted time series studies in medication use research. J. Clin. Pharm. Ther. 2002, 27, 299–309. [Google Scholar] [CrossRef]
  22. Galster, G.; Temkin, K.; Walker, C.; Sawyer, N. Measuring the impacts of community development initiatives: A new application of the adjusted interrupted time-series method. Eval. Rev. 2004, 28, 502–538. [Google Scholar] [CrossRef] [PubMed]
  23. Jandoc, R.; Burden, A.M.; Mamdani, M.; Lévesque, L.E.; Cadarette, S.M. Interrupted time series analysis in drug utilization research is increasing: Systematic review and recommendations. J. Clin. Epidemiol. 2015, 68, 950–956. [Google Scholar] [CrossRef] [PubMed]
  24. Kandogan, Y. Consistent Estimates of Regional Blocs’ Trade Effects. Rev. Int. Econ. 2008, 16, 301–314. [Google Scholar] [CrossRef]
  25. Brauner, J.M.; Mindermann, S.; Sharma, M.; Johnston, D.; Salvatier, J.; Gavenciak, T.; Stephenson, A.B.; Leech, G.; Altman, G.; Mikulik, V.; et al. Inferring the effectiveness of government interventions against COVID-19. Science 2020, 371, eabd9338. [Google Scholar] [CrossRef] [PubMed]
  26. Brodersen, K.H.; Gallusser, F.; Koehler, J.; Remy, N.; Scott, S.L. Inferring causal impact using Bayesian structural time-series models. Ann. Appl. Stat. 2015, 9, 247–274. [Google Scholar] [CrossRef]
  27. OECD Policy Responses to Coronavirus (COVID-19): First Lessons from Government Evaluations of COVID-19 Responses a Synthesis; OECD: Paris, France, 2022; Available online: https://www.oecd.org/coronavirus/policy-responses/first-lessons-from-government-evaluations-of-covid-19-responses-a-synthesis-483507d6/#section-d1e638 (accessed on 1 March 2022).
  28. Eryarsoy, E.; Shahmanzari, M.; Tanrisever, F. Models for government intervention during a pandemic. Eur. J. Oper. Res. 2022, 304, 69–83. [Google Scholar] [CrossRef]
  29. Antwi-Boasiako, J.; Abbey, C.O.; Ogbey, P.; Ofori, R.A. Policy responses to fight COVID-19; the case of Ghana. Rev. Adm. Pública 2021, 55, 122–139. [Google Scholar] [CrossRef]
  30. Sullivan, E.; Wolff, E.A. Politics, pandemics, and support: The role of political actors in Dutch state aid during COVID-19. Rev. Adm. Pública 2021, 55, 50–71. [Google Scholar] [CrossRef]
  31. Ashford, N.A.; Hall, R.P.; Arango-Quiroga, J.; Metaxas, K.A.; Showalter, A.L. Addressing inequality: The first step beyond COVID-19 and towards Sustainability. Sustainability 2020, 12, 5404. [Google Scholar] [CrossRef]
  32. Aspachs, O.; Durante, R.; Graziano, A.; Mestres, J.; Reynal-Querol, M.; Montalvo, J.G. Tracking the impact of COVID-19 on economic inequality at High Frequency. PLoS ONE 2021, 16, e0249121. [Google Scholar] [CrossRef] [PubMed]
  33. Danielli, S.; Patria, R.; Donnelly, P.; Ashrafian, H.; Darzi, A. Economic interventions to ameliorate the impact of COVID-19 on the economy and health: An international comparison. J. Public Health 2020, 43, 42–46. [Google Scholar] [CrossRef] [PubMed]
  34. Zaremba, A.; Aharon, D.Y.; Demir, E.; Kizys, R.; Zawadka, D. COVID-19, government policy responses, and stock market liquidity around the world: A note. Res. Int. Bus. Financ. 2021, 56, 101359. [Google Scholar] [CrossRef] [PubMed]
  35. Tuyiseng, G.; Goldenberg, S.M. COVID-19, structural racism, and migrant health in Canada. Lancet 2021, 397, 650–652. [Google Scholar] [CrossRef] [PubMed]
Figure 1. US 2019–2021 quarterly GDP in USD with economic interventions in 2020.
Engproc 68 00055 g001
Figure 2. Mexico 2019–2021 quarterly GDP in MXN with economic interventions in 2020.
Engproc 68 00055 g002
Figure 3. Canada 2019–2021 quarterly GDP in CND with economic interventions in 2020.
Engproc 68 00055 g003
Table 1. Descriptive statistics.
CountryVariablesObs.MedianSDVarMinMax
USGDP162.1481.1261.2681.9482.401
MexicoGDP164.5582.3425.4863.7444.646
CanadaGDP165.2181.6972.8814.6305.354
Disclaimer/Publisher’s Note: The statements, opinions and data contained in all publications are solely those of the individual author(s) and contributor(s) and not of MDPI and/or the editor(s). MDPI and/or the editor(s) disclaim responsibility for any injury to people or property resulting from any ideas, methods, instructions or products referred to in the content.

