Abstract
This contribution is focused on forecasting ability of Bayesian causality (BC) on annual runoff series. For that, the time series was synthetized through a Bayesian net, in which the probability propagation over the time was performed. The BC analytical ability identified the hidden logic structure of the hydrological records that describes its overall behavior. This allowed us to quantify the runoff, through a novel dependence matrix, through two fractions, one conditional on time (temporally conditioned runoff) and one not (temporally nonconditioned runoff). This conditionality allowed the development of two predictive models for each fraction, analyzing their reliability under a double probabilistic and metrological approach.
1. Introduction
It is evident that the hydrological cycle is experiencing notable changes at a global and local level [1,2,3], due mainly to the phenomenon of climate change, highly intensified by anthropogenic actions [4,5]. This represents a strong pressure on water resources [6,7,8], as well as a complex scenario for its sustainability and availability in general, and surface water resources in particular [9]. This implies a research challenge in terms of forecasting based on the discovery of the nontrivial logical structure of time dependence of these modifications, which underlies in the runoff series [10]. It is worth emphasizing that the hydrological response of the catchment depends on this logical structure [9]. Therefore, it is essential to reveal the “hidden knowledge” of the evolution of changes to advance in the integral sustainability of water resources [9,10]. In this sense, one of these innovative frameworks is Bayesian causality (BC), recently applied to detect temporal causal structures in hydrological data by means of Bayesian nets (BNs) [11,12].
This conference paper shows how the BC can reveal that hidden temporal logical structure in the historical records, which describes the overall runoff behavior. This is performed by combining a temporal hydrological parametric model with a Bayesian causal one. This makes possible to identify and quantify, through a dependence matrix, two fractions within the runoff: one conditional on time (temporally conditioned runoff) and one not (temporally nonconditioned runoff) [10]. Finally, this conditionality is the basis for the implementation of two predictive models, one for each fraction, assessing its forecast ability from a double perspective (probabilistic and metrological) [9].
2. Case Studies
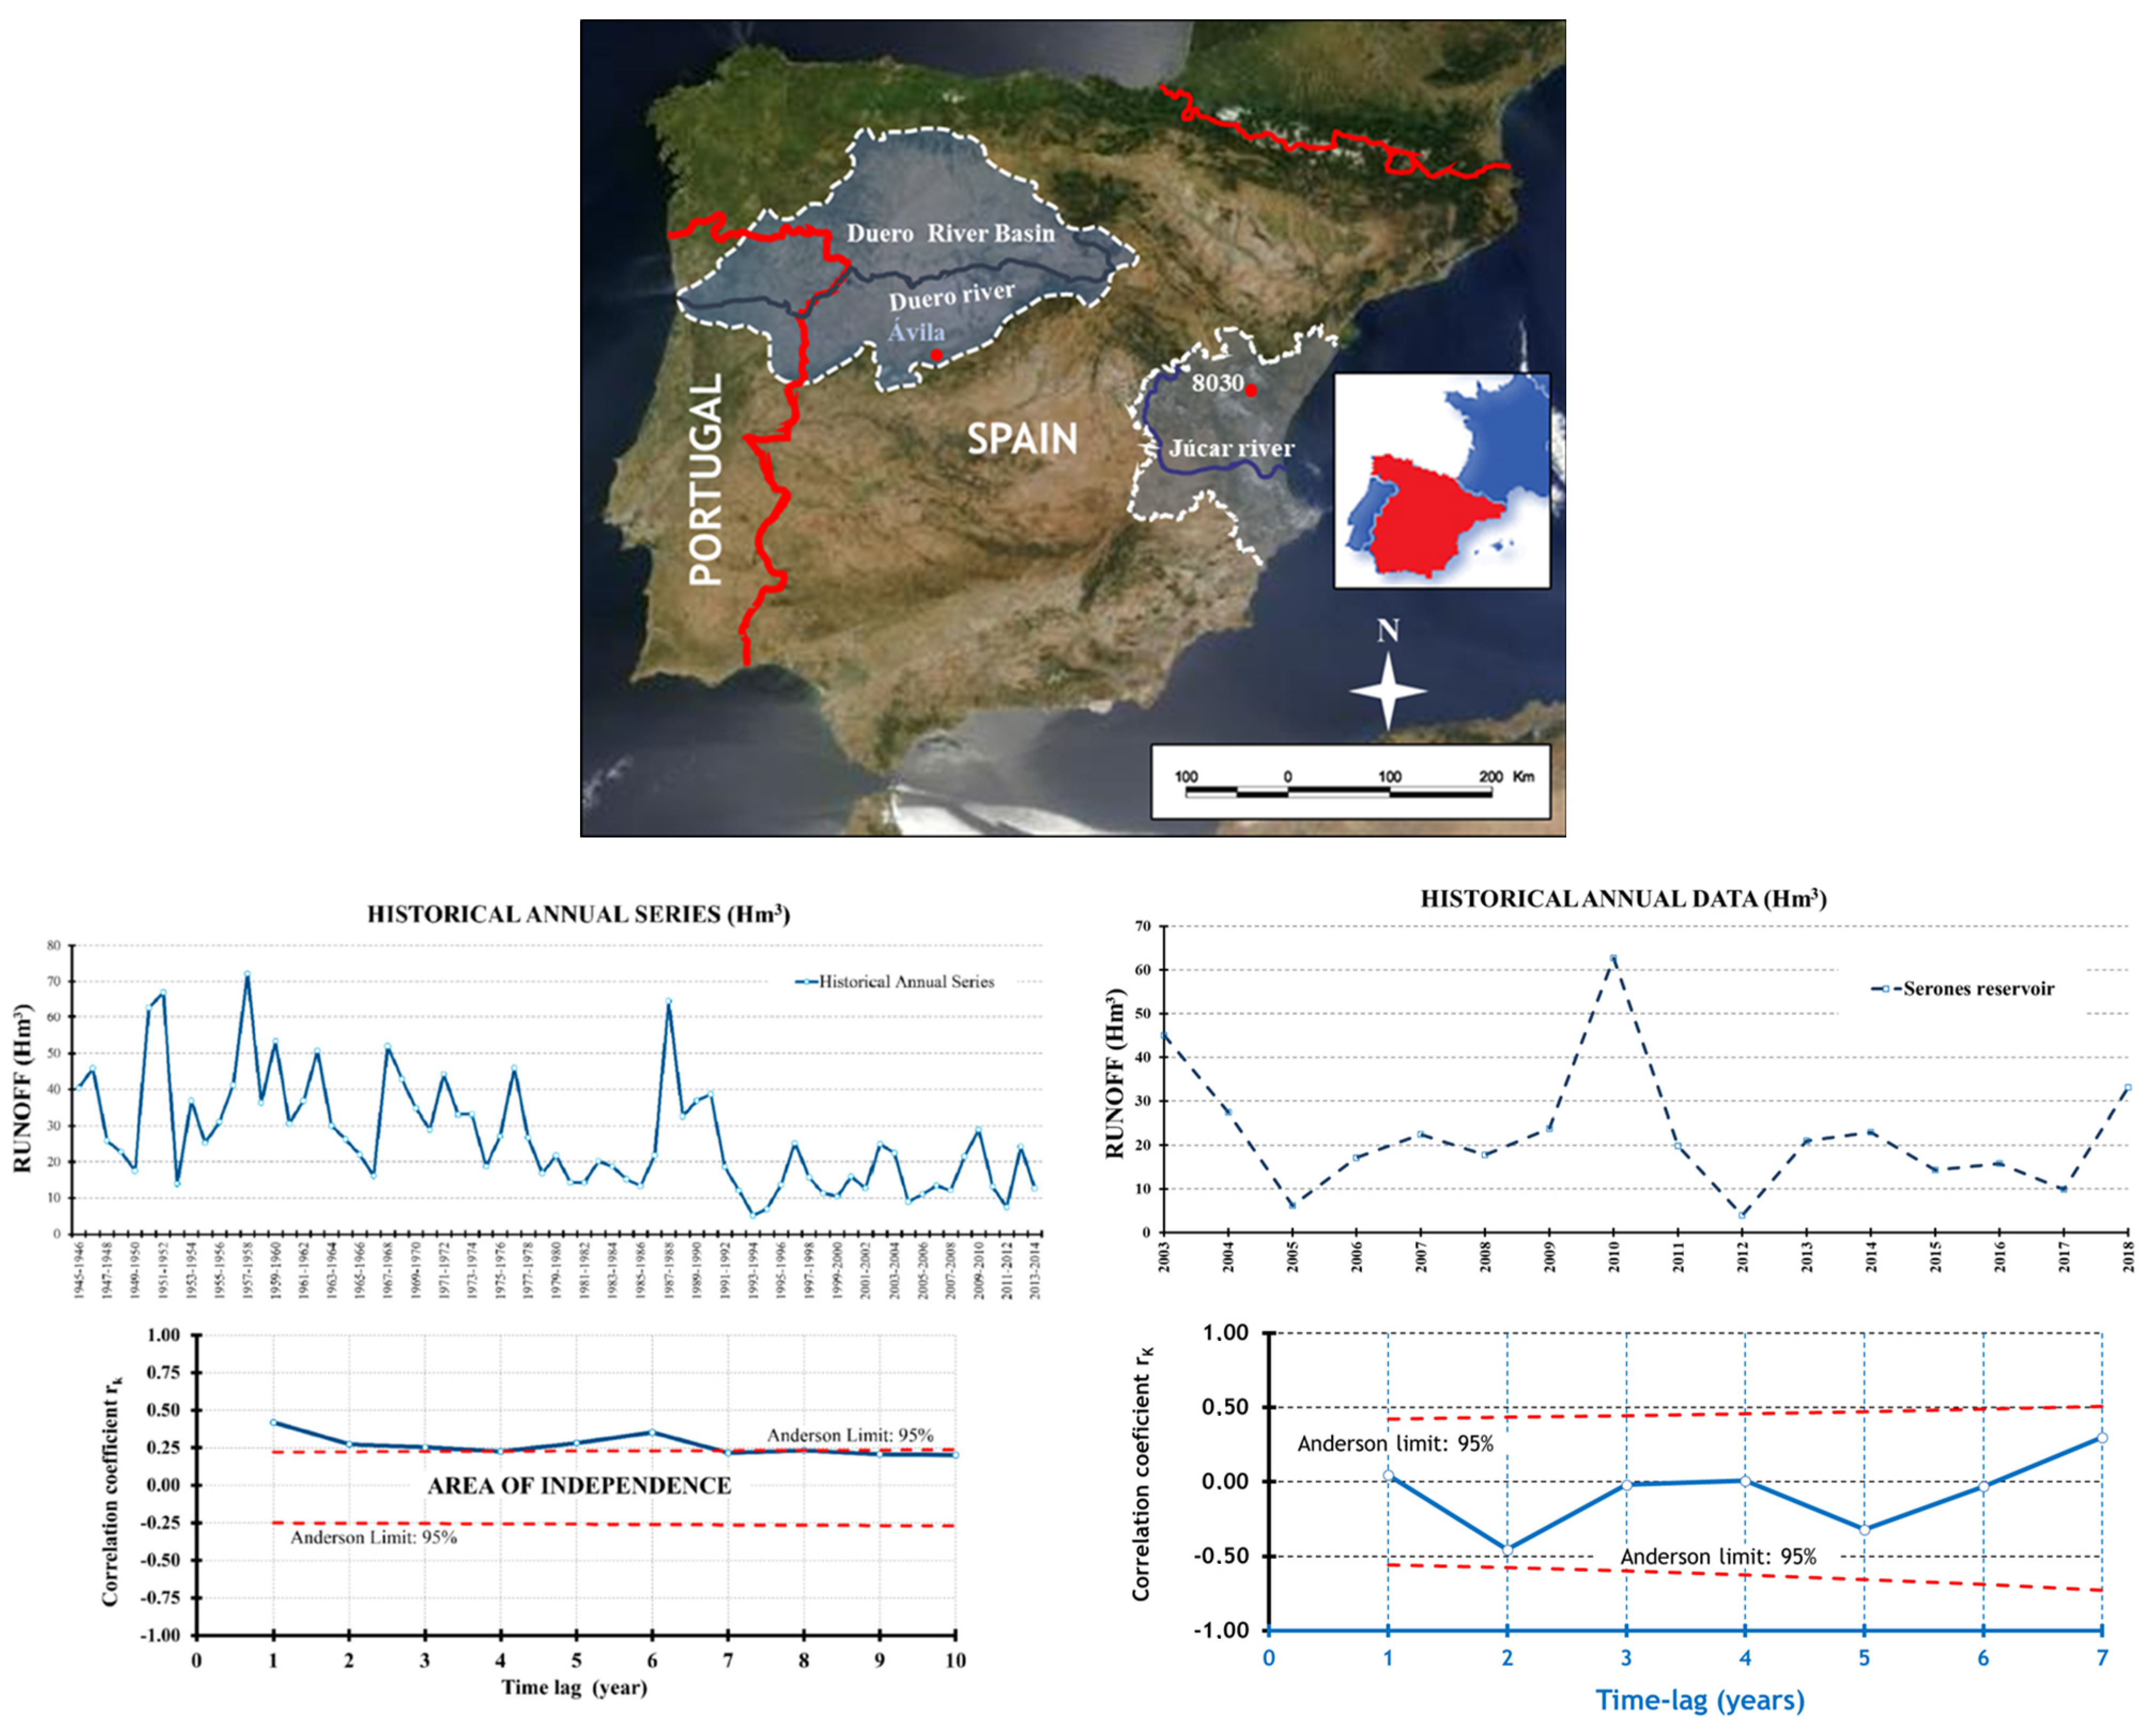
One of the focal points of climate change is the Mediterranean area, with an average surface warming 20% higher than the average annual surface temperature of the planet, and a simultaneous decrease in precipitation of 4% for each degree of increase [13]. However, the central area of the Iberian Peninsula is not free from changes either, a clear example being the southern subsystems of the Duero basin, which manifest evident signs of modifications in the behavior of its resources, having experienced important drought events in recent years [9]. For that reasons, two Spanish river basins have been selected as case studies, in particular the upper basins of the rivers Mijares and Voltoya, belonging to the Jucar and Duero basins, respectively, both in natural regime. Furthermore, these cases display a distinctly temporal behavior, Mijares dependent and Voltoya independent (Figure 1).
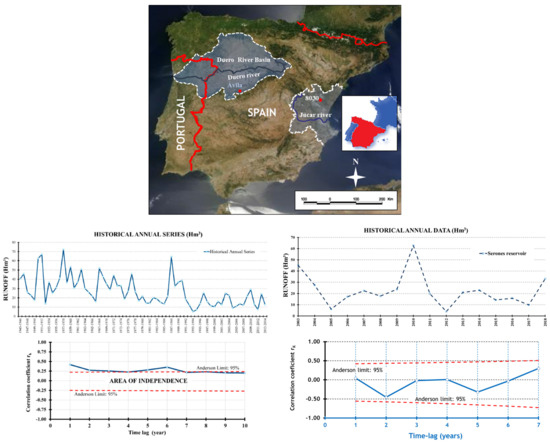
Figure 1.
(Upper): Case study locations. Bottom: Runoff time series and temporal correlograms, Mijares (left) and Voltoya (right) case studies.
The Mijares case study is defined by the gauging station “El Terde”, which determines a watershed of 665 km2 and covers a period of analysis of 68 years (1945/46 and 2013/14), obtained by means of the gauging network of the Jucar River Basin Authority [10]. In the case of the Voltoya River, “Serones” reservoir: sub-basin of 109 km2 and storage capacity of 6.30 Hm3, the inflows cover a period of 15 years (from 2003 up to 2018), which were supplied by the City Council of Avila [9].
3. Methodology
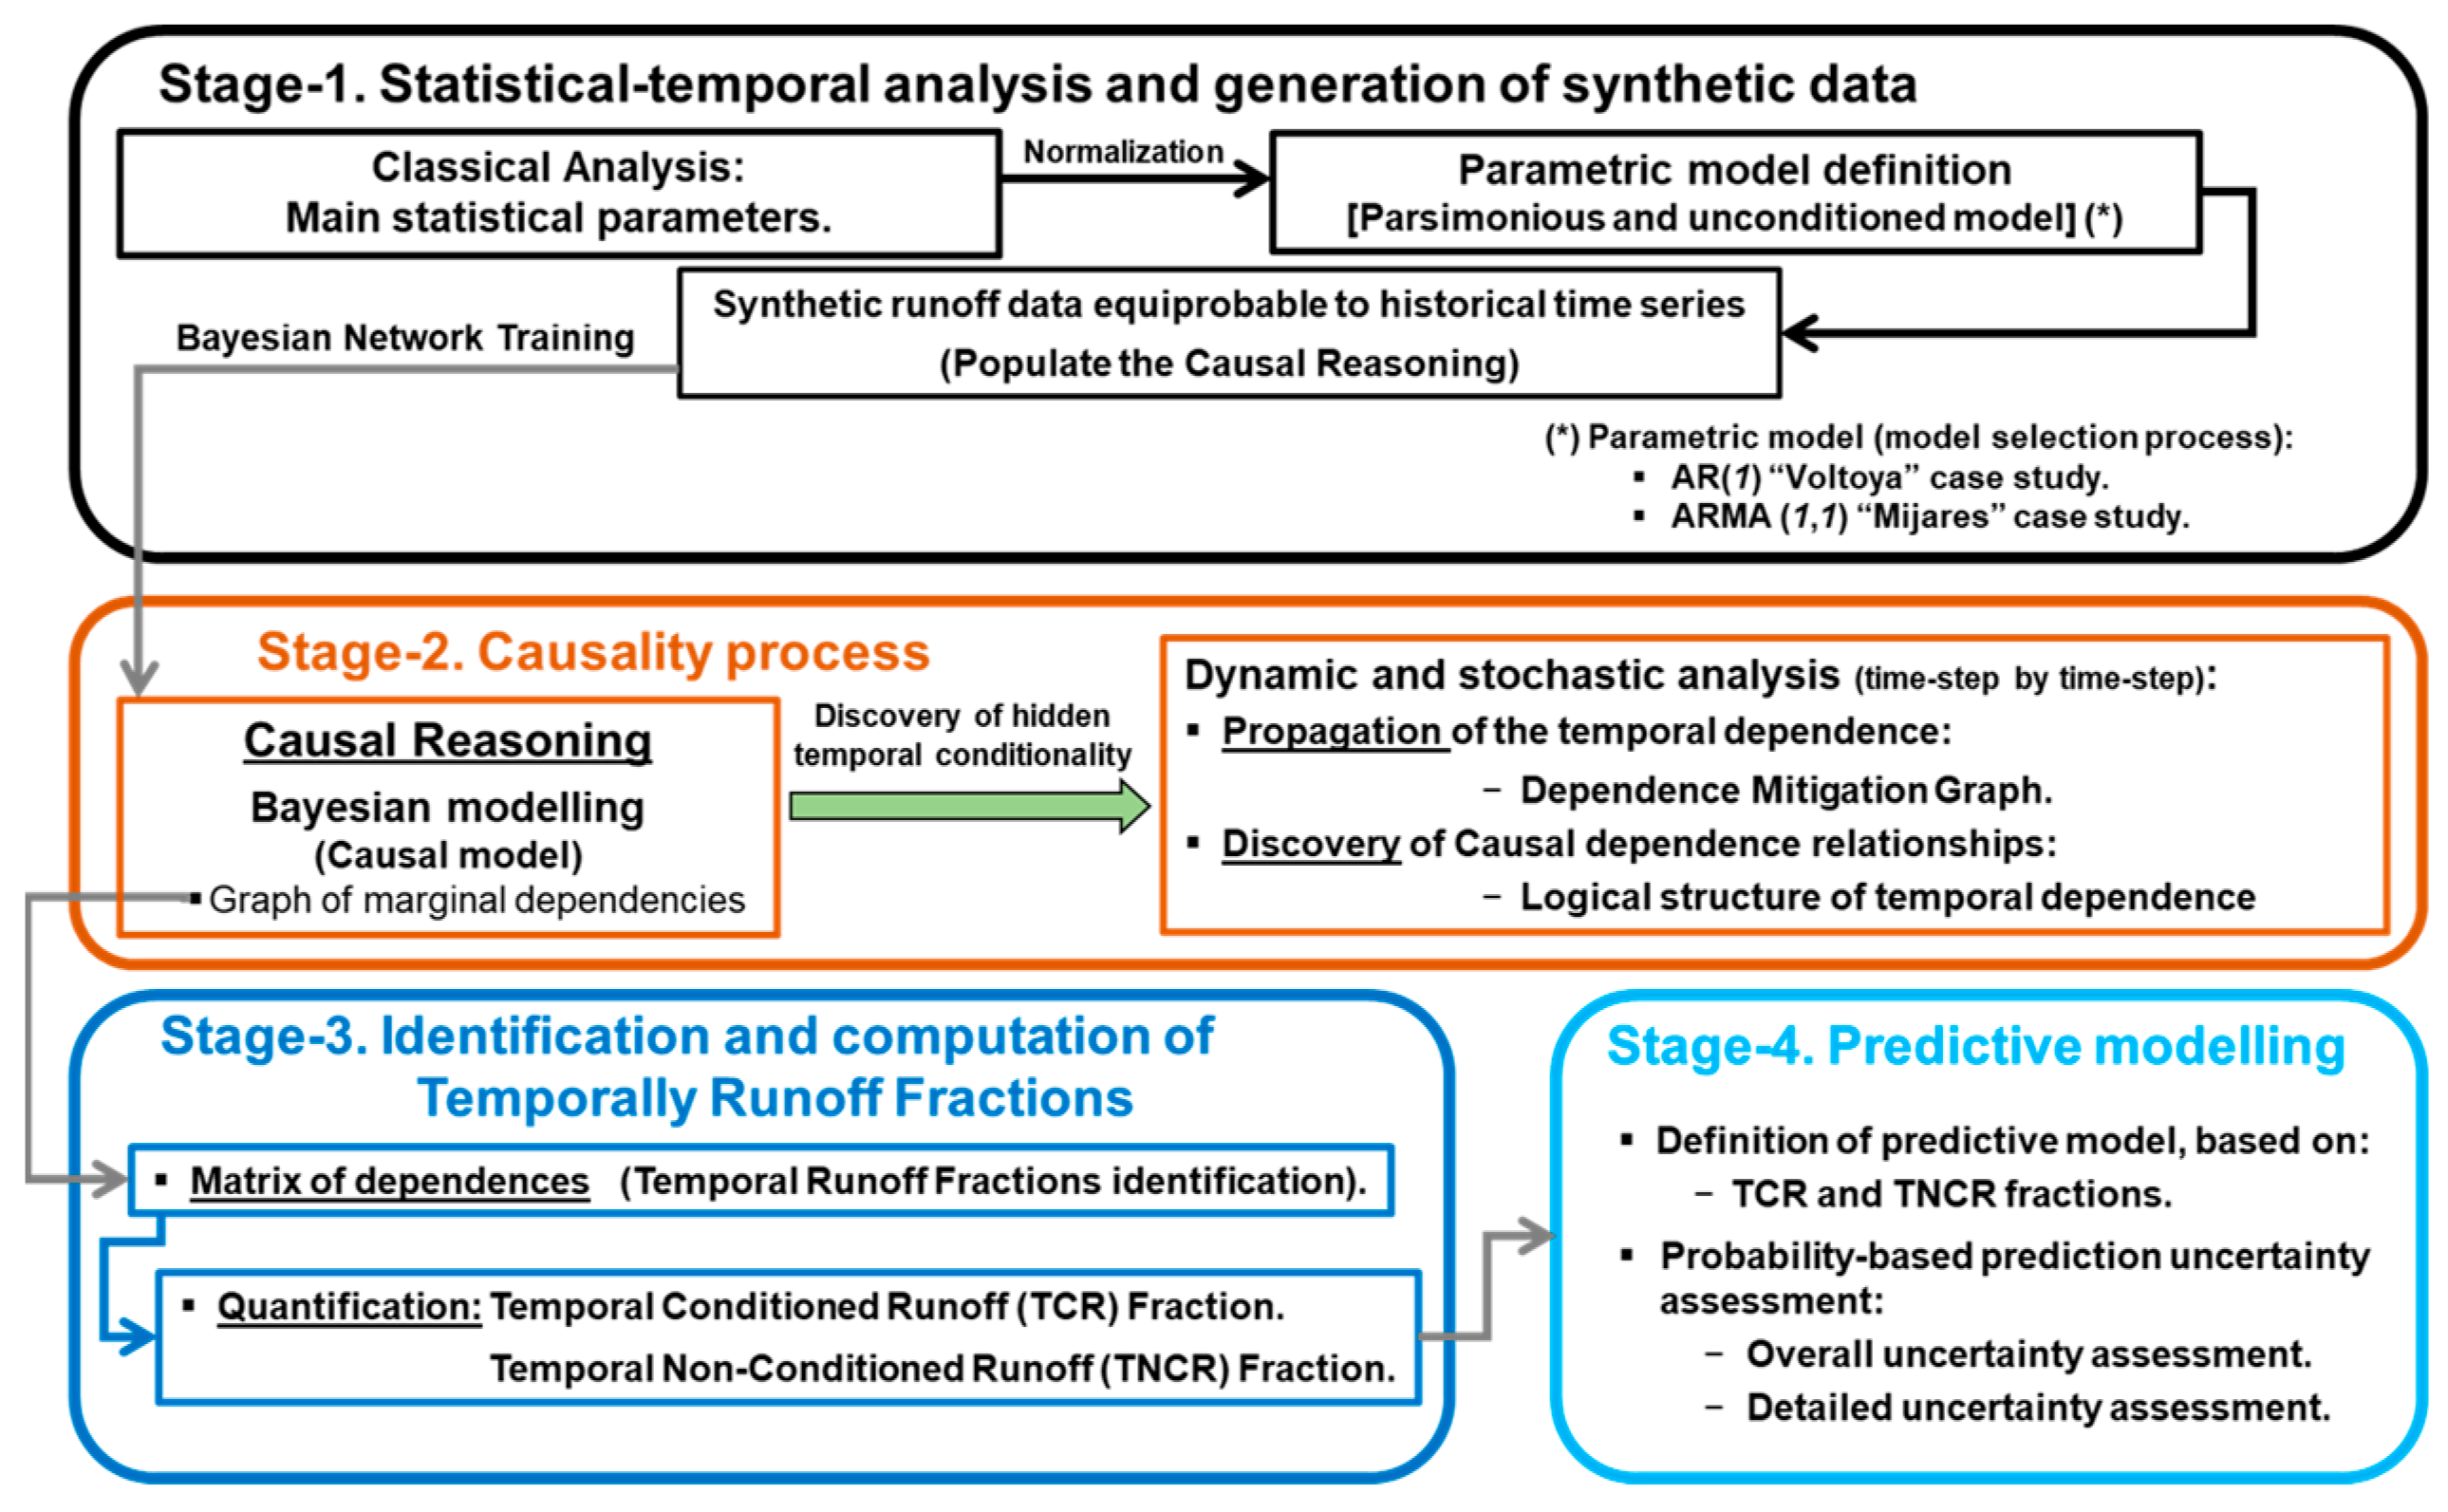
The proposed methodology is mainly articulated in four stages (Figure 2).

Figure 2.
Methodological scheme applied.
3.1. Stage-1: Statistical Analysis Historical and Synthetic Data
Stage 1 involves an analysis of the key statistical parameters of the runoff records and the generation of a set of synthetic series of equiprobable inputs, through a generic parametric temporal hydrological autoregressive moving average, ARMA(p,q), parsimonious and unconditioned, which will feed the causality process. According to Salas et al. [14], an ARMA(p,q) model is defined as
where the value of the temporal series at a certain time-step t is denoted by Yt, μ is the mean of the runoff records, (p,q) are the number of time steps of autoregressive (AR) and moving average (MA) parts, respectively, ∅j, θj are the coefficient of AR and MA models, and εt are historical residuals.
3.2. Stage-2: Causality Process
Stage 2 is fully developed by means of the BC, under the Bayesian paradigm applied in the form of BNs [15] on a set of random variables (X) together with their conditional dependencies, represented through a direct acyclic graph (DAG), which is based on Madsen et al. [16] and expressed as
where P(V) is the product of the probability of each node conditioned on its parents and P(X|pa(X)) is the conditional probability distribution for each decision variable [9].
The analytical power of BC reveals the complex logical structure of temporal dependence, which determines the overall behavior of the basin, and which is hidden in the hydrological data. This is performed by means of statistical tests of conditional independence [12]. This is followed by the propagation and evaluation of the time dependence using the dependence mitigation graph (DMG). This graph is an innovative, dynamic, and qualitative approach to assess temporal dependence from a geometric point of view, as opposed to the well-known and static analysis of a correlogram. The symmetry of the graph leads to an independent interpretation of temporal behavior. In contrast, asymmetry is associated with dependent behavior [1,15,17].
3.3. Stage-3: Identification and Computation of Temporally Runoff Fractions
Temporally runoff fractions (TCR, TNCR) are identified and quantified through an analysis of the strength of dependence over time. This is shown by means of a novel dependency matrix, which is obtained from all (in)dependency relationships revealed by the BC, using the marginal dependency plot for a total (100%) independence level. Each causal dependency strength is measured by the dependence ratio (DR; [0, 1]) (see Table 1). Mathematically, it is expressed as [9,10] follows:
where, for a Target Year (i), represents the weighted average conditioned runoff; is the dependence weighting of a year j on Target Year (i); is the conditional runoff of the year j; TD is the horizon temporal of the dependence in years from the DMG; is the runoff of the time series in the target year; and is temporal fraction not due to time.

Table 1.
Classification of the strength of dependence in intervals according to dependence ratio.
3.4. Stage-4: Predictive Modelling
For each conditional fraction, a predictive model is developed by means of Monte Carlo simulations. This is supported through an AR (1) model, which is based on the Gringorten probability. In addition, each predictive model is internally evaluated. On the other side, the forecast is generated for a one-year horizon due to the annual variability that characterizes water resources in Spain [10].
The predictive ability is analyzed in two ways. The first from a probabilistic approach, and the second is from a metrological point of view, since it is assumed that the TNCR fraction, as it is not affected by time, adds uncertainty to the forecast process [9].
4. Results
4.1. Historical and Synthetic Data: Statistical Analysis
A comparison of results on the key statistical parameters of the historical records and the synthetic series generation process is shown in Table 2. It is evident that the parametric models maintain the key statistical parameters of the historical dataset, which validates the synthetic data generation.
Table 2.
Comparative analysis of key statistical parameters between historical and synthetic data.
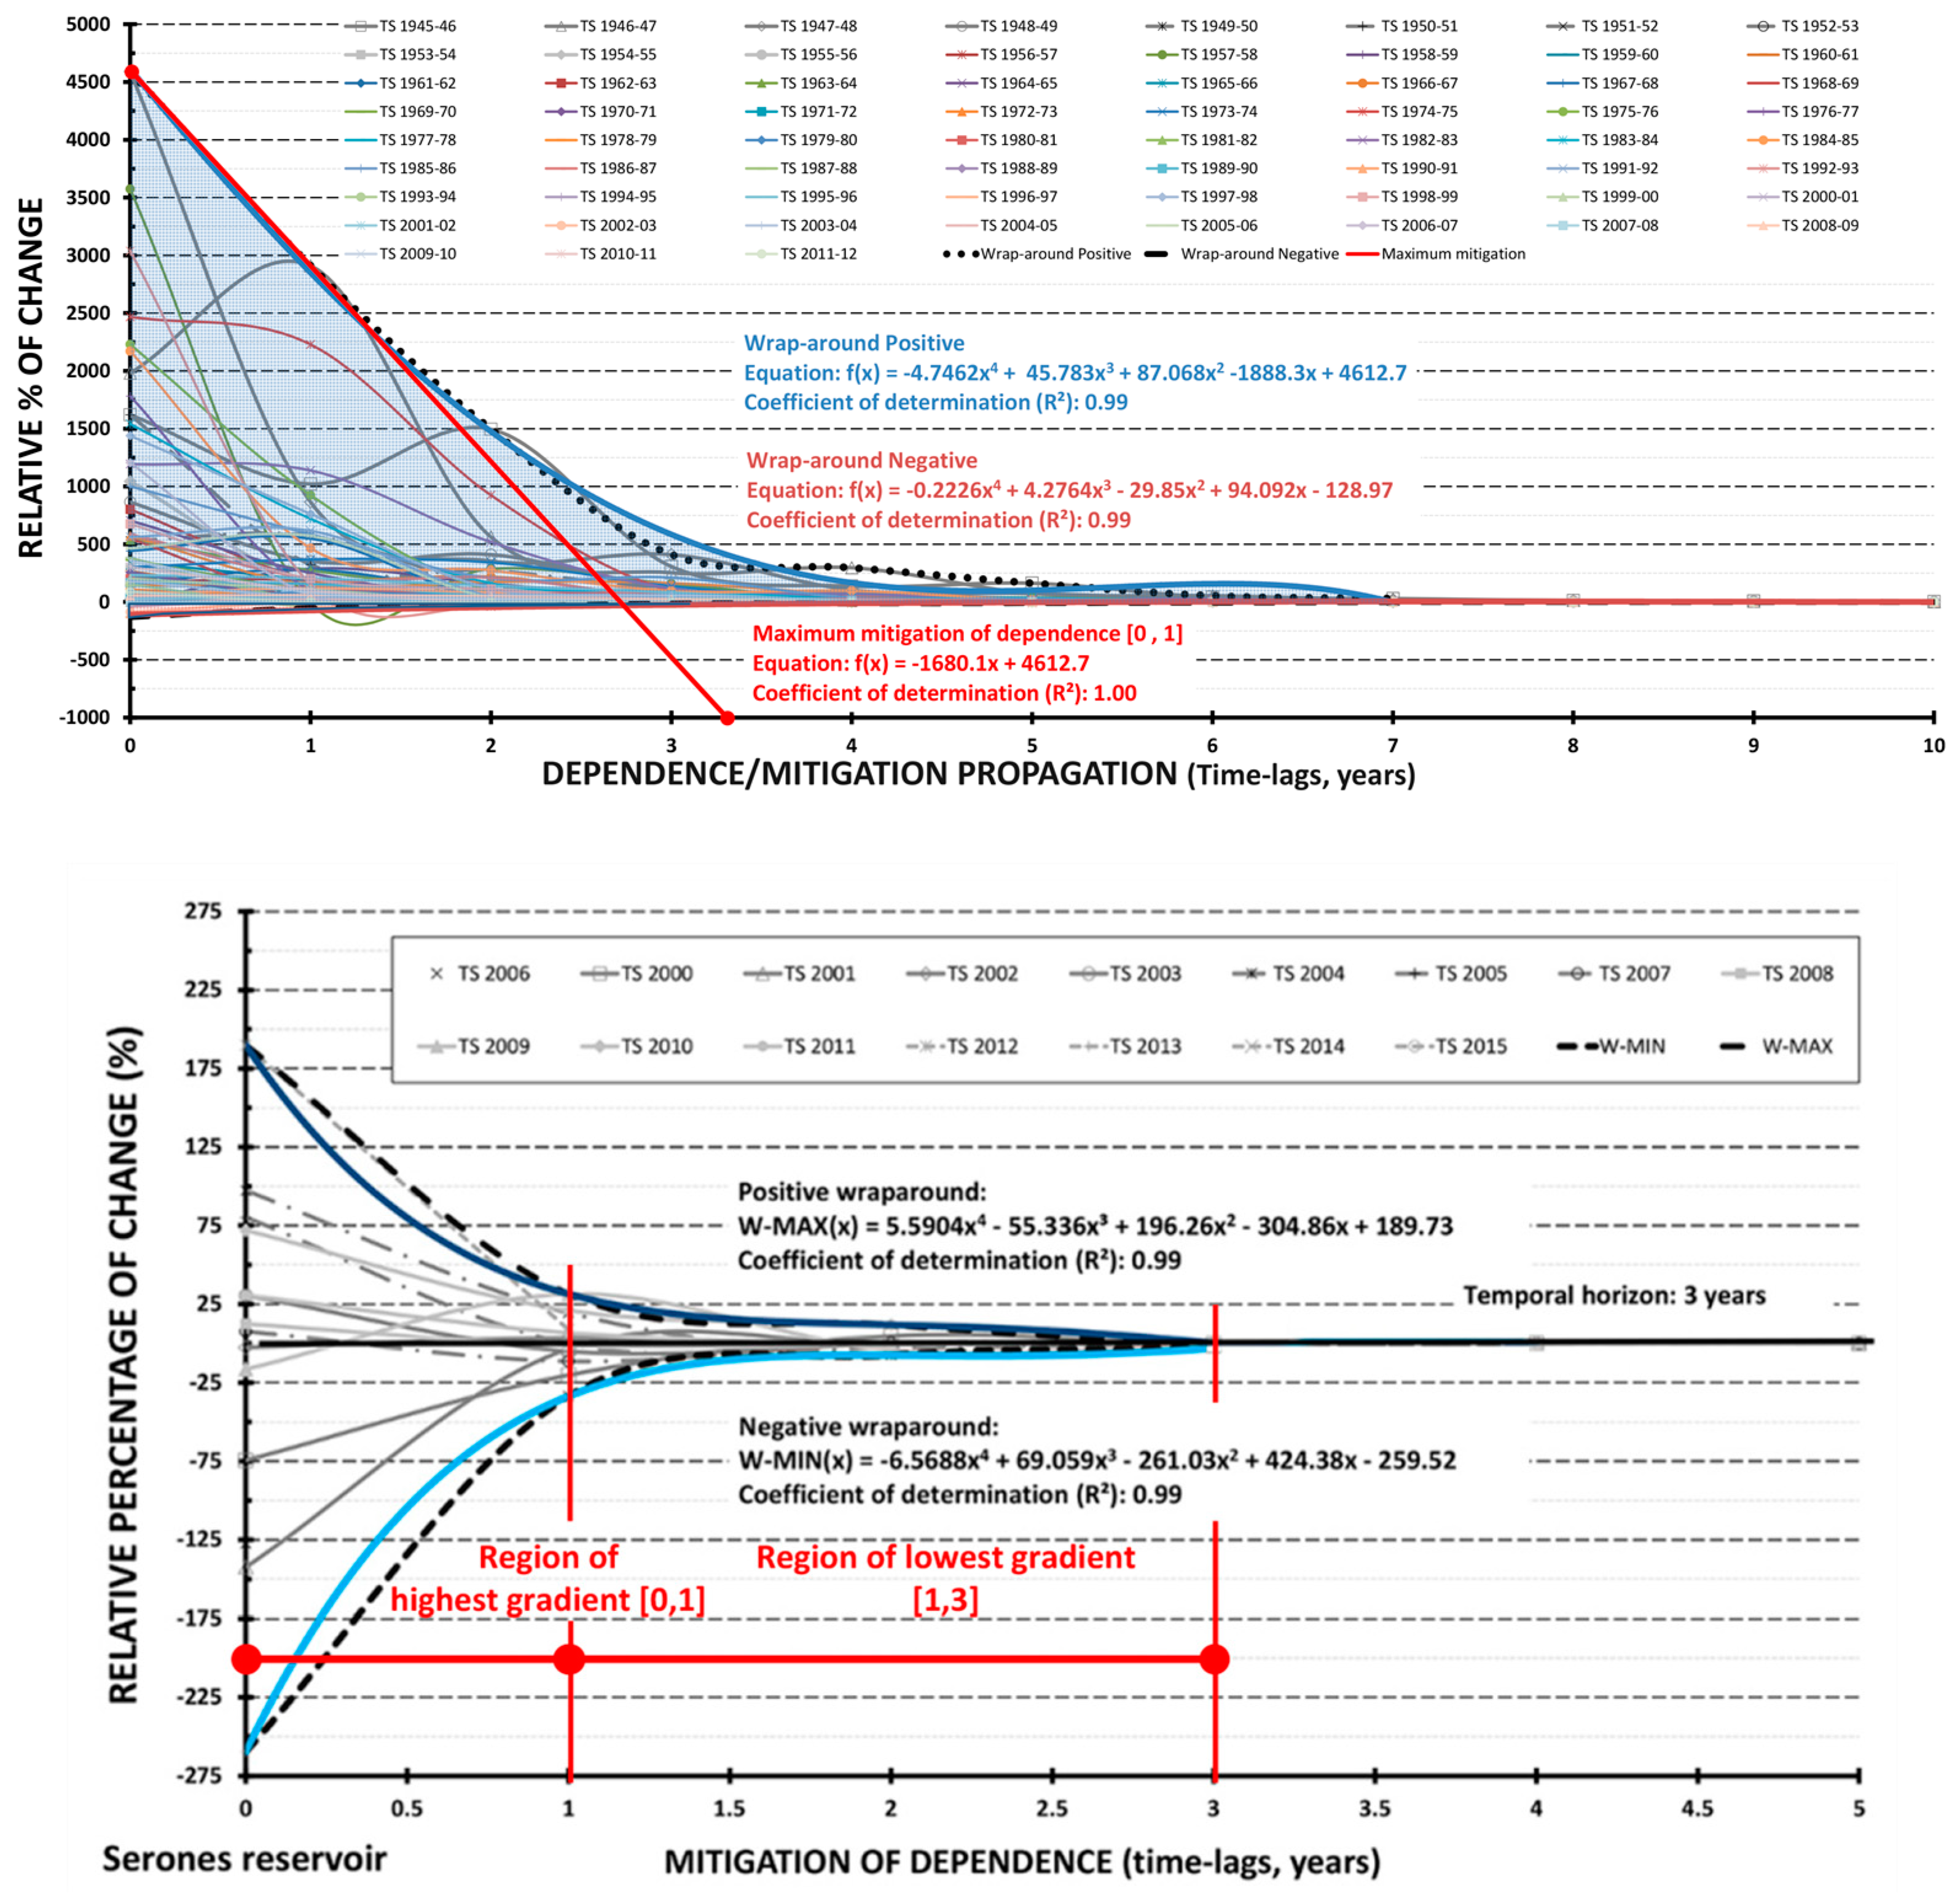
4.2. Time Dependence Mitigation Graphs
The DMG plots are shown in Figure 3. The asymmetry for the case of the Mijares River is evidenced by the predominance of the positive part of the graph (W-MAX). Furthermore, the graph defines a time horizon of 4 years (convergence of W-MAX to the 0 value of the relative percentage of change). In contrast, for the Voltoya River (Serones reservoir) case study, the symmetry is evident, with a clear time horizon of dependence influence of 3 years. These behaviors agree with the preliminary evaluation of the correlogram; however, the analysis using DMG graphs defines specific time horizons of influence of the dependence.
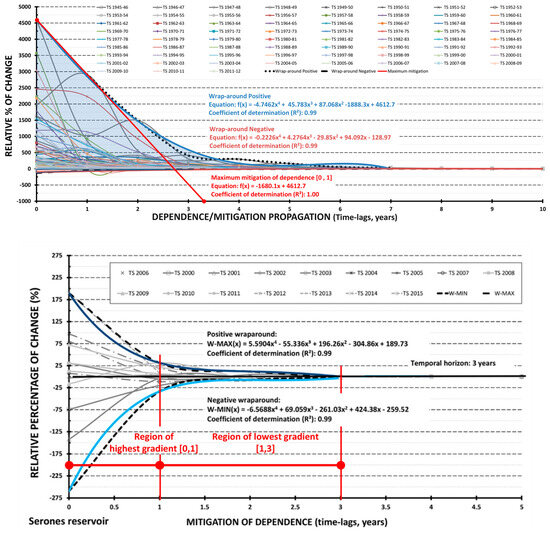
Figure 3.
DMG graphics. Mijares River (upper). Voltoya River, Serones reservoir (lower) [9,10].
On the other hand, considering the mitigation gradient of the dependence, in the Voltoya river two differentiated regions are shown, the first one with a higher degree of gradient in the interval [0, 1] and the second one with a lower variation between the interval [1, 3].
4.3. Conditional Runoff Fractions
4.3.1. Marginal Dependencies Graph
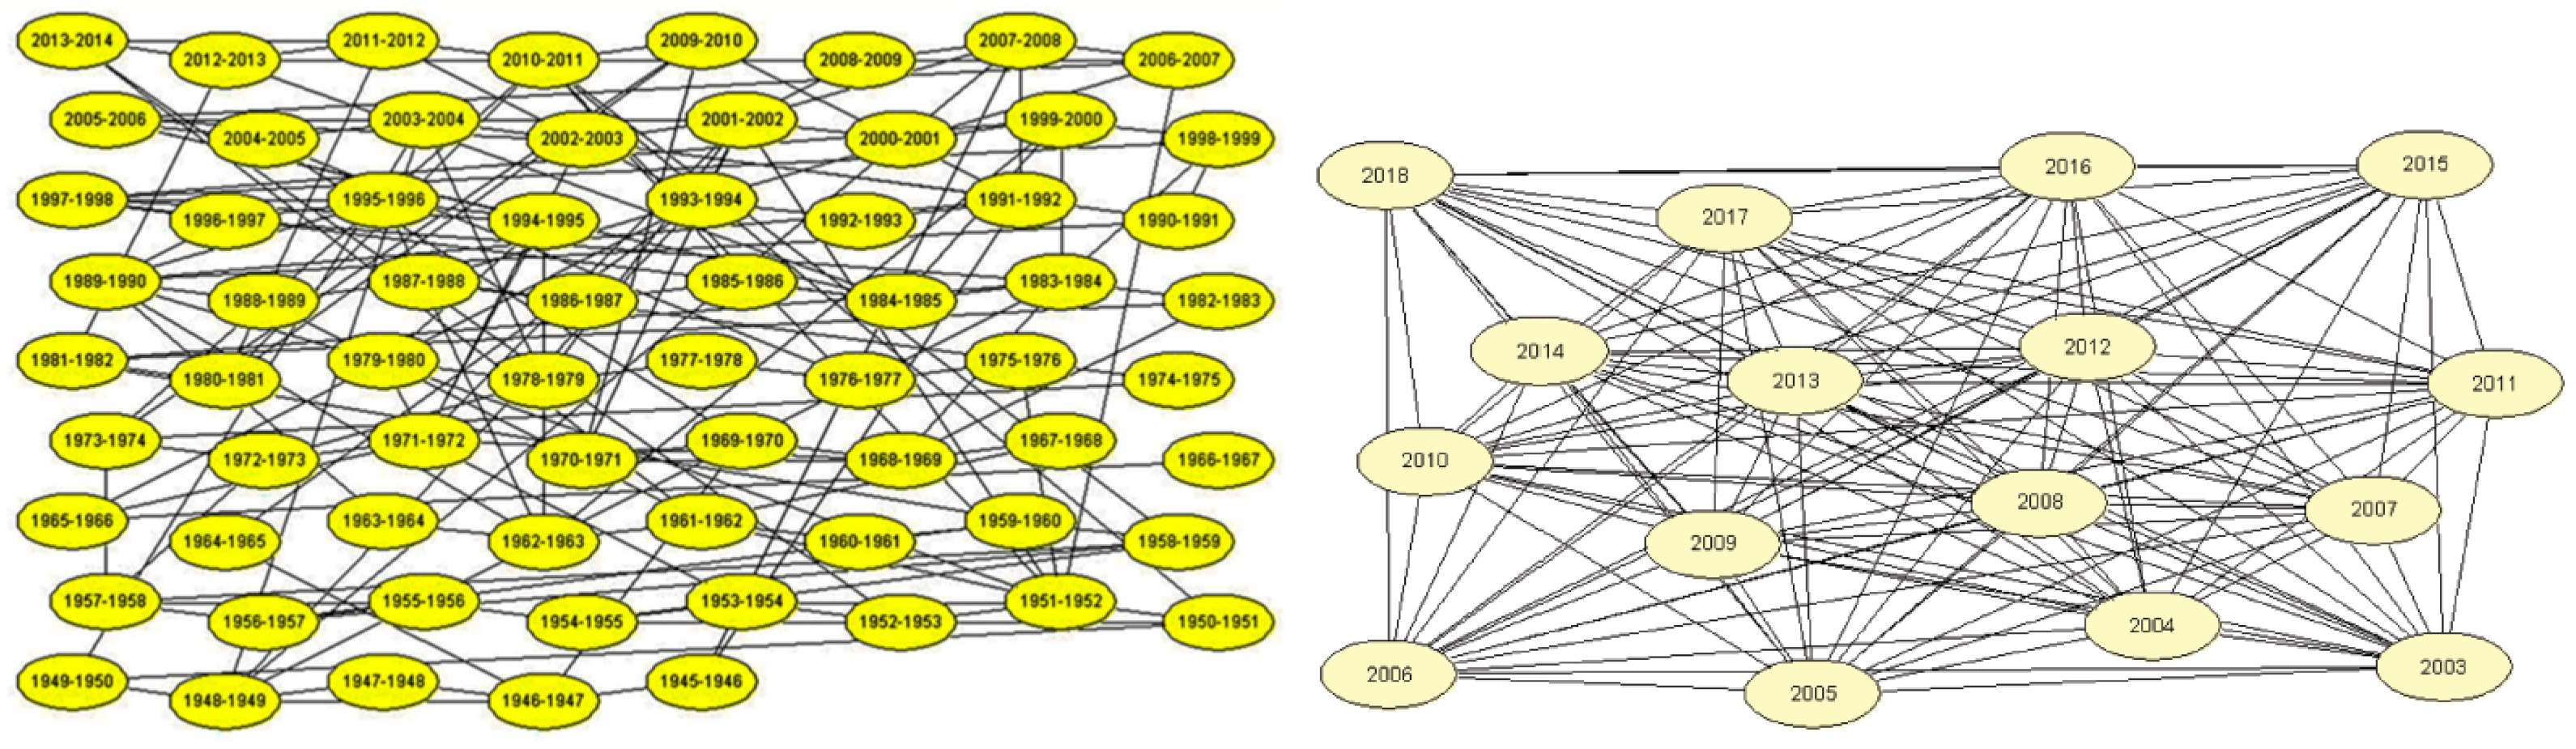
Figure 4 shows the analytical power of the CB through the marginal dependencies graph. All independence relationships between the set of nodes (decision variables) of the causal model are shown. Each “link” implies a temporal independence relationship, whose strength is measured by means of its p_value. In both case studies, the nonconsecutive number of detected relationships (time lag > 1) is remarkable.
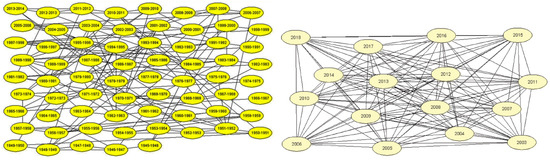
Figure 4.
Causal models, marginal dependence graphs. Mijares (left) and Voltoya–Serones reservoir (right). Graphs obtained using HUGIN Expert software version 7.3 [9,10].
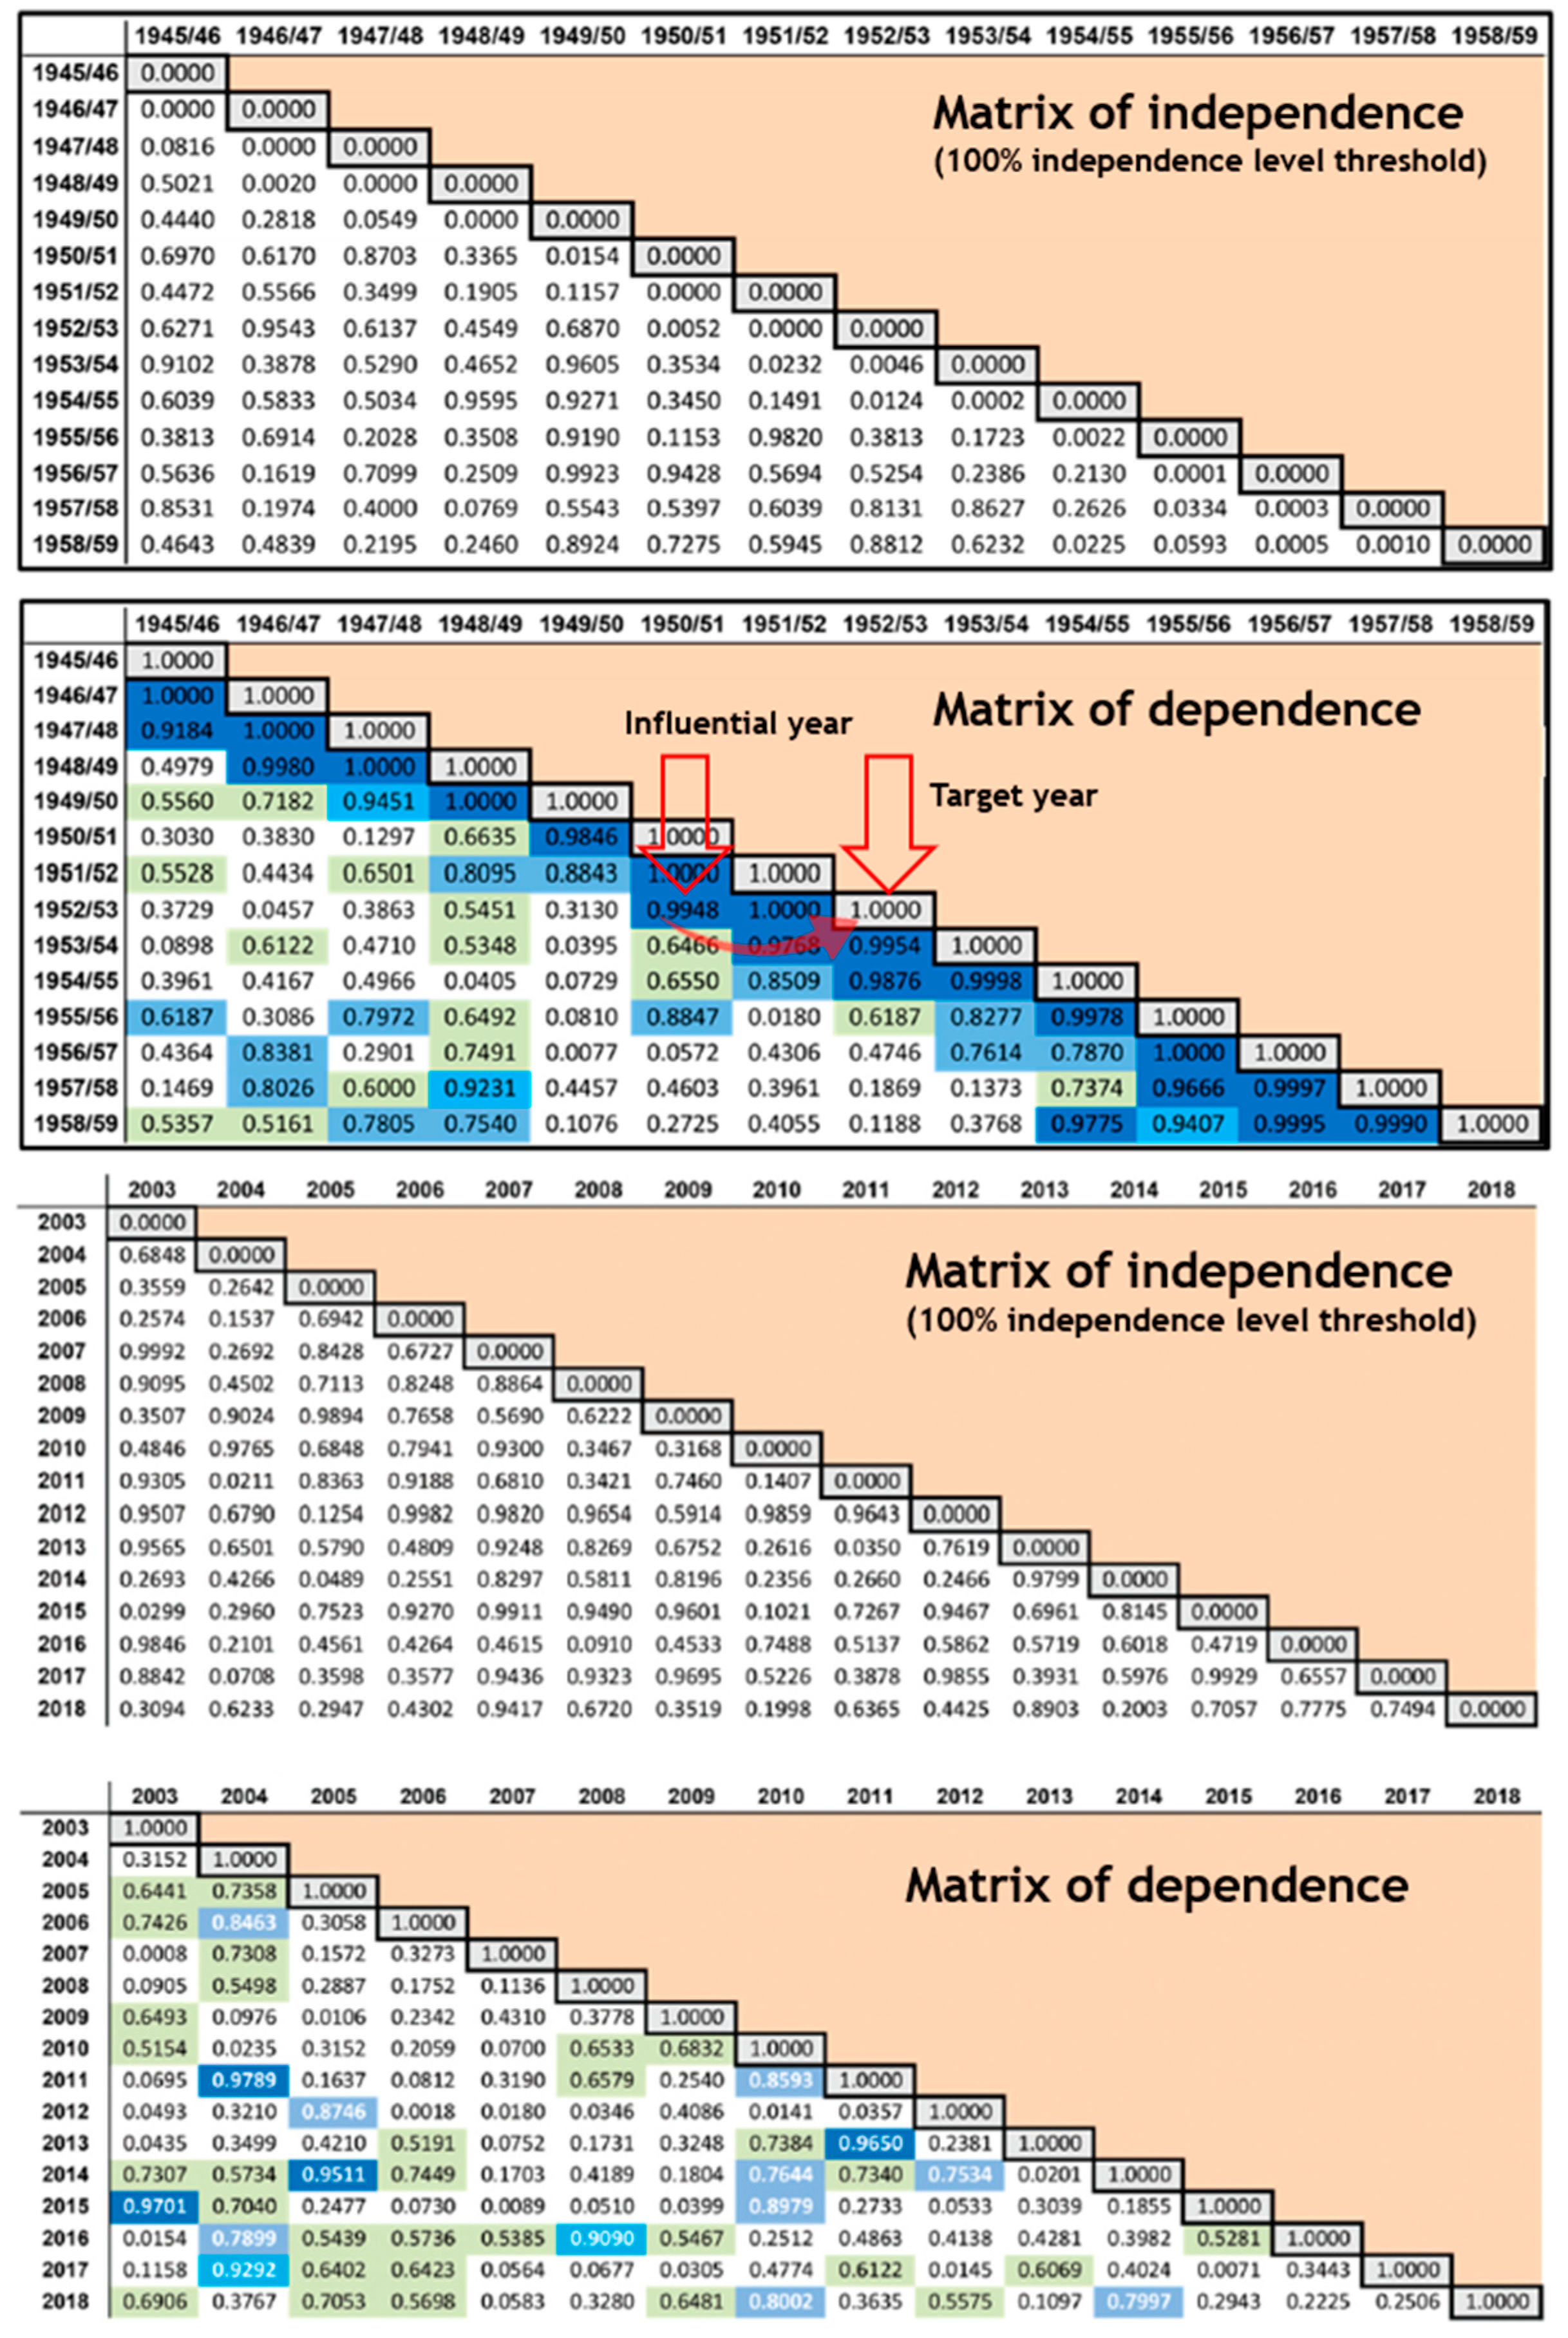
4.3.2. Dependence Matrixes
Figure 5 summarizes the resulting matrices obtained from the BC. From the main diagonal, which represents a target year, each row indicates the influence that a previous year has on it.
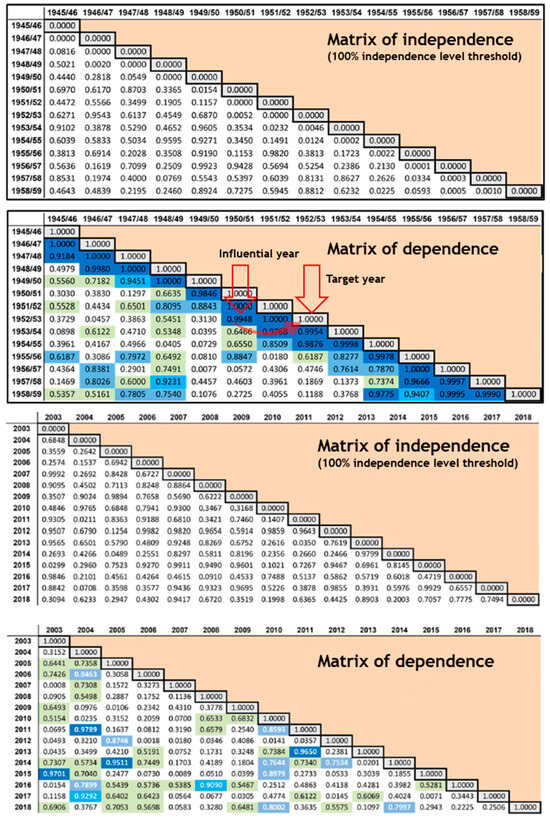
Figure 5.
Independence matrices (the values are p_value). Dependence matrices (the values are DRs). Please see Table 1 for code of color. Mijares (upper) and Voltoya–Serones reservoir (lower) [9,10].
The higher dependences are shown in the Mijares River, for the lags 1 and 2, which highlights a significant influence in the short term. This higher “dependence signal” is in line with the significant influence of the TCR fraction. On the contrary, a lower dependence shows a relevant influence of the TNCR fraction in the runoff (Table 3).
Table 3.
Internal assessment of predictive models.
Table 3 synthesizes the quantitative assessment of temporarily conditional fractions, highlighting the stability of the results in the case of the Voltoya River. In this case, this persistence pattern would suggest a stable behavior over time, which might determine the availability of water resources in the short and medium term. The internal structure of temporal dependence would suggest a major influence of one of the two fractions, which would justify the differentiated behavior of the TNCR fraction in both cases. It should be noted that the fraction with the most influence is the one that would condition the overall runoff behavior.
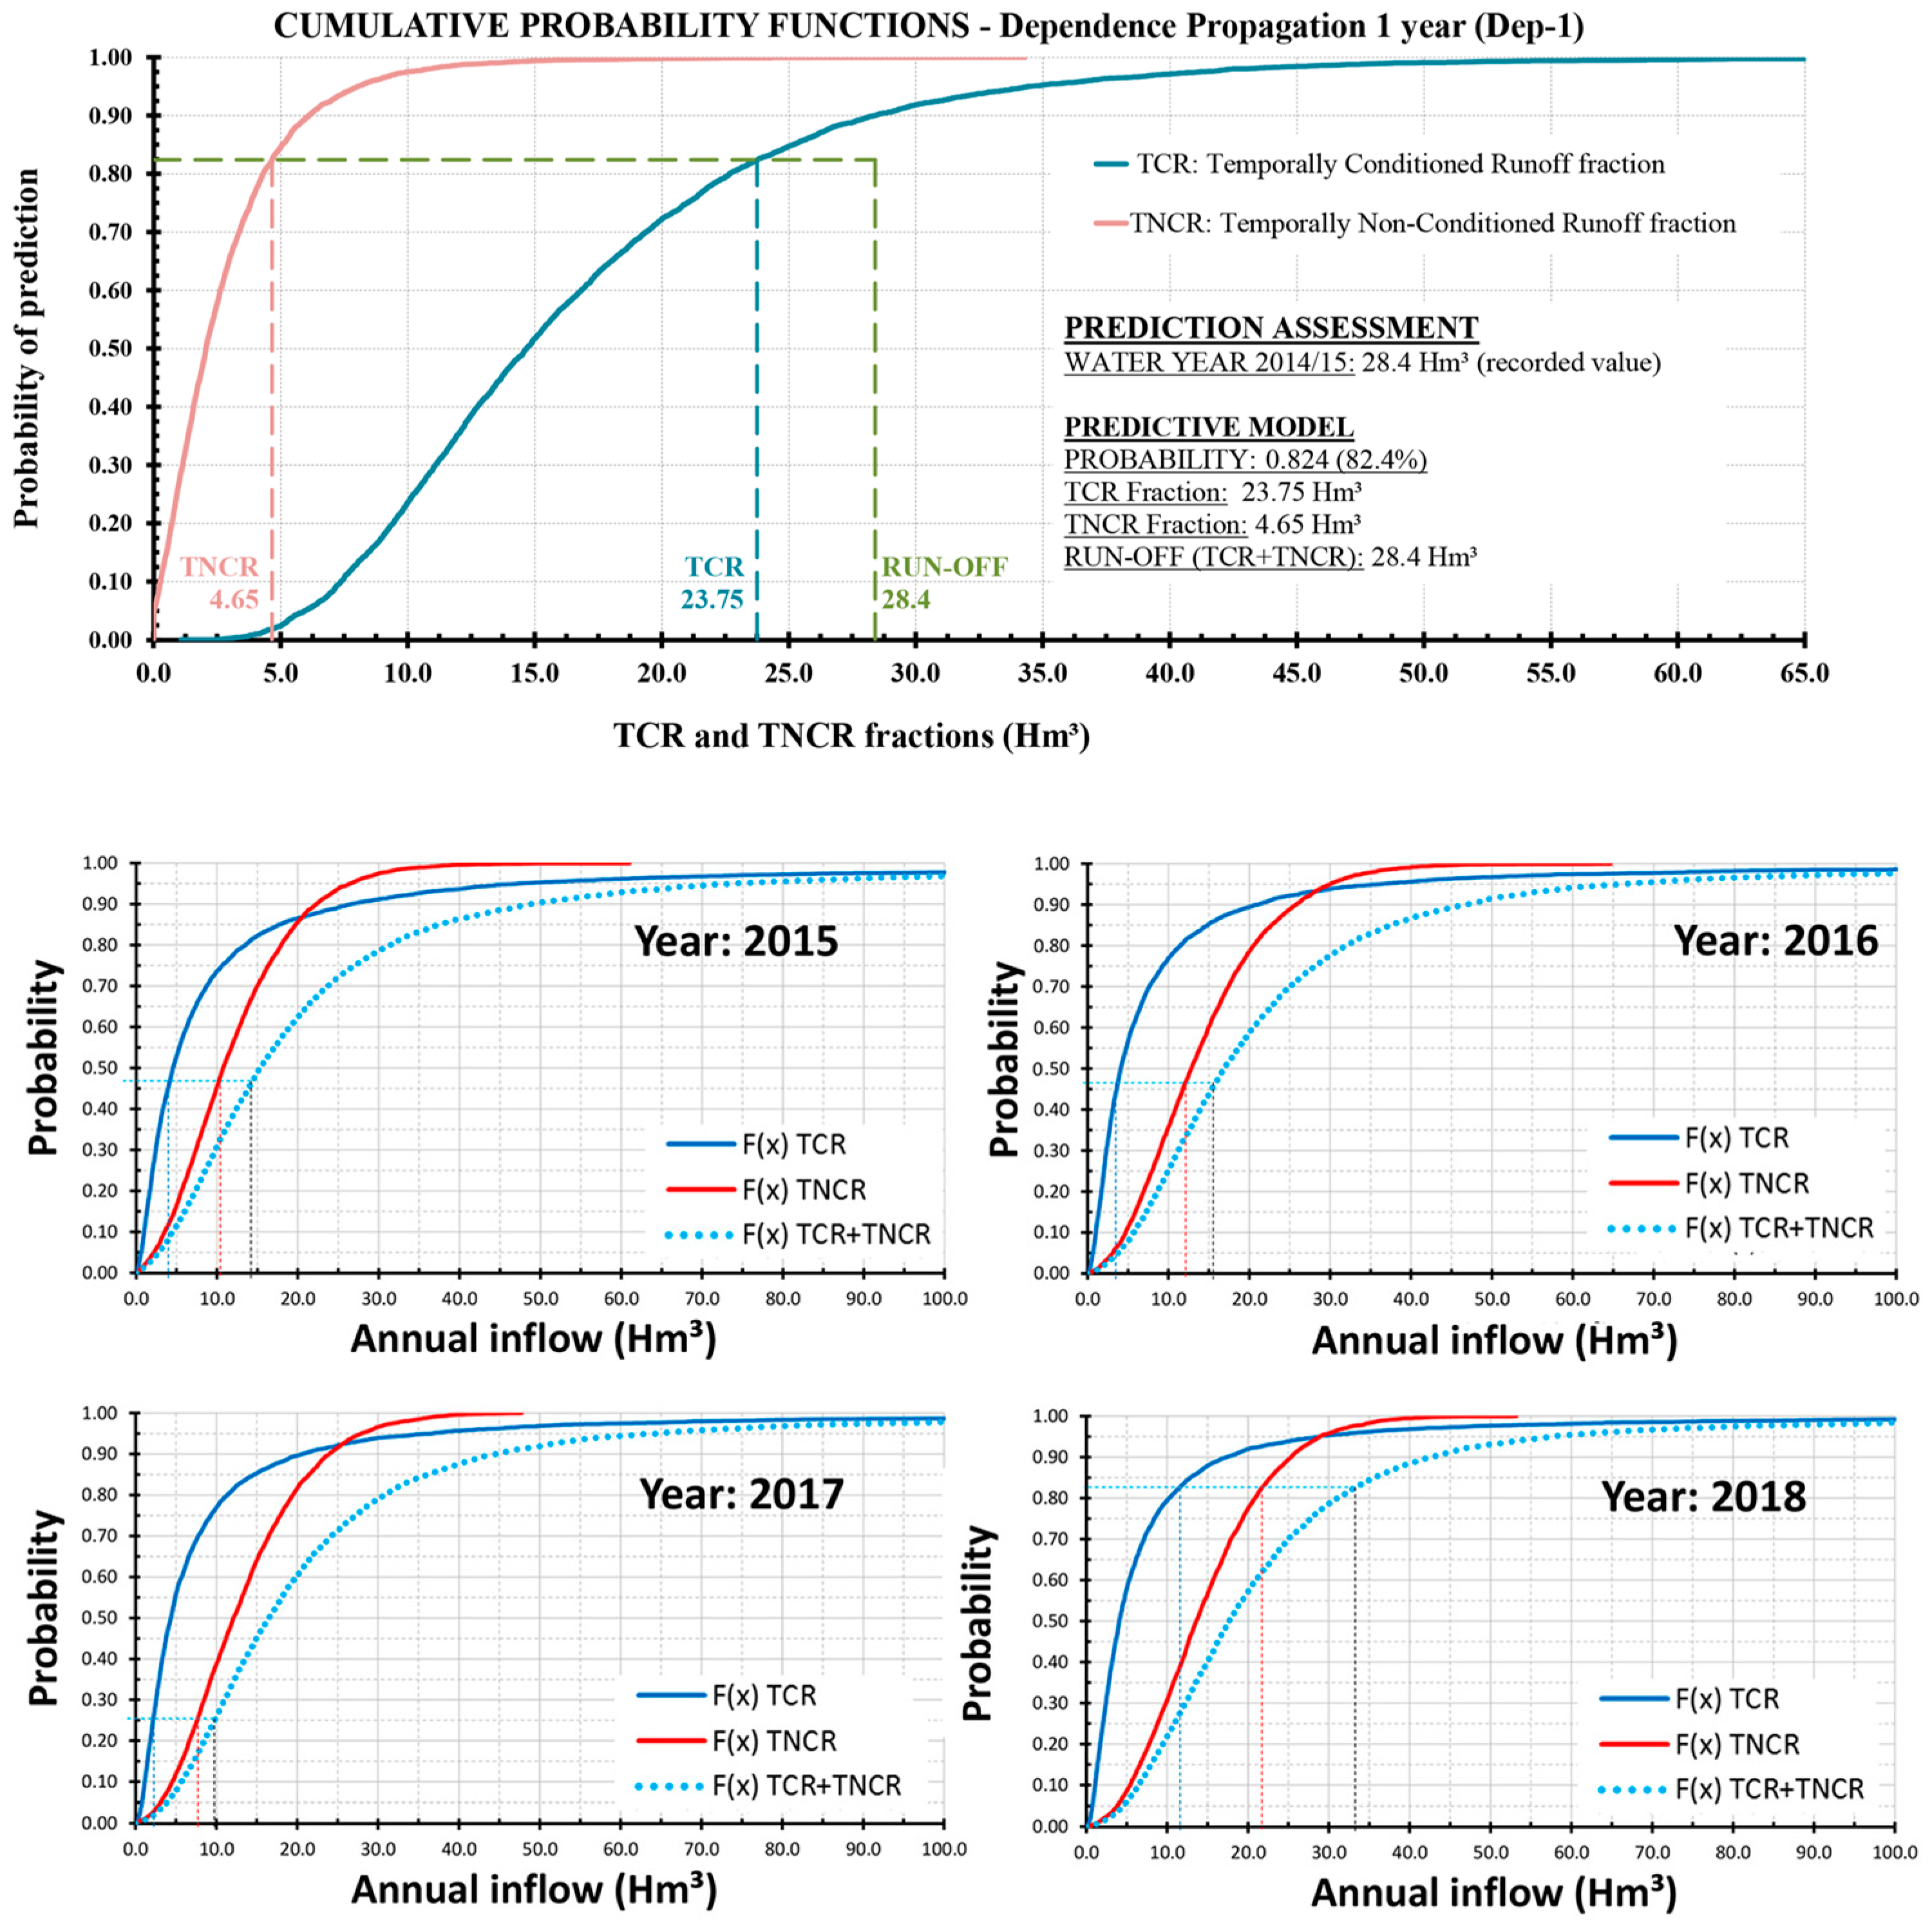
4.4. Predictive Modelling
Figure 6 shows the potential of BC for annual runoff forecasting, where it is highlighted that the fraction that has the most influence is the one with the lowest slope. If the TNCR fraction is significant (as in the Voltoya River), this would have important implications for water resources management and reservoir dimensioning.
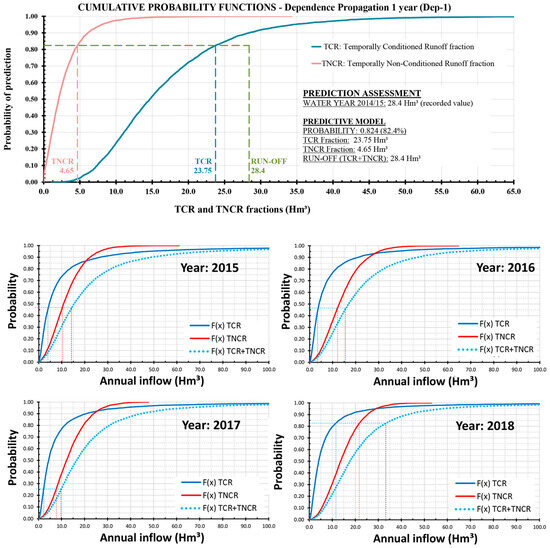
Figure 6.
Predictive models. F(x): cumulative probability functions [9,10].
Table 4 summarizes the analysis of the prediction in the case of the Mijares River, and Table 5 shows the reliability of the predictive models in the case of the Voltoya River.
Table 4.
Mijares River (dependent basin). Analysis of the forecast.
Table 5.
Voltoya River (independent basin). Forecast reliability.
5. Discussion and Conclusions
BC provides a more detailed understanding of the temporal behavior of the system, due to the discovery of the relationships that define the logical temporal dependence structure, which is hidden in the hydrological runoff records. This analysis is carried out dynamically on all the decision variables of the process, efficiently detecting nontrivial relationships (time lag >1). The predictive performance achieved is also remarkable, even in hydrographic basins with clearly independent temporal behavior.
On the other hand, BC makes it possible to discover and quantify, within a runoff series, two opposite temporal fractions (TCR and TNCR), as well as a characteristic and differentiated “dependence signal”, highlighted in both case studies. This persistence of the “signal” over time would suggest a stable behavior of water resources, which might determine the availability of water resources in the short and medium term, with special incidence in the case of independent temporal behavior.
Finally, both fractions (TCR and TNCR) can serve as a basis for the development of effective water resources management strategies, as well as a novel indicator for assessing the adequacy and reliability of a basin for satisfying water demands, since the systems where TNCR is dominant may have greater problems of prediction and reliability of their potential water resources.
Author Contributions
S.Z. and J.-L.M. conceived, designed, and led the research. All authors made the research conceptualization and analytical development. C.P.-A. conducted the statistical development of the models, F.E. and J.C.G.-P. performed the analysis of the historical data. All research works were supervised by S.Z. and J.-L.M. The Discussion and Conclusions sections were addressed by all authors. All authors have read and agreed to the published version of the manuscript.
Funding
Research developed within the SID_REDES project TED2021-129478B-I00, and SOGECAL project PID2022-142299OB-I00, supported by the Ministry of Science and Innovation of Spain.
Institutional Review Board Statement
Not applicable.
Informed Consent Statement
Not applicable.
Data Availability Statement
The datasets are available from the corresponding author upon reasonable request.
Acknowledgments
The authors thank the University of Salamanca for the facilities made available to undertake this research.
Conflicts of Interest
The authors declare no conflicts of interest. The funders had no role in the design of the study; in the collection, analyses, or interpretation of data; in the writing of the manuscript; or in the decision to publish the results.
References
- Molina, J.L.; Zazo, S. Assessment of Temporally Conditioned Runoff Fractions in Unregulated Rivers. J. Hydrol. Eng. 2018, 23, 04018015. [Google Scholar] [CrossRef]
- Rubio-Martin, A.; Llario, F.; Garcia-Prats, A.; Macian-Sorribes, H.; Macian, J.; Pulido-Velazquez, M. Climate Services for Water Utilities: Lessons Learnt from the Case of the Urban Water Supply to Valencia, Spain. Clim. Serv. 2023, 29, 100338. [Google Scholar] [CrossRef]
- Suárez Almiñana, S. Incorporación de Las Predicciones Meteorológicas y Climáticas en la Planificación y Gestión de Las Sequías. Aplicación a la Cuenca del Júcar. Doctoral Thesis, Universitat Politècnica de València, Valencia, Spain, 7 September 2021. [Google Scholar]
- O’Gorman, P.A. Precipitation Extremes Under Climate Change. Curr. Clim. Chang. Rep. 2015, 1, 49–59. [Google Scholar] [CrossRef] [PubMed]
- Marotzke, J.; Jakob, C.; Bony, S.; Dirmeyer, P.A.; O’Gorman, P.A.; Hawkins, E.; Perkins-Kirkpatrick, S.; Le Quere, C.; Nowicki, S.; Paulavets, K.; et al. Climate Research must Sharpen its View. Nat. Clim. Chang. 2017, 7, 89–91. [Google Scholar] [CrossRef] [PubMed]
- Battistelli, F.; Messina, A.; Tomassetti, L.; Montiroli, C.; Manzo, E.; Torre, M.; Tratzi, P.; Segreto, M.; Chu, C.; Paolini, V. Assessment of Energy, Mobility, Waste, and Water Management on Italian Small Islands. Sustainability 2023, 15, 11490. [Google Scholar] [CrossRef]
- Ali, E.; Cramer, W.; Carnicer, J.; Georgopoulou, E.; Hilmi, N.; Le Cozannet, G.; Lionello, P. Cross-Chapter Paper 4: Mediterranean Region, Climate Change 2022. In Impacts, Adaptation and Vulnerability; Contribution of Working Group II to the Sixth Assessment Report of the Intergovernmental Panel on Climate Change; IPCC: Cambridge, UK; New York, NY, USA, 2022. [Google Scholar]
- Zazo, S.; Molina, J.L.; Ruiz-Ortiz, V.; Vélez-Nicolás, M.; García-López, S. Modeling River Runoff Temporal Behavior through a Hybrid Causal–Hydrological (HCH) Method. Water 2020, 12, 3137. [Google Scholar] [CrossRef]
- Zazo, S.; Molina, J.L.; Macian-Sorribes, H.; Pulido-Velazquez, M. Assessment of the Predictability of Inflow to Reservoirs through Bayesian Causality. Hydrol. Sci. J. 2023, 68, 1323–1337. [Google Scholar] [CrossRef]
- Molina, J.L.; Zazo, S.; Martín-Casado, A.M. Causal Reasoning: Towards Dynamic Predictive Models for Runoff Temporal Behavior of High Dependence Rivers. Water 2019, 11, 877. [Google Scholar] [CrossRef]
- Macian-Sorribes, H.; Molina, J.L.; Zazo, S.; Pulido-Velázquez, M. Analysis of Spatio-Temporal Dependence of Inflow Time Series through Bayesian Causal Modelling. J. Hydrol. 2020, 597, 125722. [Google Scholar] [CrossRef]
- Zazo, S.; Martín, A.; Molina, J.L.; Macian-Sorribes, H.; Pulido-Velázquez, M. Performance Assessment of Bayesian Causal Modelling for Runoff Temporal Behaviour through a Novel Stability Framework. J. Hydrol. 2022, 610, 127832. [Google Scholar] [CrossRef]
- Solans, M.A.; Macian-Sorribes, H.; Martinez-Capel, F.; Pulido-Velazquez, M. Vulnerability Assessment for Climate Adaptation Planning in a Mediterranean Basin. Hydrol. Sci. J. 2024, 69, 21–45. [Google Scholar] [CrossRef]
- Salas, J.D.; Delleur, J.W.; Yevjevich, V.; Lane, W.L. Applied Modeling of Hydrologic Time Series, 1st ed.; Water Resources Publications: Littleton, CO, USA, 1980; p. 484. [Google Scholar]
- Molina, J.L.; Zazo, S.; Rodriguez-Gonzalvez, P.; Gonzalez-Aguilera, D. Innovative Analysis of Runoff Temporal Behavior through Bayesian Networks. Water 2016, 8, 484. [Google Scholar] [CrossRef]
- Madsen, A.L.; Lang, M.; Kjaerulff, U.B.; Jensen, F. The Hugin Tool for Learning Bayesian Networks. In Proceedings of the European Conference on Symbolic and Quantitative Approaches to Reasoning and Uncertainty, Aalborg, Denmark, 2–5 July 2003; Springer: Berlin, Germany, 2003; Volume 2711, pp. 594–605. [Google Scholar]
- Zazo, S.; Macian-Sorribes, H.; Sena-Fael, C.M.; Martín-Casado, A.M.; Molina, J.L.; Pulido-Velazquez, M. Qualitative Approach for Assessing Runoff Temporal Dependence through Geometrical Symmetry. In Proceedings of the Internacional Congress on Engineering, Engineering for Evolution (ICEUBI2019), Covilhã, Portugal, 27–29 November 2019. [Google Scholar]
Disclaimer/Publisher’s Note: The statements, opinions and data contained in all publications are solely those of the individual author(s) and contributor(s) and not of MDPI and/or the editor(s). MDPI and/or the editor(s) disclaim responsibility for any injury to people or property resulting from any ideas, methods, instructions or products referred to in the content. |
© 2024 by the authors. Licensee MDPI, Basel, Switzerland. This article is an open access article distributed under the terms and conditions of the Creative Commons Attribution (CC BY) license (https://creativecommons.org/licenses/by/4.0/).