Proceeding Paper

Admittance Matrix Method for Modeling Transients in a Laboratory Water Network †

1
Department of Civil and Environmental Engineering, University of Perugia, 06125 Perugia, Italy
2
School of Civil, Environmental and Mining Engineering, University of Adelaide, Adelaide, SA 5005, Australia
*
Author to whom correspondence should be addressed.
Presented at the 3rd International Joint Conference on Water Distribution Systems Analysis & Computing and Control for the Water Industry (WDSA/CCWI 2024), Ferrara, Italy, 1–4 July 2024.
Eng. Proc. 2024, 69(1), 116; https://doi.org/10.3390/engproc2024069116
Published: 10 September 2024

Abstract

:
This paper presents an innovative application of the admittance matrix method for modeling the transient response of a real laboratory pipeline network: a two-loop district metered area (DMA) setup at the University of Perugia’s Water Engineering Laboratory comprising high-density polyethylene (HDPE) pipes. By employing the admittance matrix method, the computational efficiency of the modeling process is significantly enhanced. Our findings underscore the importance of considering viscoelastic parameters calibrated by a genetic algorithm to optimize the simulation of experimental data. The outcomes demonstrate a robust methodology capable of capturing the nuanced behaviors of complex water distribution systems, providing a critical tool for engineers and researchers in the field.

1. Introduction

The hydraulic transient governing equations for water hammer, i.e., continuity and momentum equations, are a set of quasi-linear, hyperbolic partial differential equations that can be solved in either the time or frequency domain. One of the most widely used time-domain methods is the Method of Characteristics (MoC), which has the great advantage of incorporating nonlinearities; however, the time–space grid required for integration can make the convergence process slow and create the need for numerical approximations. Frequency-domain methods can overcome these disadvantages by speeding up the computation, but at the cost of the linearization of the nonlinear wall shear relationships, which is necessary for the frequency-domain solution. For simple systems, the choice between the models is fairly neutral. On the contrary, for complex systems, frequency-domain models offer an interesting trade-off between accuracy and speed. In particular, the admittance matrix method exploits graph theoretic concepts to organize the 1-D transient governing equations, perturbed, linearized, and solved in the frequency domain, in a matrix form that deals only with nodal variables [1,2]. In this work, such a method is used to model transients in the water network installed at the Water Engineering Laboratory (WEL) of the University of Perugia [3]. This experimental setup consists of a laboratory-scale district metered area (DMA) with two loops. Since all the pipes are made of high-density polyethylene (HDPE), the ability of the model to calibrate the viscoelastic parameters is tested [4]. Viscoelasticity, in fact, plays an important role, since it significantly affects the dynamic response of the system during transients, reflecting in a faster damping with respect to the elastic pipeline material case and added smoothing effects [5]. The use of plastic pipes has indeed increased in the last decades due to their reduced weight and cost of both production and transport, as well as the ease of installation. Consequently, the presence of plastic pipes in water distribution systems is noteworthy and must be taken into consideration when modeling them, especially in unsteady flow conditions. This work paves the way for modelling transients in more complex systems, which can be an additional tool for, detecting transient sources in water distribution networks [6].

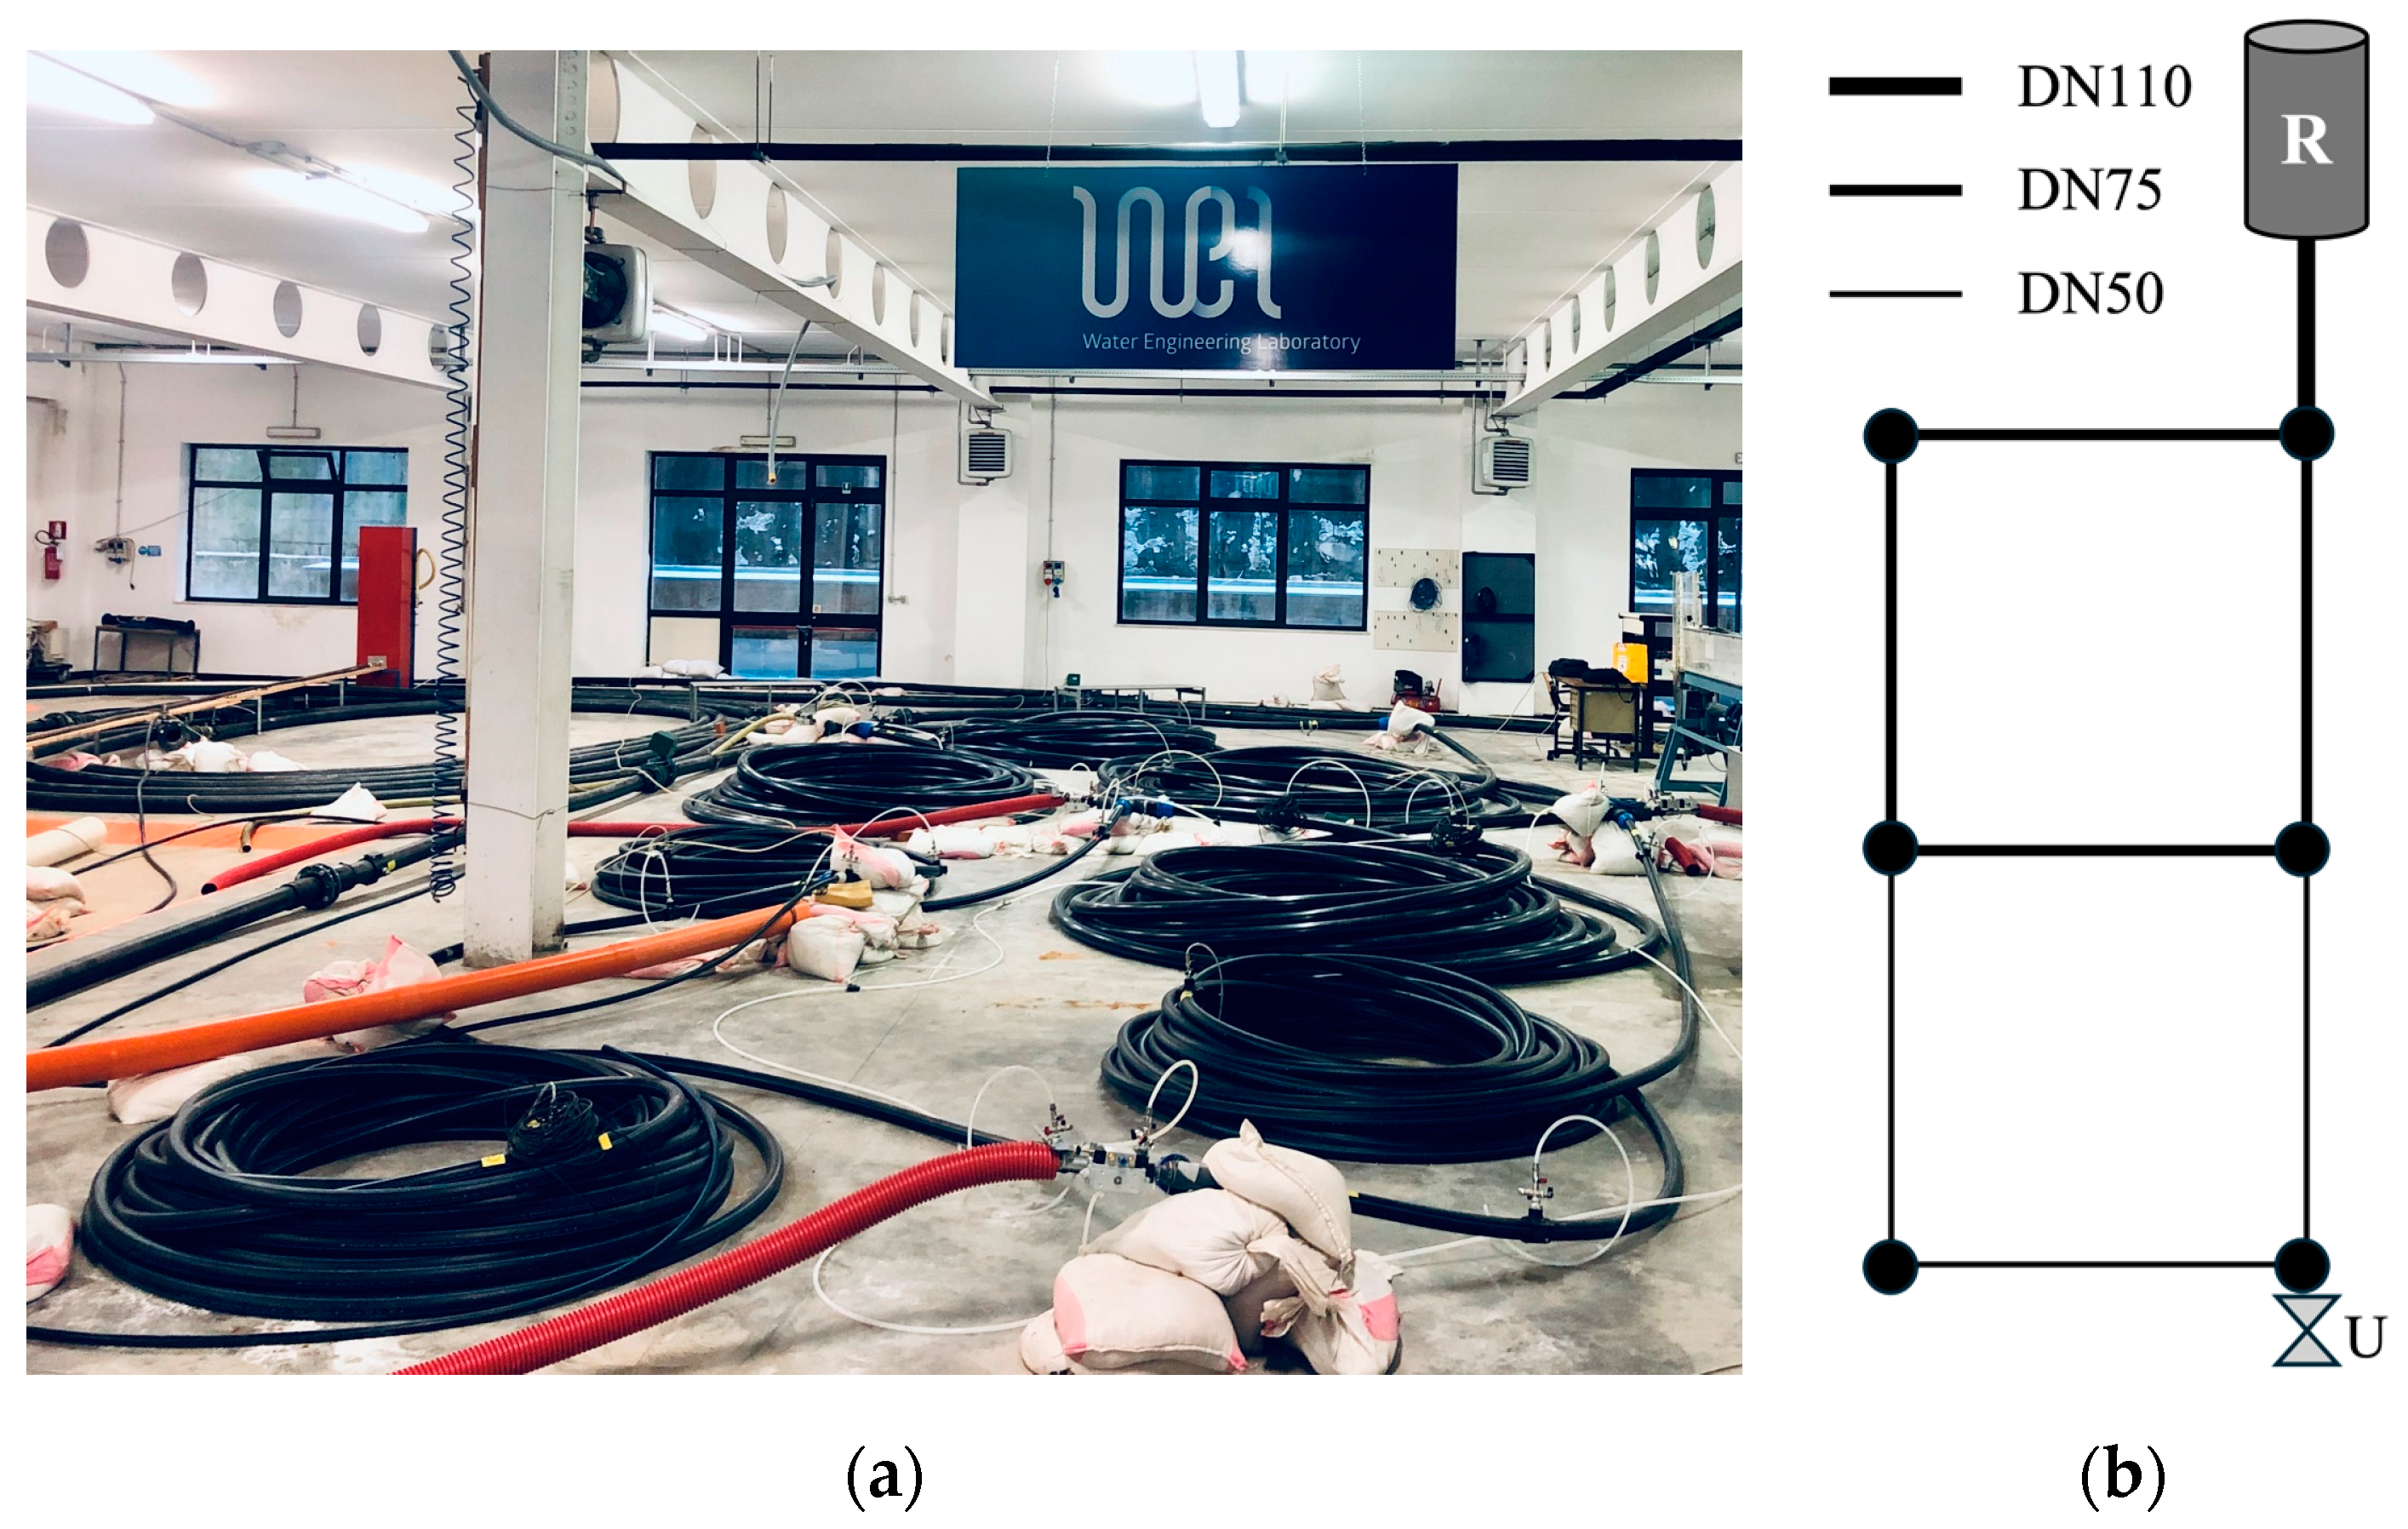
2. Laboratory Setup and Transient Test

The laboratory setup considered is a two-loop DMA installed at the Water Engineering Laboratory at the University of Perugia (Figure 1a). The system is supplied by a reservoir, R, as shown in Figure 1b, through a DN110 pipe with a length of 42.3 m. The first loop consists of four DN75 pipes, each 100 m long; the second loop has a link in common with the first one; and the other three pipes, each 100 m long, have a nominal diameter, DN50. It is noteworthy that all the pipes are made of high-density polyethylene (HDPE). The transient pressure wave speed values have been estimated in previous studies and are 398.82 m/s for the DN110 pipe, 387.89 m/s for the DN75 ones, and 379.81 m/s for the DN50 pipes.
At the node indicated by U, a series of two valves is installed. Particularly, a pneumatic automatic valve is used to generate sharp and repeatable transient pressure waves, while a manual ball valve is used to regulate the initial steady-state flow, Q0. In this work, a transient test generated by the fast closure of the pneumatic valve for Q0 = 0.29 L/s is considered.

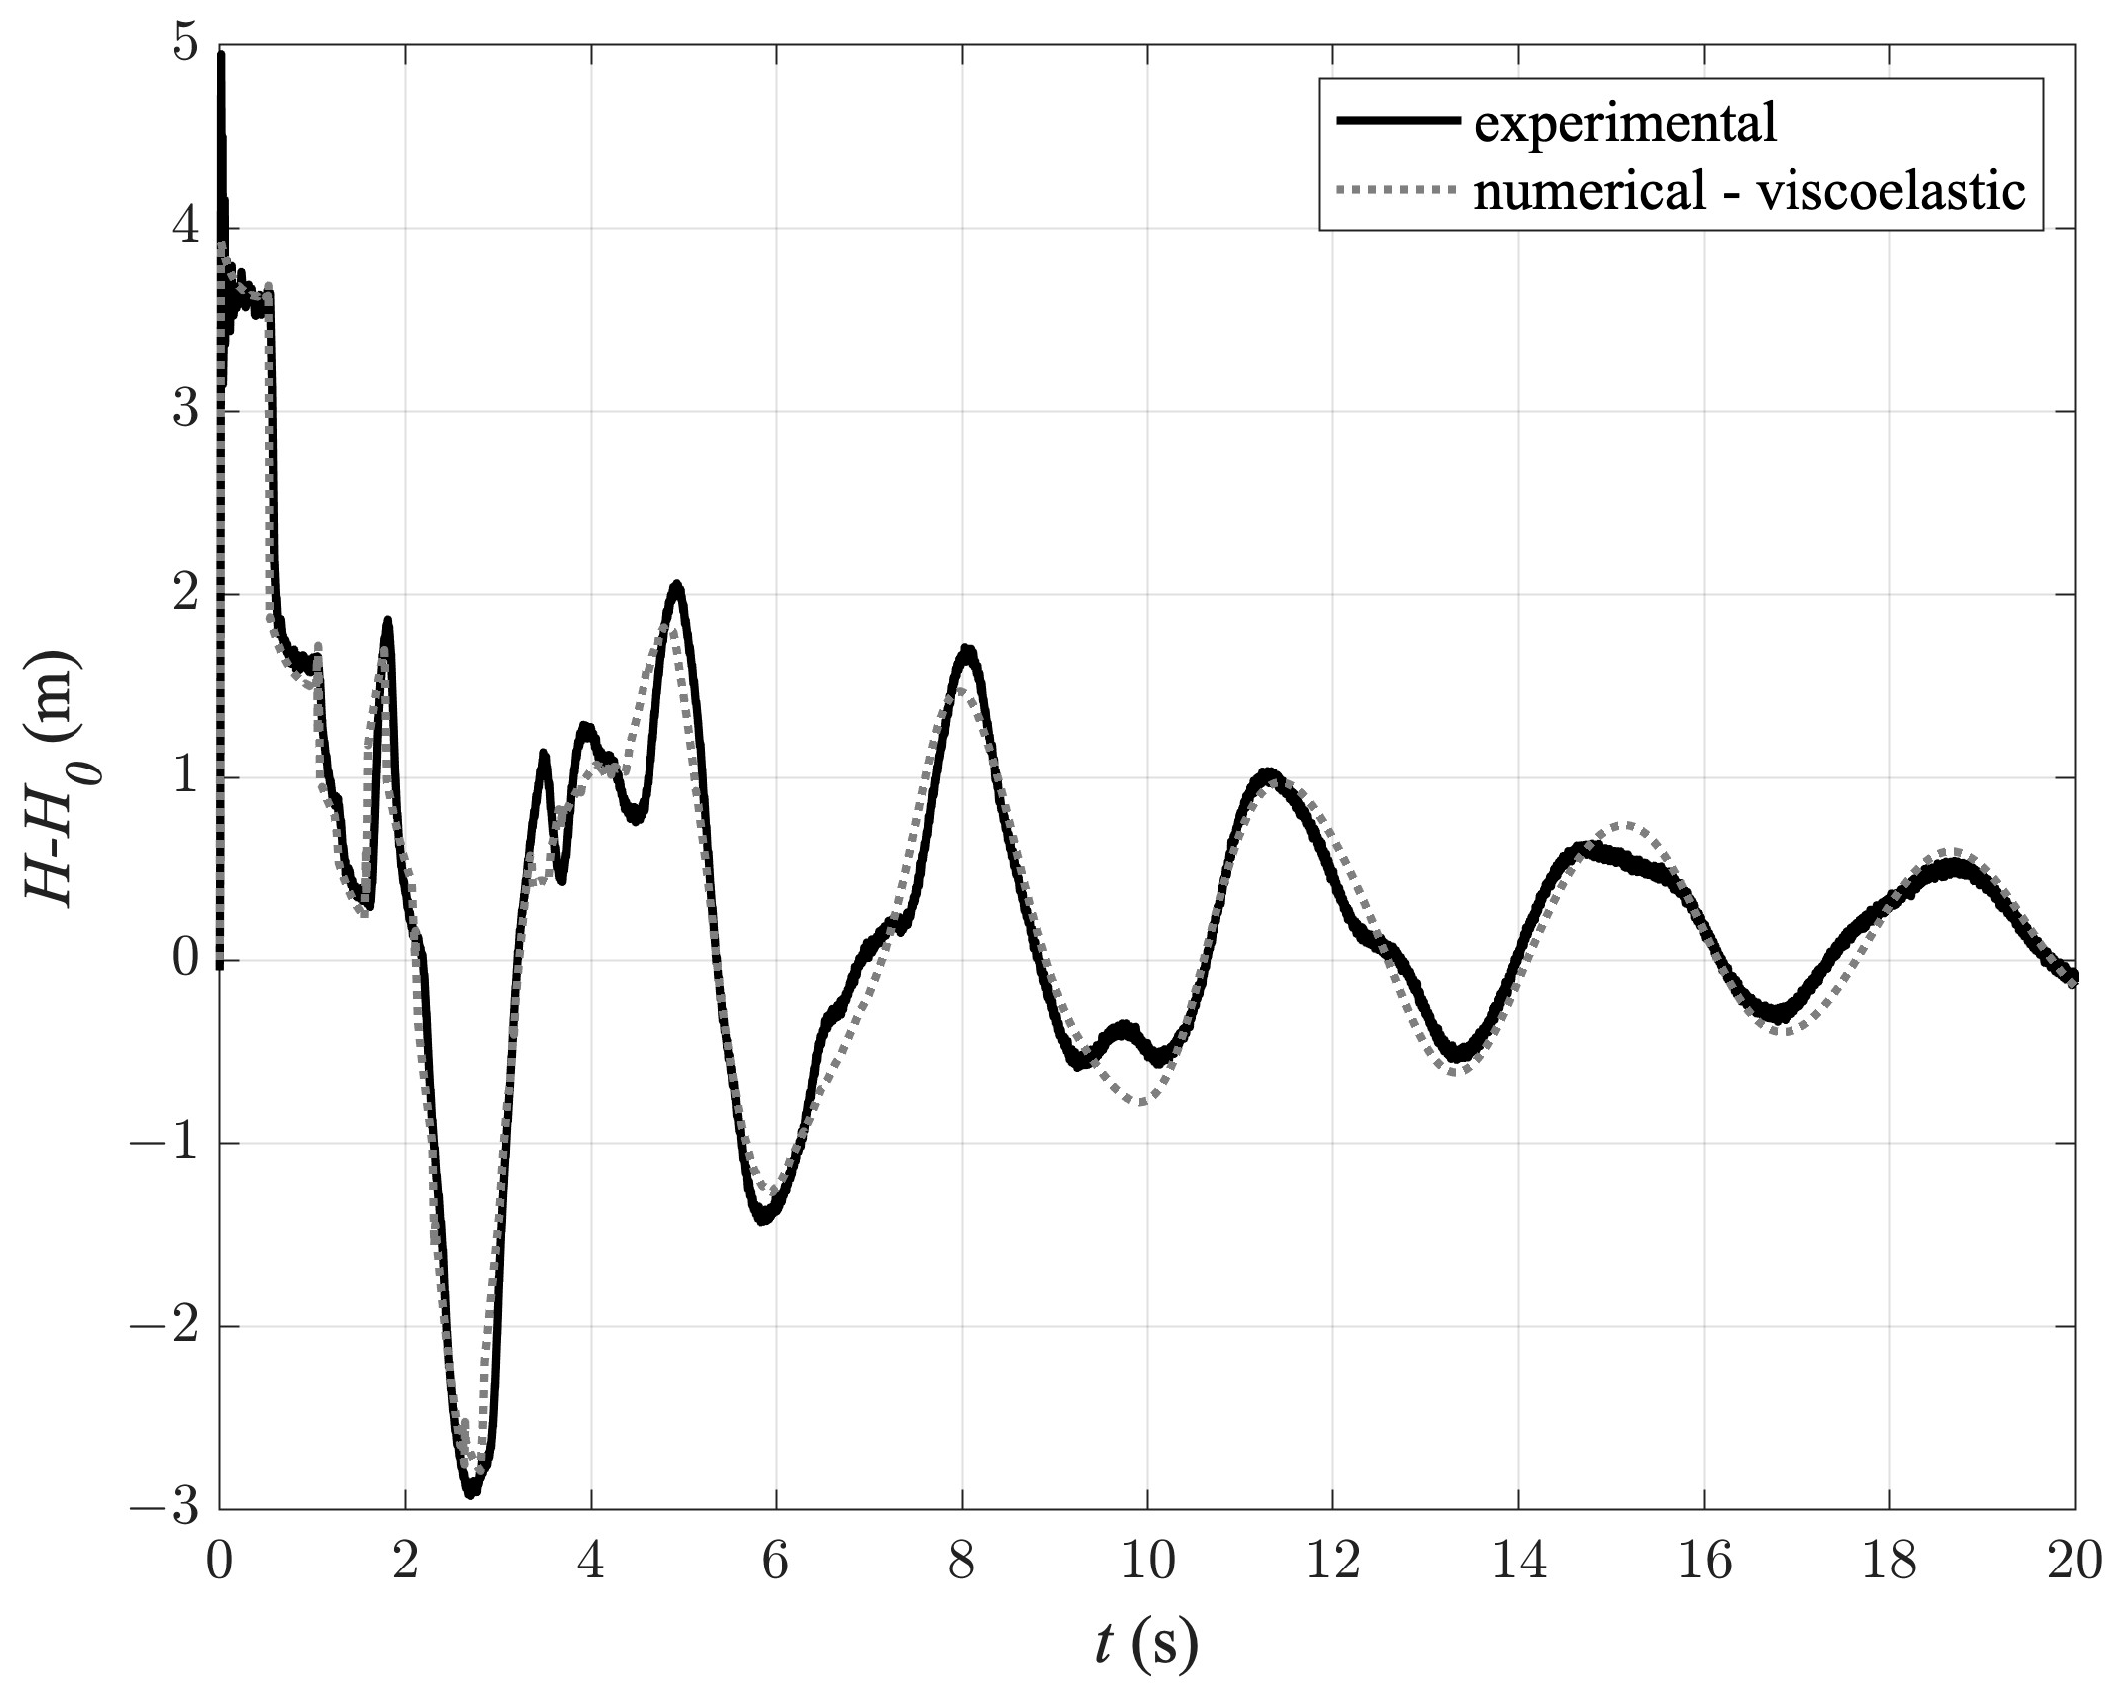
3. Frequency-Domain Modeling of Transient Test

Within the admittance matrix method, transient governing equations are organized in a matrix form, allowing the following relationship:
Θ ω = Y   ω Ψ ω
where Θ and Ψ are the vectors containing the nodal variables of flow and pressure, respectively, while ω is the angular frequency and Y is the admittance matrix containing the information regarding the topology of the system and its pipeline dynamics (i.e., the pressure to flow transfer functions for each link) [1].
If viscoelasticity is not included in the numerical model, and then an elastic response case is considered, the transient pressure trace, H-H0 (with the subscript 0 indicating the steady state pre-transient conditions), resulting from the model is shown in Figure 2 in comparison to the experimental case. It is evident that the numerical model in this case is not able to adequately capture the system dynamics since there is no agreement between the two signals [5]. To give an idea of such a difference between them, the following goodness-of-fit index is considered:
σ 2 = i = 1 n ( O i P i ) 2 n
where O (P) indicates the observed (predicted) data in a set of n samples. It is clear that the larger the σ2, the worse the goodness of the numerical simulation. In the comparison of Figure 2, a value σ2 = 1.013 m2 is obtained.
Instead, if viscoelasticity is included through a Kelvin–Voigt model for the pipe wall material, the numerical simulation results are actually highly representative of the observed system dynamics (Figure 3). In this study, a single element Kelvin–Voigt model, with viscosity coefficient, ηR, and Young’s modulus, ER, is used and assumed equal for all the pipes of the system. To estimate the parameters of the Kelvin–Voigt model, a genetic algorithm is utilized, minimizing the objective function of Equation (2), to optimize the numerical simulation performance subject to varying these parameters. For the sake of brevity, the details of the genetic algorithm setting are not described in detail. After a ten-generation optimization, the set of parameters ηR = 9.47 × 10⁸ Pa s and ER = 4.71 × 10⁹ Pa are obtained, with σ2 = 0.017 m2.

4. Conclusions

In this work, a preliminary study on the frequency-domain simulation of a two-loop laboratory DMA is presented with the aim of viscoelastic parameter calibration. The traditional elastic transient models often struggle with the complexity of plastic pipes, which dampen pressure waves more rapidly than elastic materials. On the contrary, the use of a Kelvin–Voigt (KV) model allows us to capture the transient response of the high-density polyethylene pipe system. Irrespective of the fact that only a single element KV model is used and that a rough optimization is carried out, the numerical model performance is good.

Author Contributions

Conceptualization, C.C., D.F., B.B., A.Z. and S.M.; methodology, C.C., D.F., B.B., A.Z. and S.M.; software and validation, C.C., D.F., B.B., A.Z. and S.M.; data curation, C.C., D.F., B.B. and S.M.; writing—original draft preparation, C.C., D.F., B.B., A.Z. and S.M.; writing—review and editing, C.C., D.F., B.B., A.Z. and S.M.; funding acquisition, C.C., B.B. and S.M. All authors have read and agreed to the published version of the manuscript.

Funding

This research has been jointly supported by the University of Perugia “Fondi di ricerca di Ateneo-edizioni 2021 e 2022”; by the Ministry of University and Research (MUR) under the Project of Relevant Interest-PRIN2022—“Hybrid Transient--Machine Learning Approach for Anomaly Detection and Classification in Water Transmission Mains (TANDEM)” (CUP: J53D23002110006). Finally, the Authors would like to thank the European Commision, MUR (Italy), Fapesc (Brazil), and FCT (Portugal) for funding in the frame of the collaborative international consortium MORE4WATER financed under the 2022 Joint call of the European Partnership 101060874—Water4all.

Institutional Review Board Statement

Not applicable.

Informed Consent Statement

Not applicable.

Data Availability Statement

The data that support this study are available upon request from the corresponding author.

Conflicts of Interest

The authors declare no conflicts of interest.

References

  1. Zecchin, A.C.; Simpson, A.R.; Lambert, M.F.; White, L.B.; Vítkovský, J.P. Transient modeling of arbitrary pipe networks by a Laplace-domain admittance matrix. J. Eng. Mech. 2009, 135, 538–547. [Google Scholar] [CrossRef]
  2. Capponi, C.; Ferrante, M.; Zecchin, A.C.; Gong, J. Leak detection in a branched system by inverse transient analysis with the admittance matrix method. Water Resour. Manag. 2017, 31, 4075–4089. [Google Scholar] [CrossRef]
  3. Meniconi, S.; Maietta, F.; Alvisi, S.; Capponi, C.; Marsili, V.; Franchini, M.; Brunone, B. Consumption Change-Induced Transients in a Water Distribution Network: Laboratory Tests in a Looped System. Water Resour. Res. 2022, 58, e2021WR031343. [Google Scholar] [CrossRef]
  4. Tjuatja, V.; Keramat, A.; Pan, B.; Duan, H.F.; Brunone, B.; Meniconi, S. Transient flow modeling in viscoelastic pipes: A comprehensive review of literature and analysis. Phys. Fluids 2023, 35, 081302. [Google Scholar] [CrossRef]
  5. Pezzinga, G.; Brunone, B.; Cannizzaro, D.; Ferrante, M.; Meniconi, S.; Berni, A. Two-dimensional features of viscoelastic models of pipe transients. J. Hydraul. Eng. 2014, 140, 04014036. [Google Scholar] [CrossRef]
  6. Meniconi, S.; Rubin, A.; Tirello, L.; Doro, A.; Brunone, B.; Capponi, C. Mapping pressure surge source in urban water networks: Integrating low- and high-Frequency pressure data with an illustrative real case study. Water Resour. Res. 2024, 60, e2023WR036773. [Google Scholar] [CrossRef]
Figure 1. (a) DMA installed at the Water Engineering Laboratory; (b) a sketch of the system.
Engproc 69 00116 g001
Figure 2. Experimental transient pressure signal generated in the DMA installed at the WEL at node U compared to the numerical signal in the case of an elastic response.
Engproc 69 00116 g002
Figure 3. Experimental transient pressure signal generated in the DMA installed at the WEL at node U compared to the numerical signal in the case of a viscoelastic response.
Engproc 69 00116 g003
Disclaimer/Publisher’s Note: The statements, opinions and data contained in all publications are solely those of the individual author(s) and contributor(s) and not of MDPI and/or the editor(s). MDPI and/or the editor(s) disclaim responsibility for any injury to people or property resulting from any ideas, methods, instructions or products referred to in the content.

