Abstract
This research provides new understanding of the (re)growth of microorganisms within drinking water distribution networks. Flow cytometry data quantifying total and intact cell counts from consumers’ taps are currently rare, and its value for aiding understanding of the growth of microorganisms is unknown. In this study, changes in microbial concentrations from the treatment works to customers’ taps were measured (using flow cytometry) in two UK drinking water distribution networks. Throughout each network, five locations were sampled for five consecutive days within a week, and to assess seasonal impacts, this was repeated twice in each network. Significant growth of microorganisms was observed in both networks during autumn, particularly at higher-water-age taps. These results give novel emphasis to the active impact of the distribution system on microbiological growth by using flow cytometry data collected in a systematic way from treatment through to customers’ taps. Such understanding is essential to achieving the delivery of safe and aesthetically pleasing drinking water to customers.
1. Introduction
Achieving biological stability is essential to the delivery of safe and aesthetically pleasing drinking water. Uncontrolled (re)growth of microorganisms in drinking water supply systems (DWSSs) can deteriorate water quality and impact taste, color, and odor [1,2,3,4,5]. Water utilities are increasingly going beyond regulatory requirements of heterotrophic plate counts and using flow cytometry techniques to collect total and intact cell count data from treatment works and service reservoir outlets. However, this information is still limited at customer taps, and its significance for determining a system’s biological stability is unknown. This work aims to understand the value of measuring cell counts from tap water samples for assessing biological stability. It investigates the impact of water age and seasonality on (re)growth of microorganisms by sampling customer taps with a range of travel times during two periods of the year.
2. Materials and Methods
2.1. Sampling Point Selection
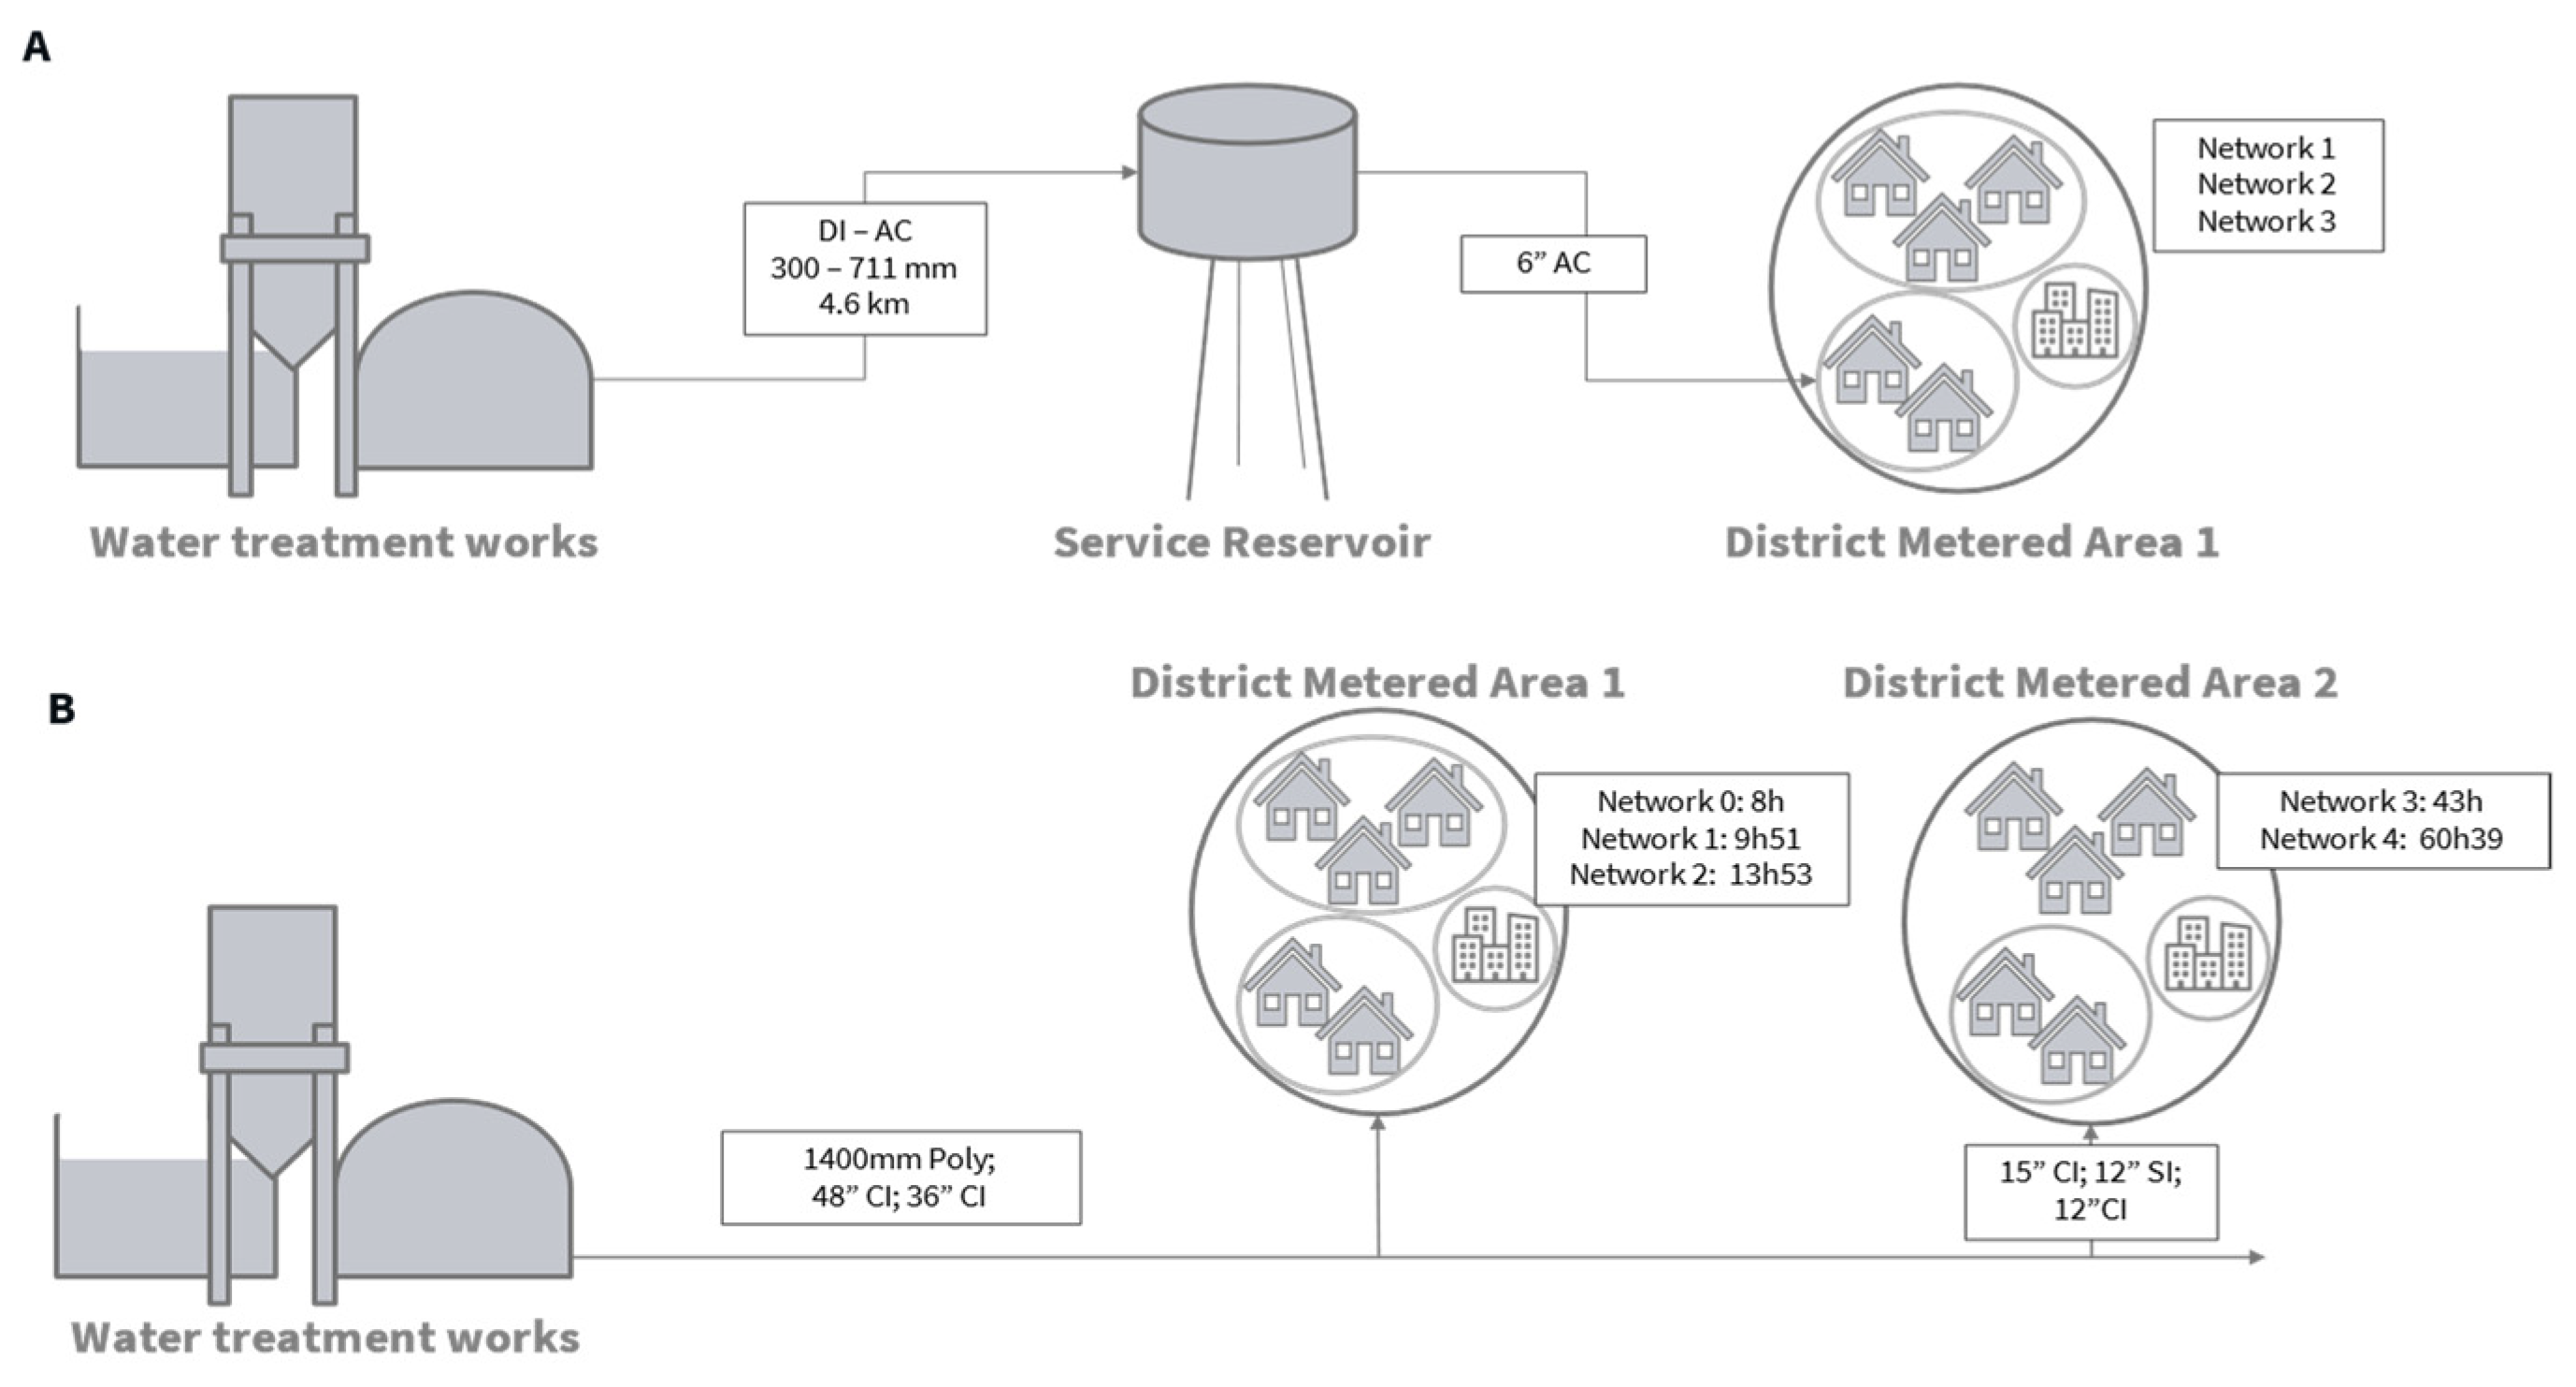
Two operational DWSSs (A and B) were selected in two different regions of the UK. In DWSS A, water is abstracted from a river and the water treatment process consists of coagulation, clarification, a rapid gravity filter, granular activated carbon adsorbers, and chlorine dosing. It has the capacity to treat 49 MLD. The service reservoir is located 4.6 km downstream with a total storage capacity of 2073 m3 of water and operational retention time of 19 h during summer and 20 h in winter. In DWSS B, water is abstracted from upland reservoirs, and treatment consists of coagulation, clarification filtration, and chlorination with the capacity to treat 230 MLD of water. For each network, maps and hydraulic models were studied to carefully select sampling points within district metered areas downstream of a single service reservoir and treatment works (Figure 1). Sample points consisted of the water treatment work’s final water, a service reservoir outlet in system A and 3 (DWSS A) or 4 (DWSS B) network points to cover young, medium, and older residence times for each network. In DWSS B, two older water taps (Networks 3 and 4, Figure 1B), were added to replace a younger one (Network 0) during the second round of sampling. Figure 1 displays an overview of both systems.

Figure 1.
Schematics of DWSS (A,B) displaying connectivity between sampling points. Estimated travel time and pipe length and diameter are indicated where known. DI: ductile iron, AC: asbestos cement, Poly: polyethylene, CI: cast iron, SI: spun iron.
2.2. Water Samples
For each DWSS, water samples were collected for five days (Monday–Friday) from all five of the selected points (Figure 1). This was repeated twice for each system at an approximately 3-month interval to capture seasonality (autumn/winter). Samples were collected in 500 mL sterile plastic bottles preprepared with sodium thiosulfate and transported to the University of Sheffield for microbiological analysis within 24–32 h. Free chlorine concentration and water temperature were measured on-site at the time of sampling.
2.3. Water Quality: Microbial Concentration and Viability
Total and intact cell counts (TCCs and ICCs) were measured in triplicate (n = 3) using the flow cytometry protocol described elsewhere [1]. Briefly, 500 µL samples were stained with SYBR Green I for total cells or SYBR Green I and propidium iodide for intact cells and incubated at 37 °C for 10 min. Measurements were performed using an Attune NxT flow cytometer (Thermo Fisher Scientific, Waltham, MA, USA).
3. Results
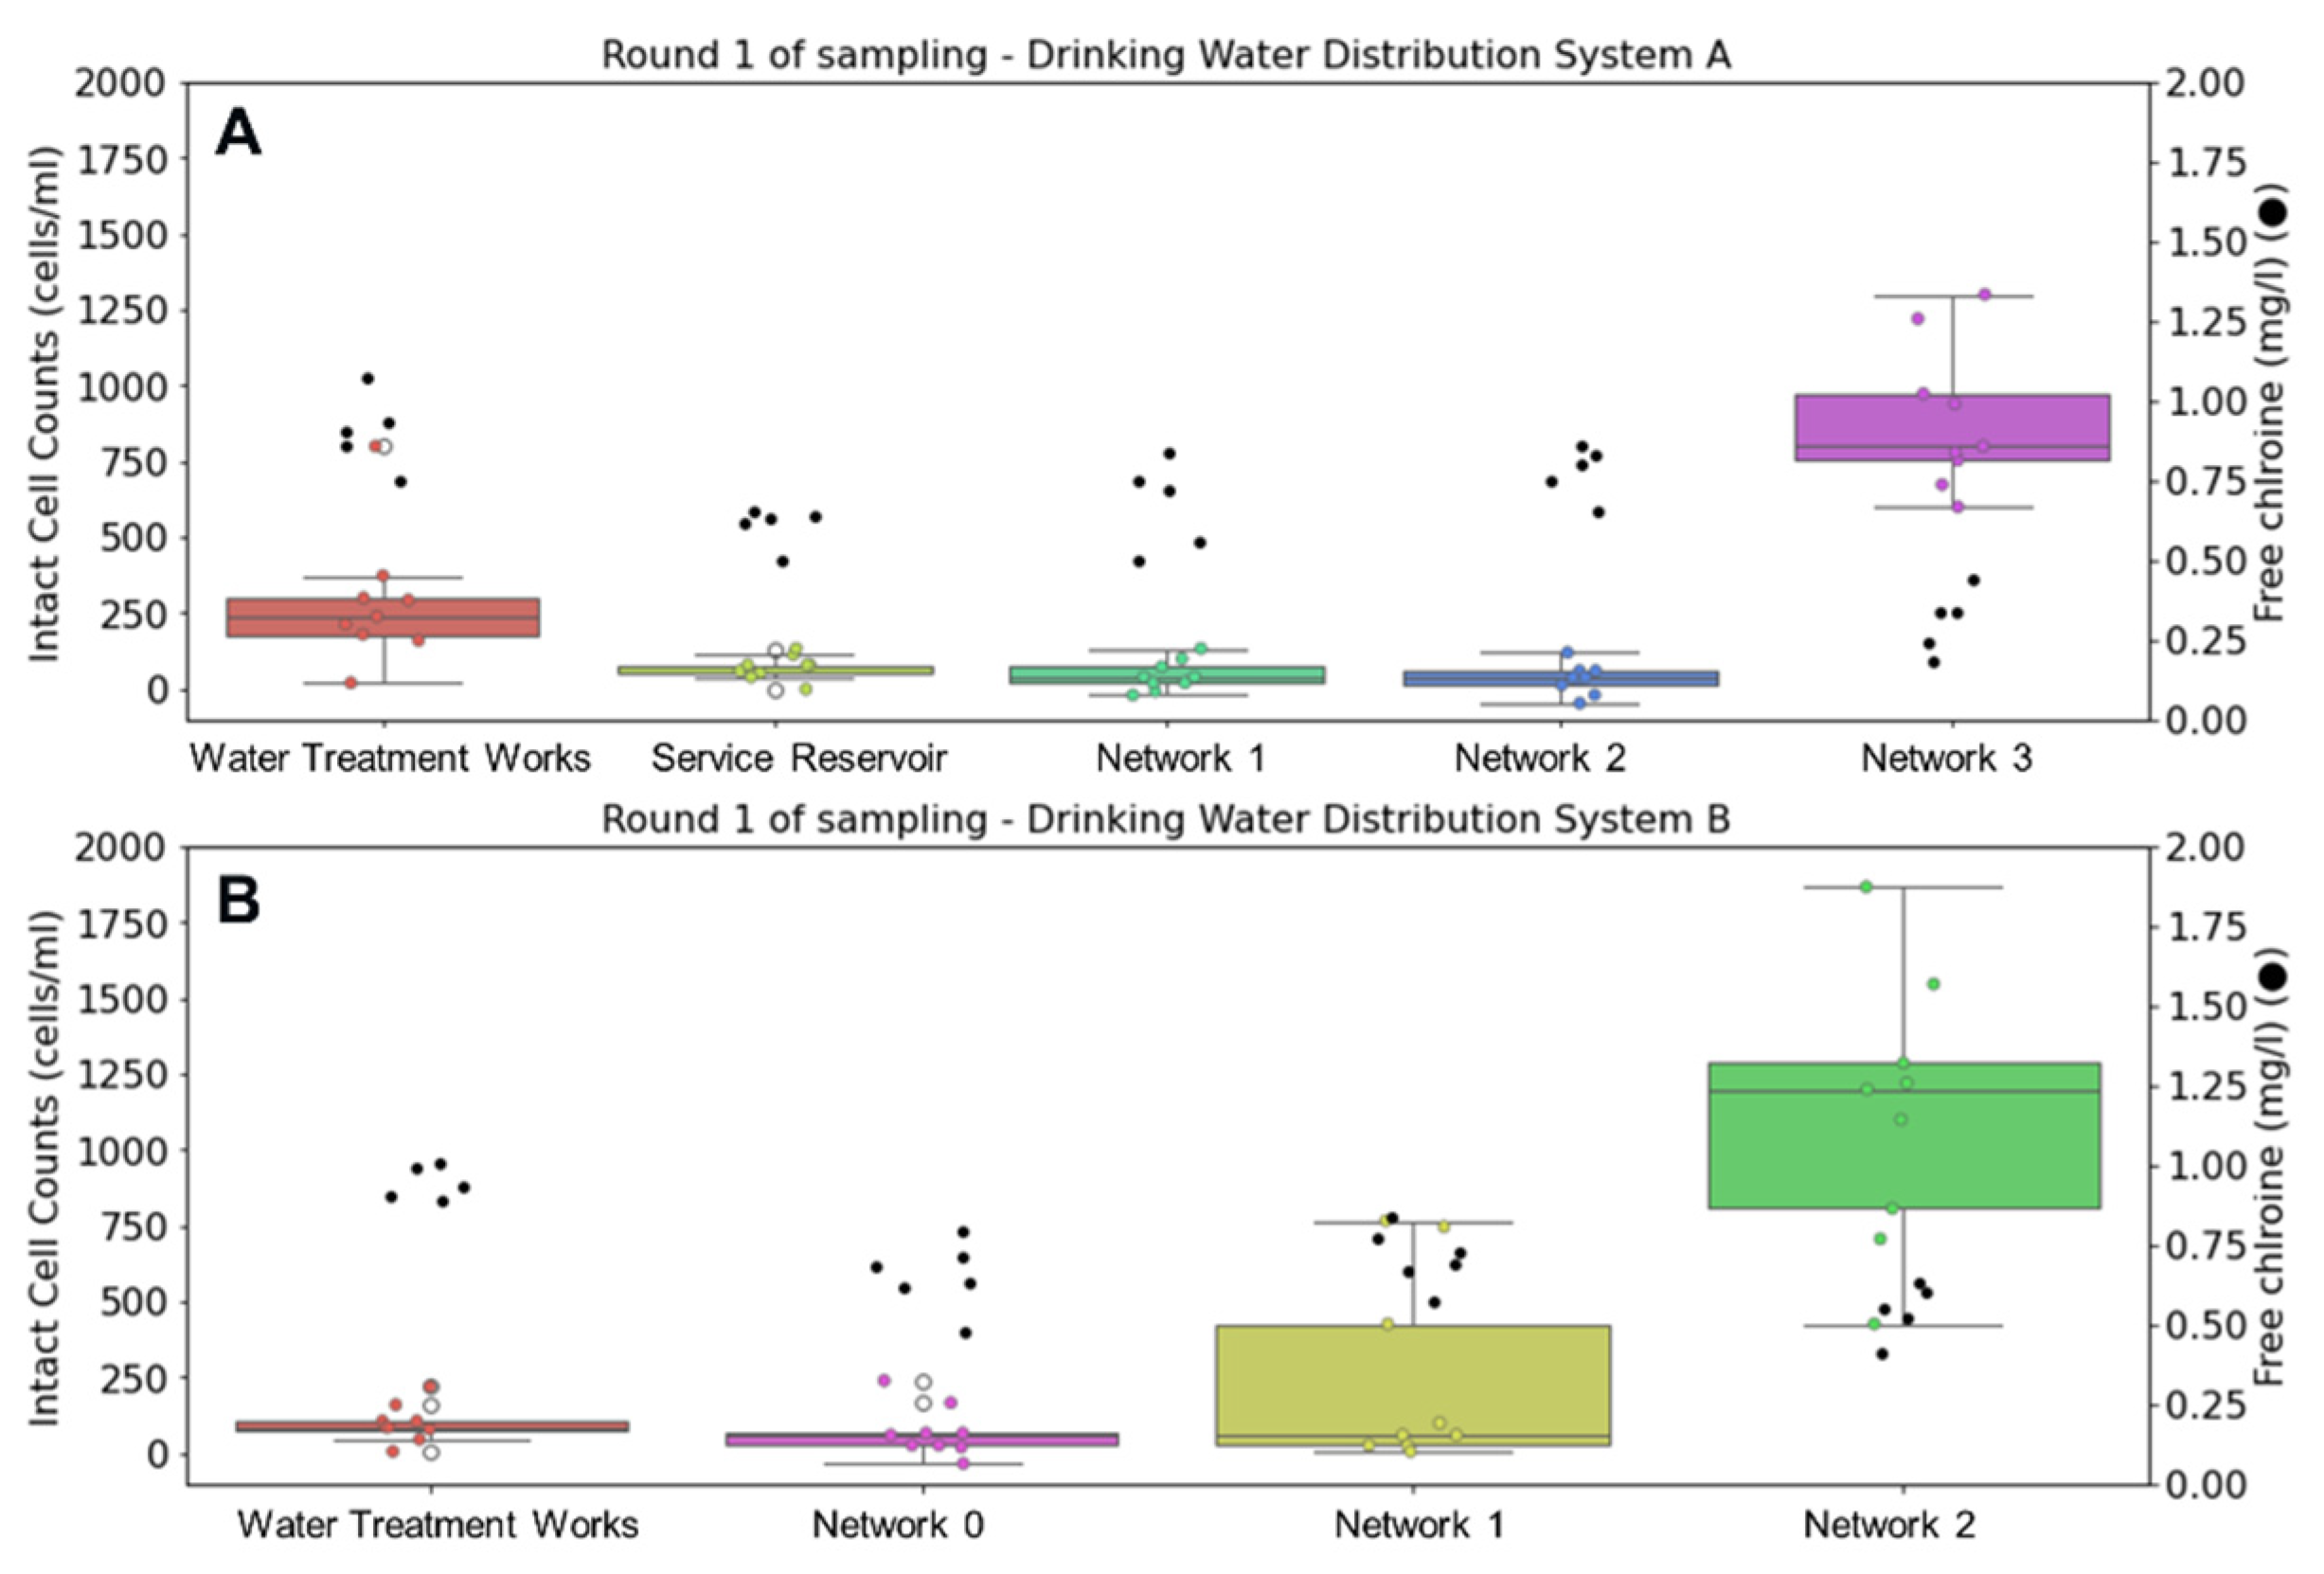
Figure 2 displays changes in ICC and free chlorine residual during the first round of sampling in autumn. Flow cytometry results show repeatability between triplicate measurements and were consistent throughout the week. In both DWSSs, flow cytometry analysis of tap water samples was able to capture microbial growth as water traveled through the network. The highest intact cell counts are accompanied by lowest free chlorine concentrations in both networks at the oldest water sampling point. In DWSS A, the average water temperature was 14.1 °C leaving the treatment works. This increases through the network, reaching 16.1 °C at the oldest sampling point.
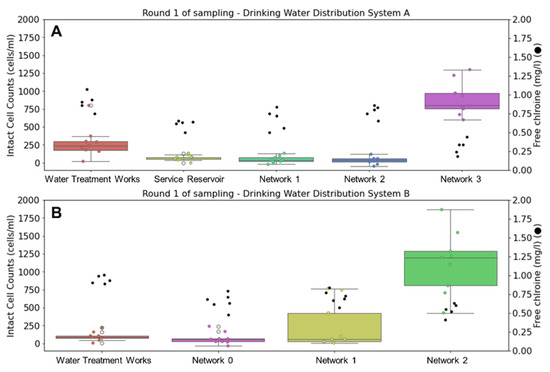
Figure 2.
Comparison of intact cell counts (ICCs) (left) and chlorine concentrations (●) (right) at drinking water supply systems (A,B) during autumn sampling. Whisker plots show data distribution of triplicate samples collected over three days (n = 9) for ICCs, where horizontal lines indicate from top to bottom maximum, upper quartile, median, lower quartile, and minimum values of the dataset.
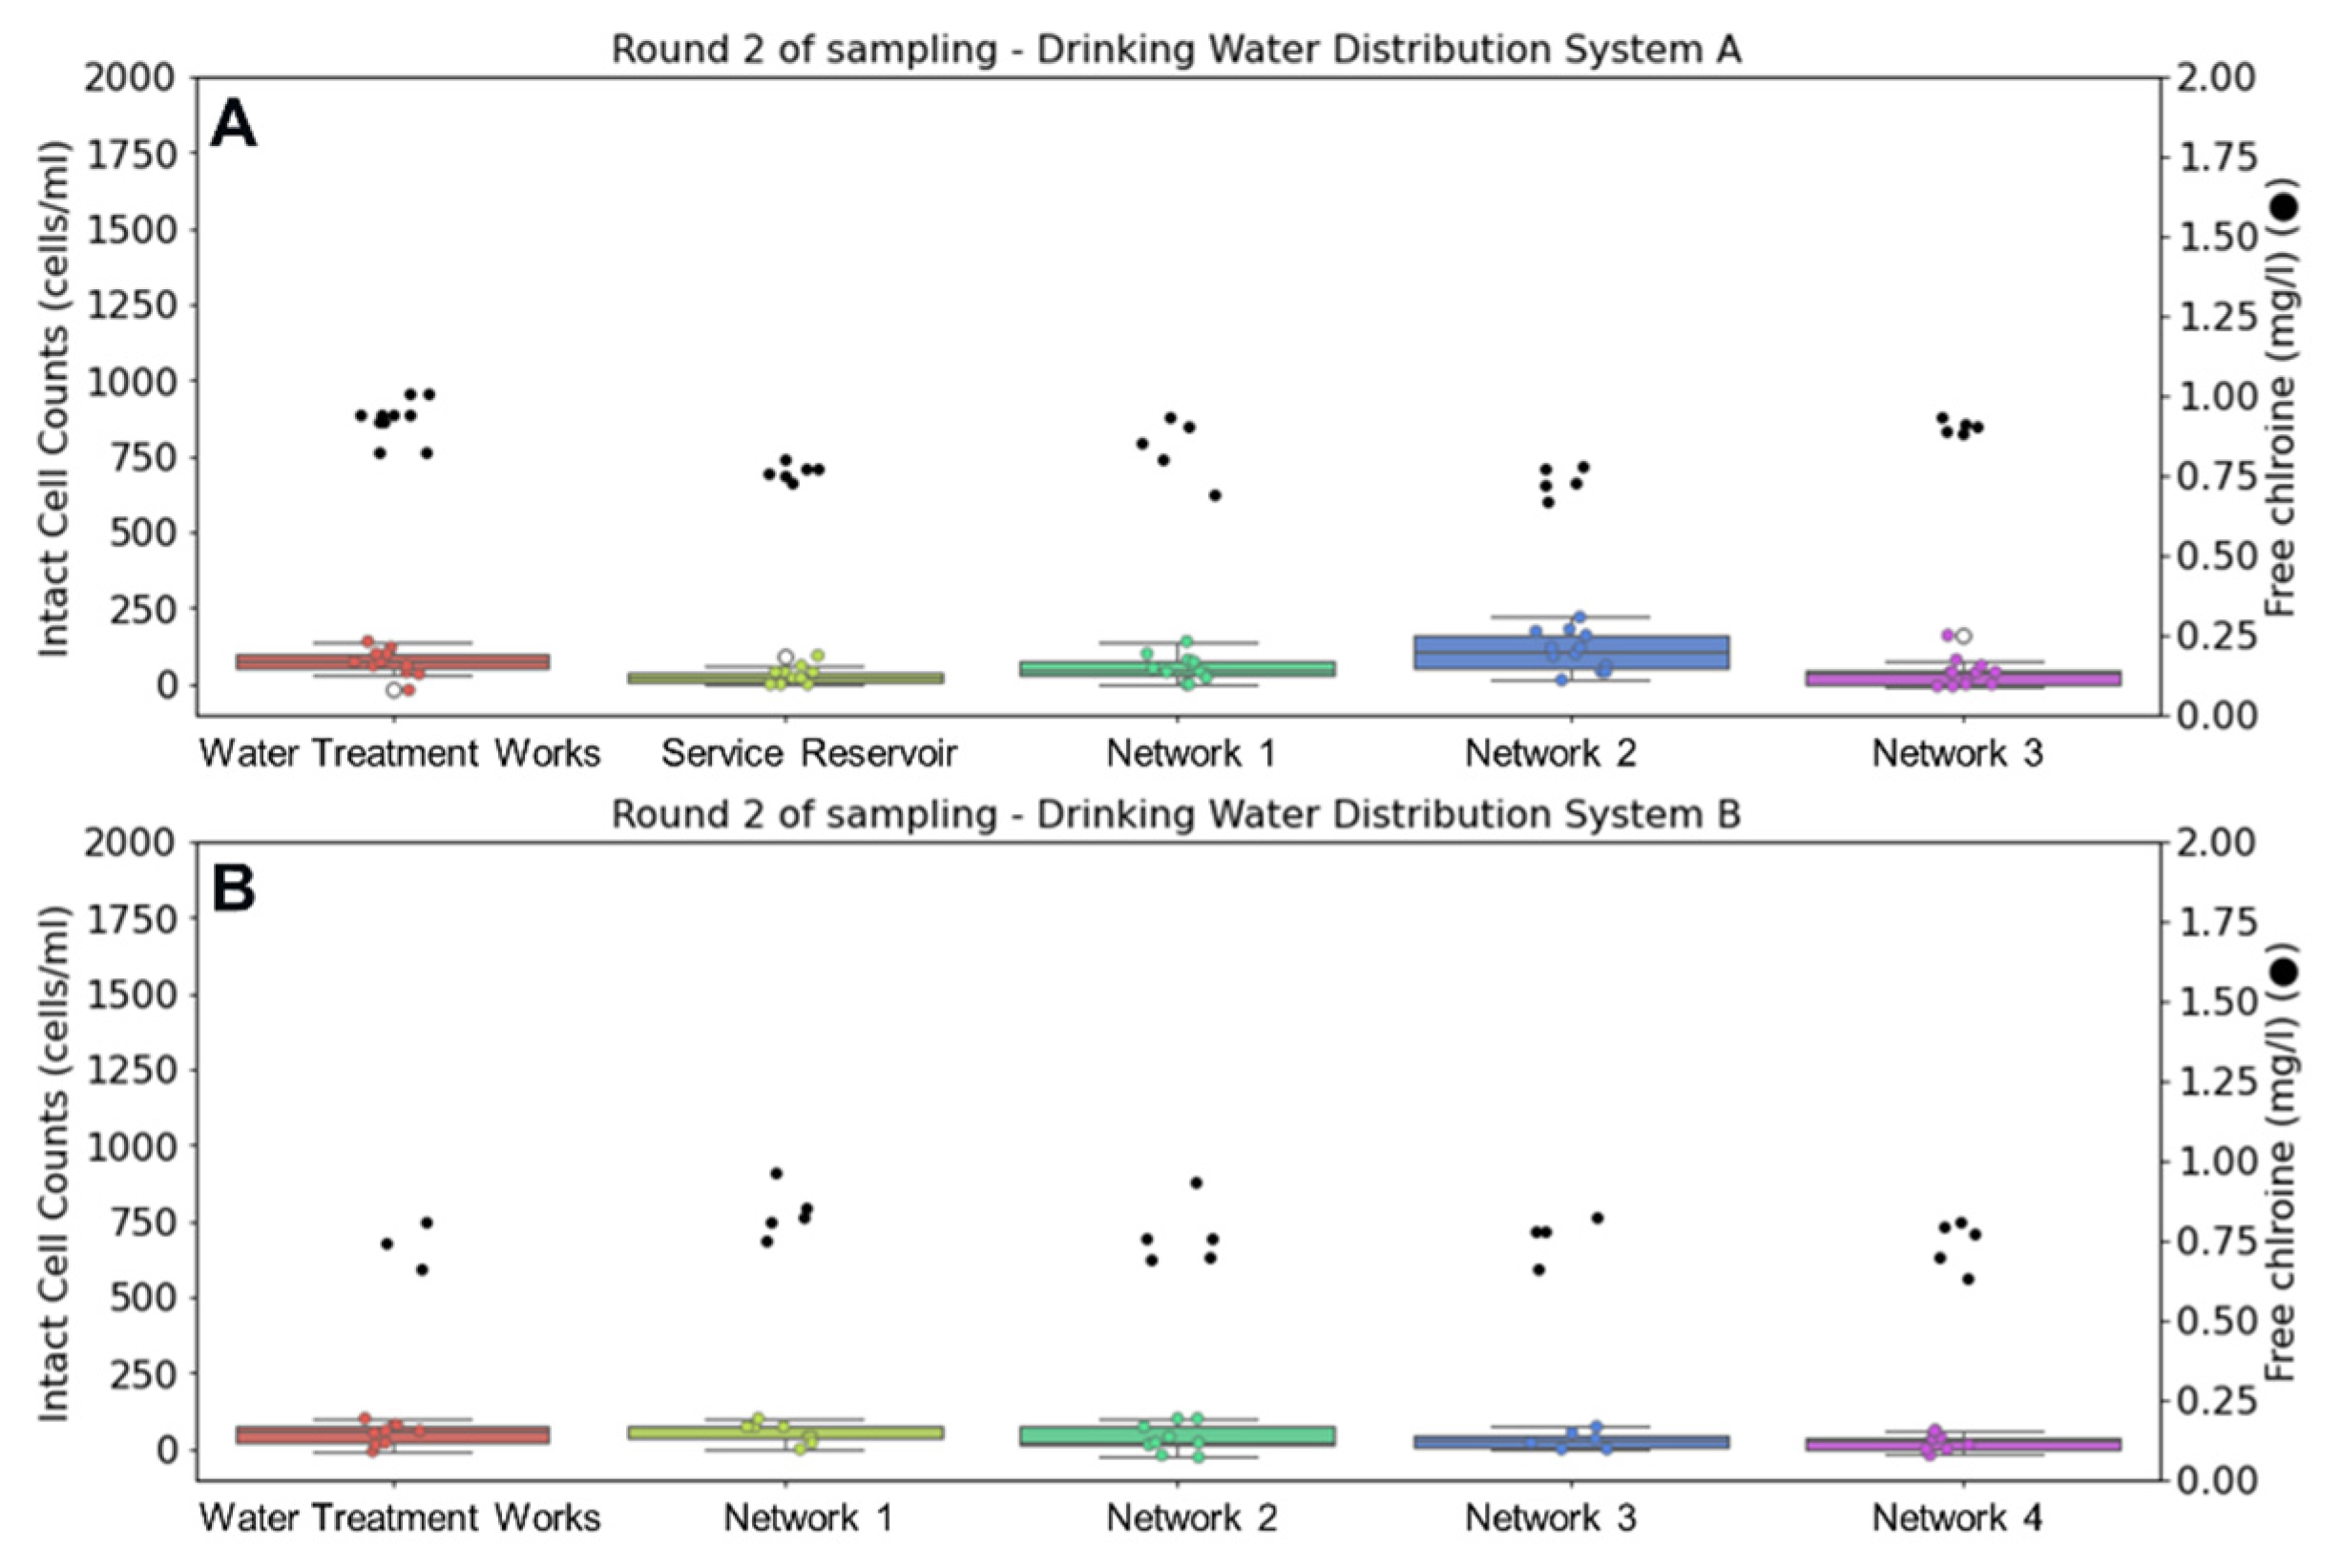
Figure 3 displays changes in intact cell counts and free chlorine residual during the second round of sampling in winter. Water temperature leaving the treatment works of DWSS A averaged 4.8 °C and reached a maximum of 7.1 °C in the network. At considerably lower water temperatures, no growth or chlorine decay was observed in either of these systems, despite the addition of older water sampling points in DWSS B.
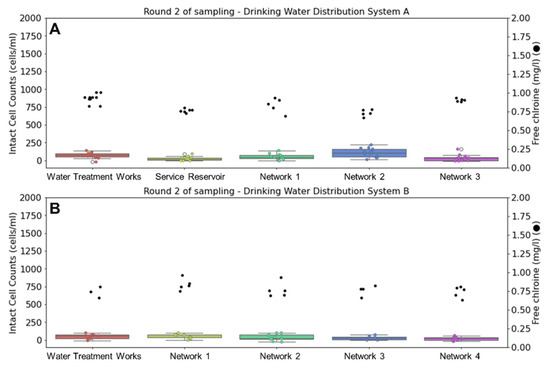
Figure 3.
Comparison of intact cell counts (ICC) (left) and chlorine concentrations (right) at drinking water supply systems (A,B) during winter sampling. Whisker plots show ICC data distribution of triplicate samples collected over four days (n = 12) for DWSS A and three days (n = 9) for DWSS B. Horizontal lines indicate, from top to bottom, maximum, upper quartile, median, lower quartile, and minimum values of the dataset.
4. Discussion
This work studied changes in microbial concentrations in two operational DWSSs, from treatment to tap, going beyond typical flow cytometry sampling points at the water treatment works and service reservoirs. In DWSS A, considerable growth was observed at the furthest point of the network, with a threefold increase in intact cell counts compared to the outlet of the treatment and thirteenfold compared to the outlet of the reservoir for the first round of sampling. Similar results were observed for DWSS B, with an elevenfold increase in intact cell counts at the furthest network tap sampled in the first round of sampling. This suggests flow cytometry analysis of samples from customer taps can provide further unique insights into a systems’ biological (in)stability that cannot be conveyed by only sampling treatment works and service reservoirs. When sampling was repeated during winter, approximately three months later, no growth was observed at any of the sampling points. At lower temperatures, chlorine decay was less extensive, which was likely both a complex cause and effect of biological stability. Substantial seasonal differences have also been observed in previous studies [2,3,4,5], reinforcing the importance of considering seasonal variations when studying biological stability.
5. Conclusions
- Flow cytometry data from drinking water samples collected at network taps provided valuable insight into the systems’ biological stability by capturing growth beyond typical flow cytometry sampling analysis points (WTW and SR).
- Seasonal variations in biological stability were observed within two different systems. Both DWSSs were less stable, displaying more growth during autumn, when water temperatures reached 16 °C, but were completely stable during winter, when water temperatures reached a maximum of only 7 °C.
- Understanding the factors affecting growth of microorganisms from treatment works to tap can inform improved design and management of water distribution networks to assure delivery of safe and aesthetically pleasing drinking water.
Author Contributions
Conceptualization, I.C., J.B., K.F., J.H. and P.J.; methodology, I.C., J.B., K.F., J.H. and P.J.; software, I.C.; validation, I.C.; formal analysis, I.C.; investigation, I.C.; resources, I.C.,F.W. and P.G.; data curation, I.C.; writing—original draft preparation, I.C.; writing—review and editing, J.B., K.F., P.J., J.H., F.W. and P.G.; visualization, I.C.; supervision, J.B., K.F., J.H. and P.J.; project administration, J.B.; funding acquisition, J.B., J.H. and P.J. All authors have read and agreed to the published version of the manuscript.
Funding
This research was funded by WIRe CDT Ph.D. studentship (EPSRC EP/S023666/1). URL: https://cdtwire.com/ (accessed on 30 March 2024) project is jointly funded by the EPSRC (Engineering and Physical Sciences Research Council) and UKWIR (UK Water Industry Research).
Institutional Review Board Statement
Not applicable.
Informed Consent Statement
Not applicable.
Data Availability Statement
Data available on request due to privacy restrictions.
Acknowledgments
The authors would like to thank Frances Pick, Jade Rogers, Sam Walsh, Jiwon Park and the sampling teams at Dŵr Cymru Welsh Water and Scottish Water.
Conflicts of Interest
Author Fiona Webber was employed by the company Scottish Water. Author Paul Gaskin was employed by the company Dŵr Cymru Welsh Water. The remaining authors declare that the research was conducted in the absence of any commercial or financial relationships that could be construed as a potential conflict of interest.
References
- Fish, K.E.; Reeves-McLaren, N.; Husband, S.; Boxall, J. Uncharted waters: The unintended impacts of residual chlorine on water quality and biofilms. NPJ Biofilms Microbiomes 2020, 6, 34. [Google Scholar] [CrossRef] [PubMed]
- Favere, J.; Buysschaert, B.; Boon, N.; De Gusseme, B. Online microbial fingerprinting for quality management of drinking water: Full-scale event detection. Water Res. 2020, 170, 115353. [Google Scholar] [CrossRef] [PubMed]
- Pick, F.C.; Fish, K.E.; Biggs, C.A.; Moses, J.P.; Moore, G.; Boxall, J.B. Application of enhanced assimilable organic carbon method across operational drinking water systems. PLoS ONE 2019, 14, 12. [Google Scholar] [CrossRef] [PubMed]
- Nescerecka, A.; Juhna, T.; Hammes, F. Identifying the underlying causes of biological instability in a full-scale drinking water supply system. Water Res. 2018, 135, 11–21. [Google Scholar] [CrossRef] [PubMed]
- Prest, E.I.; Hammes, F.; Kötzsch, S.; van Loosdrecht, M.C.M.; Vrouwenvelder, J.S. A systematic approach for the assessment of bacterial growth-controlling factors linked to biological stability of drinking water in distribution systems. Water Sci. Technol. Water Supply 2016, 16, 865–880. [Google Scholar] [CrossRef]
Disclaimer/Publisher’s Note: The statements, opinions and data contained in all publications are solely those of the individual author(s) and contributor(s) and not of MDPI and/or the editor(s). MDPI and/or the editor(s) disclaim responsibility for any injury to people or property resulting from any ideas, methods, instructions or products referred to in the content. |
© 2024 by the authors. Licensee MDPI, Basel, Switzerland. This article is an open access article distributed under the terms and conditions of the Creative Commons Attribution (CC BY) license (https://creativecommons.org/licenses/by/4.0/).