Abstract
Substandard Supply Minutes is the key performance indicator for asset management in the drinking water sector. A novel methodology translates production site failures into outage scenarios, allowing for calculation of Substandard Supply Minutes (SSM) based on all clients in the supply area. Drinking water utilities can conduct scenario studies, pinpoint high-risk assets, and compare production sites. This method can contribute to a better risk-based policy for design, investment and maintenance. Effective implementation necessitates a deeper understanding of failures of components at production sites.
1. Introduction
The Drinking Water Act prescribes quality and availability standards for drinking water. As a consequence, every four years, water companies make a supply plan, which is evaluated by the responsible national inspectorate (ILT). A crucial part of this plan is an analysis of how the drinking water company indicates how the system and the organization can withstand disruptions and what the possible consequences are in the event of a failure. This analysis has made an important contribution to robust design of the drinking water supply in the Netherlands. The analysis cannot be regarded as a fully fledged risk analysis, as the likelihood of failure is not taken into account.
Drinking water companies want to make improved asset management decisions that take into account the likelihood of failures of different components (e.g., water wells) and the impact on consumers, expressed in Substandard Supply Minutes (SSM) [1]. This paper describes research KWR performed on this topic for Dutch and Flemish drinking water companies within the Joint Research Program. This research was executed in close collaboration with the drinking water company Vitens.
2. Calculating Substandard Supply Minutes
SSM express how many connections have had insufficient pressure for a given time due to a given event. The calculated SSM (SSM-C) are derived by summing the connections with a pressure below 50 kPa for each outage scenario and for each time step in a hydraulic model. This is divided by the total number of connections, resulting in the so-called calculated effect SSM (SSM-CE). Finally, the SSM-C are obtained by multiplying the SSM-CE by the probability of the scenario.
3. Methodology
Beuken et al. [2] present a methodology merging reliability engineering and hydraulic modeling. Maintenance data and expert data on asset failure behavior are translated into production site outage scenarios. Using a hydraulic model (Epanet, version 2.2), the pressure is calculated at the clients for different outage scenarios, resulting in the SSM-CE and the SSM-C. A Python script was employed to control the calculations automatically and to post-process the calculation results. See Table 1 for the methodology.

Table 1.
Applied methodology in 6 steps.
The methodology described above was applied to a Vitens supply area, illustrated in Figure 1. This area is fed from a single production site comprising nine extraction wells, three sand filters, two clear water reservoirs and seven (different) high-pressure pumps. The supply area is divided into three sub-areas, each with distinct pressure levels. Two sub-areas are directly fed from the production site. The third area is fed through a distribution reservoir. This third pressure zone contains a link to an adjacent supply area.
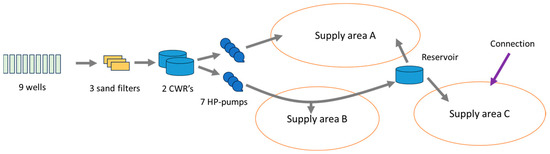
Figure 1.
Schematic representation of the research area.
4. Results
The first step involved choosing which of the supply areas of Vitens was suitable for this study. Once the area was selected, data were gathered from the main components of the production site. The hydraulic model was established, determining the consumption during the normative calculation period (the peak consumption period from 14 July to 18 July 2018). Given the consideration of the failure scenarios, the hydraulic model also included data on the reservoirs and pumps.
In the second step, an inventory of potential failure mechanisms that could cause complete or partial failure of the production site was made. This involved three collaborative sessions with experts specializing in extraction wells, rapid filters, high-pressure pumps and reservoirs. Twenty experts from seven drinking water companies and KWR participated, identifying a total of 47 failure mechanisms. Subsequently, it was assessed whether each mechanism could indeed lead to a failing component, identifying 21 such mechanisms. Through collective assessment and consulting the asset registers, the probability of failure for each mechanism was quantified as the mean time between failures (MTBF). Additionally, the mean time to repair (MTTR) for each mechanism was calculated based on two scenarios: a long MTTR, typical under regular conditions without readily available spare materials, and a short MTTR, established in collaboration with Vitens, reflecting efforts to quickly (and pragmatically) address failures in emergency situations.
In the third step, the failure behavior of the components was converted into outage scenarios by using fault tree analysis. Table 2 outlines eleven scenarios depicting complete or partial outages of the production site. These scenarios encompass two types of outages: those occurring during peak consumption, known as the 99% day, where one component fails, and those during regular consumption, on the 90% day, where one component fails while another undergoes maintenance. Depending on the scenario, the availability of the clear water reservoirs may vary. Table 2 provides details including the failure probability (inverse of the MTBF), the repair times for both a long MTTR and a short MTTR and the assumed distribution of both. For instance, Scenario 2 entails the failure of the production site’s operating system on a 99% day, rendering the clear water tank unusable with the treatment capacity at 0 m3/h. The estimated probability of this occurrence is 0.0571 n/year (once every 17.5 years), with the repair times estimated to be 2 h under calamitous conditions (weighted at 90%) and 6 h in the longest scenario (weighted at 10%).
Table 2.
The eleven outage scenarios, including relevant consumption, availability of the clear water reservoir (CWR), available capacity, associated likelihood of failure and duration of the outage.
In step 4, mitigation measures were implemented, which included the actions outlined in the supply plan, such as activating pumps from a neighboring production site and manually opening valves. It was assumed that all measures would be executed within two hours.
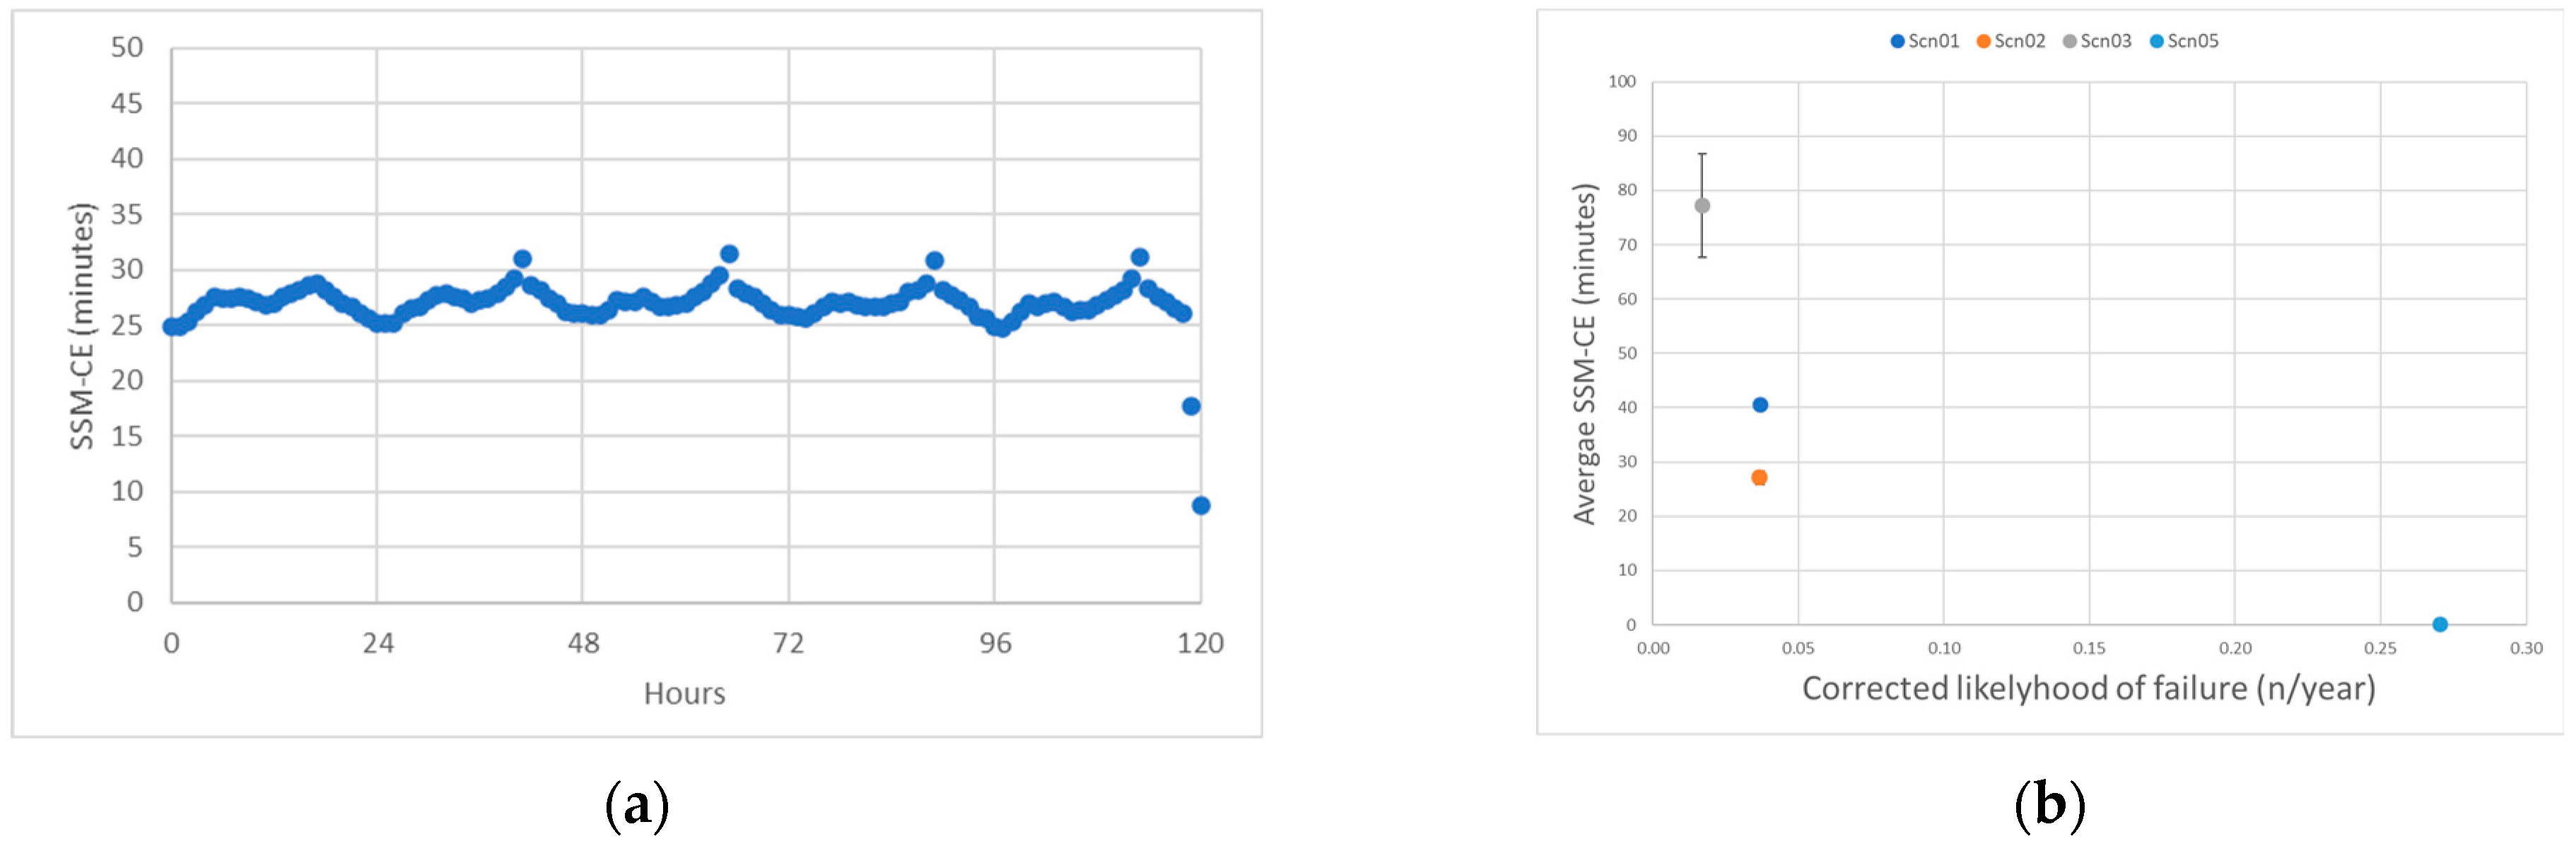
In step 5, outage scenarios were translated into conditions for the hydraulic network calculations. Only four scenarios result in supply interruptions, due to complete production site failures (scen. 1-2-3) or the failure of one of the three filters while another filter undergoes maintenance (scen. 5). For the other outage scenarios, sufficient redundancy is available. Figure 2a illustrates the calculated Substandard Supply Minutes (SSM-CE) over the calculation period. This scenario depicts the production site being completely inactive for either 2 h (90%) or 6 h (10%) due to a failure of the ICT operating system. Each data point in the figure denotes the calculated effective SSM during an outage starting in that hour. The average SSM-CE for scenario 2 is 27 min.

Figure 2.
Results of the analysis: (a) calculated effect SSM for scenario 2; (b) corrected likelihood of failure and corresponding calculated effect SSM for four scenarios.
In step 6, likelihood and impact are combined. As the probability of an outage is calculated for a specific consumption period, it is corrected by dividing the probability of the underlying failure by the peak factor of that day. Figure 2b shows the risks for four scenarios, where, e.g., scenario 3 has a lower likelihood of failure but a greater SSM-CE impact than scenario 1. The individual scores per scenario can be aggregated into a final risk score.
5. Conclusions and Relevance to Water Companies
The methodology for conducting a quantitative risk analysis of production site failures and their impact on customers represents an advancement of the existing supply plans. This methodology provides insight into both the effects and the probability of failure. Through meticulous modeling of the pipeline network and the production site, the results are realistic and expressed in SSM, the most important asset management performance indicator for drinking water companies.
The methodology proves valuable in assessing which failures impact the SSM and identifying effective mitigation strategies. Furthermore, it enables comparative analyses across multiple production sites.
It is important to acknowledge that the methodology was developed as a research project, serving as a proof of concept. Operations like obtaining expert opinions on failures and gathering data from production sites and supply areas, particularly on the pump characteristics and controls, proved time-consuming. As water companies transition into data-driven organizations, these tasks are expected to become more manageable.
Author Contributions
Conceptualization, R.B., P.D. and R.J.; methodology, R.B., P.D. and R.J.; formal analysis, R.B.; investigation, R.B. and R.J.; resources, R.B.; data curation, R.B.; writing—original draft preparation, R.B.; writing—review and editing, R.B., P.D. and R.J.; visualization, R.B.; supervision, R.B.; project administration, R.B.; funding acquisition, R.B. All authors have read and agreed to the published version of the manuscript.
Funding
The authors declare that this research was funded by the BTO Joint Research Program of the Dutch water utilities, project number 402045/286. The funder was not involved in the study design, collection, analysis, interpretation of data, the writing of this article or the decision to submit it for publication.
Institutional Review Board Statement
Not applicable.
Informed Consent Statement
Not applicable.
Data Availability Statement
The raw data supporting the conclusions of this article will be made available by the authors on request.
Conflicts of Interest
Author Peter Drolenga was employed by the company Vitens. And Ron Jong was employed by the company Waternet. The remaining authors declare that the research was conducted in the absence of any commercial or financial relationships that could be construed as a potential conflict of interest.
References
- Meerkerk, M.A.; Geudens, P.J.J.G. SSM in Benchmarking; Definitions and Calculation; PCD 20:2021; KWR Water Research Institute: Nieuwegein, The Netherlands, 2021. (In Dutch) [Google Scholar]
- Beuken, R.; Jong, R.; Quan, P. Impact of Failure Production Plant on System Performance; BTO 2022.047; KWR Water Research Institute: Nieuwegein, The Netherlands, 2022. (In Dutch) [Google Scholar]

Disclaimer/Publisher’s Note: The statements, opinions and data contained in all publications are solely those of the individual author(s) and contributor(s) and not of MDPI and/or the editor(s). MDPI and/or the editor(s) disclaim responsibility for any injury to people or property resulting from any ideas, methods, instructions or products referred to in the content. |
© 2024 by the authors. Licensee MDPI, Basel, Switzerland. This article is an open access article distributed under the terms and conditions of the Creative Commons Attribution (CC BY) license (https://creativecommons.org/licenses/by/4.0/).