Abstract
This paper describes energy diagnostics for water networks, which are complex systems with one or several inputs and multiple outputs, and also describes the ENERGOS tool created to perform the diagnostics. This tool was designed and conceived to be easy to use and mainly requires few data from the system. For target setting, ENERGOS has a set of wizards that guide the user in setting these limits and proposes values based on experience, the literature or regulations.
1. Introduction
The objective of water supply systems has not changed; the volume demanded by consumers must be delivered with the required quality, both in terms of its sanitariness and service. However, with the current energy crisis and pressing climate change, this must be conducted in the most efficient way possible [1]. The contribution of water services to climate change is undeniable. By the year 2040, it is estimated that the amount of energy used in the water sector will double, as a result of the increase in freshwater production through desalination, transfers, and the increase in the quantity and quality requirements of wastewater [2]. It is estimated that the global water sector could reduce its energy consumption by 15% before 2040 [2]. The key to addressing complex issues is to take a multidisciplinary approach, including economic, environmental, and social perspectives.
It is good practice to evaluate the energy supplied to the system based on the energy needed at the most unfavorable node because providing more energy (more pressure) than required at this point results in absurd loss. When this excess pressure is a consequence of the terrain’s topography, it can theoretically be recovered. Furthermore, demand management aimed at reducing water consumption is the best possible energy-saving strategy. Leaks represent a double loss, not only due to the energy loss embedded in the leaked water but also because leaks increase the circulating flow in the network, leading to increased friction losses.
The first step in improving efficiency is to be aware that there is a significant margin for improvement. Farmers, for example, are very sensitive to rising energy prices, but they are not always aware that improving the efficiency of their systems could reduce their costs tenfold. Improving the system’s efficiency with simple investments where the cost–benefit ratio is generally very high is within reach. The lack of awareness is a key impediment and can be quickly resolved with a simple and accurate diagnostic system, which is the first step in the energy efficiency improvement methodology presented in this work and which is independent of water use since hydraulic principles do not change whether dealing with urban or irrigation systems.
2. Energy Diagnosis
Therefore, the first stage of the energy optimization process is energy diagnosis [3]. Performance indicators have been widely used to measure the efficiency of pumps or circulating volumes through a water network. This diagnosis proposes a global indicator for the entire system. In fact, it is a simple relationship between the minimum energy required (embedded in the water supplied to users) and the consumed energy, the sum of the energy provided by the pumps (known from electricity bills), and the gravitational energy (or natural). This actual global performance can be compared with the ideal performance corresponding to a system without any losses.
However, the ideal situation is unattainable; therefore, this difference can never be reached. In other words, the highest possible value of real energy efficiency cannot be the ideal efficiency but a new value which considers reasonable losses (friction, leaks, pumps, and others). Once this objective performance value is estimated, the difference between it and the actual performance will provide a better approximation of the improvement margin in a specific system with its own characteristics. It is not about comparing the current state of the system quantified with a reference value, as it is usually conducted, but rather with the maximum achievable by that system (its best version). A system that needs to provide supply to users with very high and very low usage will require more energy. However, it should not be labeled as inefficient as a consequence. Actual performance obviously has an upper (and unattainable) limit, the ideal (or theoretical) performance, but it is also subject to external factors to the system such as the price of water and energy, which, in some way, can be considered the boundary conditions of the problem. After all, the decision to adopt an improvement or not is based on a cost–benefit analysis. Just from an economic point of view, all systems have an optimal level of leaks [4]. Therefore, it is reasonable to assume that there is also an optimal level of energy losses.
This work, and the tool presented, ENERGOS, focuses on the most relevant stage of the energy improvement process. It is the diagnosis of the entire system, not just a part (e.g., the pumping station). It is important to emphasize that this refers to the global performance, unlike the traditional approach, which focuses on the performance of a part. Once again, it is advisable to insist on the well-known environmental strategy of think globally, act locally.
The diagnosis conducted will help a manager detect their weaknesses so that they can focus their efforts where they are most needed or where they will provide the most benefit, whether economic or environmental. The diagnosis can help determine if the inefficiency problem lies in the pressure group, water losses, or the system’s configuration, for example. Why allocate resources to replace a pump with higher performance if the problem lies in the pipe network and can be improved simply by sectorization? Or why implement an expensive regulation process when the greatest potential for improvement may lie in demand management, that is, supplying hydrants with the strictly necessary volume and pressure, without excess and with the best possible sequencing?
3. Energos Tool for Water Networks
ENERGOS allows for the first stage of the process of improving efficiency to be carried out: diagnosis. Starting from a few data (which a good manager should always know), it evaluates, from an energy perspective, the behavior of the system and, more importantly, the existing potential savings. ENERGOS makes calculations and, with the energy indicators it includes, facilitates the interpretation of the results (Figure 1).
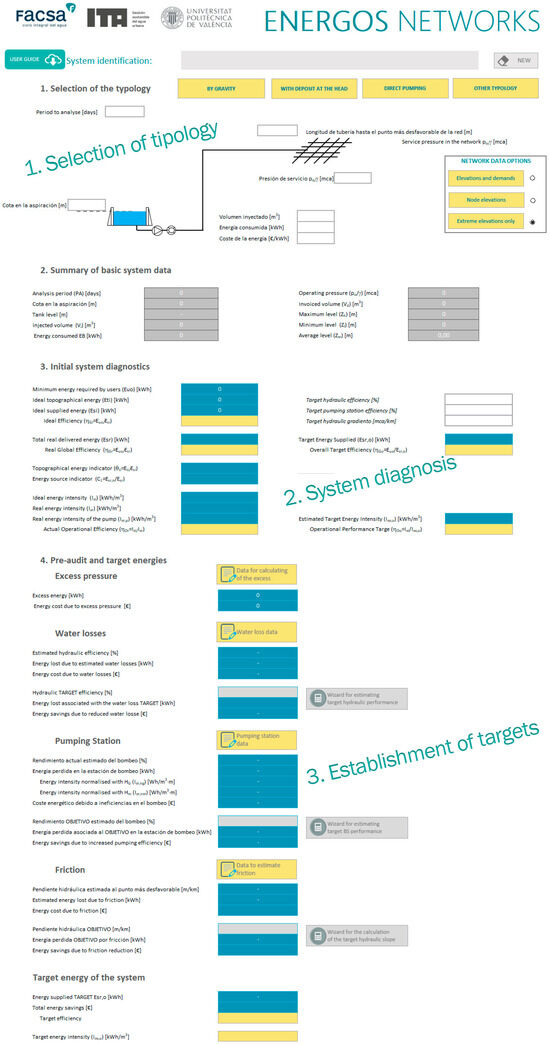
Figure 1.
General diagram of ENERGOS tool.
The energy analysis suggests classifying water transport systems into three groups: Simple Systems, which consist of a single pipeline (one inlet and one outlet) and usually involve pumping [5]; complex systems (or networks); and Multi-topological Systems, which feature multiple inlets and outlets and undergo constant changes in their mode of operation (multi-scenarios). Each scenario corresponds to a different layout.
Networks are defined as systems that may have one or more inlets but have multiple outlets (users of the network). Applying the continuity equation to such systems over a given period is straightforward. The total injected volume from the pumping station V equals (in the absence of water losses) the sum of demands from all consumption nodes. Therefore, the ideal supplied energy to the system, Esi, corresponds to delivering the entire demanded volume by the consumption nodes at a height Hhi, which is the same for all nodes (assuming no head losses). This height is the sum of the critical node elevation and the service pressure (po). The supplied energy corresponds to the sum of two energy terms. On one hand, the one of real interest, which is the useful energy delivered to the users (Euo), corresponding to what must be delivered at all consumption nodes, at the elevation at which they are located, is the demanded volume at the minimum pressure or service pressure. And on the other hand, there is an energy term; while not useful, the system is obligated to deliver due to the irregularities of the terrain. This is the topographic energy, Eti, which is the energy required to reach the elevation of the critical node, penalizing the rest of the consumption nodes. This means that for the highest node to have pressure, the rest of the nodes in the system will have overpressure. In a completely flat network, Eti (topographic energy) would be zero. From these concepts and energy balances, the ideal energy efficiency can be stated as the ratio between the minimum energy required by the users and the supplied energy .
This, like any other efficiency, is the ratio between what is truly useful (Euo) and what is delivered to the system (Esi). In this ideal case (in the absence of any type of losses), the system’s inefficiencies that cause Esi to be greater than Euo, and therefore the efficiency value to be less than 1, can only be due to the topographic energy Eti. This energy, although inevitable (since it is due to the terrain’s topography) [6], could be reduced as long as the system’s configuration is modified or even recovered (installation of Pump as Turbine systems—PATs). Topographic energy is essentially excess energy that, due to the irregularity of the terrain, must be delivered additionally to the system. Therefore, it is, in a way, a loss that should be avoided as much as possible in the design stage. Therefore, the ideal efficiency of a network, ηai, represents the maximum value that the efficiency of the specific system being evaluated can achieve, different for each network as it depends on the topographical characteristics of the system and its volume demand. Real systems contain a series of losses that, while they can be minimized, can never be completely eliminated, such as water losses, pressure group inefficiencies, and pipe friction.
On the other hand, the real energy supplied to the system can be calculated from the energies entering the system, namely the actual natural energy available Esr,n (proportional to the available capture height and the volume injected into the network, the sum of the demanded and leaked volume) and the real energy provided by the pump, Esr,p, which can be obtained from reading electric bills, . The difference between the ideal efficiency and the real efficiency (ηai − ηar) provides the first estimate of the system’s improvement margin. This difference gives an idea of where the system stands and how far it could go (with this upper limit being unattainable); if the difference between them is significant, this indicates that the energy losses in the system are considerable, and hence, the scope for improvement is broad. If the difference is small, it means that the state of the network is practically the best scenario possible, and it is not worth spending resources to deeply evaluate the system, as the situation in which the system is already practically optimal.
Once the difference between both efficiencies is known, the next step is to determine the potential for improvement. A new reference value (ηar,o) represents the achievable efficiency of the system or the target efficiency; it is verified that ηai > ηar,o > ηar. This new efficiency can be estimated from the Objective Energy, which is the energy that would be supplied to the system if each of the losses were reduced to the minimum or objective value. The more inefficiencies that are eliminated from the system, the closer Esr,o will be to Esi (the closer it will be to the ideal case). For setting the objectives, the tool possesses a series of assistants based on regulations, recommendations, and experiences on the subject.
4. Conclusions
ENERGOS is a simple tool for diagnosing pressurized water transport systems. The diagnosis requires little data and allows the system’s energy improvement margins to be established. It conducts this by comparing the ideal state (without losses) with the current state and with a third objective state that establishes a margin of improvement that is reasonable to achieve. The diagnosis is adapted to different types of existing water transport systems, and although the procedure followed is the same, the indicators on which the analyses are based are adapted to each type of system.
Author Contributions
Conceptualization, E.G. and E.C.; methodology, E.G., E.C. and R.d.T.; software, E.G.; validation, E.G., R.d.T. and E.E.-J.; formal analysis, E.E.-J.; investigation, E.G.; data curation, E.G., E.E.-J. and R.d.T.; writing—original draft preparation, E.G.; writing—review and editing, E.G. and E.E.-J.; visualization, E.E.-J.; supervision, E.G.; project administration, E.G. All authors have read and agreed to the published version of the manuscript.
Funding
This research received no external funding.
Institutional Review Board Statement
Not applicable.
Informed Consent Statement
Not applicable.
Data Availability Statement
The dataset will be made available on request from the authors.
Conflicts of Interest
The authors declare no conflicts of interest.
References
- Sowby, R.B.; Burian, S.J.; Chini, C.M.; Stillwell, A.S. Data Challenges and Solutions in Energy-for-Water: Experience from two recent studies. J. Am. Water Work. Assoc. 2019, 111, 28–33. [Google Scholar] [CrossRef]
- IEA (International Energy Agency); OECD. Water Energy Nexus; International Energy Agency: Paris, France, 2016. [Google Scholar]
- Cabrera, E.; Gómez, E.; Cabrera, E., Jr.; Soriano, J.; Espert, V. Energy Assessment of Pressurized Water Systems. J. Water Resour. Plan. Manag. 2015, 141, 04014095. [Google Scholar] [CrossRef]
- Ofwat and the Environment Agency. Review of the Calculation of Sustainable Economic Level of Leakage and Its Integration with Water Resource Management Planning; Ofwat and the Environment Agency: Bristol, UK, 2019. [Google Scholar]
- del Teso, R.; Gómez, E.; Estruch-Juan, E.; Cabrera, E. Minimum Energy Requirements of Pipeline Pumping. J. Water Resour. Plan. Manag. 2023, 149, 06023001. [Google Scholar] [CrossRef]
- del Teso, R.; Gómez, E.; Estruch-Juan, E.; Cabrera, E. Topographic energy management in water distribution systems. Water Resouces Manag. 2019, 33, 4385–4400. [Google Scholar] [CrossRef]

Disclaimer/Publisher’s Note: The statements, opinions and data contained in all publications are solely those of the individual author(s) and contributor(s) and not of MDPI and/or the editor(s). MDPI and/or the editor(s) disclaim responsibility for any injury to people or property resulting from any ideas, methods, instructions or products referred to in the content. |
© 2024 by the authors. Licensee MDPI, Basel, Switzerland. This article is an open access article distributed under the terms and conditions of the Creative Commons Attribution (CC BY) license (https://creativecommons.org/licenses/by/4.0/).