Abstract
In water-scarce regions, it is common to design water networks for a continuous supply but operate them intermittently, resulting in a potentially inequitable supply. We analyze the case of a network in Central India designated to supply water to 107 villages from a single source. Several villages received zero or negligible inflow due to a variety of reasons. We developed a model of the network using the limited data available from the network and performed a pressure-driven analysis of the system. The key reasons for inequity in the supply were identified to be the excess withdrawal by villages located near the source, and the presence of air locks caused by the unevenness of the terrain. We report the effectiveness of several mitigating strategies. It is revealed that no single solution fits all, as different scenarios require different solutions.
1. Introduction
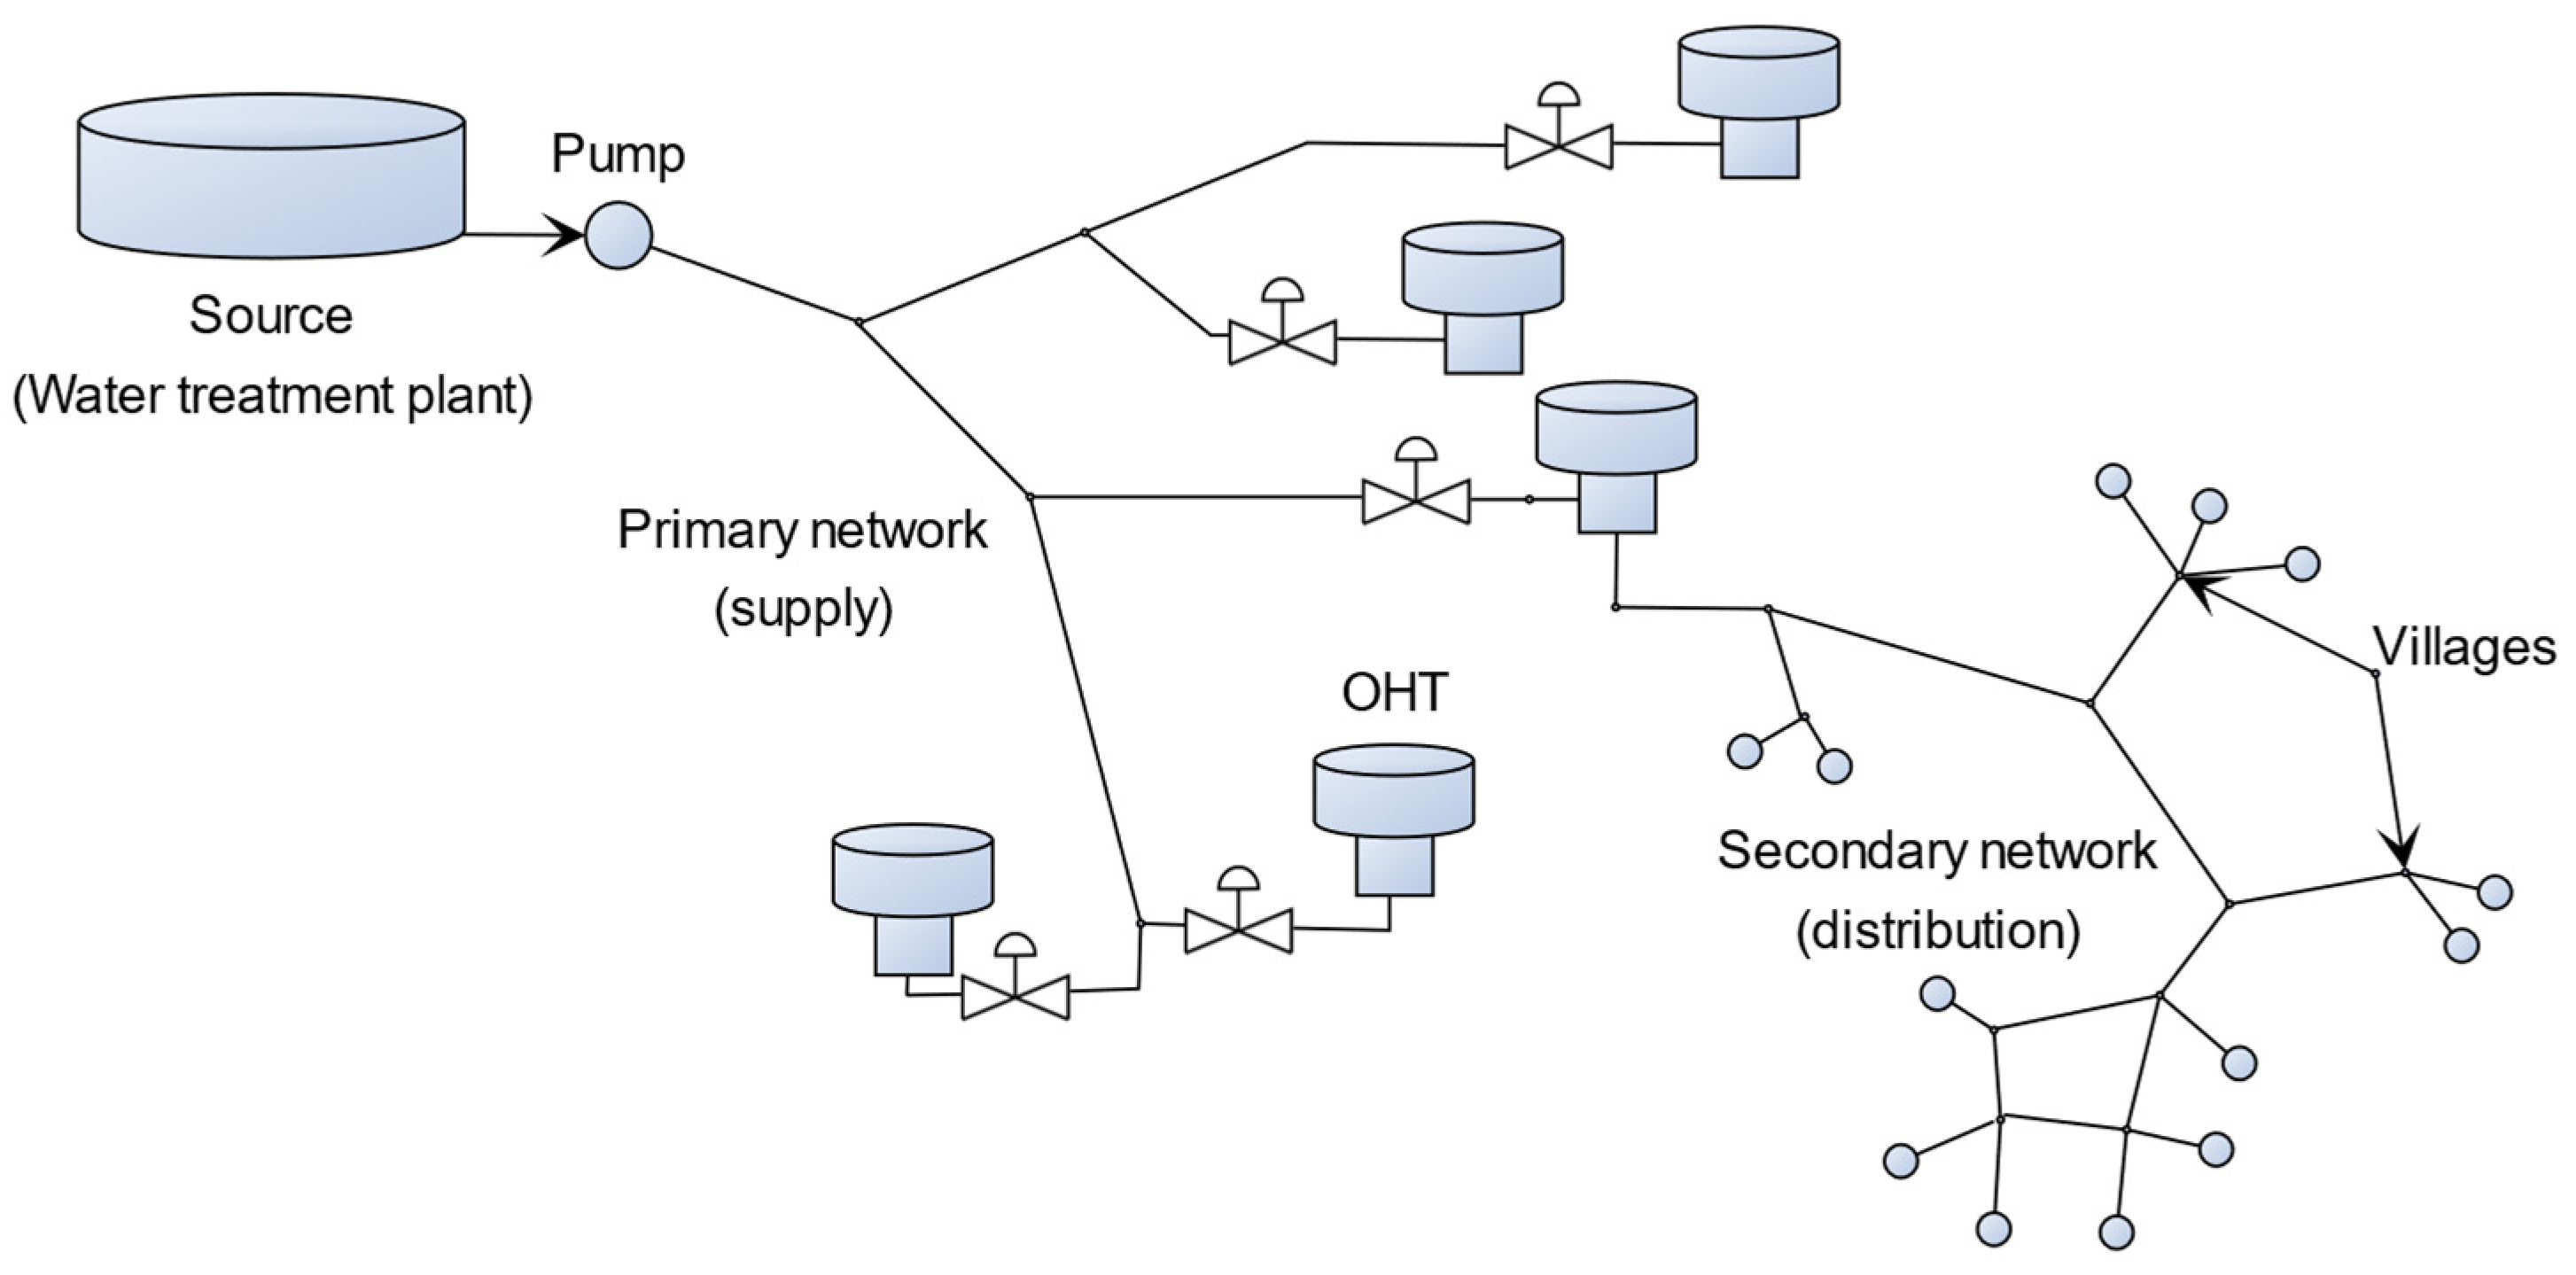
Water distribution networks (WDNs) are used for transporting treated water from its source to consumers. The sufficient availability of water and a good supply network are pre-requisites to operating such continuous supply systems. On the other hand, in water-scarce regions, utility providers often have to constrain the amount of water supplied to each consumer, which is primarily implemented through limiting the supply hours. A class of networks, commonly referred to as rural water supply schemes (RWSSs) have several key features in their design to allow for limited hours of operation [1]. For example, they have several intermediate overhead tanks (OHTs) filled from the top (different from the floating reservoirs common in continuous systems), from which water is then distributed to individual consumer locations. The consumers could be individual households or community stand posts. An aspect of these systems that has become useful during their analysis is that the network upstream and downstream of the OHTs can easily be decoupled for analysis. The part of the network which is upstream of the OHTs is usually referred to as the supply side or the primary network, while the part downstream of the OHTs is referred to as the distribution side or the secondary network (see Figure 1). Though not addressed well in the past, RWSSs, with their unique features, have recently been studied by multiple authors [1,2,3].
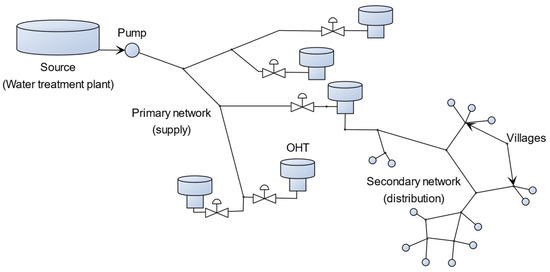
Figure 1.
Schematic of an RWSS with five OHTs. The secondary network is shown only for one of the OHTs.
Though RWSSs usually supply water for limited hours in a day, the design often follows the norms for a continuous supply. This results in the operation being inequitable, with certain consumers withdrawing a higher volume than they should. Consequently, a few other consumers, usually located farthest from the OHTs, receive little or low supply. The event of unfilled pipes also leads to the accumulation of air locks in the pipes, further impeding the supply to the villages located away from the OHTs. In this work, we present our analysis and recommendations for a recently constructed RWSS which faced such challenges. Specifically, we focus on the solutions that can be provided with the assistance of mathematical models.
The WDN in consideration was planned for supplying water to 107 villages in Central India at 55 lpcd. The supply network was divided into two zones, A and B. Zone A consisted of 23 OHTs which supplied water by three pumps (132 KW, one or two operational, with the remaining on standby) and zone B consisted of 19 OHTs catered by three pumps (45 KW, one or two operational, with the remaining on standby). Each OHT was filled once a day using the pumps and the downstream distribution of OHTs was performed by gravity. If necessary, the water supply was curtailed by filling the corresponding OHT to a lower height. This ensured that the amount of water supplied to each region was controlled.
2. Model Development
For the analysis of the system, we developed a mathematical model of the WDN. Network parameters such as the length, diameter, pipe roughness coefficients, pump characteristic curves, and OHT elevations were provided. In addition, a few measurements from the field were also available. For ease of analysis, we decoupled the system as primary and secondary networks. As the quantity of water transported was limited primarily by availability rather than demand, a pressure-driven analysis of the system was performed.
2.1. Modeling Exit at OHTs and Consumer Locations
The reservoirs were modeled as emitters rather than tanks. Here, the emitter coefficients were used to model any losses occurring when water flows out of the exit. They were also representative of any unmodeled resistances. It was assumed that the emitter coefficient for all the OHTs were the same. Further, the emitter coefficients for all consumer points in the network were also assumed to be the same, albeit different from that of the OHTs. These two coefficients were unknown and had to be estimated from the field measurements.
Data recorded during normal operation of the network were used to estimate the emitter coefficients. Flow and pressure measurements at the discharge of the pump (twice in an hour) were available in addition to the cumulative water supplied to the OHTs in Zone A. We identified the emitter coefficient by minimizing the square of error between the flow rates predicted by the model and those observed in field. At optimum, the emitter coefficient of the OHTs turned out to be equal to one.
We assumed that the emitter coefficients are the same for all the demand nodes since each demand node corresponds to a household connection. The time required to completely drain the OHT was available for several networks. We performed a univariate search (with the variable being emitter coefficient) to minimize the sum squared deviation of withdrawal time predicted by the model and the corresponding values measured from the field. The optimal emitter coefficient came out to be equal to 0.5.
2.2. Lumped Models of Villages
During our analysis, there were instances requiring the simultaneous simulation of the primary and the secondary network (described later). In these instances, using a detailed model of the secondary networks resulted in a very complex network with its own computational challenges, especially while being used within a simulation-based optimization problem. Hence, we approximated the downstream of the OHT using a single emitter at a height. The two parameters—emitter coefficient and the ground level—were fixed such that the flow rates predicted by the single node were close to the flow rates predicted by the detailed model of the villages. The estimated ground level was similar to the elevation of ground level nodes in the system.
3. Mitigating Measures
3.1. Analysis of a Modified Network
Due to certain faults in the system, it was proposed by the utility provider to bypass six OHTs and directly supply water to the corresponding secondary networks from the main pumping line (primary network) as a temporary solution. We simulated the model of the modified system to provide an estimate of the water supplied to each secondary network. It was identified that after the bypass of the OHTs, the six secondary systems received a much higher flow rate compared with filling the OHTs. Consequently, it was recommended that these villages be supplied for a shorter duration, which varied from 35–60% of the current supply time.
3.2. Equitable Supply
The design principles required the consumers to be provided with water at pressures of above 7 m, and this was confirmed in the demand driven analysis. However, in practice, the consumer closer the OHTs withdrew at a much higher rate, causing the villages far away to receive little or no water. A pressure-driven analysis of the secondary networks showed gross inequity in the water received by the villages. Table 1 shows the flow rates planned for and received by the three villages downstream of an OHT. As village 1 and 2 draw at rates much higher than those planned for them, and because the available water is limited, village 3 ends up receiving a lower amount of water.

Table 1.
Comparison of withdrawal by villages in demand driven and pressure-driven analysis.
To improve the supply of water to the tail-end villages, we tested two strategies as follows: (i) the placement of a booster pump and (ii) isolation of the other villages. With booster pumps (of head 30 m), the idea was to increase the pressure downstream of the OHT to test if the fraction of water reaching the tail-end villages may increase. Though we were interested in placing the pump after a few villages (pressure is increased only for the tail-end villages), societal factors such as the availability of land and electric power and security of infrastructure would constrain its implementation. For the second strategy, i.e., isolation, we simulated the flow rates received by the tail-end villages on stopping the supply to the earlier villages. While such operational policies are effective in maintaining equity in supply, they would require additional resources to control the network.
Table 2 gives the flow rate originally received by the tail-end villages of a few secondary networks and the same on the placement of booster pumps and the isolation of intermediate villages. It is observed that two villages (green highlight) benefit from the placement of booster pumps and one (blue highlight) from the isolation of other villages. The differences are a result of the differences in topologies and resistances of the networks. The analysis reveals that such solutions are not unique for every network, and one needs to analyze the specific system to identify the appropriate solution.
Table 2.
Flow rate received by tail-end villages on using booster pump and isolating other villages.
3.3. Removing Air Locks
A majority of the analysis in the literature was performed under the assumption that the system behaved ideally and no air locks were present. Air locks are common in systems with intermittent supply and can make the inequity worse. In uneven terrains, air columns can lead to drops in hydrostatic pressure and little or no supply to tail-end villages. We performed a brief study of one of the lines leading from an OHT to a tail-end village with the help of ‘Air in Water Pipes’ released by APLV [4]. The software identified the terrain to be highly uneven. There were at least 19 locations where the elevation of the line had a peak. Of these, 13 locations were identified to be of serious concern.
Author Contributions
Conceptualization, S.N. (Shankar Narasimhan) and S.N. (Sridharakumar Narasimhan); formal analysis, V.K.; project administration and supervision, S.N. (Shankar Narasimhan) and S.N. (Sridharakumar Narasimhan). All authors have read and agreed to the published version of the manuscript.
Funding
This research received no external funding.
Institutional Review Board Statement
Not applicable.
Informed Consent Statement
Not applicable.
Data Availability Statement
The datasets presented in this article are not readily available due to confidentiality.
Conflicts of Interest
The authors declare no conflicts of interest.
References
- Bhave, P.R.; Gupta, R. Analysis of Water Distribution Networks; Alpha Science Int’l Ltd.: Oxford, UK, 2006. [Google Scholar]
- Hooda, N.; Damani, O. Jaltantra: A system for the design and optimization of rural piped water networks. INFORMS J. Appl. Anal. 2019, 49, 447–458. [Google Scholar] [CrossRef]
- Kurian, V.; Mohandoss, P.; Chandrakesa, S.; Chinnusamy, S.; Narasimhan, S.; Narasimhan, S. Equitable supply in intermittently operated rural water networks in emerging economies. Water Supply 2023, 23, 4520–4538. [Google Scholar] [CrossRef]
- Corcos, G. Air in Water Pipes; Agua Para La Vida: Berkeley, CA, USA, 1989. [Google Scholar]
Disclaimer/Publisher’s Note: The statements, opinions and data contained in all publications are solely those of the individual author(s) and contributor(s) and not of MDPI and/or the editor(s). MDPI and/or the editor(s) disclaim responsibility for any injury to people or property resulting from any ideas, methods, instructions or products referred to in the content. |
© 2024 by the authors. Licensee MDPI, Basel, Switzerland. This article is an open access article distributed under the terms and conditions of the Creative Commons Attribution (CC BY) license (https://creativecommons.org/licenses/by/4.0/).