Proceeding Paper

Simulation of a Case-Study Intermittent Water Distribution Network by Using the Storm Water Management Model †

Department of Civil Engineering and Architecture, University of Catania, Viale Andrea Doria, 6, 95125 Catania, Italy
*
Author to whom correspondence should be addressed.
Presented at the 3rd International Joint Conference on Water Distribution Systems Analysis & Computing and Control for the Water Industry (WDSA/CCWI 2024), Ferrara, Italy, 1–4 July 2024.
Eng. Proc. 2024, 69(1), 192; https://doi.org/10.3390/engproc2024069192
Published: 14 October 2024

Abstract

:
An EPA-SWMM model was used for the simulation of the intermittent water distribution system (WDS) of a small municipality in southern Italy. The model was compared with field data collected during an experimental campaign carried out in the intermittent WDS. The whole cycle of operation of the WDS was simulated, including the filling, distribution and emptying phases of the intermittent network. The modelling also included water leakages and private tanks that are normally interposed between network pipes and end users. Comparison of model results and experimental observations concerned water levels at the reservoirs and pressures at specific nodes of the WDS during some days of the experiments.

1. Introduction

Traditional hydraulic modelling software tools were developed to model continuous water distribution systems (WDSs) and do not include options for the proper modelling of intermittent WDSs. To overcome this limitation, in recent years, various researchers have modelled intermittent systems by creating their own software or modifying existing tools [1,2,3,4,5,6]. To different extents, previous models have been proven appropriate in the simulation of intermittent WDSs; however, many of these models have never been validated against comprehensive sets of field data. Some tests to validate the results of the use of the Storm Water Management Model developed by the U.S. Environment Protection Agency (EPA-SWMM) against field observations were provided by [7]; however, the available data allowed model validation only with reference to the filling phase of the network. Moreover, water leakages and users’ private tanks—normally installed by the users of intermittent WDSs—were not included in the simulation.
A recent campaign of experiments was conducted in an intermittent WDS in the south of Italy to monitor the filling, the distribution and emptying phases of the network [8]. This work presents some of the results of the comparison of a model developed with EPA-SWMM for the simulation of intermittent WDSs with field data from the cited campaign of experiments. Water leakages throughout the network and private tanks interposed between the network nodes and the end users in the case study WDS were also included in the model.

2. Materials and Methods
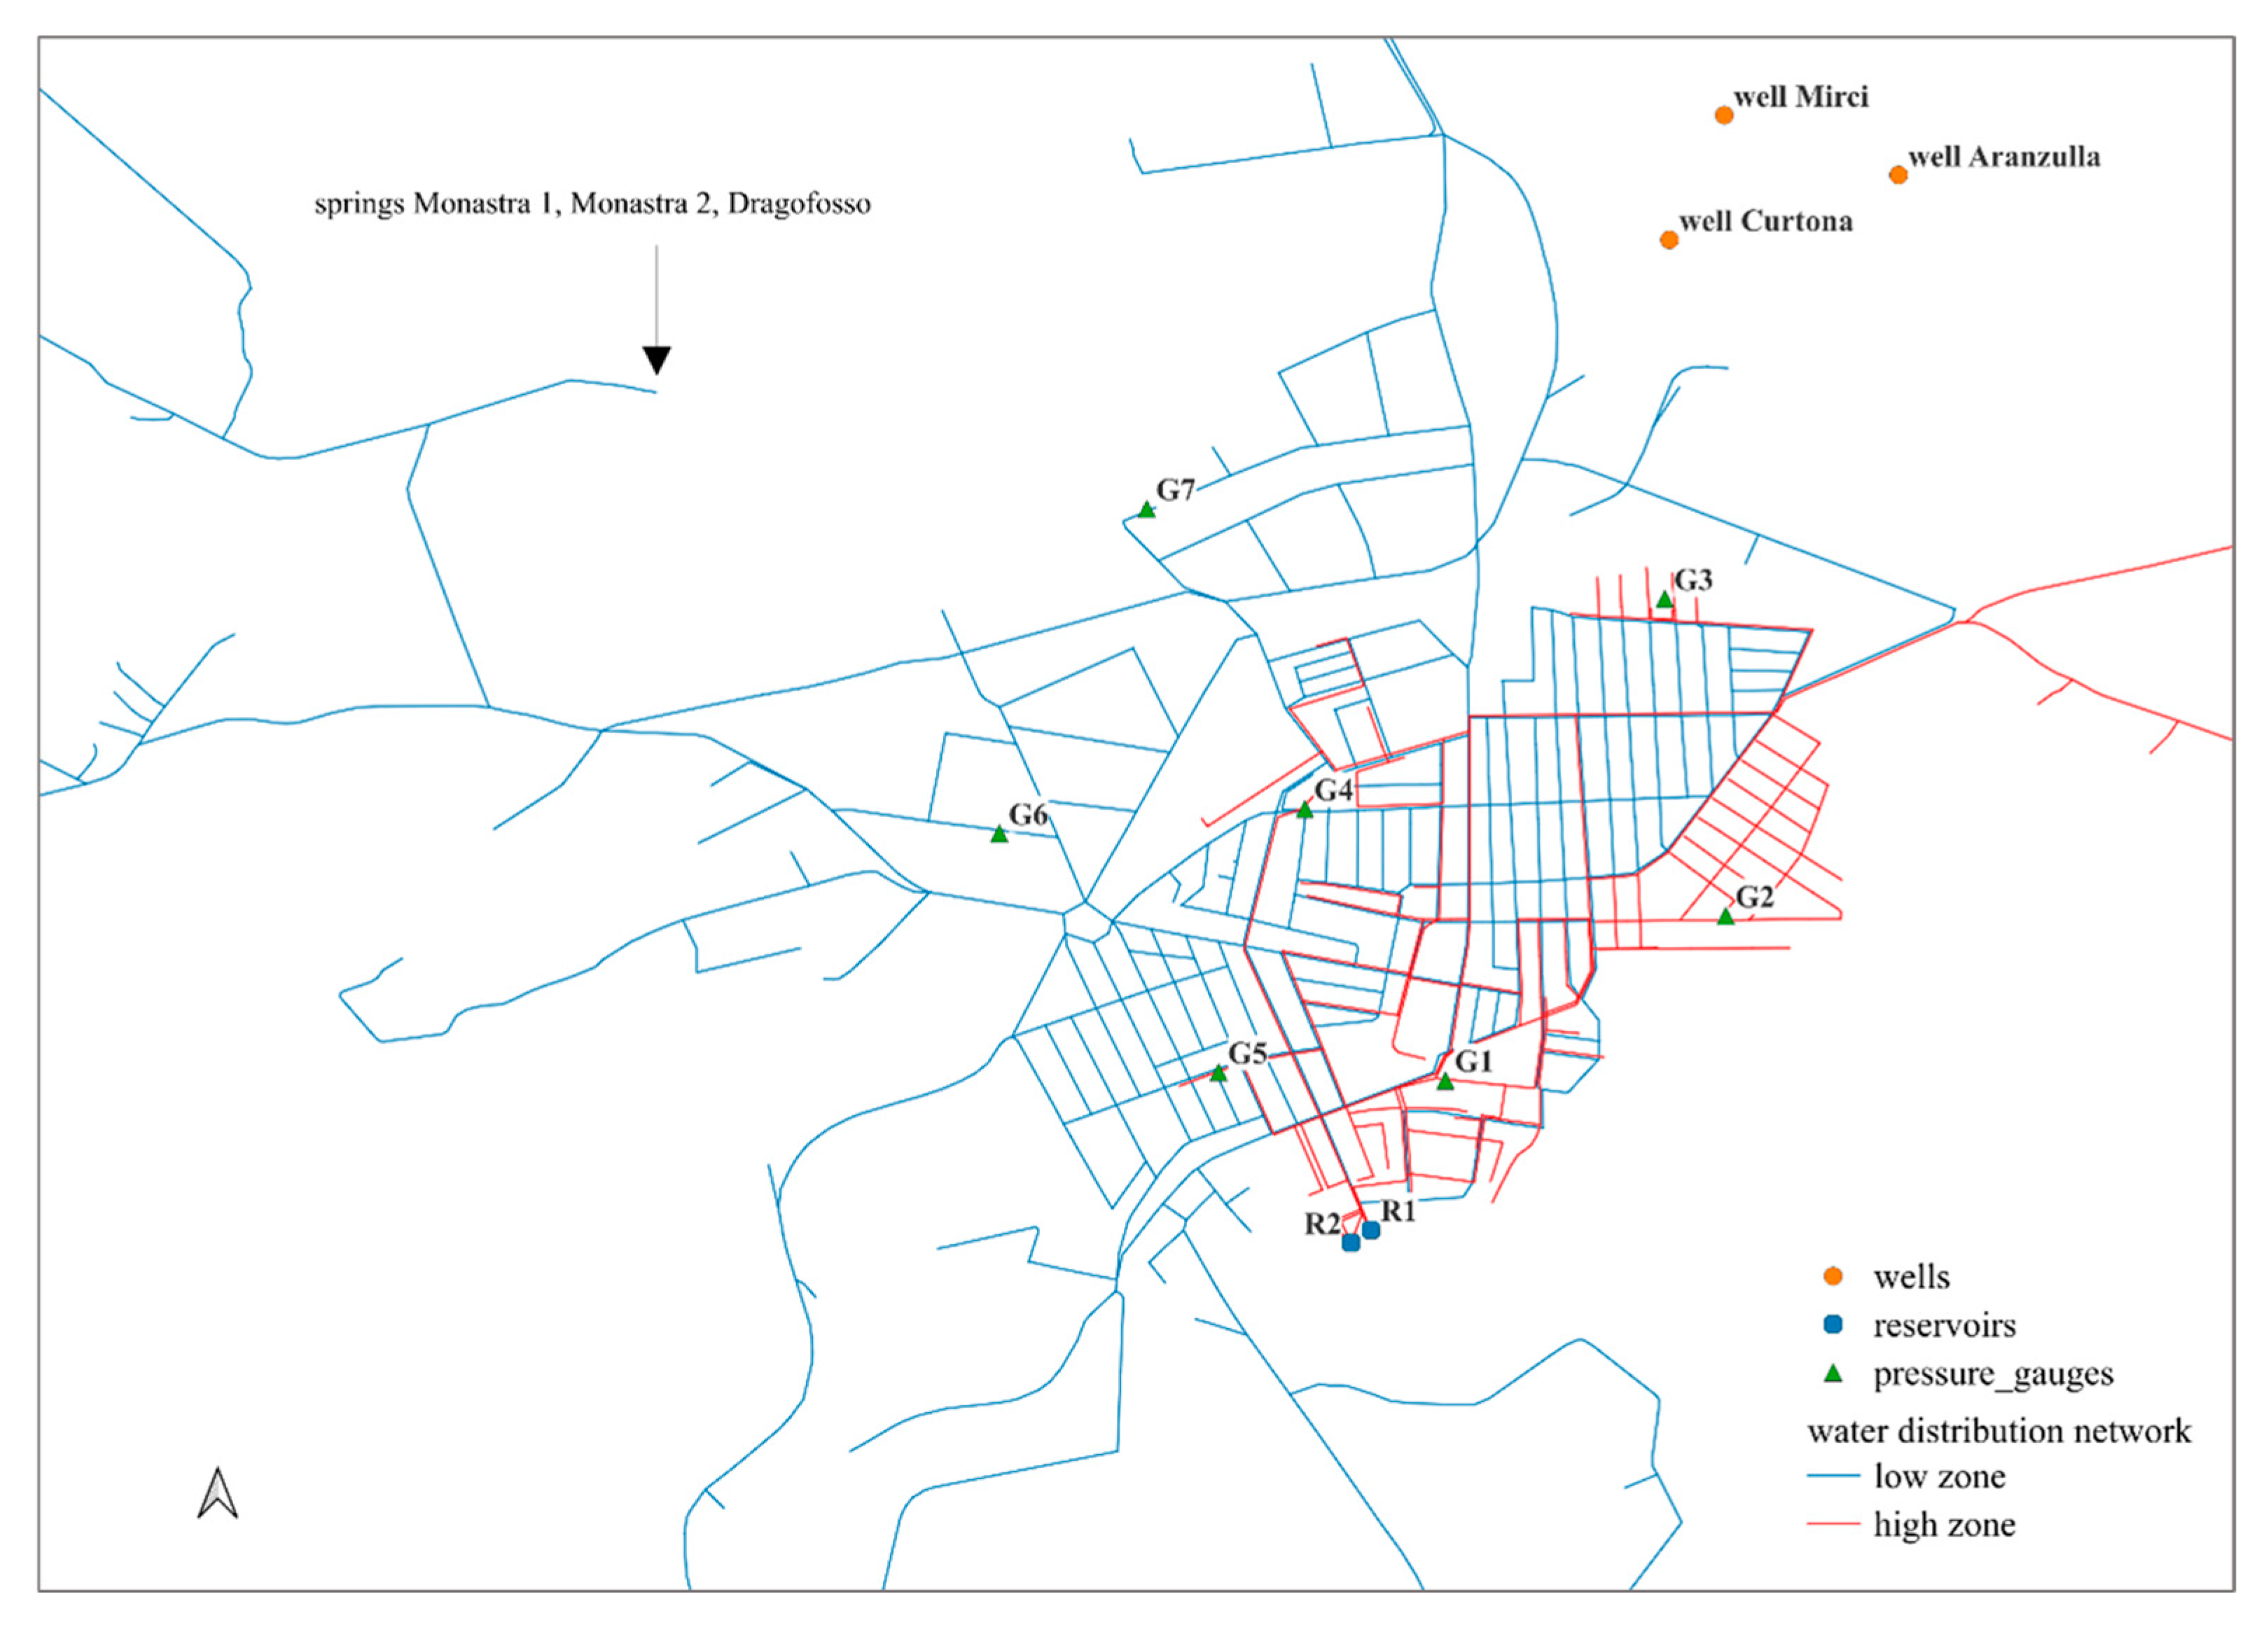
2.1. Case Study

The case study is the intermittent WDS of Mirabella Imbaccari, a municipality of about 5000 inhabitants located in southern Italy. Two municipal reservoirs (R1 and R2 in Figure 1) are located in the area at a high elevation in the town. Water sources (springs and wells) supply flow to R1 in a continuous way during the 24 h of the day. An overflow device is positioned at 3.72 m from the bottom of R1 allowing excess water from R1 to overflow to R2. Also, outlet pipes (DN200) from R2 are equipped with gate valves and convey flow in the two outlet pipes of R1 in order to supply the network. The WDS is divided into two portions that supply zones at different elevations: the “high zone” (in red in Figure 1) and the “low zone” (in blue in Figure 1). The two zones are connected by means of a main (DN200) just downstream of the two reservoirs. A servo-controlled gate valve installed in the connection main makes it possible to convey the whole flow to the high zone only (when required), thus disconnecting the low zone of the network during the intermittent supply.
The WDS provides water to the end-users intermittently. Households supplied by the WDS are equipped with private tanks to store water during supply hours and use it during non-supply periods. Normally, the gate valves of the outlet pipes of R1 are opened early in the morning and the network starts to be supplied. After 3–4 h, the gate valves of the outlet pipes of R1 are closed while those of R2 are opened. From this moment on, water flows to the network only from reservoir R2, while R1 is progressively refilled by the inflow from the sources. In the afternoon, the two gate valves of the outlet pipes of R2 are closed until the new opening operation of the following day. Generally, in the first 2–3 h of the supply period, the servo-controlled gate valve in the pipe connecting the high zone and the low zone is kept closed to ensure suitable pressure levels in the high part of the network. However, on weekend days, both zones of the network are supplied simultaneously from the early morning.
The campaign of field measurements in the WDS was conducted on some days of the period June–August 2019 [8]. Experimental measurements were taken during the filling phase, the phase of operation under pressure conditions, and the phase of the emptying of the network. Measurements include inflow to reservoir R1 from the sources, water levels in R1 and R2, flow discharges at the outlet pipes of the two reservoirs, and pressures at 7 specific locations of the network (3 pressure gauges and 4 pressure gauges were installed in the high and low zones of the network, respectively—G1 to G7 in Figure 1). The times of opening and closure of gate valves in the WDS were also recorded. The characteristics of the measurement equipment and of the field campaign are reported in [8].

2.2. Model Setup

Although originally developed for the modelling of urban drainage systems, EPA-SWMM makes it possible to simulate both free-surface and pressure flow conditions simultaneously, thus enabling a proper description of the behaviour of an intermittent WDS where the two flow regimes may coexists. The use of SWMM as applied to intermittent WDSs requires adapting/customizing the tools of the model for a correct description of the processes occurring during intermittent supply [3,4,7].
The building of the model of the WDS of Mirabella Imbaccari under an EPA-SWMM environment was made by skeletonizing of the network into 922 nodes and 1073 pipes. Pipe roughness was fixed according to material and age in the different portions of the network. Private tanks interposed between the network nodes and the users were modelled assuming a one cubic metre capacity for each 4-person household. Inflow to the tanks (float valve-equipped) were modelled according to [3,4]. User demand was modelled assuming a per capita water demand of 150 L and a diurnal pattern typical of small municipalities. Water leakages were modelled using a 2-parameter discharge–pressure relationship from the literature [9]. In particular, the exponent in the water leakage relationship was set according to [9], while the coefficient was evaluated in order to obtain good agreement between the experimental and simulated values of both the water levels at the reservoirs and the pressures at the nodes of the network.

3. Results

The model was applied to three days of experiments of the campaign of 2019, characterized by different water demand and supply modalities.
As an example, some results of the simulation of the network operation on Sunday, June 16th are shown in Figure 2. On such a day, both the high and low zones were supplied from 6:00 a.m. Figure 2a reports simulated and observed water levels W (m) in the two reservoirs. At 6:00 a.m., the water level in R1 is about 3.70 m. From that time until 9:40 a.m., the level decreases during the process of network filling. The switch to operation from R1 to R2 can be observed at about 9:40 a.m. At that time, the operators of the WDS closed the gate valves of reservoir R1 and simultaneously opened those of R2; the water level in R1 returns to rising due to inflow from the source. Conversely, the water level in R2 decreases due to outflow. At about 11:50 a.m., the gate valves of R2 are partially closed and the supply period is over. At around 4:00 p.m., R1 reached its maximum capacity and started to overflow to R2 (the water level in R1 remains relatively constant while that in R2 increases, see Figure 2a). Figure 2a shows the very good agreement between the simulated and experimental water levels in R1 and in R2. The emptying velocity (the slope of the curve) of R1 at the beginning of the supply period is reproduced relatively well by the model with correct simulation of the minimum water level achieved in the reservoir (1.9 m reached at 9:40 a.m.). Also, the filling velocity of reservoir R1 (after that the gate valves close at 9:40 a.m.) is reproduced properly by the model. The graph shows that the model also provides a reliable description of the process of overflow from R1, with a simulated water level that remains constant from 4:00 p.m., while the water level in R2 increases analogously to the experiments.
The results of the model, in terms of nodal pressures h (m) in the network, are shown in Figure 2b. The figure reports, as examples, pressure at gauges G2 and G6 located in the high and low zones of the network, respectively. Globally, the model correctly reproduces the behaviour of the WDS at the monitored nodes by capturing high-pressure (during water supply hours) and low-pressure (during no-supply hours) conditions during the day. In particular, the simulated pressure values fit the experimental data for G2 during the whole day quite well, including the abrupt drop in pressure after the closure of the gate valves at the reservoirs (at 11:50 a.m.). The model slightly overestimates pressure values in G6 during the supply hours and underestimates them during the non-supply hours.

Author Contributions

Conceptualization, A.G. and A.C.; methodology, A.G. and A.C.; software, A.G.; validation, A.G. and A.C.; writing—original draft preparation, A.G.; writing—review and editing, A.G. and A.C. All authors have read and agreed to the published version of the manuscript.

Funding

This research received no external funding.

Institutional Review Board Statement

Not applicable.

Informed Consent Statement

Not applicable.

Data Availability Statement

The raw data supporting the conclusions of this article will be made available by the authors on request.

Conflicts of Interest

The authors declare no conflicts of interest.

References

  1. De Marchis, M.; Fontanazza, C.M.; Freni, G.; La Loggia, G.; Napoli, E.; Notaro, V. A model of the filling process of an intermittent distribution network. Urban Water J. 2010, 7, 321–333. [Google Scholar] [CrossRef]
  2. Mohan, S.; Abhijith, G.R. Hydraulic Analysis of Intermittent Water-Distribution Networks Considering Partial-Flow Regimes. J. Water Resour. Plan. Manag. 2020, 146, 04020071. [Google Scholar] [CrossRef]
  3. Gullotta, A.; Butler, D.; Campisano, A.; Creaco, E.; Farmani, R.; Modica, C. Optimal Location of Valves to Improve Equity in Intermittent Water Distribution Systems. J. Water Resour. Plan. Manag. 2021, 147, 04021016. [Google Scholar] [CrossRef]
  4. Gullotta, A.; Campisano, A.; Creaco, E.; Modica, C. A Simplified Methodology for Optimal Location and Setting of Valves to Improve Equity in Intermittent Water Distribution Systems. Water Resour. Manag. 2021, 35, 4477–4494. [Google Scholar] [CrossRef]
  5. Suribabu, C.R.; Sivakumar, P. Analysis of Intermittent Water Distribution Networks Using a Dummy Emitter Device at Each Demand Node. J. Pipeline Syst. Eng. Pract. 2023, 14, 06023003. [Google Scholar] [CrossRef]
  6. Suribabu, C.R.; Sivakumar, P.; Sivakumar, N. Volume driven analysis for house level water supply assessment in an intermittent water supply system. ISH J. Hydraul. Eng. 2023, 29, 459–467. [Google Scholar] [CrossRef]
  7. Campisano, A.; Gullotta, A.; Modica, C. Using EPA-SWMM to simulate intermittent water distribution systems. Urban Water J. 2019, 15, 925–933. [Google Scholar] [CrossRef]
  8. Campisano, A.; Gullotta, A.; Modica, C. An Expeditious Campaign of Field Experiments for Preliminary Analysis of the Hydraulic Behavior of Intermittent Water Distribution Networks. Water 2023, 15, 1102. [Google Scholar] [CrossRef]
  9. Thornton, J.; Lambert, A. Progress in Practical Prediction of Pressure/Leakage, Pressure/Burst Frequency and Pressure/Consumption Relationships. In Proceedings of the IWA Special Conference ‘Leakage 2005’, Halifax, NS, Canada, 12–14 September 2005. [Google Scholar]
Figure 1. Water distribution system—location of springs, wells, reservoirs and pressure gauges.
Engproc 69 00192 g001
Figure 2. Experimental vs. modelled data: (a) water level in reservoirs R1 and R2; (b) pressure at gauges 2 (G2) and 6 (G6) on Sunday, June 16th.
Engproc 69 00192 g002
Disclaimer/Publisher’s Note: The statements, opinions and data contained in all publications are solely those of the individual author(s) and contributor(s) and not of MDPI and/or the editor(s). MDPI and/or the editor(s) disclaim responsibility for any injury to people or property resulting from any ideas, methods, instructions or products referred to in the content.

