Abstract
This study focuses on evaluating the spatiotemporal variations in water quality across a potable water distribution network in D City, South Korea, spanning from a reservoir to a large consumer’s tap. Utilizing water quality sensors installed at strategic points (the reservoir, District Metered Area inlet, consumer inlet, tank outlet, and tap), this research observes real-time changes in parameters such as chlorine concentration, turbidity, temperature, pH, and electrical conductivity. The investigation, conducted from 25 January 2024 to 4 February 2024, identifies significant trends such as the gradual decrease in chlorine concentration with distance and time, an increase in turbidity and temperature towards the consumer end, and variations in electrical conductivity. These observations suggest that there is an influence of pipe material interactions, water stagnation, and usage patterns on water quality. This study contributes to understanding the dynamic nature of tap water’s quality, highlighting the need for continuous monitoring and research to manage water quality effectively in urban distribution networks.
1. Introduction
As society progresses, there is a growing interest in public health, with tap water quality emerging as a significant concern due to its impact on consumers. The quality of tap water undergoes changes as it is processed at treatment plants and delivered to users’ taps through reservoirs. However, specific trends in water quality changes during this process have not been fully determined. Several studies have attempted to address this issue. Mengstie [1] investigated the behavior of parameters such as turbidity, electrical conductivity (EC), temperature, pH, and residual chlorine from a reservoir to a tap in Hawassa, a city in Ethiopia with a potable water network. This study revealed changes in water composition and identified correlations between various factors and distance. Similarly, Semerjian [2] assessed changes in water quality from a main water pipe to a tap and obtained results comparable to those of Mengstie [1]. However, these studies have limitations, as they only examined specific points and times, making it challenging to understand the detailed daily variations in water quality from the reservoir to the consumer.
To address these limitations, water quality sensors were installed at five points in an actual water distribution network: the reservoir, District Metered Area (DMA) inlet point, consumer inlet point, tank outlet point, and tap. These sensors observed the changes over time in six parameters: flow rate, chlorine (Cl), turbidity, pH, electrical conductivity, and temperature. This study aimed to examine the changes in water quality associated with the movement of tap water.
2. Method
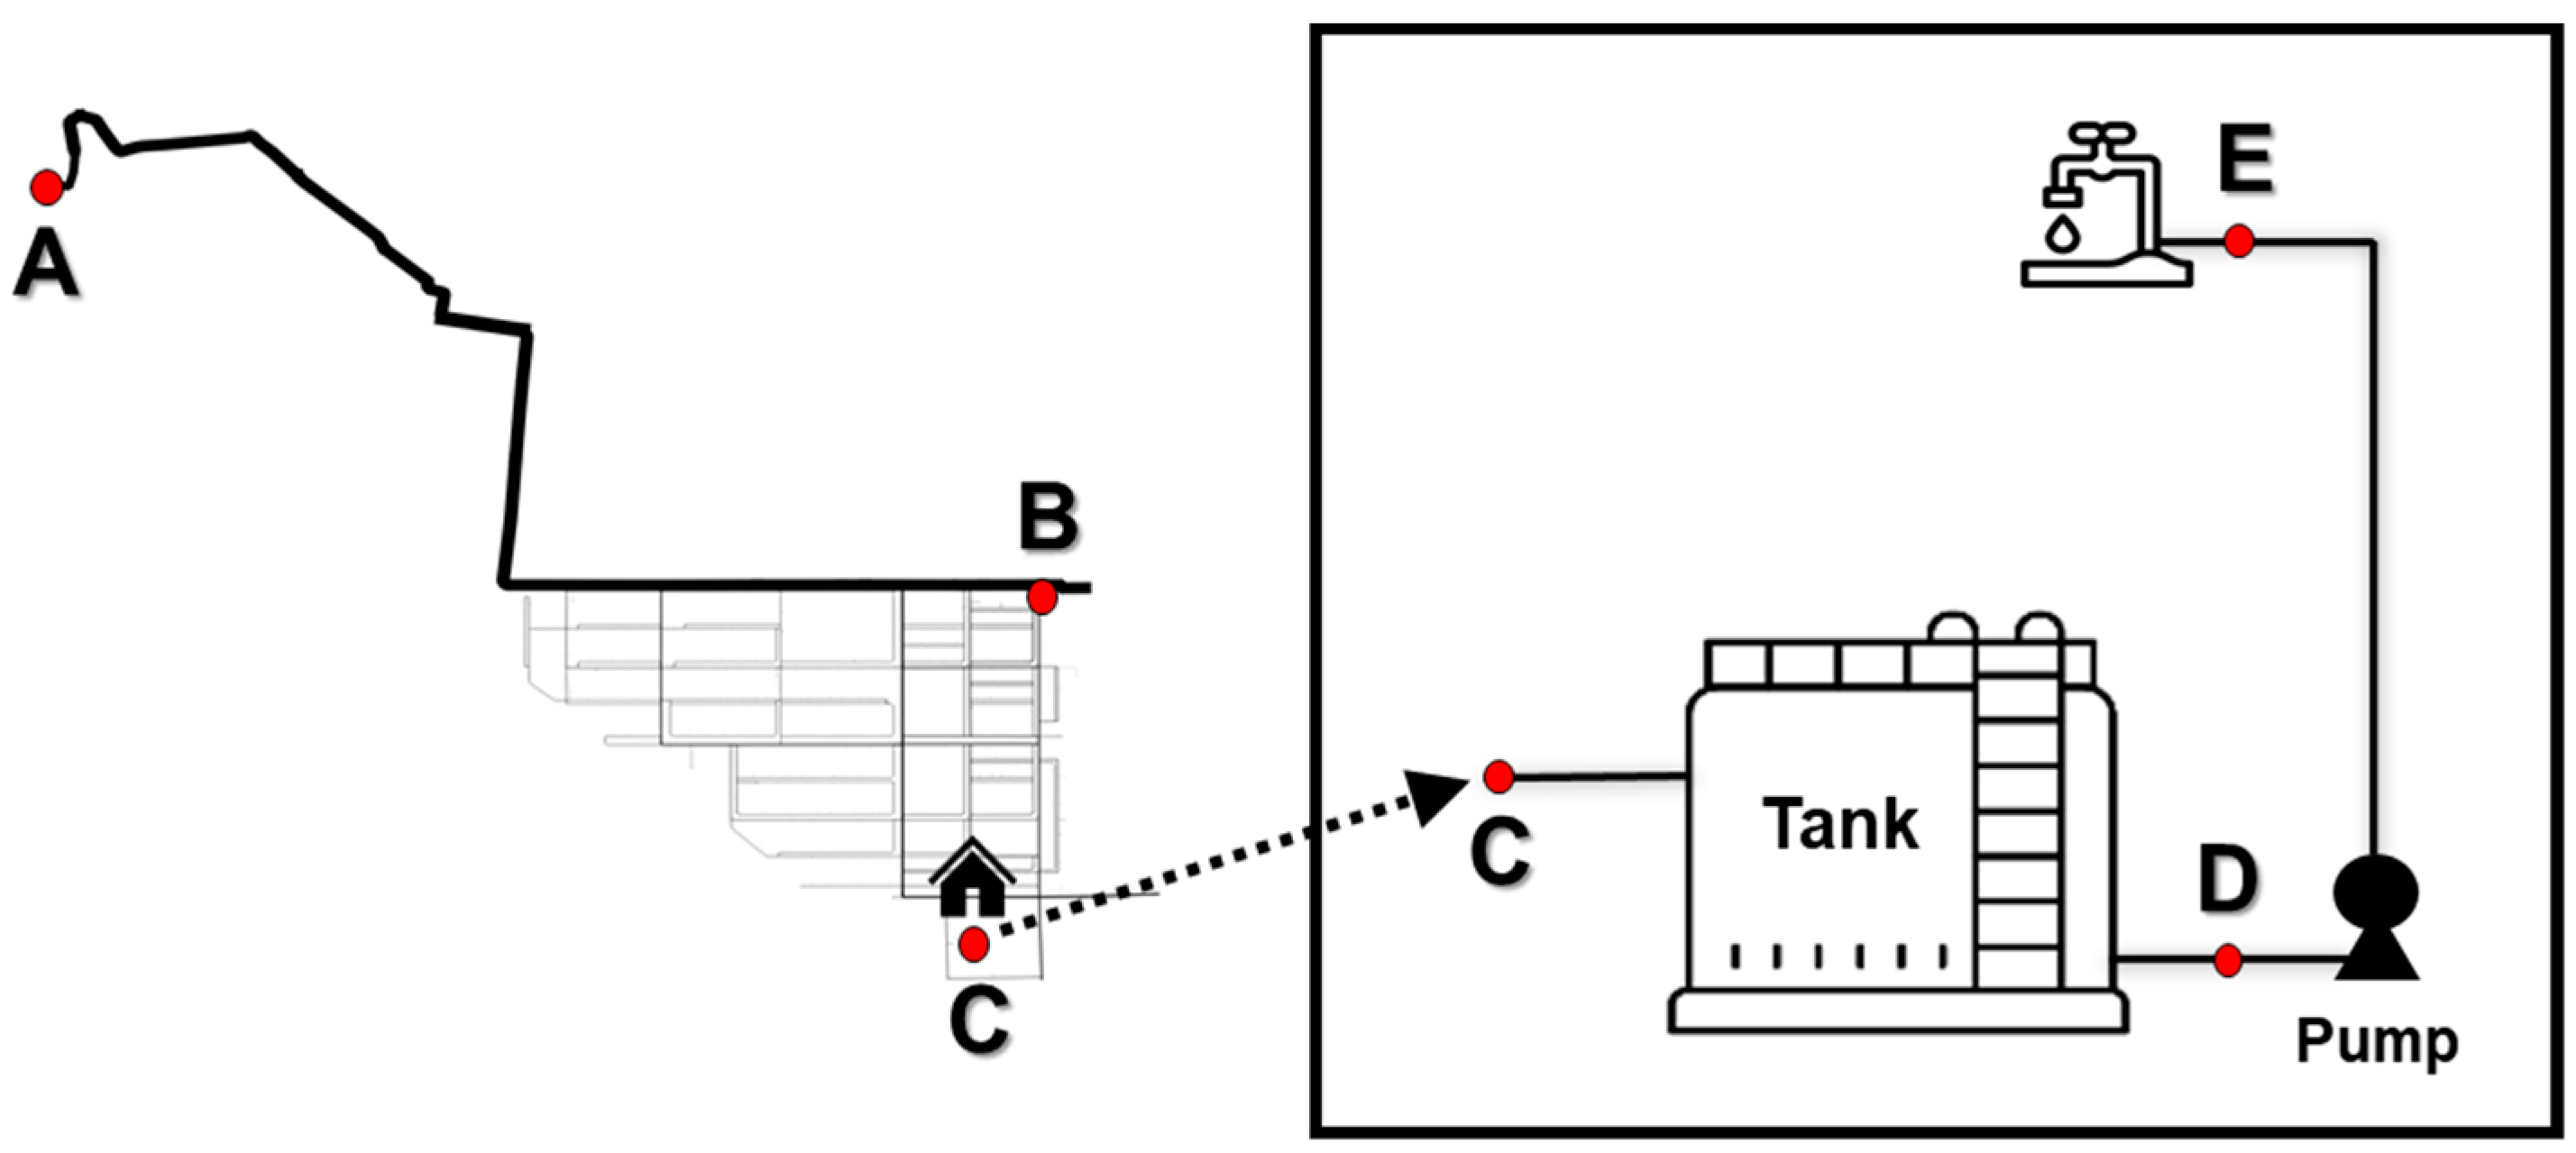
The study sites were a reservoir located in D city, South Korea, and a single large consumer receiving potable water from this reservoir. Figure 1 is an overview diagram showing the potable water network and the location of each testing point.
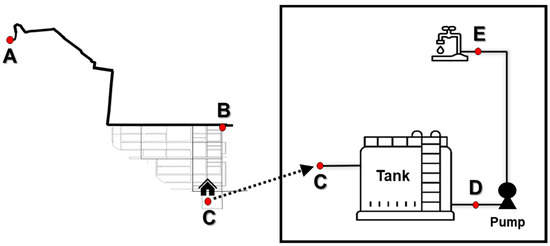
Figure 1.
Overview of a potable water distribution network in D City, illustrating key points: (A) Reservoir at approximately 96 m altitude supplying water to several blocks, including the DMA; (B) Water inlet of the DMA located 4.89 km from the reservoir; (C) Major consumer located 2 km from the DMA inlet with a building tank on the first underground floor; (D) Real-time tap water outflow measurement point downstream of the tank; (E) Tap located in a restroom on the first floor.
Point A is a reservoir located at an altitude of approximately 96 m, supplying tap water to several medium-sized blocks, including the District Metered Area (DMA) involved in this study. The pipes from the reservoir to the DMA have an average diameter of 1730 mm and are entirely made of steel. Point B is the water inlet of the aforementioned DMA, positioned at the beginning of the DMA, which receives tap water from the reservoir, making it the area that receives water most rapidly. It is located approximately 4.89 km away from the reservoir and serves 594 consumers. Point C, a significant water consumer, is situated approximately 2 km from the DMA’s inlet. The supply pipeline for this consumer has a diameter of 100 mm and is made of polyethylene. The building spans two underground floors and four above-ground floors. At Point C, a tank on the first underground floor supplies tap water, excluding firewater, to the entire building. All tap water used in the building passes through this tank. Point D is located immediately downstream of the tank, where the tap water outflow is measured in real time. The tank dimensions are approximately 9 × 7 × 3 (LWH) m, with the water level maintained at approximately 2 m. The building has four floors, and tap water is pumped from the underground to higher floors through pumps installed at the rear end of the tank. Point E, the tap, is situated in a restroom on the first floor, with the floor height between the underground first floor and the ground floor being approximately 5 m.
To investigate changes in water composition and correlations between different factors according to the distance traveled, flow meters and water quality sensors were installed at each location to collect real-time data. The data collection period was from 25 January 2024 to 4 February 2024. Data at the reservoir and DMA were collected at 5 min intervals, whereas data at the large consumer inlet, tank outlet, and tap locations were collected at 1 min intervals. The measured parameters were chlorine (Cl), turbidity, pH, electrical conductivity, temperature, and flow rate, with the electrical conductivity and flow rate measurements omitted at the reservoir and tap locations, respectively.
3. Result
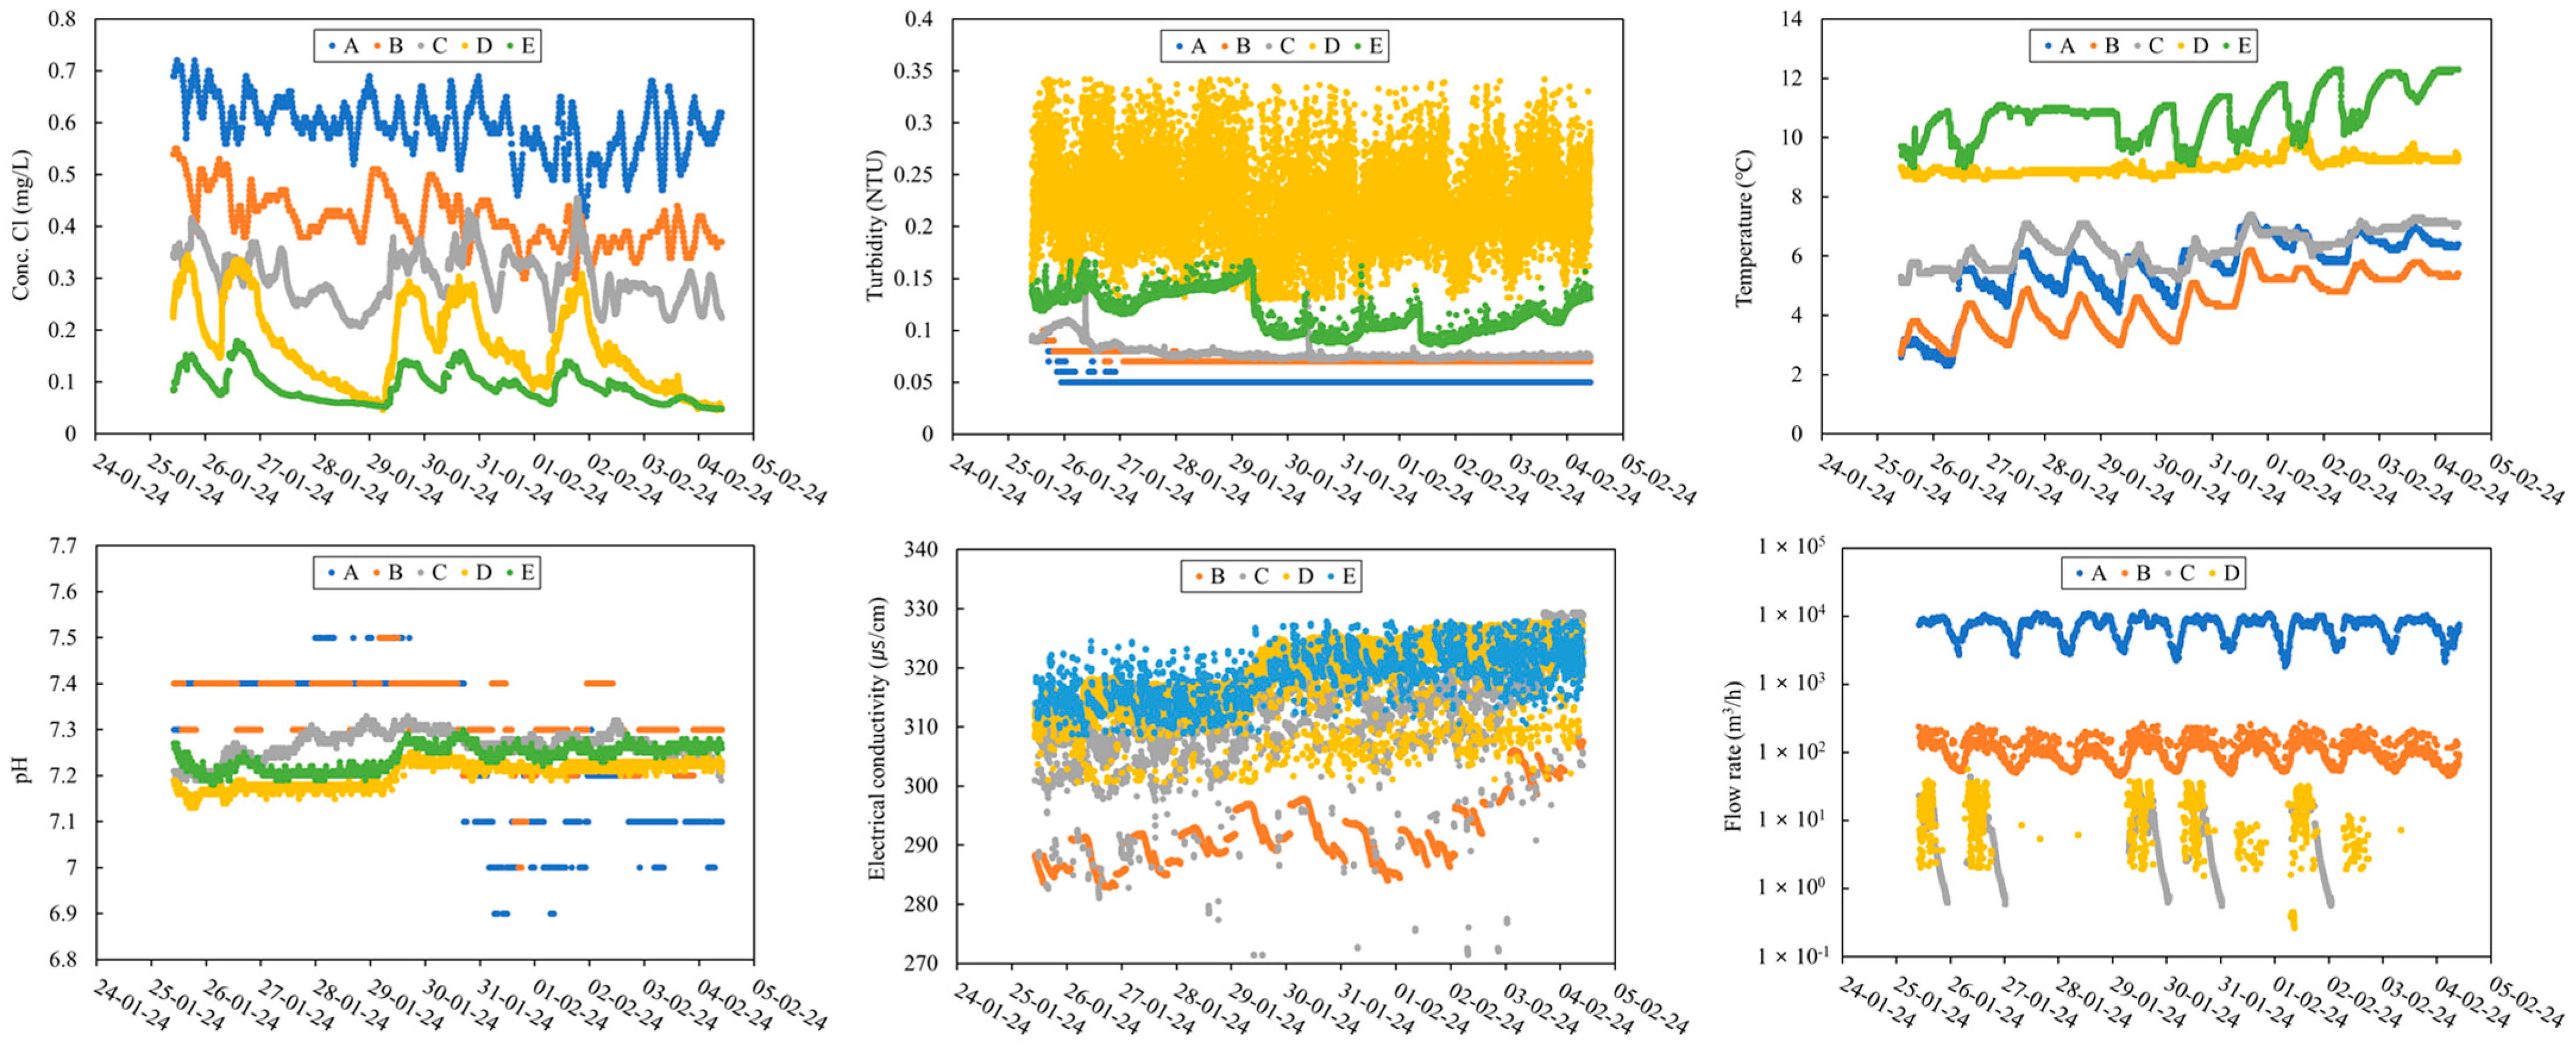
Figure 2 elucidates the time-series variations and Table 1 lists the average values and standard deviations of the observed water quality parameters at each location.
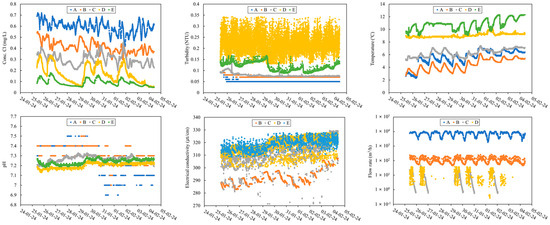
Figure 2.
Time-series analysis of water quality parameters at key points: (A) Reservoir supplying water to several blocks, including the DMA; (B) Water inlet of the DMA; (C) Major water consumer with a building tank; (D) Real-time water outflow measurement point downstream of the tank; (E) Tap located in a restroom on the first floor.

Table 1.
Average values and standard deviations of water quality parameters by location.
As water flowed from point A to point E, the chlorine concentration gradually decreased. This reduction likely occurred due to increased contact time with the pipe walls as the water traveled further [3,4]. The initial chlorine concentration at point A was 0.59 mg/L (Table 1). It was observed that the chlorine concentration met the World Health Organization’s (WHO) guideline of 0.2 to 0.5 mg/L from points B to C. However, when water entered and subsequently exited the tank, the concentration fell below the guideline value to less than 0.2 mg/L. The distances from A to B and B to C were 4.95 km and 2 km, respectively, which are relatively long, whereas the distances from C to D and D to E were less than 200 m, which are relatively short. However, the degree of chlorine concentration reduction from C to D and D to E (43.33% and 47.06%, respectively) was greater than that observed from A to B and B to C (30.51% and 26.83%, respectively). Studies investigating the correlation between water age and chlorine concentration have shown that the chlorine concentration significantly decreases as tap water stagnates [5,6], which is consistent with the findings of the present study.
Turbidity also increased from points A to E, except at point D. The turbidity at point E began to rise from 9 AM on weekdays, when water usage started, and then decreased after a certain period. This suggests that, similar to the behavior of residual chlorine, internal turbidity is sensitive to the volume of water used by the building’s occupants. The average temperature was significantly higher at points D and E, at 9.06 °C and 10.81 °C respectively, indicating that the temperature of the tap water increased due to stagnation inside the tank during weekday evenings and weekends. The highest average pH was observed at point B (7.33), with the pH gradually increasing from 9 AM to 6 PM at points C, D, and E. The lowest average electrical conductivity was recorded at point B (291.97 µS/cm), with the highest values observed at points D and E (318.7 µS/cm and 318.14 µS/cm, respectively). This study found that the electrical conductivity values increased as the water moved from the reservoir to the tap, in contrast to previous studies which have reported varying results at similar points [1,2,7]. The instantaneous flow rate decreased from points A to E, with a regular pattern observed at points A and B, regardless of the day of the week. Conversely, at points C and D, a sharp increase in water usage was noted only during weekday mornings.
4. Discussion
This study enabled time-series observations of the changes in water parameters at each location within the study area. The variations in water quality from production to tap water supply in the distribution network exhibited diverse spatiotemporal patterns depending on the location they were measured in. Specifically, differences in residual chlorine and turbidity were observed to be significant due to the decrease in concentration induced by chemical reactions and the physical behavior of particulate turbidity, respectively. These findings underscore the need for further research to elucidate the underlying causes of these disparities.
Author Contributions
Conceptualization, H.K.; Methodology, H.K.; Formal analysis, E.J.; Visualization, K.J.; Investigation, S.L. and K.-Y.H.; Supervision, H.K. All authors have read and agreed to the published version of the manuscript.
Funding
This research was funded by the Korea Planning & Evaluation Institute of Industrial Technology, which is funded by the Ministry of the Interior and Safety (MOIS, Korea), [Project Name: Development of water quality platform to prevent with tap/drinking water accidents], grant number 20025188.
Institutional Review Board Statement
This research did not involve human participants or animals, and therefore, no IRB approval was required.
Informed Consent Statement
Not applicable. This study did not involve human participants.
Data Availability Statement
The data presented in this study are available on request from the corresponding author.
Conflicts of Interest
Author Kyung-Yup Hwang was employed by the company Technology Research Institute, BLUESEN Co., Ltd. The remaining authors declare that the research was conducted in the absence of any commercial or financial relationships that could be construed as a potential conflict of interest.
References
- Mengstie, Y.A.; Desta, W.M.; Alemayehu, E. Assessment of Drinking Water Quality in Urban Water Supply Systems: The Case of Hawassa City, Ethiopia. Int. J. Anal. Chem. 2023, 2023, 8880601. [Google Scholar] [CrossRef] [PubMed]
- Semerjian, L.; Al-Bardan, M.; Kassar, M.G.A. Assessment of water quality variations from mains to building storage tanks in Sharjah, United Arab Emirates. Environ. Monit. Assess. 2021, 193, 629. [Google Scholar] [CrossRef] [PubMed]
- Fisher, I.; Kastl, G.; Sathasivan, A. New model of chlorine-wall reaction for simulating chlorine concentration in drinking water distribution systems. Water Res. 2017, 125, 427–437. [Google Scholar] [CrossRef]
- Hallam, N.B.; West, J.R.; Forster, C.F.; Powell, J.C.; Spencer, I. The decay of chlorine associated with the pipe wall in water distribution systems. Water Res. 2002, 36, 3479–3488. [Google Scholar] [CrossRef] [PubMed]
- Geng, B.; Fan, J.; Shi, M.; Zhang, S.; Li, J. Control of maximum water age based on total chlorine decay in secondary water supply system. Chemosphere 2022, 287, 132198. [Google Scholar] [CrossRef]
- US Environmental Protection Agency. Effects of Water Age on Distribution System Water Quality; EPA: Washington, DC, USA, 2002.
- Duressa, G.; Assefa, F.; Jida, M. Assessment of Bacteriological and Physicochemical Quality of Drinking Water from Source to Household Tap Connection in Nekemte, Oromia, Ethiopia. J. Environ. Public Health 2019, 7, 2129792. [Google Scholar] [CrossRef] [PubMed]
Disclaimer/Publisher’s Note: The statements, opinions and data contained in all publications are solely those of the individual author(s) and contributor(s) and not of MDPI and/or the editor(s). MDPI and/or the editor(s) disclaim responsibility for any injury to people or property resulting from any ideas, methods, instructions or products referred to in the content. |
© 2024 by the authors. Licensee MDPI, Basel, Switzerland. This article is an open access article distributed under the terms and conditions of the Creative Commons Attribution (CC BY) license (https://creativecommons.org/licenses/by/4.0/).