Proceeding Paper

A Python-Based Tool for Real-Time Reverse Osmosis Data Normalization in Desalination Applications †

by
Nitin Prasad
1,
Abhilasha Maheshwari
1,*,
Ganesh Kumar Pandian
2 and
Vijaysai Prasad
2
1
Department of Chemical Engineering, IIT Jodhpur, Jodhpur 342037, India
2
L&T ECC, Chennai 600089, India
*
Author to whom correspondence should be addressed.
Presented at the 3rd International Joint Conference on Water Distribution Systems Analysis & Computing and Control for the Water Industry (WDSA/CCWI 2024), Ferrara, Italy, 1–4 July 2024.
Eng. Proc. 2024, 69(1), 98; https://doi.org/10.3390/engproc2024069098
Published: 10 September 2024

Abstract

:
This work presents the development of a Python-based data normalization tool designed to facilitate RO performance monitoring The tool generates normalized metrics, including salt rejection, pressure difference, and permeate flow rate, providing a clear and consistent baseline for performance evaluation. To validate the tool’s efficacy, a single-stage RO system was modeled using the WAVE Water Treatment Design Software. The RO was simulated under various operating conditions, and the dataset derived from these simulations was processed using the Python tool, demonstrating its utility in generating and visualizing significant normalized results for effective RO performance monitoring.

1. Introduction

In the current context of global water scarcity, brackish water is one of the important sources of freshwater via the desalination process, mainly in arid regions. Reverse osmosis (RO) is a membrane-based demineralization technique used to separate dissolved solids, such as ions, from solution [1]. The complex nature of RO systems in desalination plants makes it difficult to interpret observed performance accurately, as fluctuations may not necessarily indicate membrane-related issues. Data normalization has emerged as a crucial tool to address this challenge, enabling the comparison of performance over time by decoupling the effects of external factors such as temperature, pressure, and water quality. This helps in eliminating any effects of temperature, pressure, and water quality so that the only changes in the normalized performance are due to membrane fouling, scaling, and degradation.
This paper aims to develop a Python-based tool to monitor RO performance by normalizing the RO data. For this, an RO model was developed using WAVE Water Treatment Design Software [2], which was simulated for different operating conditions to generate datasets. These generated data were then processed by the Python tool to obtain the normalized metrics, demonstrating its utility in generating and visualizing significant normalized results for effective RO performance monitoring. Taken together, this tool provides a soft-computing resource for true RO performance monitoring, which is crucial for reducing the additional energy spent if the RO is cleaned or replaced timely. Thus, helps in estimating the optimal cleaning time for the RO membranes.

2. RO Modeling and Simulation

To develop an RO model, we used the WAVE Water Treatment Design Software. A single-stage RO model was designed, which had 1 pressure vessel and 7 elements per pressure vessel; the element type was “BW30-365”, and the water type was “Municipal Water”. This RO design was simulated for different cases of operating conditions, including feed flow, feed temperature, feed TDS, feed pressure, and flow factor. In each case, one of these parameters was varied, keeping the other parameters fixed. This was performed to understand the effects of the varying parameters on RO performance. These cases are mentioned in Table 1.

3. Python Tool Development

The objective of the Python script is to take RO data and return the normalized permeate flow rates, normalized salt passage, and normalized pressure difference along with the plots. To develop this, the following equations were used as a normalization algorithm:

3.1. Normalized Permeate Flow

Qpn = Qpo × (NDPr/NDPo) × (TCFr/TCFo)
  • Here, Qpn represents the normalized permeate flow, Qpo is the operating permeate flow, NDPr is the reference driving pressure, NDPo is the operating net driving pressure, TCFr is the reference temperature correction factor, and TCFo is the operating temperature correction factor.

3.2. Normalized Differential Pressure

DPn = (DPo × ((Qfr + Qcr)/2)1.7)/((Qfo + Qco)/2)1.7
  • Here, DPn represents the normalized differential pressure, DPo is the operating differential pressure, Qfo is the operating feed flow, Qco is the operating concentrate flow, Qfr is the reference feed flow, and Qcr is the reference concentrate flow.

3.3. Normalized Salt Passage

%SPn = %SPo × (Qpo/Qpr) × (Cfr/Cfo) × (Cfr_avg/Cfo_avg) × (TCFr/TCFo)
  • Here, SPn represents the normalized salt passage, Cfo is the operating feed salinity, Cfr is the reference feed salinity, Cfo_avg is the operating log mean feed salinity, and Cfr_avg is the reference log mean feed salinity.

4. Results

4.1. Case 1: Feed Temperature Variations

Figure 1 shows the Effect of feed temperature variations.

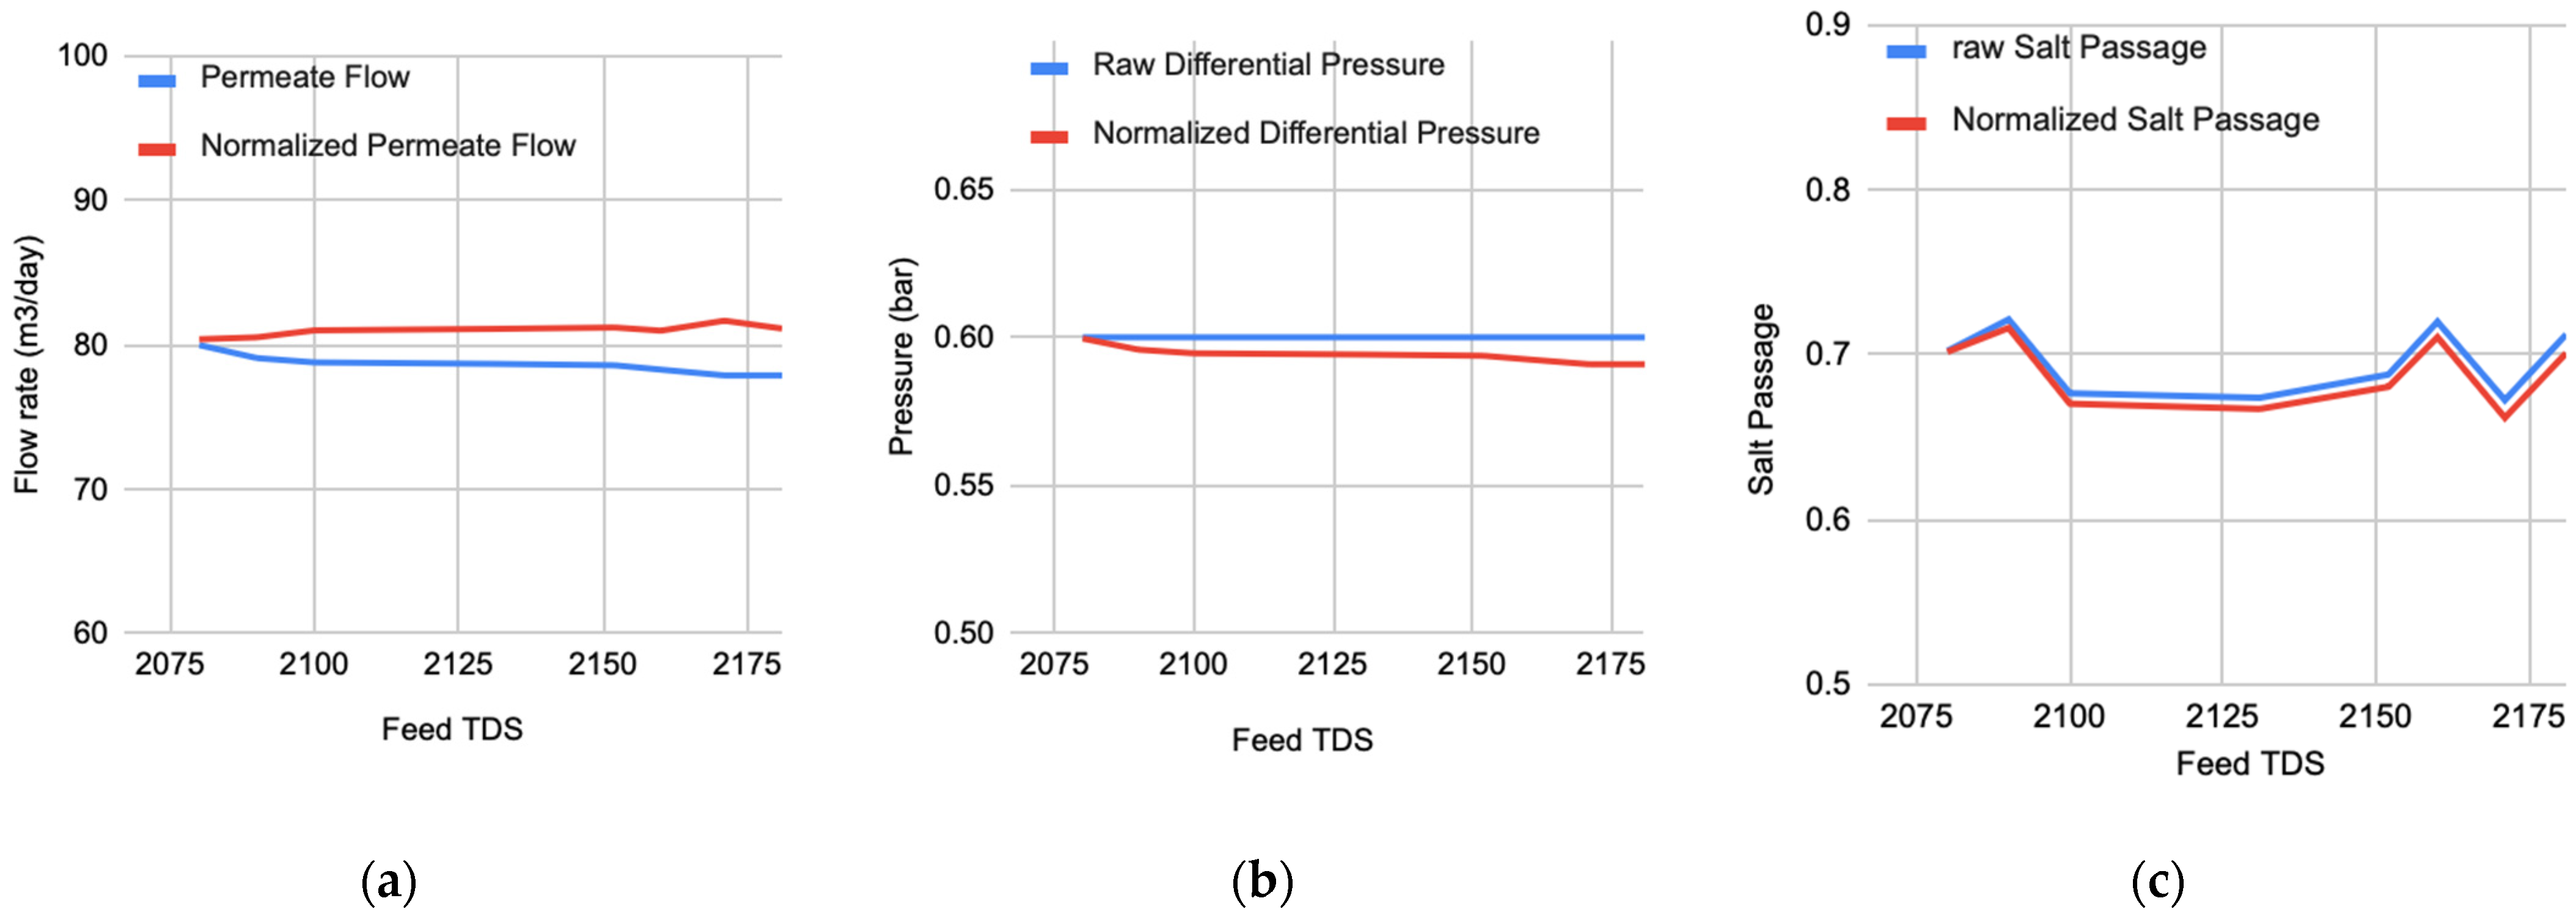
4.2. Case 2: Feed TDS Variations

Figure 2 shows the effect of feed TDS variations.

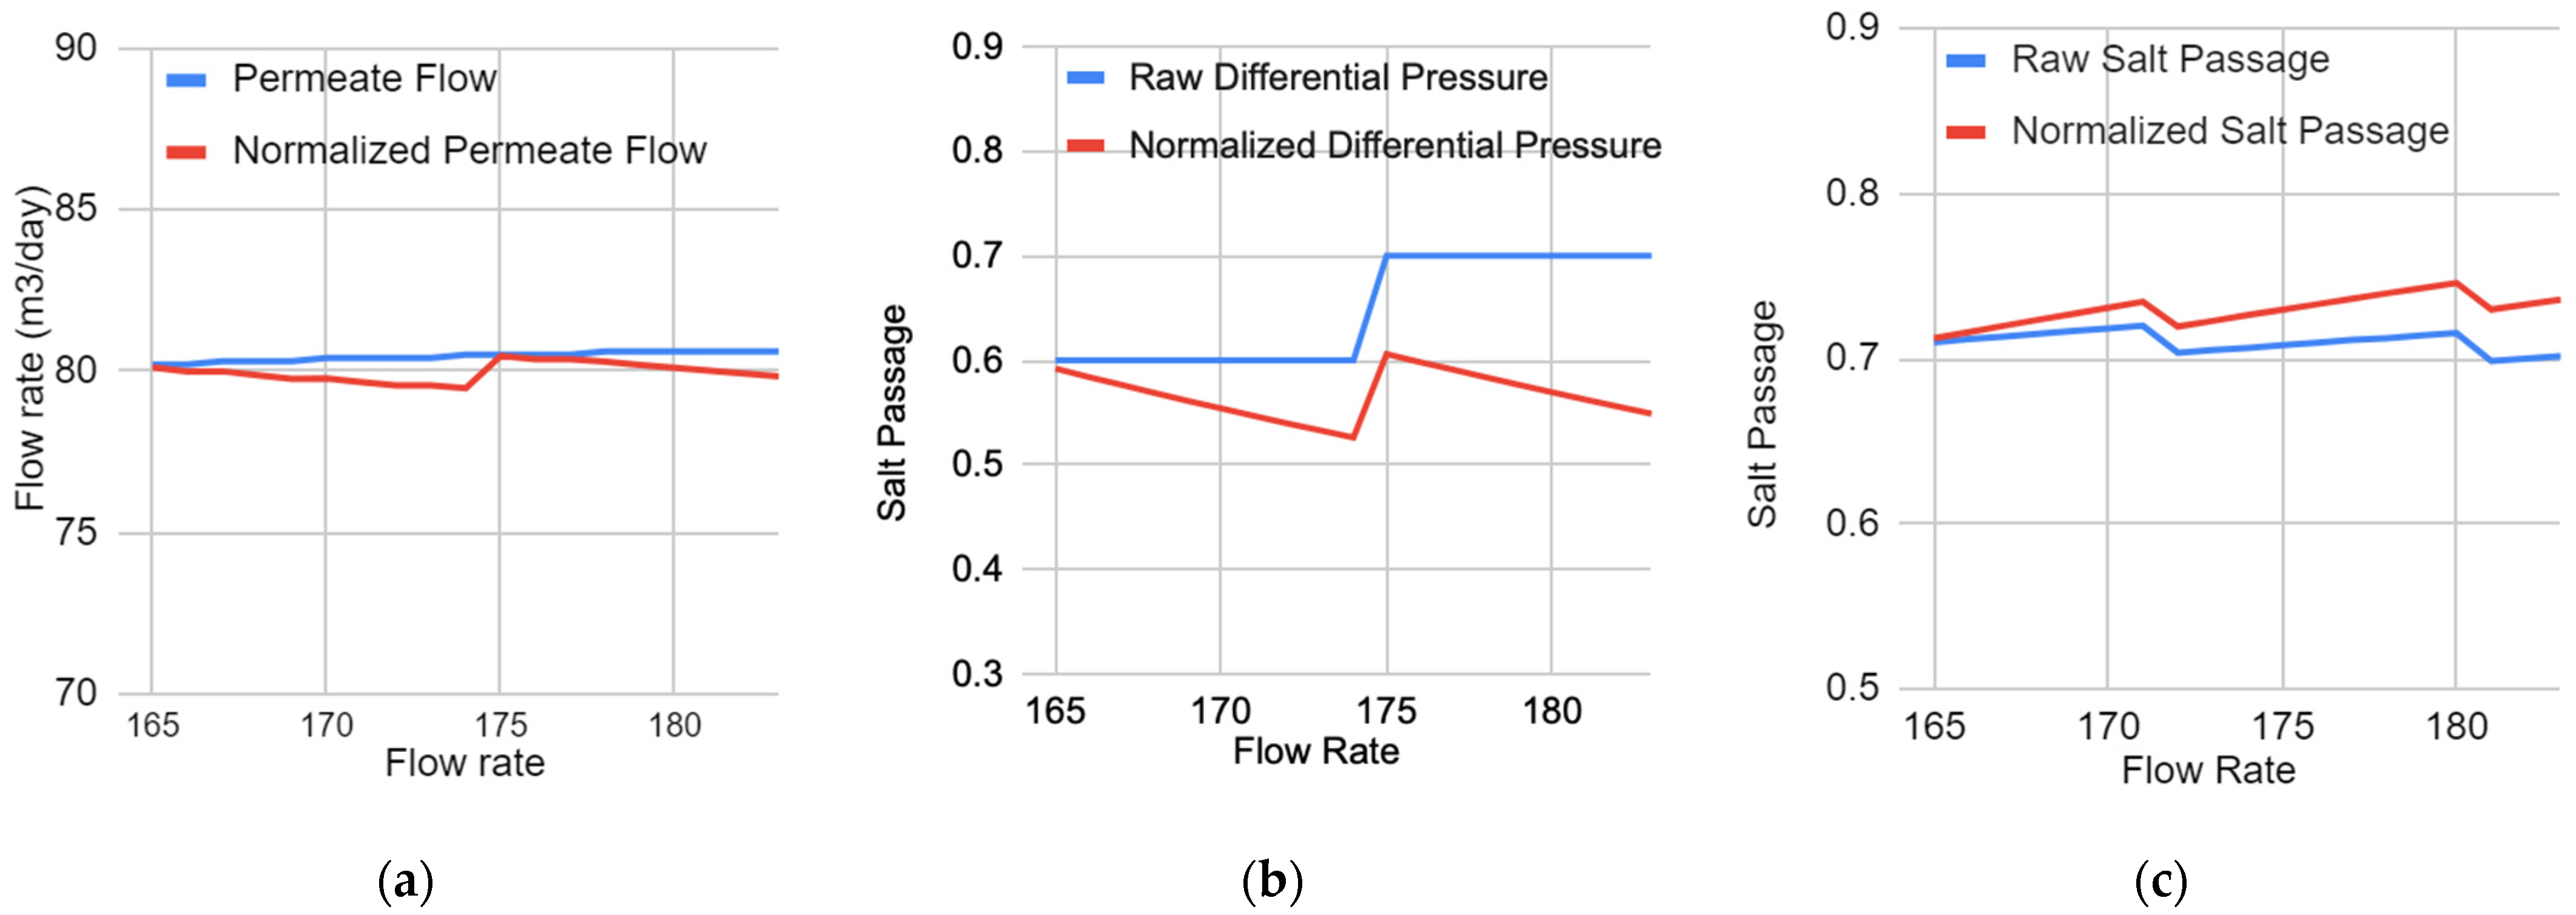
4.3. Case 3: Feed Flow Variations

Figure 3 shows the effect of feed flow variations.

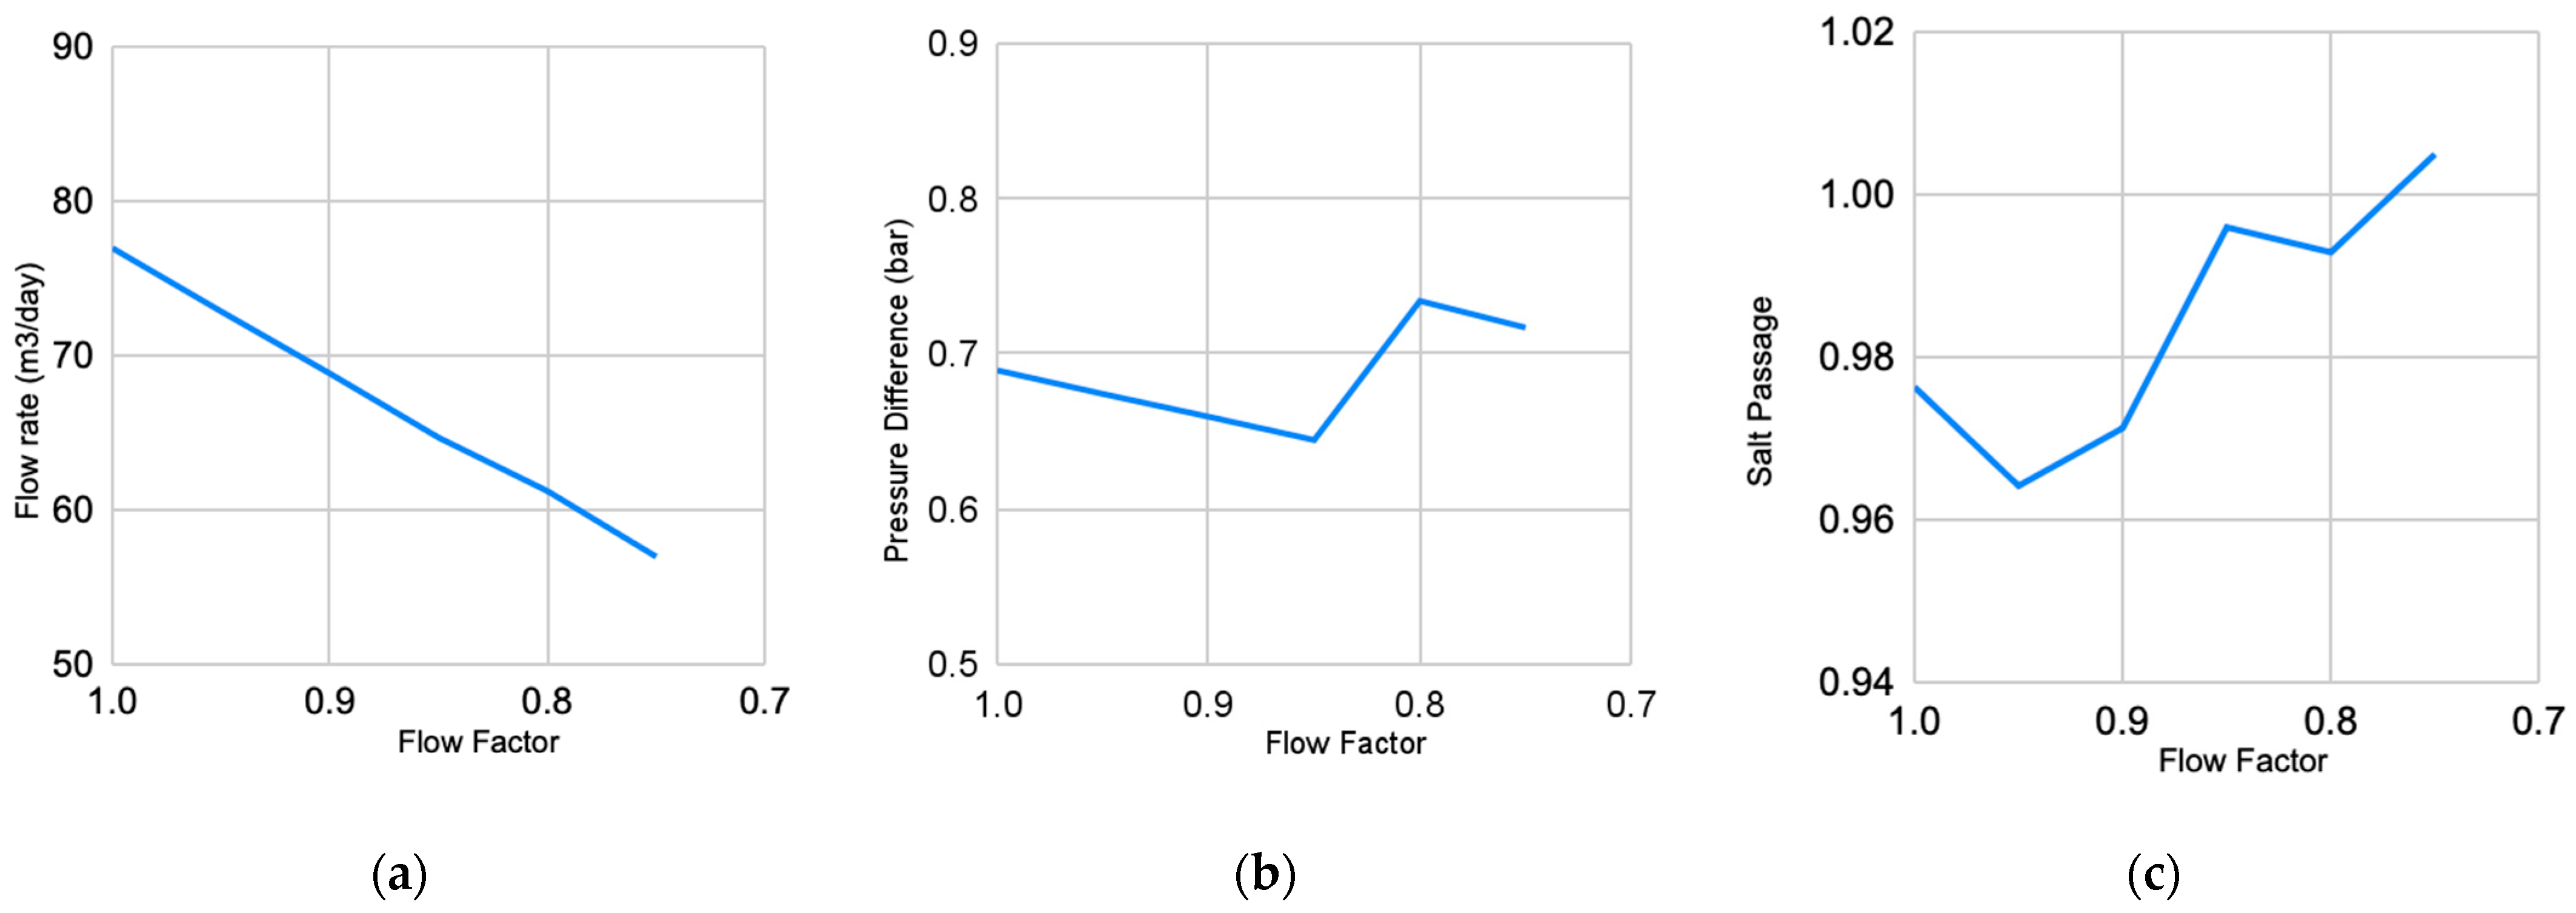
4.4. Case 4: Flow Factor Variations

Figure 4 shows the effects of flow factor variations.

5. Discussion

Figure 1, Figure 2 and Figure 3 show the comparison of normalized and raw parameters, highlighting how normalization mitigates the effects of temperature, TDS, and flow rates. These normalized values are crucial for evaluating RO membrane performance. Figure 4 validates the normalization method, as here the x-axis represents the age of the membrane, with 1 being a freshly installed membrane; as the age increases, the flow factor decreases, representing fouling/scaling. We can observe that in Figure 4a, the normalized flow rate has a negative slope, in Figure 4b, the pressure difference is increasing, and in Figure 4c, the salt passage is increasing. All of these factors are indications of fouling/scaling in the membrane. These results show that the proposed Python tool is effective in determining fouling/scaling in a membrane, a prerequisite for the optimal estimation of cleaning/ replacement time, which is a subject matter of future research by the authors.

Author Contributions

Data curation, N.P.; investigation, N.P.; software, N.P.; visualization, N.P.; writing—original draft preparation, N.P.; project administration, A.M.; validation, A.M.; writing—review and editing, A.M.; supervision, A.M.; validation, G.K.P.; validation, V.P. All authors have read and agreed to the published version of the manuscript.

Funding

This research received no external funding.

Institutional Review Board Statement

Not applicable.

Informed Consent Statement

Not applicable.

Data Availability Statement

Data supporting reported results can be found at this link: https://drive.google.com/drive/folders/1Ul8LtJNPGGxCYDO48lAR9L_KUEcfW79E?usp=sharing (accessed on 6 September 2024).

Conflicts of Interest

The authors declare no conflicts of interest.

References

  1. Kucera, J. Reverse Osmosis Industrial Applications and Processes, 1st ed.; Scrivener Publishing: Salem, MA, USA, 2010; pp. 3–4. [Google Scholar]
  2. Dupont. Available online: https://www.dupont.com/water/resources/design-software.html (accessed on 1 April 2024).
Figure 1. Effect of feed temperature variations. (a) Normalized and permeate flow; (b) normalized and raw differential pressure; (c) normalized and raw salt passage.
Engproc 69 00098 g001
Figure 2. Effect of feed TDS variations. (a) Normalized and raw permeate flow; (b) normalized and raw differential pressure; (c) normalized and raw salt passage.
Engproc 69 00098 g002
Figure 3. Effect of feed flow variations. (a) Normalized and raw permeate flow; (b) normalized and raw differential pressure; (c) normalized and raw salt passage.
Engproc 69 00098 g003
Figure 4. Effects of flow factor variations. (a) Normalized permeate flow; (b) normalized differential pressure; (c) normalized salt passage.
Engproc 69 00098 g004
Table 1. Different cases of parameters which were used to generate data.
CasesFeed Flow
(m3/Day)
Feed Temperature
(°C)
Feed TDS
(mg/L)
Feed Pressure
(bar)
Flow Factor
Case 1162–18325197861
Case 216225–451978 61
Case 3162251978–218161
Case 42412519782–101
Case 516225197860.6–1
Disclaimer/Publisher’s Note: The statements, opinions and data contained in all publications are solely those of the individual author(s) and contributor(s) and not of MDPI and/or the editor(s). MDPI and/or the editor(s) disclaim responsibility for any injury to people or property resulting from any ideas, methods, instructions or products referred to in the content.

