Proceeding Paper

The Resilience of Intermittent Water Supply Systems under Limited Water and Electricity Availability †

Department of Engineering, University of Exeter, Exeter EX44QF, UK
*
Author to whom correspondence should be addressed.
Presented at the 3rd International Joint Conference on Water Distribution Systems Analysis & Computing and Control for the Water Industry (WDSA/CCWI 2024), Ferrara, Italy, 1–4 July 2024.
Eng. Proc. 2024, 69(1), 99; https://doi.org/10.3390/engproc2024069099
Published: 10 September 2024

Abstract

:
Two main reasons for using intermittent water supply (IWS) systems are water scarcity and power outages. As a result of IWS systems, consumers have inequitable water supply and high operating costs for water utilities. This study proposes a new methodology for assessing and improving the IWS systems’ resilience under limited water and electricity supply. First, a global resilience analysis (GRA) of the network was conducted to identify its main vulnerabilities. Second, adaptation intervention strategies were considered to improve the network’s resilience. Results indicate that system resilience is improved through an operation intervention strategy.

1. Introduction

When water systems are operated intermittently, they negatively impact utilities, consumers, and society through rapid asset degradation, water quality issues, inequity, and financial burdens for consumers [1]. Among other factors, power outages and water scarcity are two major causes of intermittency in water supply. In developing countries that use fossil fuels or hydropower for electricity generation, a limited electricity supply is one of the major causes of IWS systems [2]. Critical infrastructures, such as power and water networks, are vulnerable because of their high connectivity [3]. During the design life of a system, the system’s resilience is defined by its ability to minimize the magnitude and duration of failure [4]. It is possible to use different failure analysis methods, such as single-component failure analysis and global resilience analysis (GRA) [5] to assess system resilience. The GRA measures service levels under any possible system failure mode, regardless of the threat. This paper proposes and tests a new method for characterizing IWS systems’ resilience to power outages and/or water scarcity conditions. By using this method, it is possible to identify the system’s main vulnerabilities and then implement potential resilience-enhancing strategies.

2. Materials and Methods

A two-stage methodology is proposed. In the first stage, GRA analysis is used to identify the system’s major vulnerabilities. Next, strategies for enhancing network resilience are defined.

2.1. Global Resilience Analysis

To evaluate a system’s inherent resilience, basic modes are modeled with an increasing magnitude of stress, and corresponding strains are estimated. The GRA includes several steps that were described in [5]. The two indicators used to assess levels of service failure in this study are as follows: (1) equity in supply that is quantified by the uniformity coefficient (UC) index [6] and (2) effective supply hours (EHs) [7]. In IWS systems, pressure-dependent demand is used to describe the behavior of the users [8]. By using different pump failure scenarios under different water scarcity proportions, it is possible to determine the worst consequences that could result from a certain failure and to identify areas of vulnerability.

2.2. Strategies for Enhancing Network Resilience
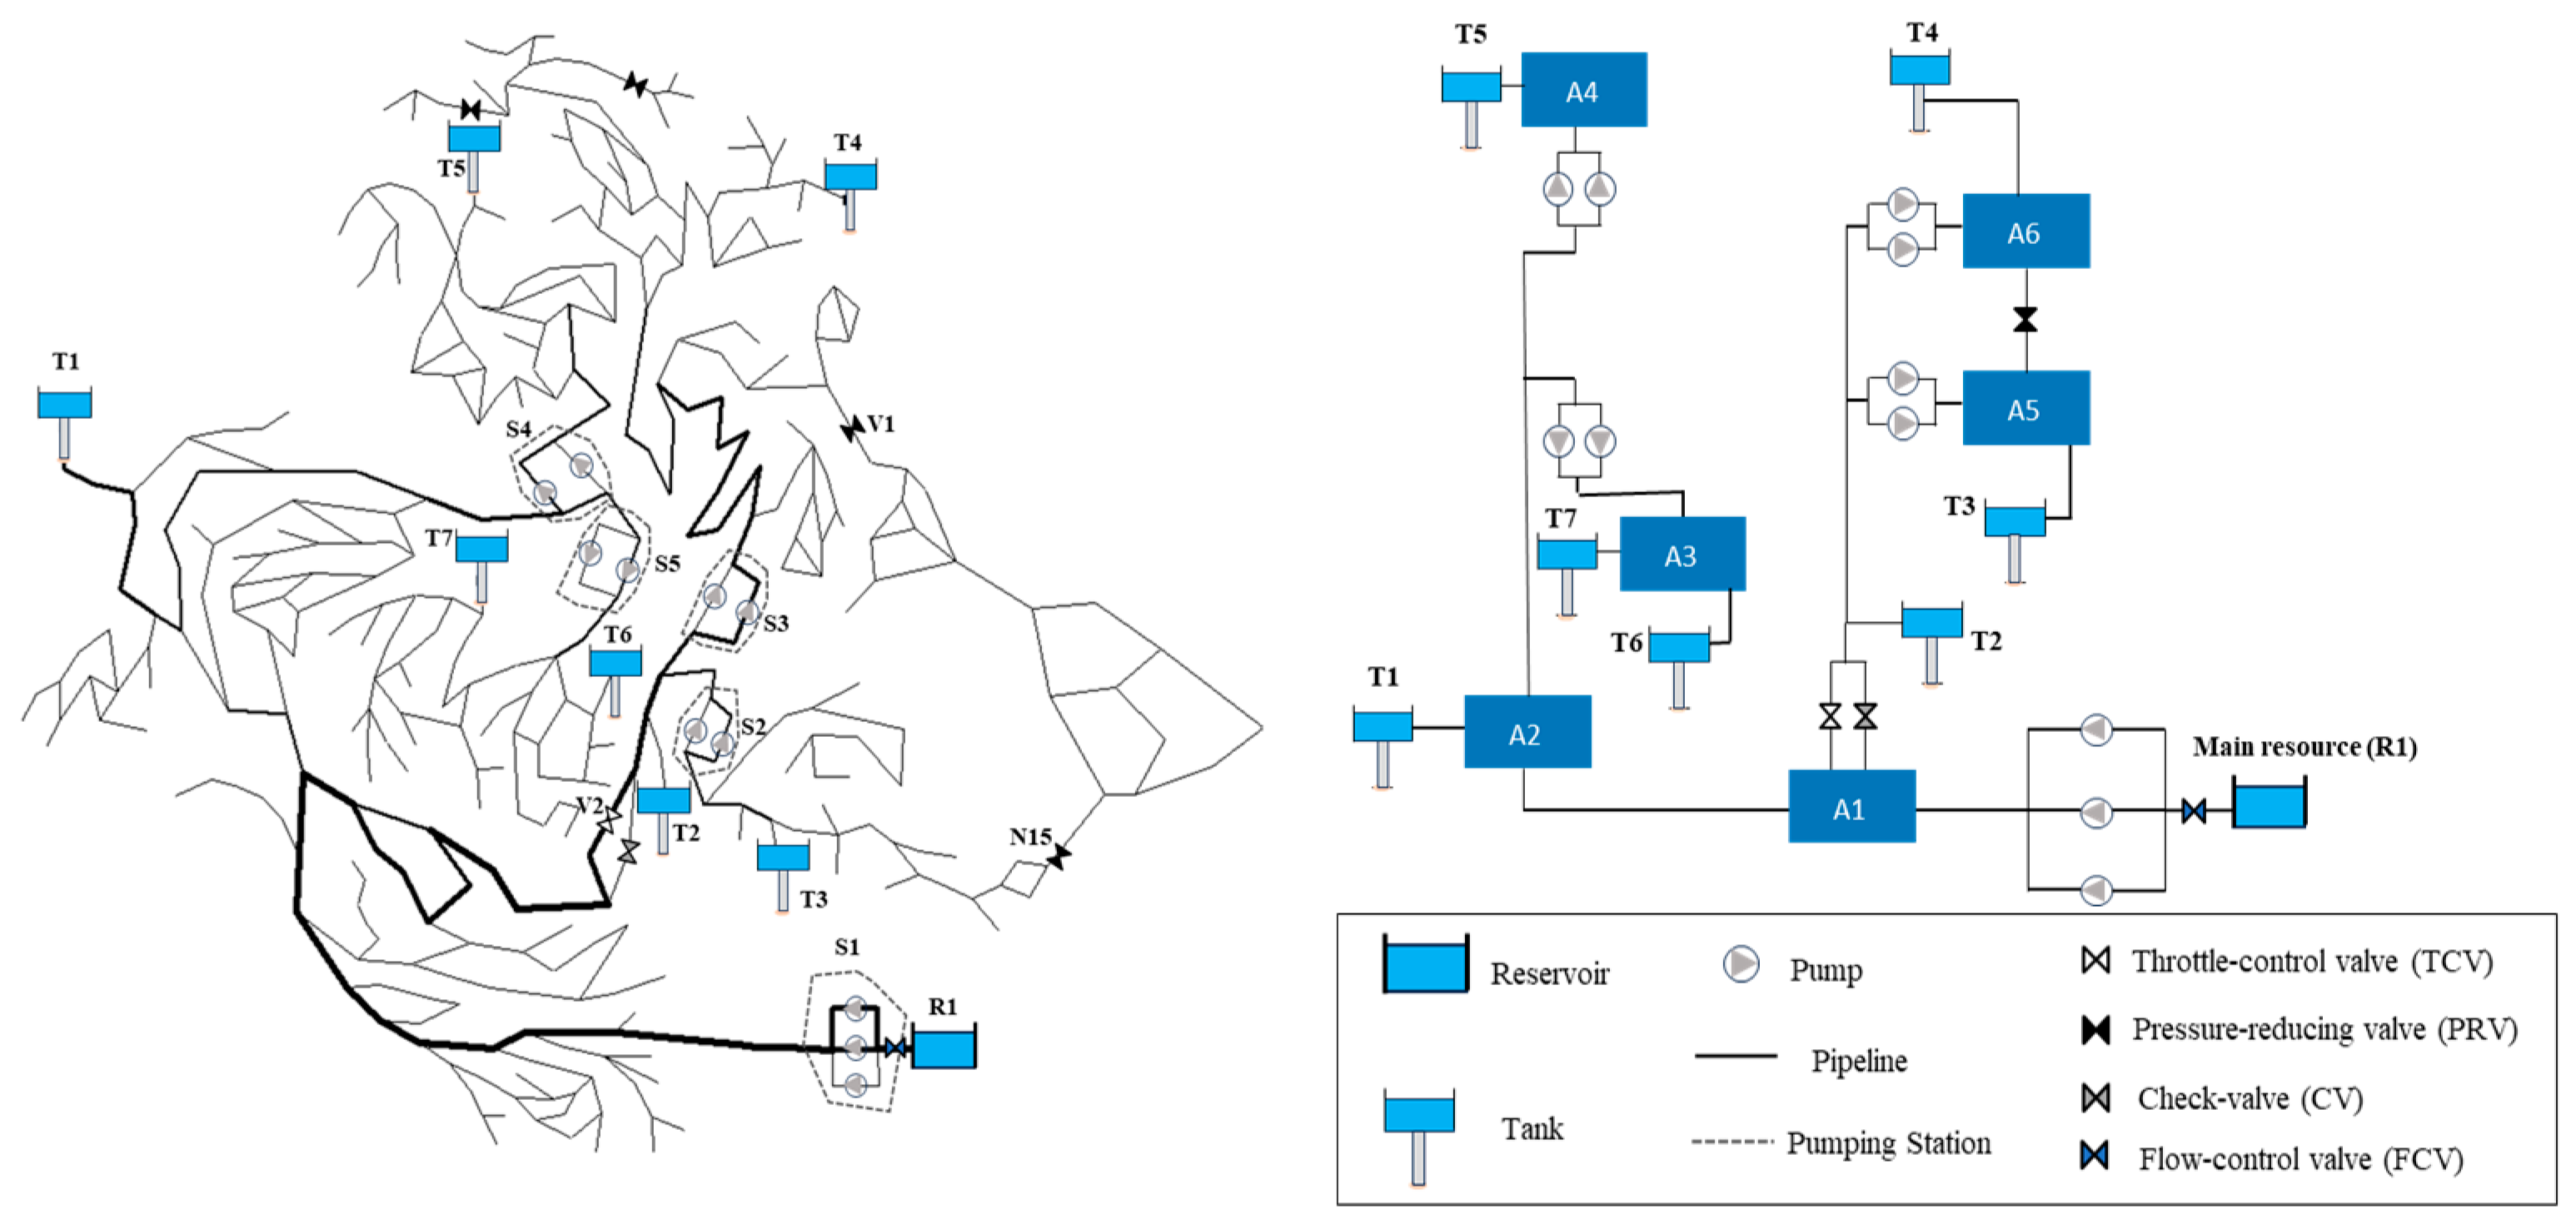
In this study, an optimum operation intervention (adaptation strategy) for a sectorized network is considered as an intervention strategy to enhance resilience to WDS. Sectorization of the network as considered in this study was explained in [9]. The optimization tools and parameters are summarized in Table 1.

3. Case Study

The performance of the proposed methodology is demonstrated by application to the D-town water distribution system [10] (Figure 1). The presence of the five pumping stations and seven tanks enables six supply areas (i.e., A1–A6). To simulate water scarcity, an FCV has been added downstream of the reservoir with a fixed flow rate that is less than the average network flow rate.

4. Results and Discussion

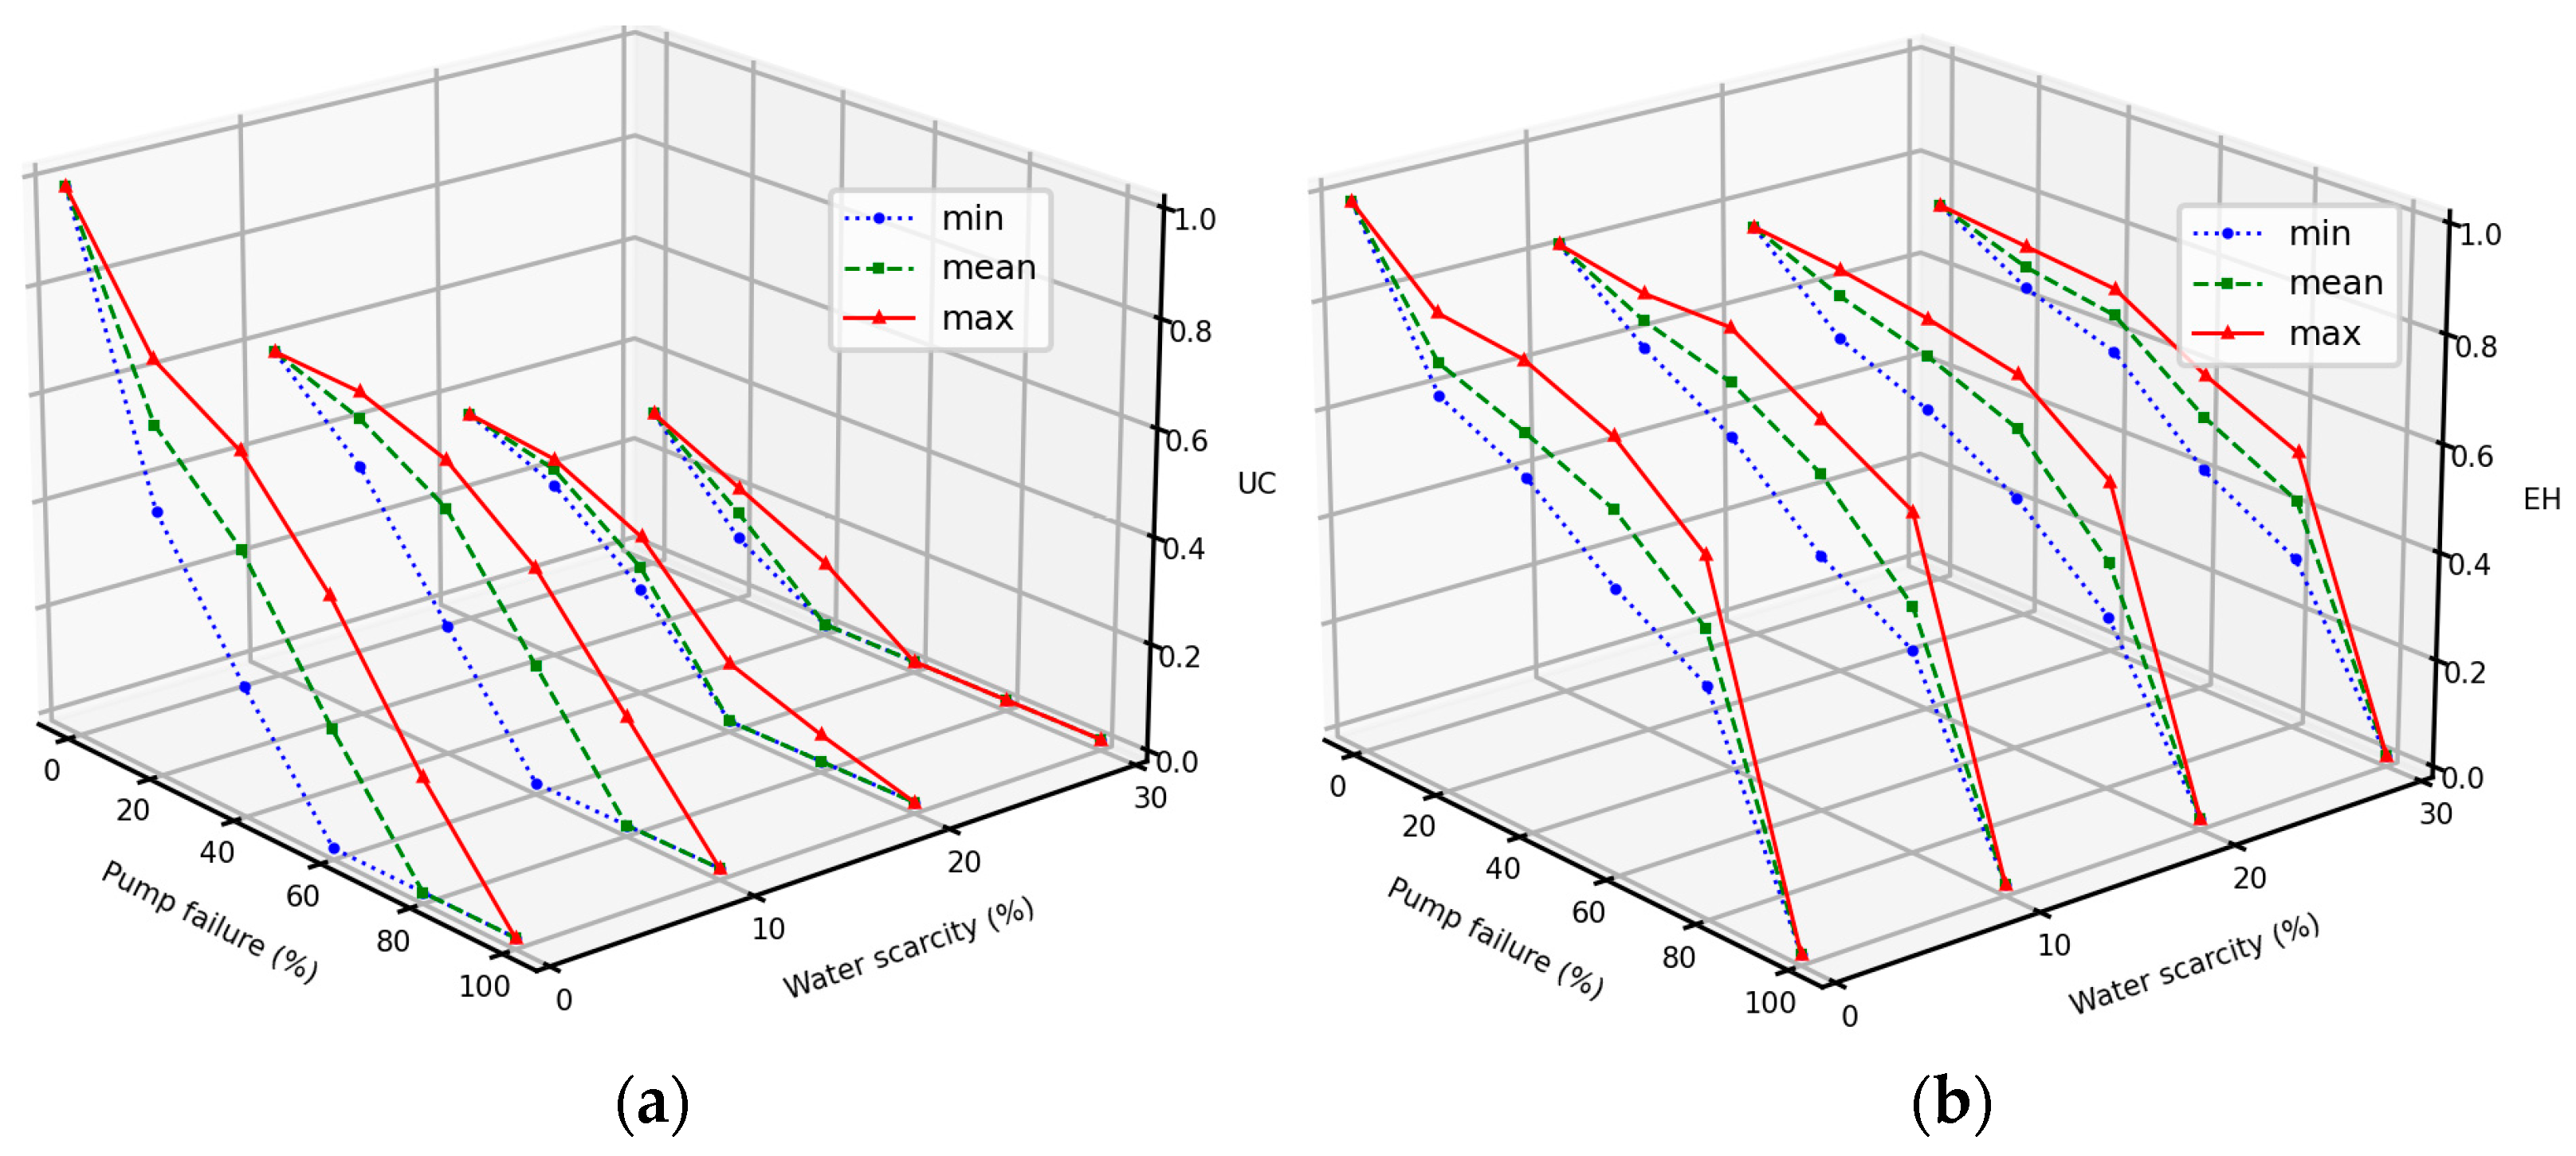
4.1. Global Resilience Analysis

Figure 2 shows the GRA results for pump failure modes under several water scarcity scenarios based on the magnitude of stress versus the magnitude of strain on the system. Figure 2a,b show the relationship between the maximum (solid line), the mean (dashed line), and the minimum (dotted line) strain and stress. According to the GRA curves, the system’s worst performance under both pump failure and water scarcity scenarios is inequitable supply to all consumers (0 uniformity coefficient) as well as a decrease in supply hours.
GRA resilience analysis indicates that some pumps are critical hydraulic links, and these links may change with increasing water scarcity. The failure of pumping station S3 (20% failure) under no-water-scarcity conditions, for example, significantly affects equity among consumers (minUC = 0.38), as shown in Figure 2a. However, under 20% water scarcity, pumping station S2 is the critical link. Failure of the S2 pumping station under 20% water scarcity results in a minimum equity of 0.33.

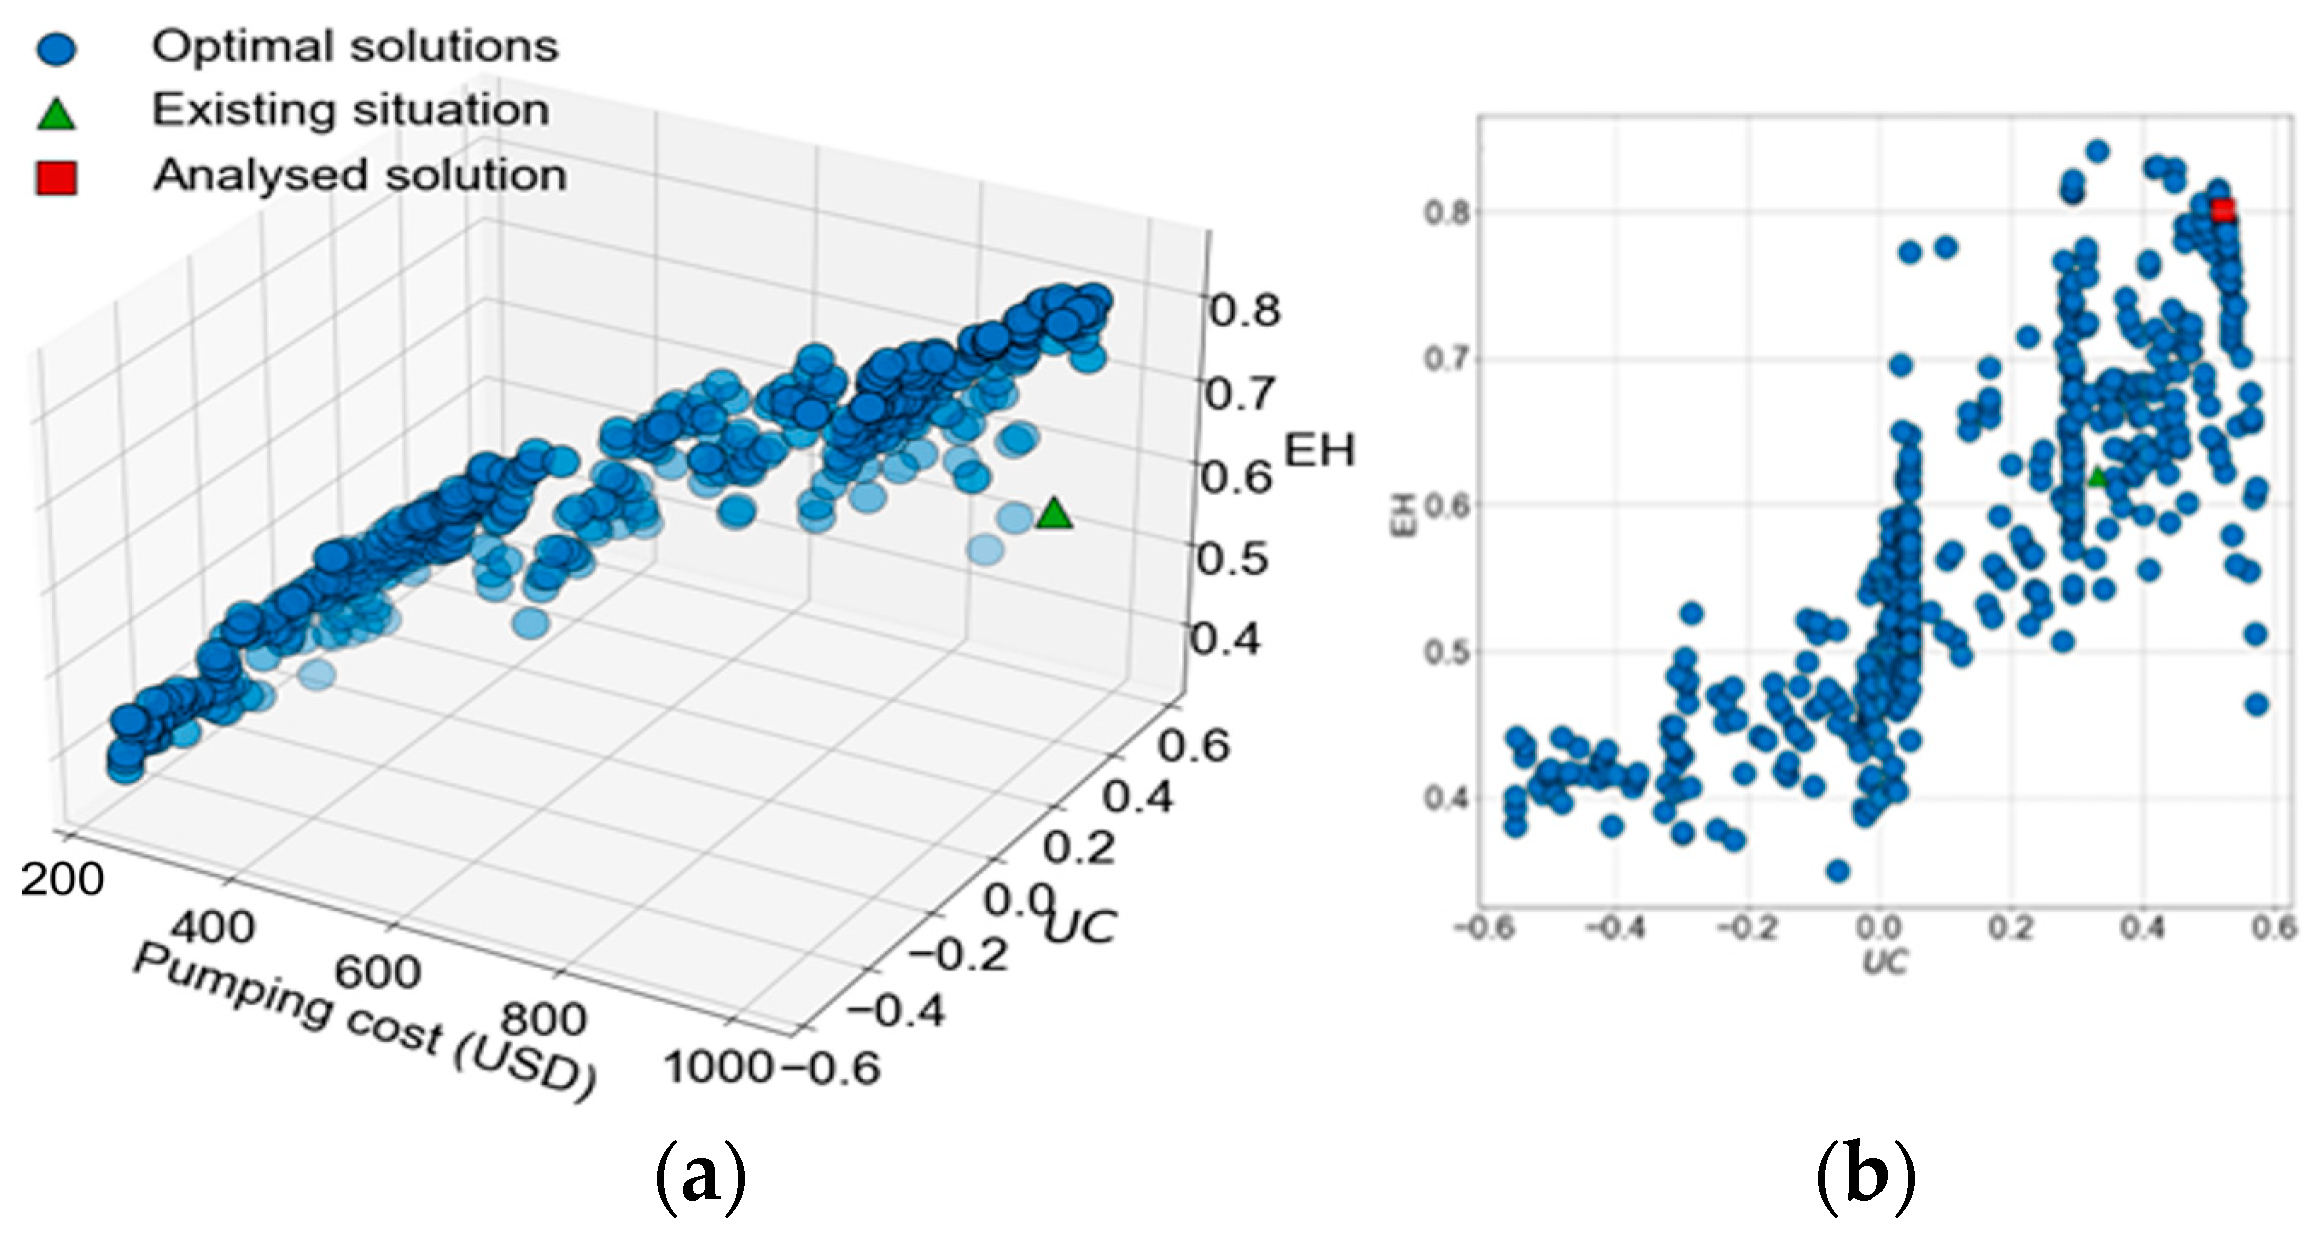
4.2. Optimum Operation Intervention Strategy for Enhancing IWS Resilience

The multiobjective optimization of operation is applied to the system under a 20% pump failure scenario (failure of S2) for 6 h at a critical period (6:00 p.m.–12:00 a.m.) and under 20% scarcity. Figure 3 shows the optimum three-dimensional Pareto front.
The chosen solution for analysis (with the highest min (UC)) has an operational cost of USD 975 per day, a min (UC) of 0.53, and an EH of 0.79. By comparing this optimal solution with the existing situation, there is a saving in energy cost (from USD 1046 to USD 975 per day) and an improvement in the min (UC) during the day (from 0.33 to 0.53) as well as an increase in the EH (from 0.7 to 0.79) under 20% pumping failure and 20% water scarcity scenarios.

5. Conclusions

GRA can determine the resilience of a system to different types of failure. As a result, the most vulnerable parts of the system can be defined, and strategies can be developed to improve resilience. An adaptation intervention strategy improved equity and the effective supply hours in IWS systems under water scarcity and/or power outage conditions.

Author Contributions

Conceptualization, F.A., R.F. and A.A.J.; methodology, F.A.; software, F.A.; validation, F.A.; formal analysis, F.A.; investigation, F.A.; data curation, F.A.; writing—original draft preparation, F.A.; writing—review and editing, R.F. and A.A.J.; visualization, F.A.; supervision, R.F. and A.A.J. All authors have read and agreed to the published version of the manuscript.

Funding

This research received no external funding.

Institutional Review Board Statement

Not applicable.

Informed Consent Statement

Not applicable.

Data Availability Statement

All data, models, and/or codes that support the findings of this study are available from the corresponding author on request.

Acknowledgments

The authors gratefully acknowledge the Schlumberger Foundation Faculty for the Future program for funding the PhD scholarship.

Conflicts of Interest

The authors declare no conflicts of interest.

References

  1. Farmani, R.; Dalton, J.; Charalambous, B.; Lawson, E.; Bunney, S.; Cotteril, S. Intermittent water supply systems and their resilience to COVID-19: IWA IWS SG survey. J. Water Supply Res. Technol. AQUA 2021, 70, 507–520. [Google Scholar] [CrossRef]
  2. Simukonda, K.; Farmani, R.; Butler, D. Intermittent water supply systems: Causal factors, problems and solution options. Urban Water J. 2018, 15, 488–500. [Google Scholar] [CrossRef]
  3. Helbing, D. Globally networked risks and how to respond. Nature 2013, 497, 51. [Google Scholar] [CrossRef] [PubMed]
  4. Butler, D.; Farmani, R.; Fu, G.; Ward, S.; Diao, K.; Astaraie-Imani, M. A New Approach to Urban Water Management: Safe and Sure. Procedia Eng. 2014, 89, 347–354. [Google Scholar] [CrossRef]
  5. Diao, K.; Sweetapple; Farmani, R.; Fu, G.; Ward, S. Global resilience analysis of water distribution systems. Water Res. 2016, 106, 383–393. [Google Scholar] [CrossRef] [PubMed]
  6. Gottipati, P.V.K.S.V.; Nanduri, U.V. Equity in water supply in intermittent water distribution networks. Water Environ. J. 2014, 28, 509–515. [Google Scholar] [CrossRef]
  7. Universitat Politècnica de València. Battle of Intermittent Water Supply Networks—Instructions. 2022. Available online: https://wdsa-ccwi2022.upv.es/wp-content/uploads/descargas/BIWS_Instructions.pdf (accessed on 15 February 2024).
  8. Wagner, J.M.; Shamir, U.; Marks, D.H. Water distribution reliability simulation methods. J.Water Resour. Plan. Manag. 1988, 114, 276–294. [Google Scholar] [CrossRef]
  9. Ayyash, F.; Zhang, C.; Javadi, A.A.; Farmani, R. Optimal Operation of Intermittent Water Supply Systems under Water Scarcity. J.Water Resour. Plan. Manag. 2024, 150. [Google Scholar] [CrossRef]
  10. University of Exeter, Center for Water Systems. 2020. Available online: https://www.exeter.ac.uk/research/centres/cws/resources/benchmarks/ (accessed on 15 February 2024).
Figure 1. The layout and a simplified scheme of the D-Town network.
Engproc 69 00099 g001
Figure 2. GRA curves for pump failure under different water scarcity proportions: (a) equity failure magnitude; (b) effective supply hour failure magnitude.
Engproc 69 00099 g002
Figure 3. (a) Pareto front solutions for three-objective optimization; (b) UC versus EH.
Engproc 69 00099 g003
Table 1. The optimization tools and parameters.
ParameterDescription
Optimization methodNondominated sorting genetic algorithm (NSGAII)
Optimization toolPlatypus
Simulation toolEpyt (Epanet-Python Toolkit)
Objective functions1. Minimizing daily operational cost. 2. Maximizing equity. 3. Maximizing the proportion of effective supply hours.
Decision variables1. Bridge pipe statuses (on/off). 2. Pairs of triggers (on/off) for pumps and valves. 3. Valves settings.
Constraints1. Preventing hydraulic errors. 2. Bridge pipes and pump switches should not exceed a certain limit. 3. Water levels in the tanks at the start and end of the simulation (operation period) should be equal.
Disclaimer/Publisher’s Note: The statements, opinions and data contained in all publications are solely those of the individual author(s) and contributor(s) and not of MDPI and/or the editor(s). MDPI and/or the editor(s) disclaim responsibility for any injury to people or property resulting from any ideas, methods, instructions or products referred to in the content.

