
CAD Representation of the Mullins Effect from the SEGE 80 Flexible Coupling Model †

 , , , and
Abstract
:1. Introduction
2. Exposition
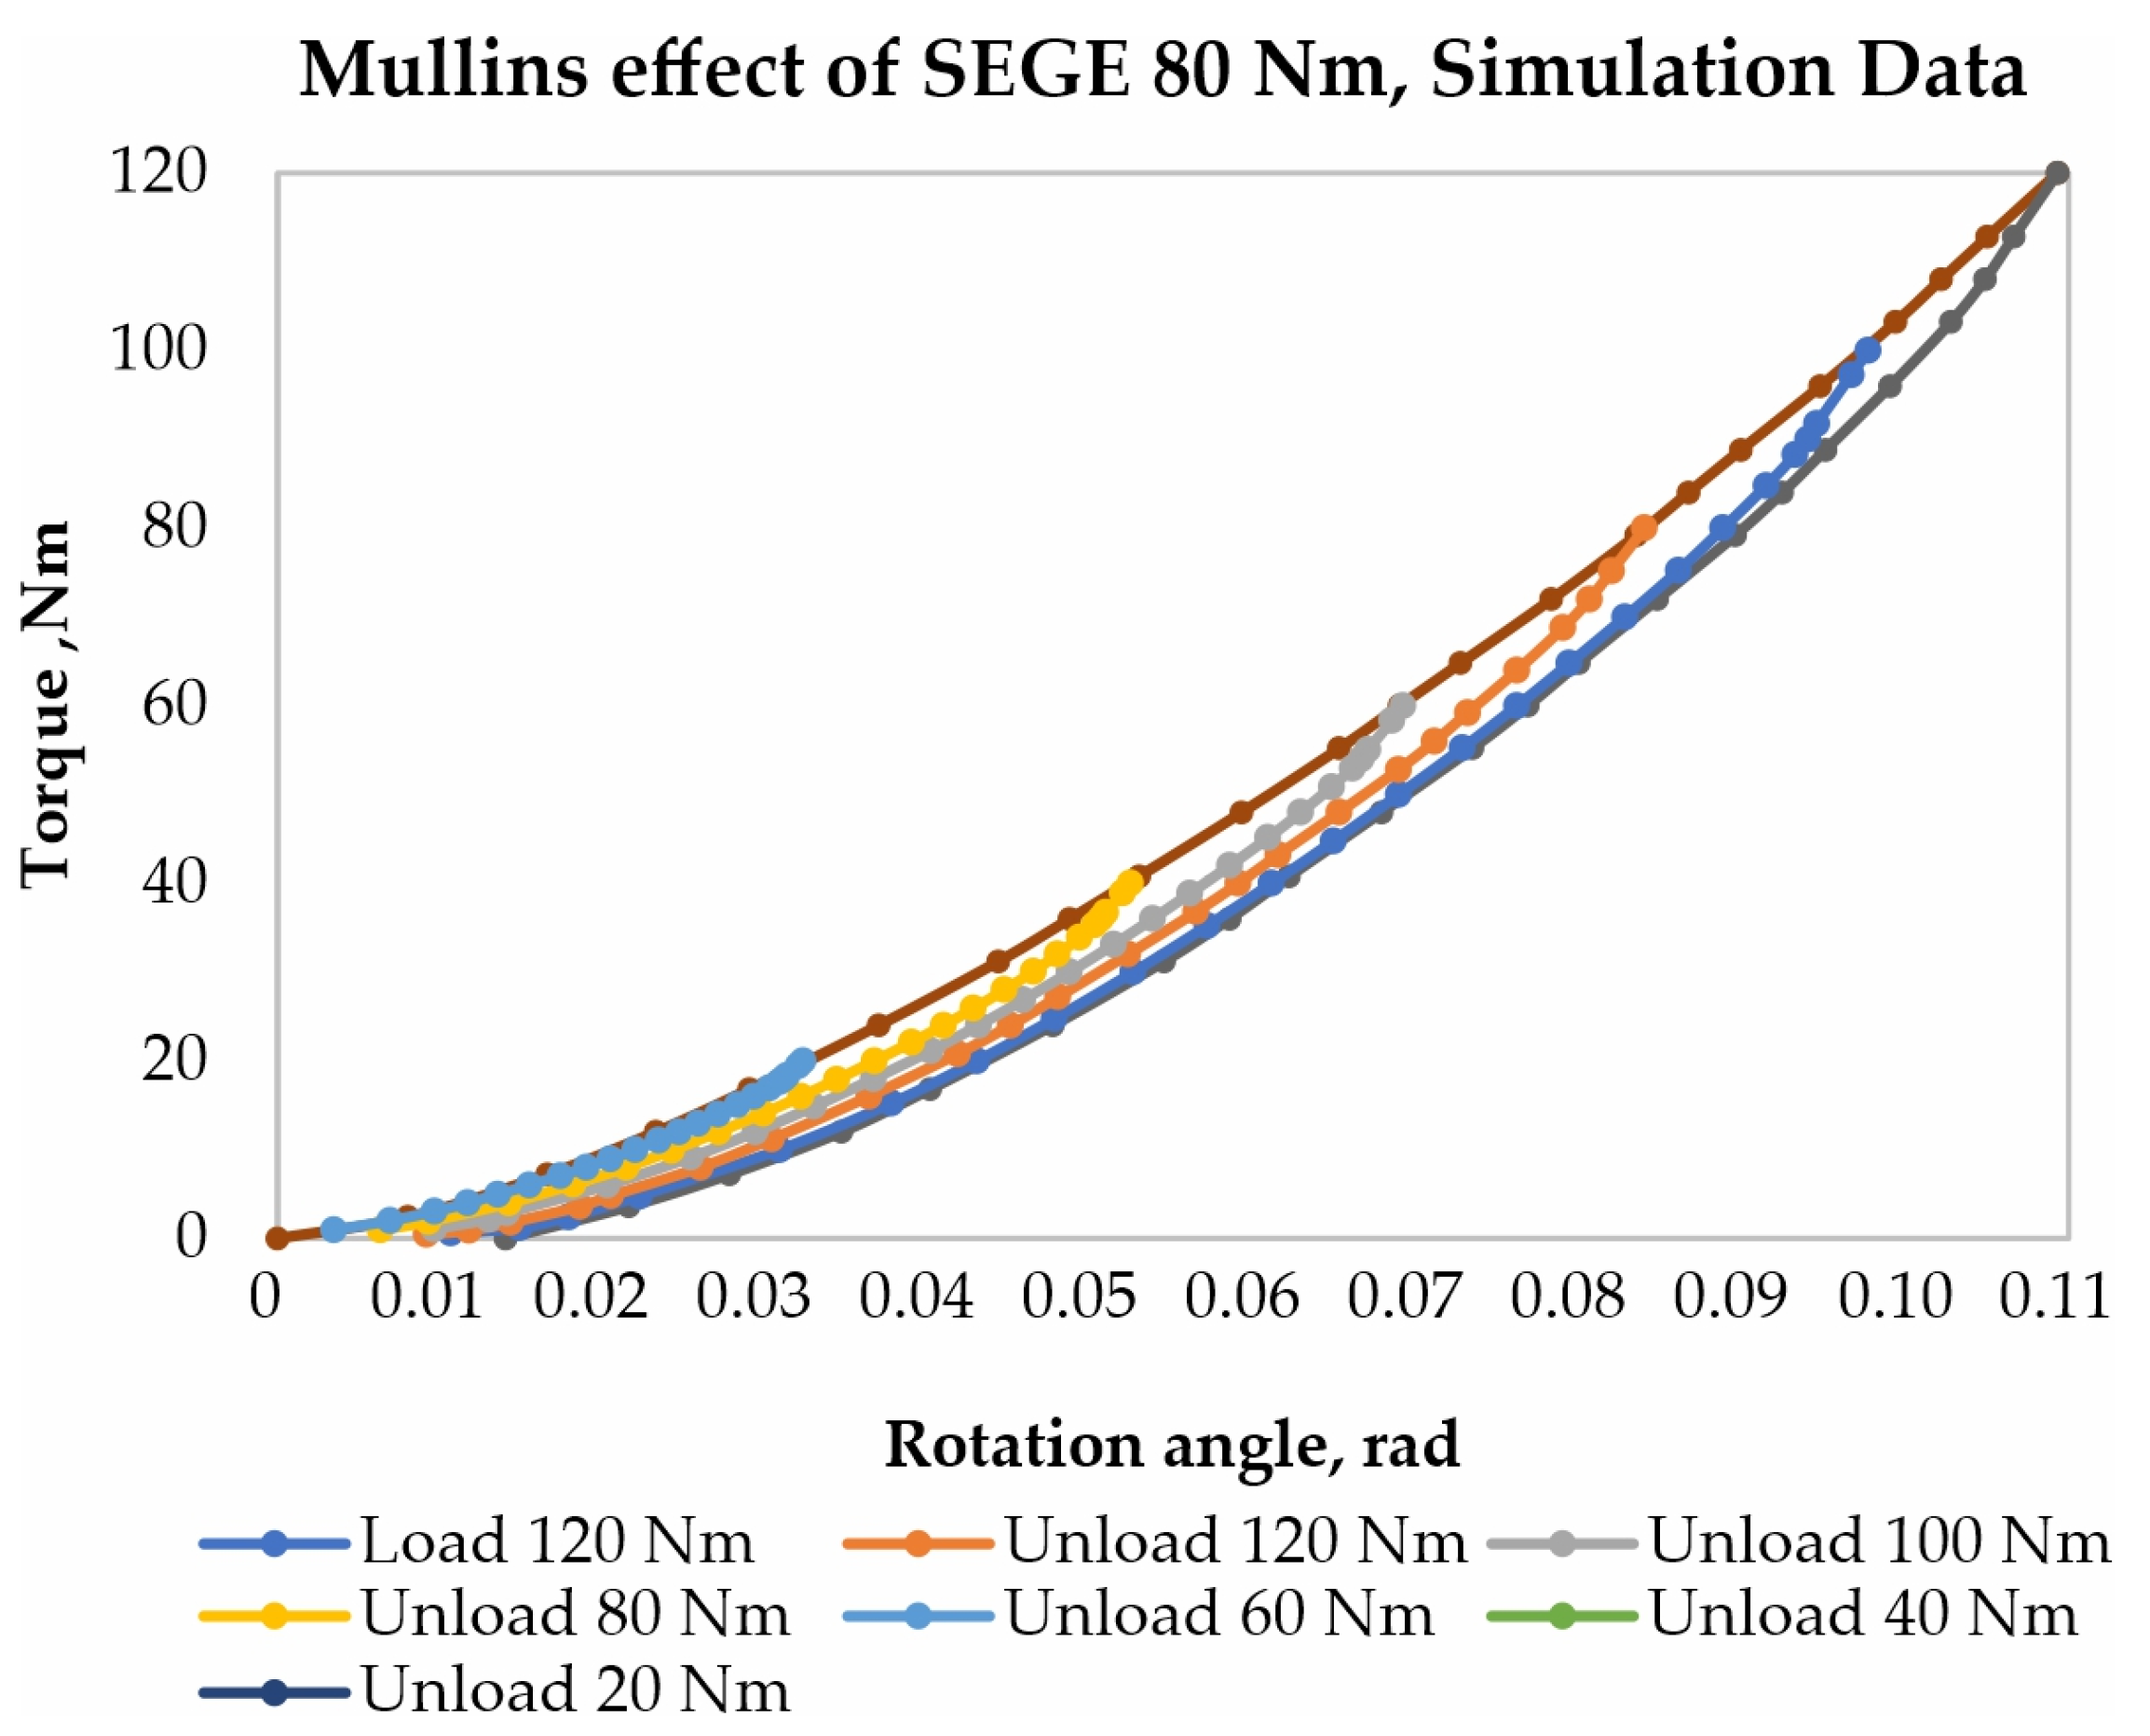
3. Results and Discussion
4. Conclusions
Author Contributions
Funding
Institutional Review Board Statement
Informed Consent Statement
Data Availability Statement
Conflicts of Interest
References
- Diani, J.; Fayolle, B.; Gilormini, P. A review on the Mullins effect. Eur. Polym. J. 2009, 45, 601–612. [Google Scholar] [CrossRef]
- Cantournet, S.; Desmorat, R.; Besson, J. Mullins effect and cyclic stress softening of filled elastomers by internal sliding and friction thermodynamics model. Int. J. Solids Struct. 2009, 46, 2255–2264. [Google Scholar] [CrossRef]
- St. Rickaby, R.; Scott, N.H. The Mullins Effect, Constitutive Models for Rubber VII; Jerrams, S., Murphy, N., Eds.; Taylor & Francis: London, UK, 2011; pp. 273–276. [Google Scholar] [CrossRef]
- Fu, W.; Wang, L.; Huang, J.; Liu, C.; Peng, W.; Xiao, H.; Li, S. Mechanical Properties and Mullins Effect in Natural Rubber Reinforced by Grafted Carbon Black. Adv. Polym. Technol. 2019, 2019, 4523696. [Google Scholar] [CrossRef]
- Wang, C.C.; Zhang, Y.F.; Liu, Q.Q.; Wang, Z.B. Mullins Effect under Compression Mode and its Reversibility of Thermoplastic Vulcanizate Based on Ethylene-Vinyl Acetate Copolymer/Styrene-Butadiene Rubber Blend. Int. Polym. Process. 2017, 32, 11–19. [Google Scholar] [CrossRef]
- Stoyanov, S.; Hristov, H.; Tenev, S.; Spasov, N. Determining the damping capability of an elastic coupling with a rubber element type “SEGE”. J. Mech. Eng. Technol. 2012, 1, 61–66. [Google Scholar]
- BDS 16420-86; Elastic Coupling with Rubber Element. Basic Parameters, Dimensions and Technical Requirements. Bulgarian Institute for Standardization: Sofia, Bulgaria. Available online: https://bds-bg.org/en/ (accessed on 23 July 2024).
- Kallinikidou, E. Nonlinear Analysis of Plastic and Rubber Components with SolidWorks Simulation. Doc. Simul. Prod. Dassault Syst. 2010, 33. [Google Scholar]
- Steffen, J. Analysis of Machine Elements Using SolidWorks Simulation 2012; Schroff Development Corporation: Mission, KS, USA, 2012; p. 390. [Google Scholar]
- Shih, R. Introduction to Finite Element Analysis Using SolidWorks Simulation 2013; Schroff Development Corporation: Mission, KS, USA, 2012. [Google Scholar]
- Kurowski, P.M. Engineering Analysis with SolidWorks Simulation 2012; SDC Publications: Mission, KS, USA, 2012. [Google Scholar]
- Weber, M. SolidWorks Simulation 2014 Black Book; CreateSpace Independent Publishing Platform: Scotts Valley, CA, USA, 2014. [Google Scholar]
- Lee, H. Mechanics of Materials Labs with SolidWorks Simulation 2013; SDC Publications: Mission, KS, USA, 2013. [Google Scholar]
- Pacheco, J.E.L.; Bavastri, C.A.; Pereira, J.T. Viscoelastic Relaxation Modulus Characterization Using Prony Series. Lat. Am. J. Solids Struct. 2015, 12, 420–445. [Google Scholar] [CrossRef]
- Londono, J.G.; Berger-Vergiat, L.; Waisman, H. A Prony-series type viscoelastic solid coupled with a continuum damage law for polar ice modeling. Mech. Mater. 2016, 98, 81–97. [Google Scholar] [CrossRef]
- Sorvari, J. Modelling Methods for Viscoelastic Constitutive Modelling of Paper. Doctoral Dissertation, Department of Physics University of Kuopio, Kuopio, Finland, 2009; p. 115. [Google Scholar]
- Botz, M.; Kraus, M.; Siebert, G. Experimental Determination of the Shear Modulus of Polymeric Interlayers Used in Laminated Glass; GlassCon Global: Chicago, IL, USA, 2018; p. 8. [Google Scholar]
- Sun, Y.; Gu, Z.; Wang, J.; Yuan, X. Research of Method for Solving Relaxation Modulus Based on Three-Point Bending Creep Test. Materials 2019, 12, 2021. [Google Scholar] [CrossRef] [PubMed]
- Tenev, S. Reducing of Work Rubber Arms Load of an Engine Mount, Mechanics of Machines XXIV; Technical University of Varna: Varna, Bulgaria, 2021; Volume 1, pp. 22–35. [Google Scholar]
- Akin, J. (Ed.) Finite Element Analysis Concepts via SolidWorks, 1st ed.; WSPC: Paleo Faliro, Greece, 2010; p. 348. [Google Scholar]


| Model Type—Viscoelastic | |||||
|---|---|---|---|---|---|
| № | Parameter | Symbol | Value | Unit of measurement | Commentary |
| 1. | Elastic Modulus | E | 11 | MPa | Modulus of linear deformation |
| 2. | Poisson’s Ration | υ | 0.49 | - | Poisson ratio |
| 3. | Shear Modulus | G | 3.69 | MPa | Modulus of angular deformation |
| 4. | Thermal Expansion Coefficient | T | 0.0002 | K−1 | Coefficient of thermal expansion for “EPDM” rubber |
| 5. | Tensile Strength | SeH | 17 | MPa | Tensile strength |
| 6. | Shear Relaxation Modulus (1) | g | 0.45 | Modulus of relaxation (0–1, 1—maximum energy absorption) | |
| 7. | Time Values (Shear Relaxation Modulus 1) | t | 1 | s | Range of relaxation time |
| 8. | Glassy Transition Temperature | Tg | −55/218.15 | C/K | Glass transition temperature |
| 9. | Mass Density | r | 1430 | kg/m3 | Density of “EPDM” rubber |
| Nonliner Static Properties | |||||
| Stepping options | Settings of the simulation steps | ||||
| 1. | Start time | 0 | s | Start time of the simulation | |
| 2. | End time | 20 | s | End time of the simulation | |
| Time increment (autostepping) | Settings of the simulation step time | ||||
| 1. | Initial time increment | 0.2 | Initial time increment | ||
| 2. | Min | 0 | Minimum step time | ||
| 3. | Max | 20 | Maximum step time | ||
| 4. | No. of adjustments | 5 | Number of adjustments | ||
| Geometry nonlinearity options | Occurrences of geometric nonlinearity | ||||
| Use large displacement formulation | yes | Computations in the event of large displacements | |||
| Large strain option | yes | Computations in the event of large relative deformations | |||
| Solver | Method of solution | ||||
| Automatic Solver Selection | yes | Automatic method for obtaining a solution | |||
| Incompatible bonding options | Options with incompatible bonding | ||||
| Simplified | yes | Simplified bonding | |||
| Step/Tolerance options | Step/Tolerance | ||||
| 1. | Do equilibrium iteration every | 1 step (s) | Using iterations to achieve system equilibrium for each step | ||
| 2. | Maximum equilibrium iterations | 20 | Maximum number of iterations to achieve equilibrium | ||
| 3. | Convergence tolerance | 0.01 | Relative displacement tolerance used to achieve system equilibrium convergence | ||
| 4. | Maximum incremental strain | 0.1 | Maximum increase in relative strain | ||
| 5. | Singularity elimination factor (0–1) | 0 | Uncertainty factor | ||
Disclaimer/Publisher’s Note: The statements, opinions and data contained in all publications are solely those of the individual author(s) and contributor(s) and not of MDPI and/or the editor(s). MDPI and/or the editor(s) disclaim responsibility for any injury to people or property resulting from any ideas, methods, instructions or products referred to in the content. |
© 2024 by the authors. Licensee MDPI, Basel, Switzerland. This article is an open access article distributed under the terms and conditions of the Creative Commons Attribution (CC BY) license (https://creativecommons.org/licenses/by/4.0/).
Share and Cite
Tenev, S.; Mehmedov, I.; Bankova, A.; Nedeva, N.; Stefanov, S.; Hristov, R.; Atanasov, A.; Nikolov, P.; Petrov, S. CAD Representation of the Mullins Effect from the SEGE 80 Flexible Coupling Model. Eng. Proc. 2024, 70, 22. https://doi.org/10.3390/engproc2024070022
Tenev S, Mehmedov I, Bankova A, Nedeva N, Stefanov S, Hristov R, Atanasov A, Nikolov P, Petrov S. CAD Representation of the Mullins Effect from the SEGE 80 Flexible Coupling Model. Engineering Proceedings. 2024; 70(1):22. https://doi.org/10.3390/engproc2024070022
Chicago/Turabian StyleTenev, Stefan, Ismail Mehmedov, Aleksandrina Bankova, Nina Nedeva, Stefan Stefanov, Rosen Hristov, Asparuh Atanasov, Plamen Nikolov, and Svetoslav Petrov. 2024. "CAD Representation of the Mullins Effect from the SEGE 80 Flexible Coupling Model" Engineering Proceedings 70, no. 1: 22. https://doi.org/10.3390/engproc2024070022