
Indirect Determination of Basic Tomato Quality Parameters Using Color Digital Images †


Abstract
1. Introduction
- Presentation of the measured data for the objects that are subject to recognition;
- Pre-processing of the data and separation of characteristic signs for the objects.
2. Materials and Methods
2.1. Analysis of the Main Chemical Components of Fresh Tomato Fruits
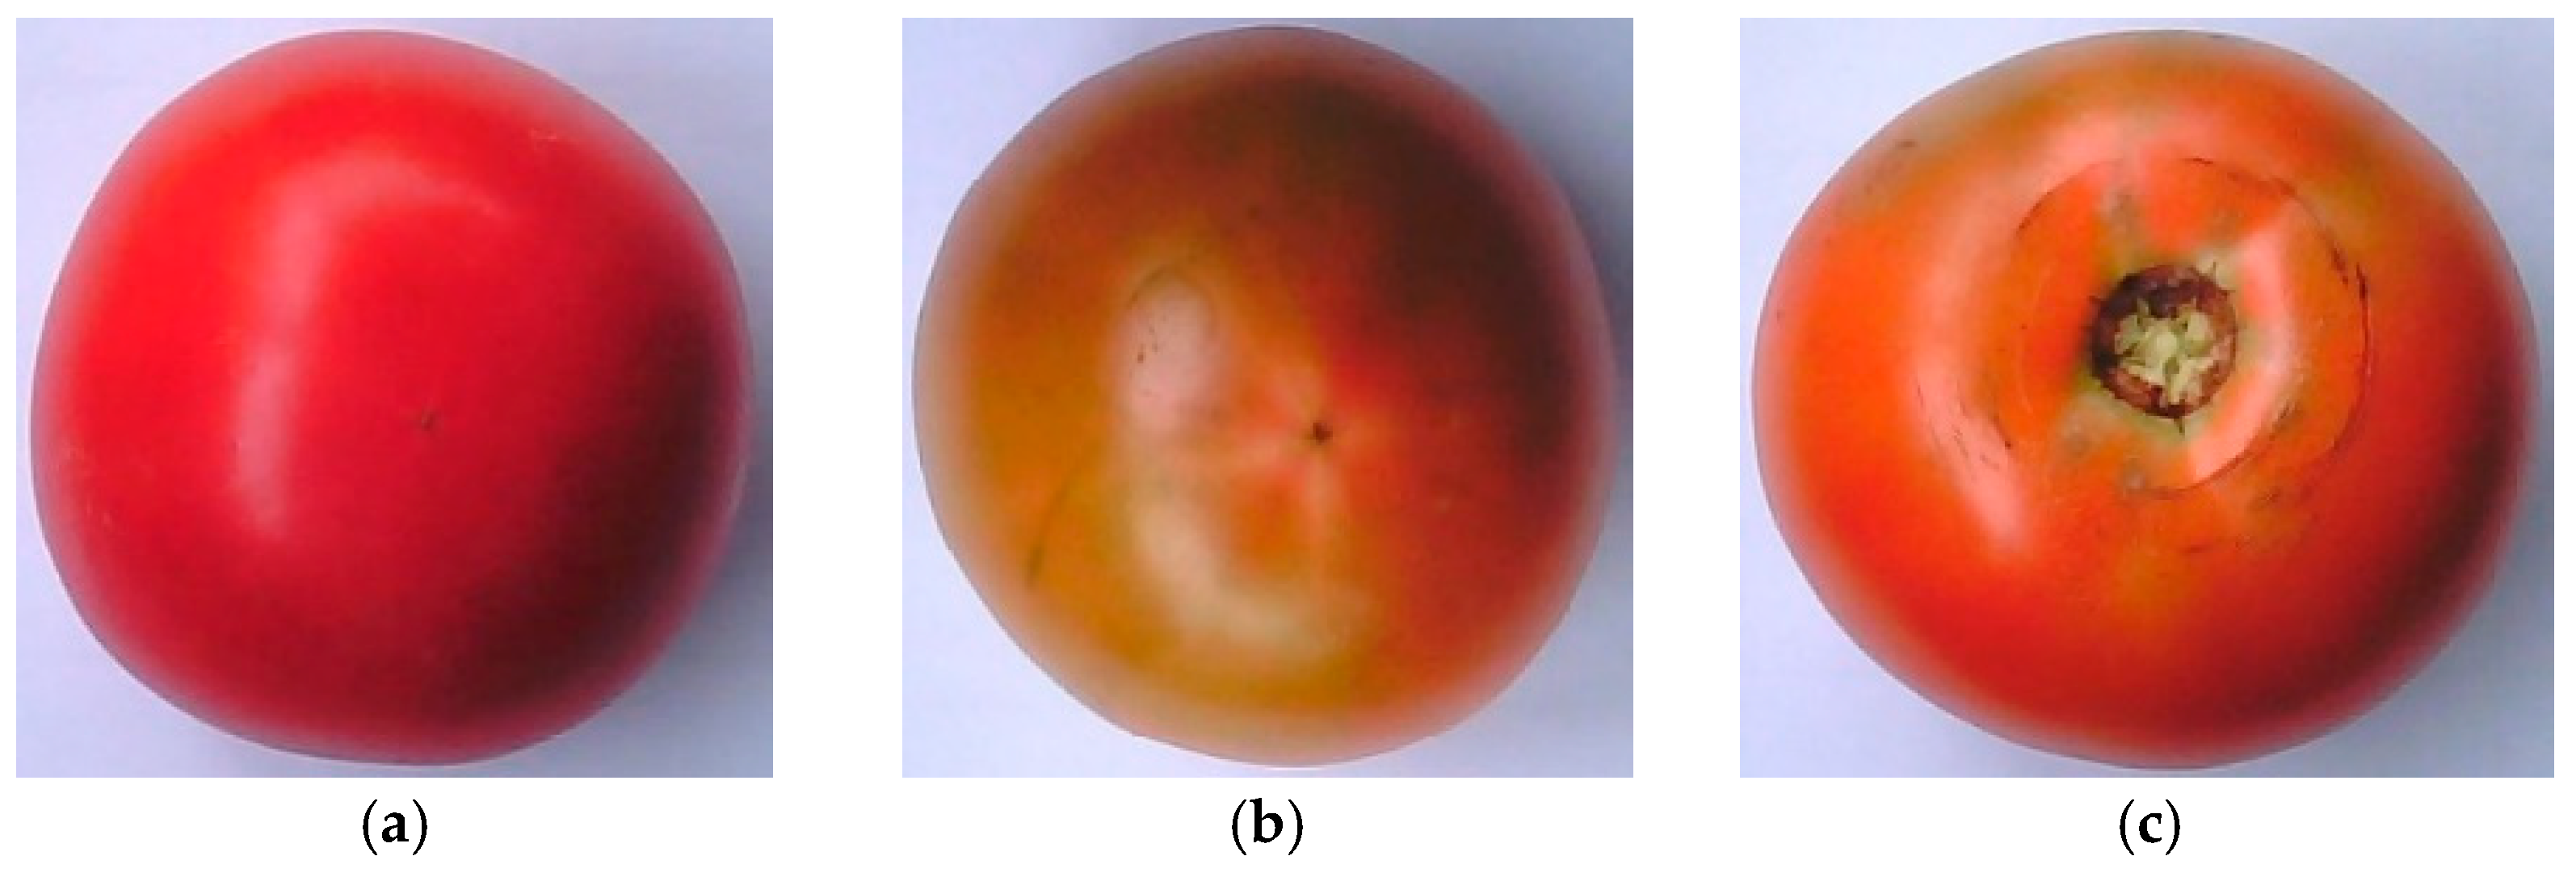
2.2. Image Acquisition of the Tomato Fruits
2.3. Tomato Fruits Image Preprocessing
2.4. Selection of Color Characters for Tomato Quality
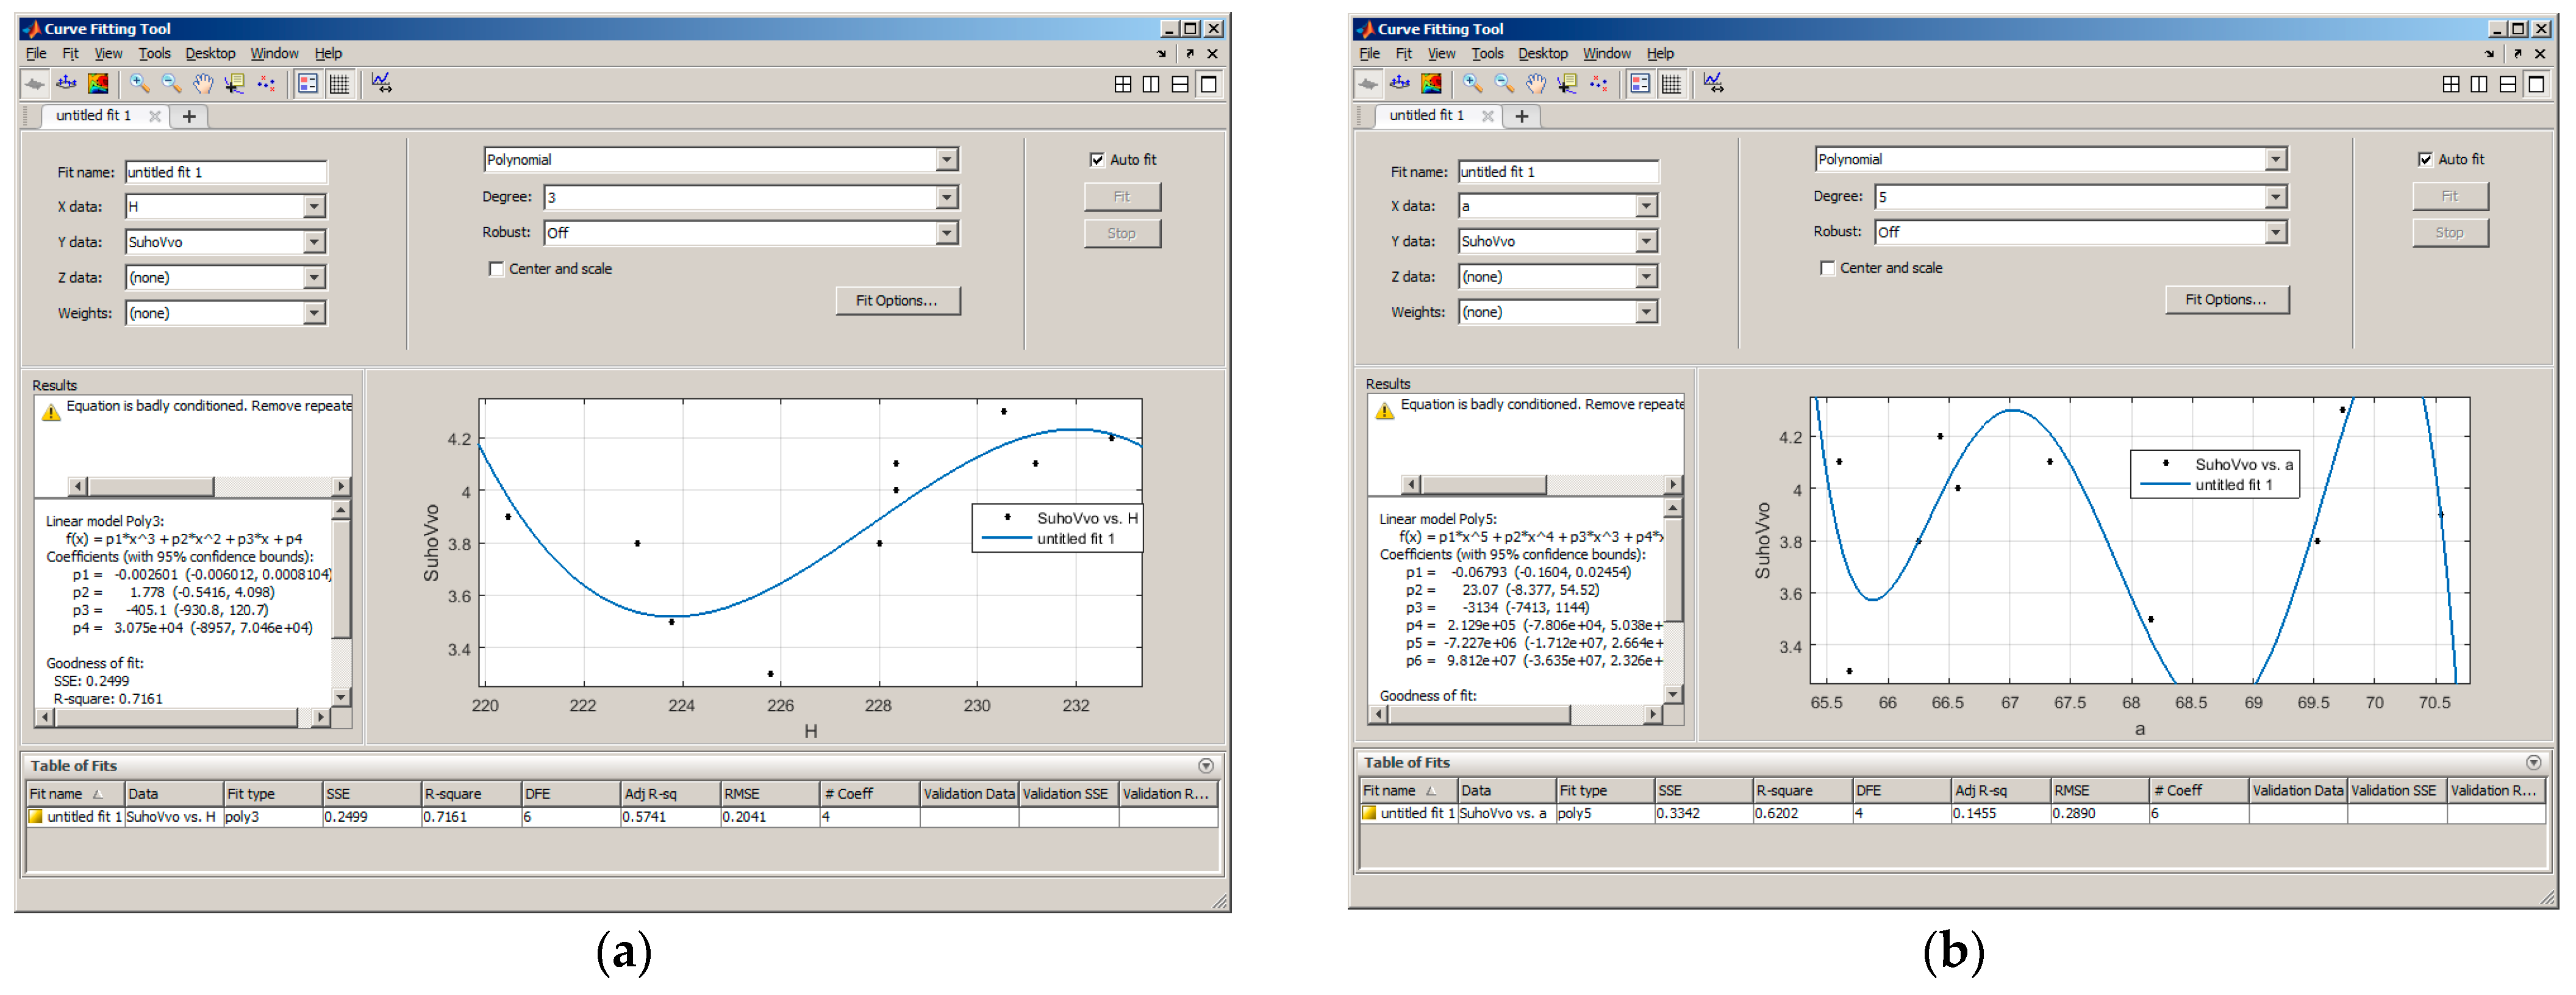
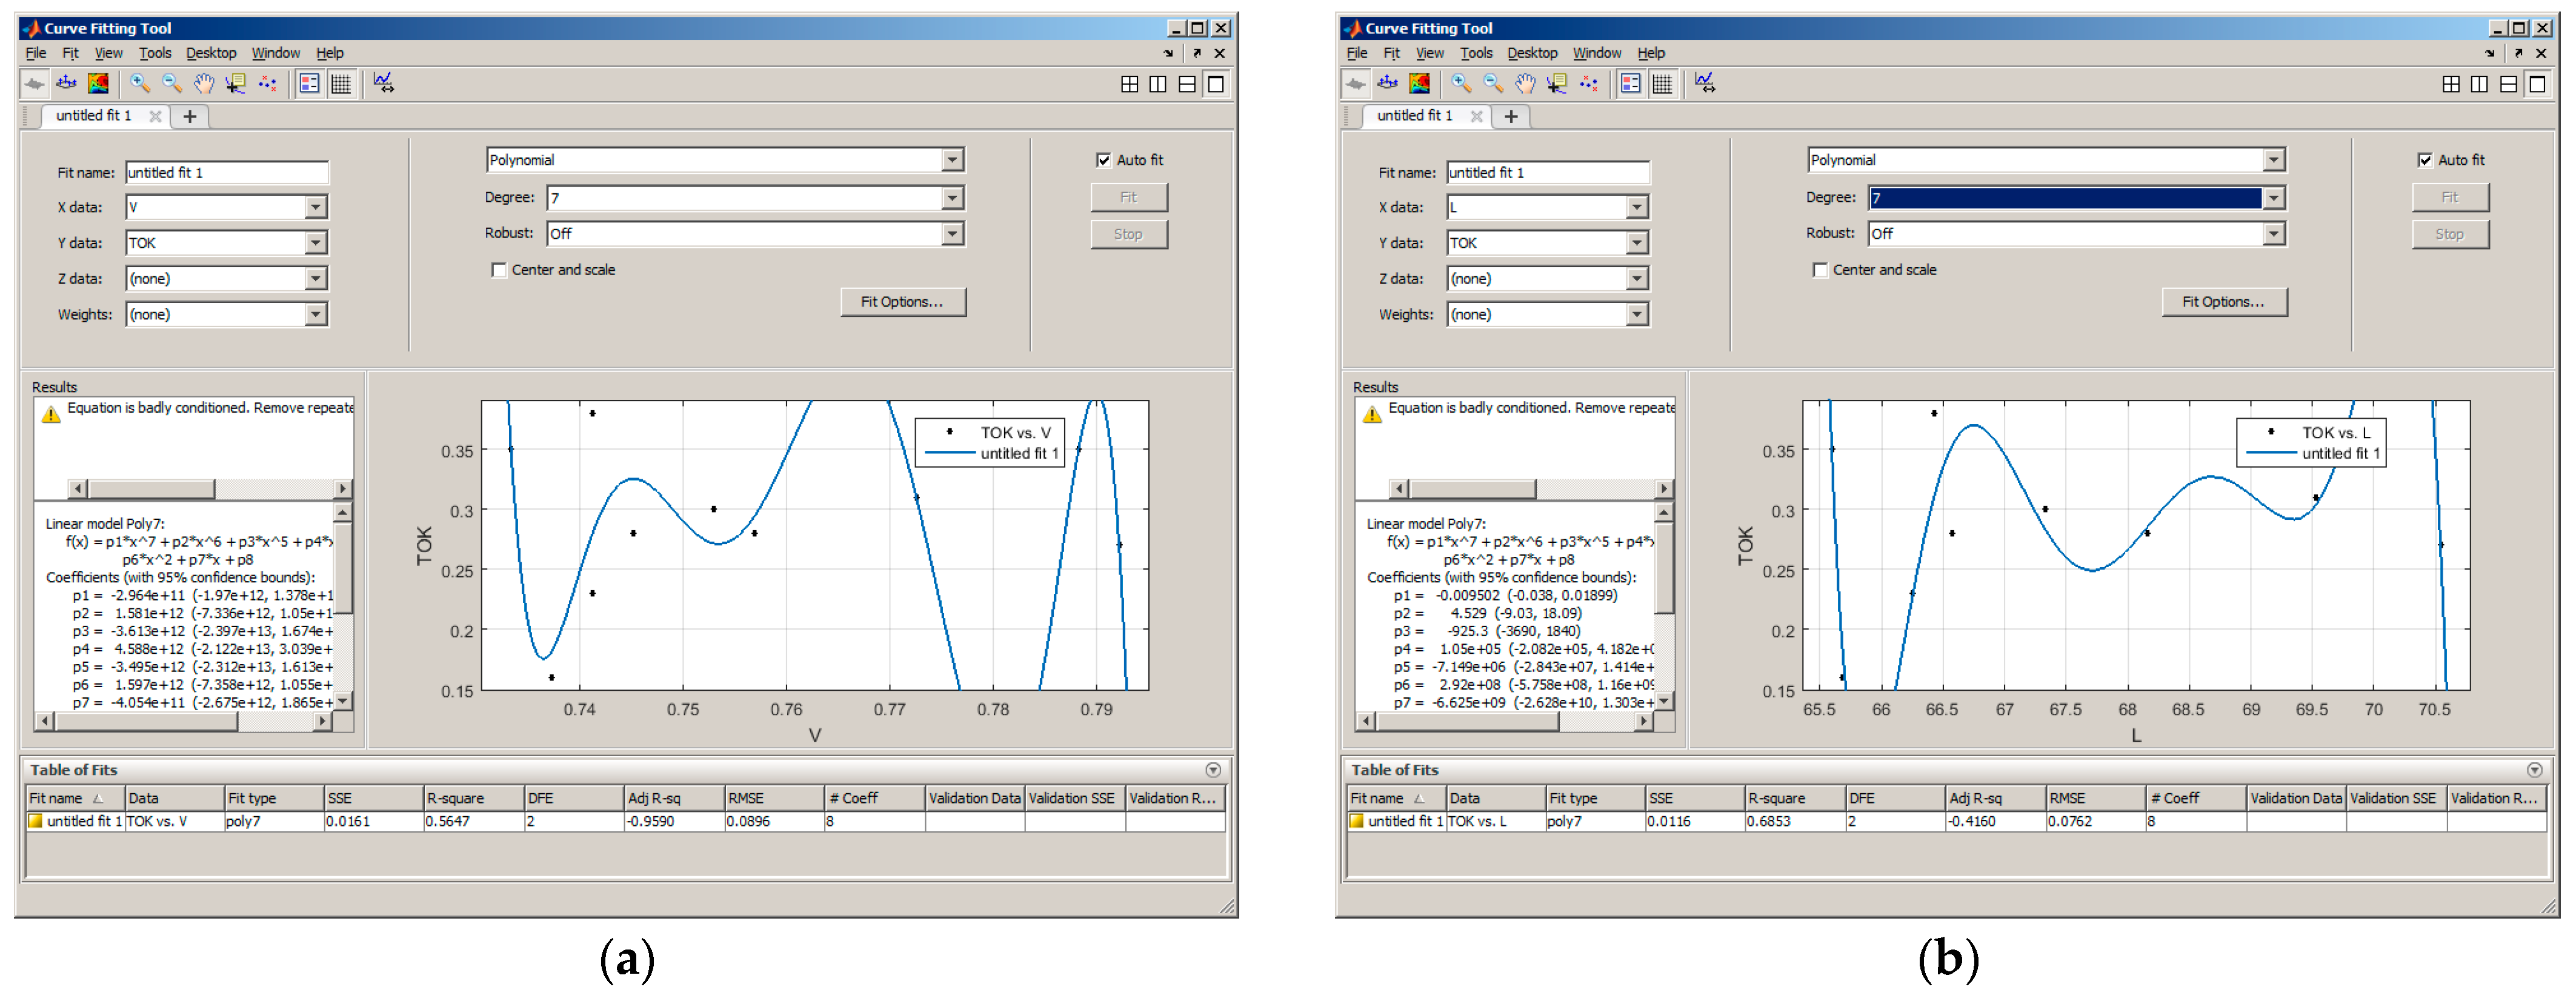
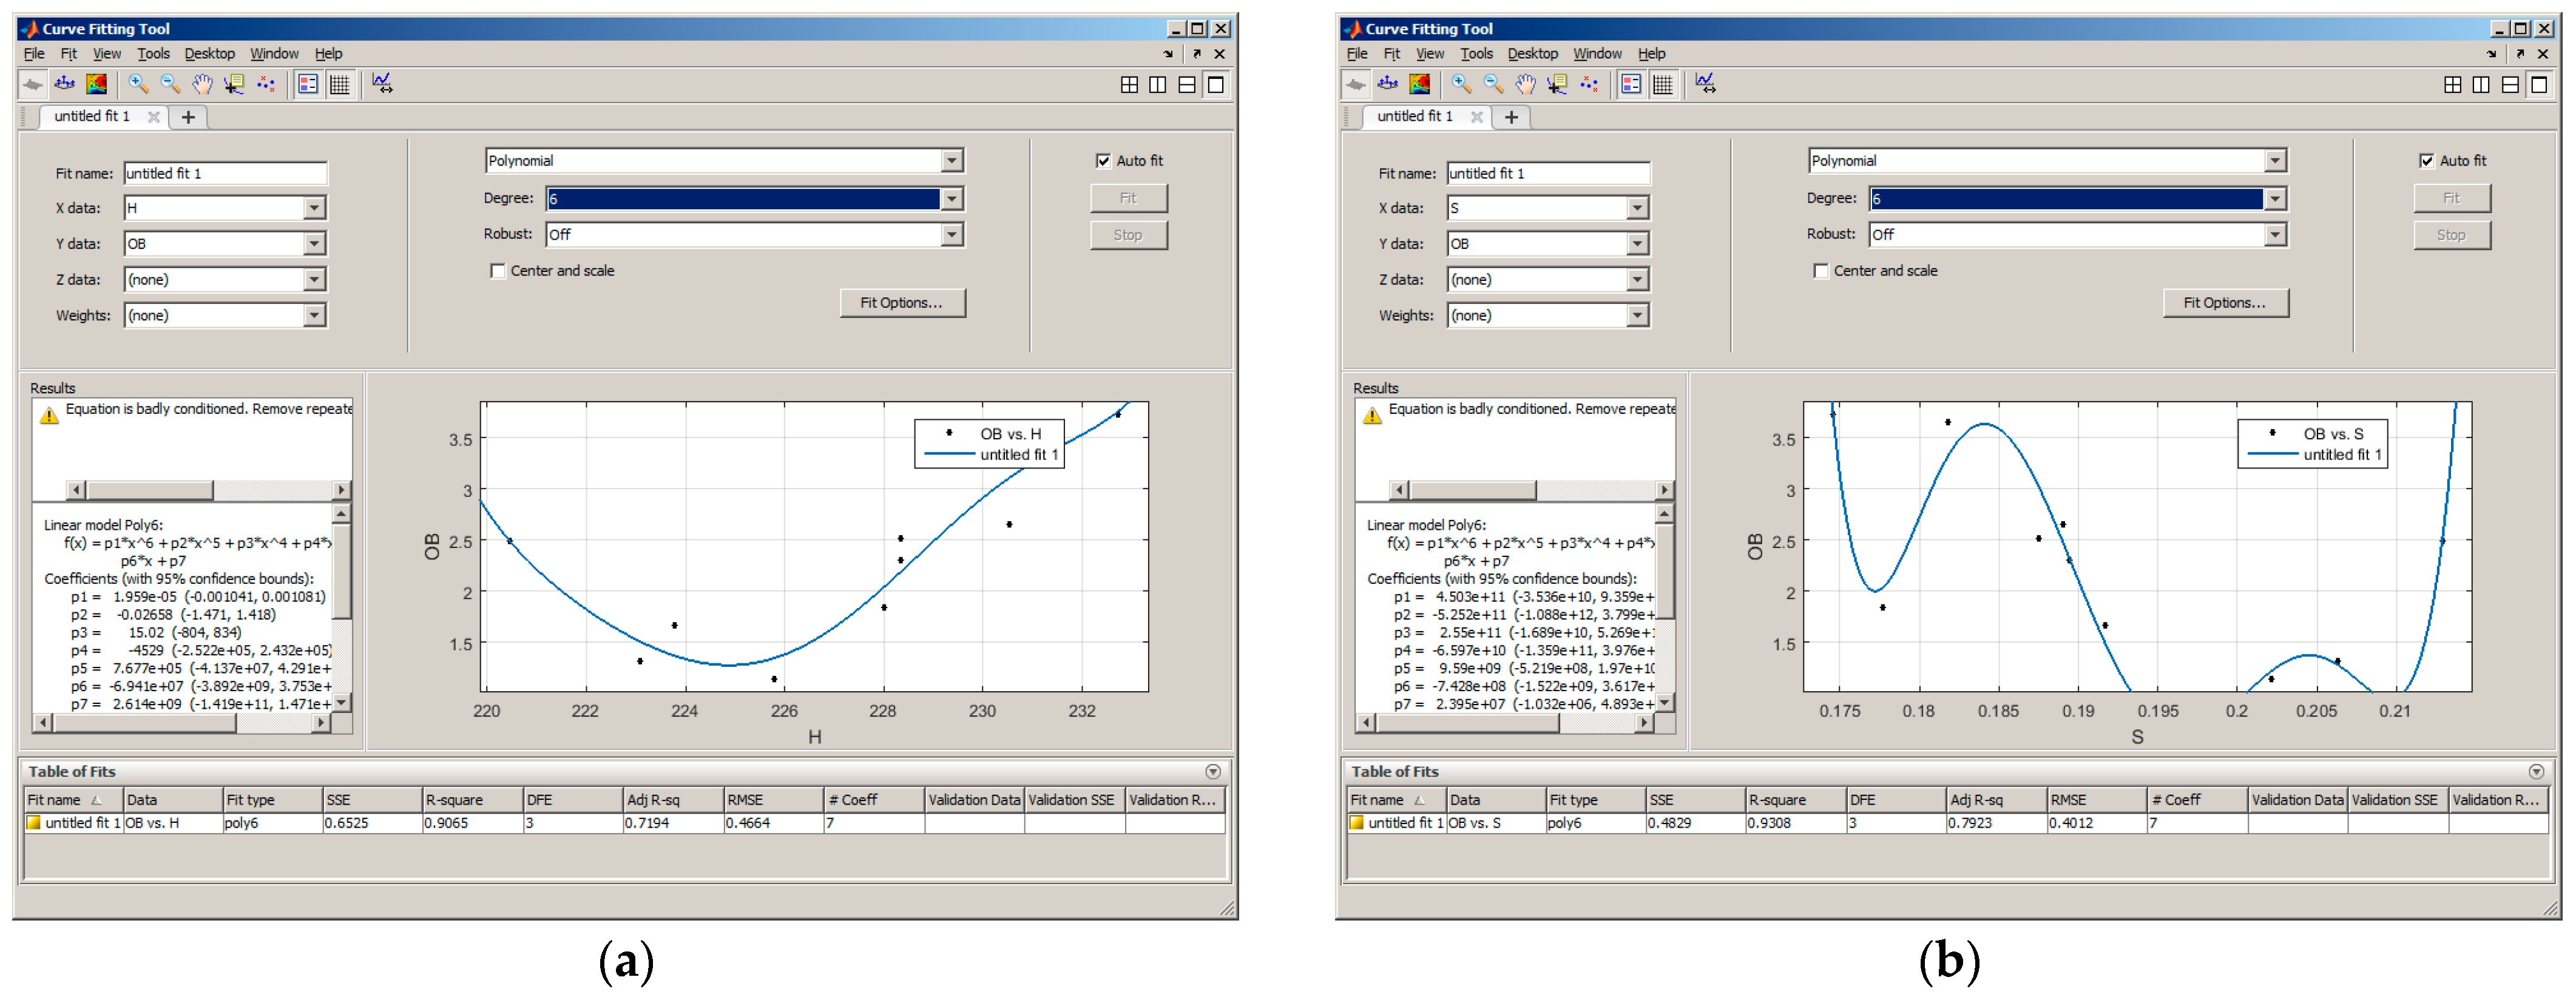
3. Modeling the Dependencies between Color Components and Chemical Indicators of Tomatoes with Regression Models
- Dry matter—H(HSV);
- Ascorbic acid—H (HSV);
- Titratable organic acids—a(Lab);
- General dyes—H(HSV), S(HSV), and a(Lab);
- Lycopene—H(HSV), S(HSV), and a(Lab).
4. Conclusions
- The dry substance had moderate dependence with R(RGB), S(HSV), and b(Lab) and significant dependence with H(HSV) and a(Lab);
- The ascorbic acid substance had moderate dependence with H(HSV), S(HSV), and a(Lab);
- The titratable organic acids had moderate dependence with S(HSV) and b(Lab); significant dependence with R(RGB); and strong dependance with V(HSV), L(Lab), a(Lab), X(XYZ), and Y(XYZ);
- The general dyes had significant dependence with H(HSV), S(HSV), and a(Lab);
- The lycopene had significant dependence with H(HSV), S(HSV) and a(Lab);
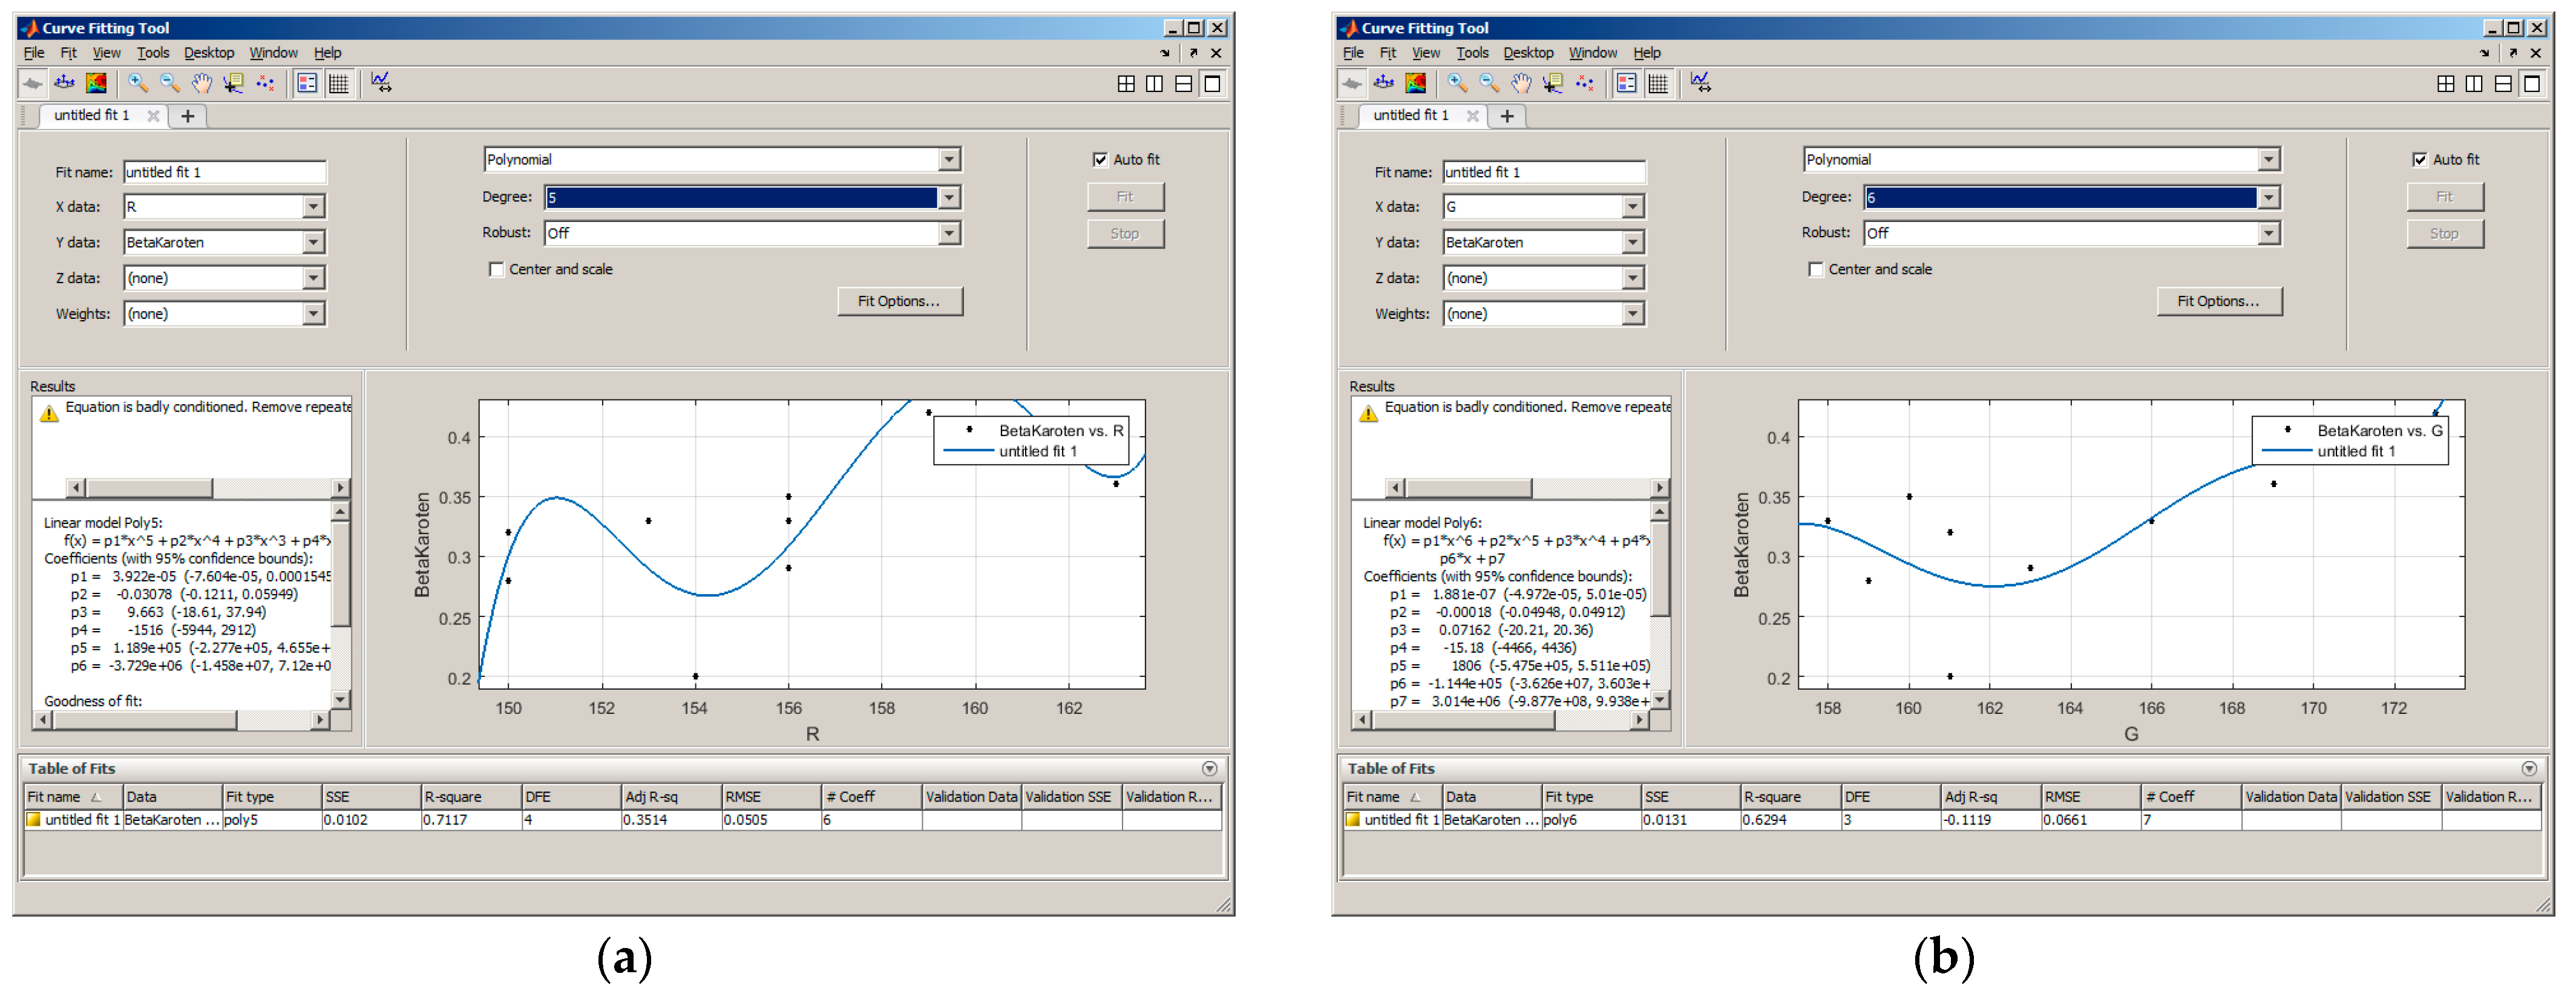
- The beta-carotene had significant dependence with R(RGB), G(RGB), B(RGB), V(HSV), L(Lab), X(XYZ), Y(XYZ), and Z(XYZ).
Author Contributions
Funding
Institutional Review Board Statement
Informed Consent Statement
Data Availability Statement
Acknowledgments
Conflicts of Interest
References
- Kurina, A.; Solovieva, A.; Khrapalova, I.; Artemyeva, A. Biochemical composition of tomato fruits of various colors. Vavilovskii Zhurnal Genet. Sel. 2021, 25, 34595374. [Google Scholar] [CrossRef] [PubMed]
- Amr, A.; Raie, W. Tomato Components and Quality Parameters. A Review. Jordan J. Agric. Sci. 2022, 18, 199–220. [Google Scholar] [CrossRef]
- Zhang, J.; Liu, S.; Zhu, X.; Chang, Y.; Wang, C.; Ma, N.; Wang, J.; Zhang, X.; Lyu, J.; Xie, J. A Comprehensive Evaluation of Tomato Fruit Quality and Identification of Volatile Compounds. Plants 2023, 12, 2947. [Google Scholar] [CrossRef] [PubMed]
- Radzevičius, A.; Viskelis, J.; Karkleliene, R.; Juskevicience, D.; Viskelis, P. Determination of tomato quality attributes using near infrared spectroscopy and reference analysis. Zemdirb. -Agric. 2016, 103, 91–97. [Google Scholar] [CrossRef]
- Lucini, L.; Pellizzoni, M.; Baffi, C.; Molinari, P. Rapid determination of lycopene and β-carotene in tomato by liquid chromatography/electrospray tandem mass spectrometry. J. Soc. Chem. Ind. Food Agric. 2012, 92, 22095779. [Google Scholar] [CrossRef]
- Tomato Grades and Standards. Available online: https://www.ams.usda.gov/grades-standards/tomato-grades-and-standards (accessed on 13 March 2024).
- Ireri, D.; Belal, E.; Okinda, C.; Makange, N.; Ji, C. A computer vision system for defect discrimination and grading in tomatoes using machine learning and image processing. Artif. Intell. Agric. 2019, 2, 28–37. [Google Scholar] [CrossRef]
- Tamakuwala, S.; Lavji, J.; Patel, R. Quality identification of tomato using image processing techniques. Int. J. Electr. Electron. Data Commun. 2018, 6, 67–70. [Google Scholar]
- UluiŞik, S.; Yildiz, F.; Özdemir, A.T. Image processing based machine vision system for tomato volume estimation. In Proceedings of the 2018 Electric Electronics, Computer Science, Biomedical Engineerings’ Meeting (EBBT), Istanbul, Turkey, 18−19 April 2018; pp. 1–4. [Google Scholar] [CrossRef]
- Bhargava, A.; Bansal, A. Fruits and vegetables quality evaluation using computer vision: A review. J. King Saud Univ. -Comput. Inf. Sci. 2021, 33, 243–257. [Google Scholar] [CrossRef]
- Tian, S.; Xu, H. Nondestructive Methods for the Quality Assessment of Fruits and Vegetables Considering Their Physical and Biological Variability. Food Eng. Rev. 2022, 14, 380–407. [Google Scholar] [CrossRef]
- Dubey, S.R.; Jalal, A.S. Application of Image Processing in Fruit and Vegetable Analysis: A Review. J. Intell. Syst. 2015, 24, 405–424. [Google Scholar] [CrossRef]
- Narendra, V.G.; Pinto, A.J. Defects Detection in Fruits and Vegetables Using Image Processing and Soft Computing Techniques; Nigdeli, S.M., Kim, J.H., Bekdaş, G., Yadav, A., Eds.; Advances in Intelligent Systems and Computing; Springer: Singapore, 2020; Volume 1275, pp. 325–337. [Google Scholar] [CrossRef]
- Mahendran, R.; Jayashree, G.C.; Alagusundaram, K. Application of computer vision technique on sorting and grading of fruits and vegetables. Food Process. Technol. 2012, 3. [Google Scholar] [CrossRef]
- SaldañaI, E.; SicheII, R.; Luján, M.; Quevedo, R. Review: Computer vision applied to the inspection and quality control of fruits and vegetables. Braz. J. Food Technol. 2013, 16, 254–272. [Google Scholar] [CrossRef]
- Color Thresholder. Available online: https://www.mathworks.com/help/images/ref/colorthresholder-app.html (accessed on 13 March 2024).
- Hasanzadeh, B.; Abbaspour-Gilandeh, Y.; Soltani-Nazarloo, A.; Hernández-Hernández, M.; Gallardo-Bernal, I.; Hernández-Hernández, J.L. Non-Destructive Detection of Fruit Quality Parameters Using Hyperspectral Imaging, Multiple Regression Analysis and Artificial Intelligence. Hortic. 2022, 8, 598. [Google Scholar] [CrossRef]
- Pathmanabana, P.; Gnanavelb, B.K.; Anandanc, S.S. Recent application of imaging techniques for fruit quality assessment. Trends Food Sci. Technol. 2019, 94, 32–42. [Google Scholar] [CrossRef]
- Tallada, J.G.; Nagata, M.; Kobayashi, T. Nondestructive estimation of firmness of strawberries (Fragaria × ananassa duch.) using NIR hyperspectral imaging. Environ. Control. Biol. 2006, 44, 245–255. [Google Scholar] [CrossRef]
- Ostertagová, E. Modelling using polynomial regression. Procedia Eng. 2012, 48, 500–506. [Google Scholar] [CrossRef]


| № | Weight | Dry Substance | Ascorbic Acid | Titratable Organic Acids | General Dyes | Lycopene | Beta-Carotene |
|---|---|---|---|---|---|---|---|
| (g) | Re (%) | (mg %) | (%) | (mg %) | (mg %) | (mg %) | |
| 1 | 134 | 3.30 | 17.36 | 0.16 | 1.14 | 0.78 | 0.28 |
| 2 | 198 | 3.80 | 20.32 | 0.23 | 1.32 | 0.90 | 0.32 |
| 3 | 290 | 3.50 | 18.63 | 0.28 | 1.67 | 1.23 | 0.33 |
| 4 | 228 | 3.80 | 18.20 | 0.31 | 1.84 | 1.32 | 0.40 |
| 5 | 284 | 4.00 | 20.32 | 0.28 | 2.30 | 1.94 | 0.20 |
| 6 | 306 | 3.90 | 19.05 | 0.27 | 2.49 | 1.89 | 0.42 |
| 7 | 288 | 4.10 | 18.63 | 0.30 | 2.51 | 2.05 | 0.29 |
| 8 | 260 | 4.30 | 18.63 | 0.35 | 2.65 | 2.11 | 0.36 |
| 9 | 258 | 4.20 | 18.20 | 0.38 | 3.73 | 3.11 | 0.35 |
| 10 | 196 | 4.10 | 17.36 | 0.35 | 3.65 | 3.07 | 0.33 |
| № | R | G | B | H | S | V |
|---|---|---|---|---|---|---|
| 1 | 150 | 159 | 188 | 225.79 | 0.20 | 0.74 |
| 2 | 150 | 161 | 189 | 223.08 | 0.21 | 0.74 |
| 3 | 156 | 166 | 193 | 223.78 | 0.19 | 0.76 |
| 4 | 162 | 169 | 197 | 228.00 | 0.18 | 0.77 |
| 5 | 154 | 161 | 190 | 228.33 | 0.19 | 0.75 |
| 6 | 159 | 173 | 202 | 220.47 | 0.21 | 0.79 |
| 7 | 156 | 163 | 192 | 228.33 | 0.19 | 0.75 |
| 8 | 163 | 169 | 201 | 230.53 | 0.19 | 0.79 |
| 9 | 156 | 160 | 189 | 232.73 | 0.17 | 0.74 |
| 10 | 153 | 158 | 187 | 231.18 | 0.18 | 0.73 |
| № | L | a | b | X | Y | Z |
| 1 | 65.68 | 3.06 | −16.02 | 0.34 | 0.35 | 0.53 |
| 2 | 66.25 | 2.18 | −15.72 | 0.35 | 0.36 | 0.53 |
| 3 | 68.16 | 2.24 | −15.01 | 0.37 | 0.38 | 0.56 |
| 4 | 69.53 | 3.41 | −15.11 | 0.39 | 0.40 | 0.58 |
| 5 | 66.58 | 3.69 | −15.75 | 0.35 | 0.36 | 0.54 |
| 6 | 70.54 | 1.38 | −16.37 | 0.40 | 0.42 | 0.62 |
| 7 | 67.33 | 3.67 | −15.71 | 0.36 | 0.37 | 0.55 |
| 8 | 69.74 | 4.62 | −17.00 | 0.40 | 0.40 | 0.61 |
| 9 | 66.43 | 4.67 | −15.40 | 0.35 | 0.36 | 0.53 |
| 10 | 65.60 | 4.36 | −15.56 | 0.34 | 0.35 | 0.52 |
| R | G | B | H | S | V | |
|---|---|---|---|---|---|---|
| Dry substance | 0.446 | 0.077 | 0.216 | 0.608 | −0.445 | 0.216 |
| Ascorbic acid | −0.081 | 0.154 | 0.120 | −0.385 | 0.373 | 0.120 |
| Titratable organic acids | 0.568 | −0.133 | −0.085 | −0.191 | −0.313 | 0.972 |
| General dyes | 0.257 | −0.133 | −0.036 | 0.675 | −0.563 | −0.036 |
| Lycopene | 0.216 | −0.186 | −0.085 | 0.699 | −0.576 | −0.085 |
| Beta-carotene | 0.603 | 0.678 | 0.644 | −0.191 | 0.040 | 0.644 |
| L | a | b | X | Y | Z | |
| Dry substance | 0.161 | 0.617 | −0.330 | 0.257 | 0.160 | 0.210 |
| Ascorbic acid | 0.113 | −0.363 | −0.095 | 0.060 | 0.108 | 0.118 |
| Titratable organic acids | 0.982 | 0.989 | −0.442 | 0.980 | 0.999 | −0.265 |
| General dyes | −0.056 | 0.629 | −0.054 | 0.033 | −0.054 | −0.037 |
| Lycopene | −0.107 | 0.655 | −0.046 | −0.016 | −0.106 | −0.087 |
| Beta-carotene | 0.681 | −0.223 | −0.092 | 0.675 | 0.686 | 0.651 |
| Moderate Dependence from 0.3 to 0.5 | Significant Dependence from 0.5 to 0.7 | Strong Addiction from 0.7 to 0.9 | |
|---|---|---|---|
| Dry substance | R, S, b | H, a | - |
| Ascorbic acid | H, S, a | - | - |
| Titratable organic acids | S, b | R | V, L, a, X, Y |
| General dyes | - | H, S, a | - |
| Lycopene | - | H, S, a | - |
| Beta-carotene | - | R, G, B, V, L, X, Y, Z | - |
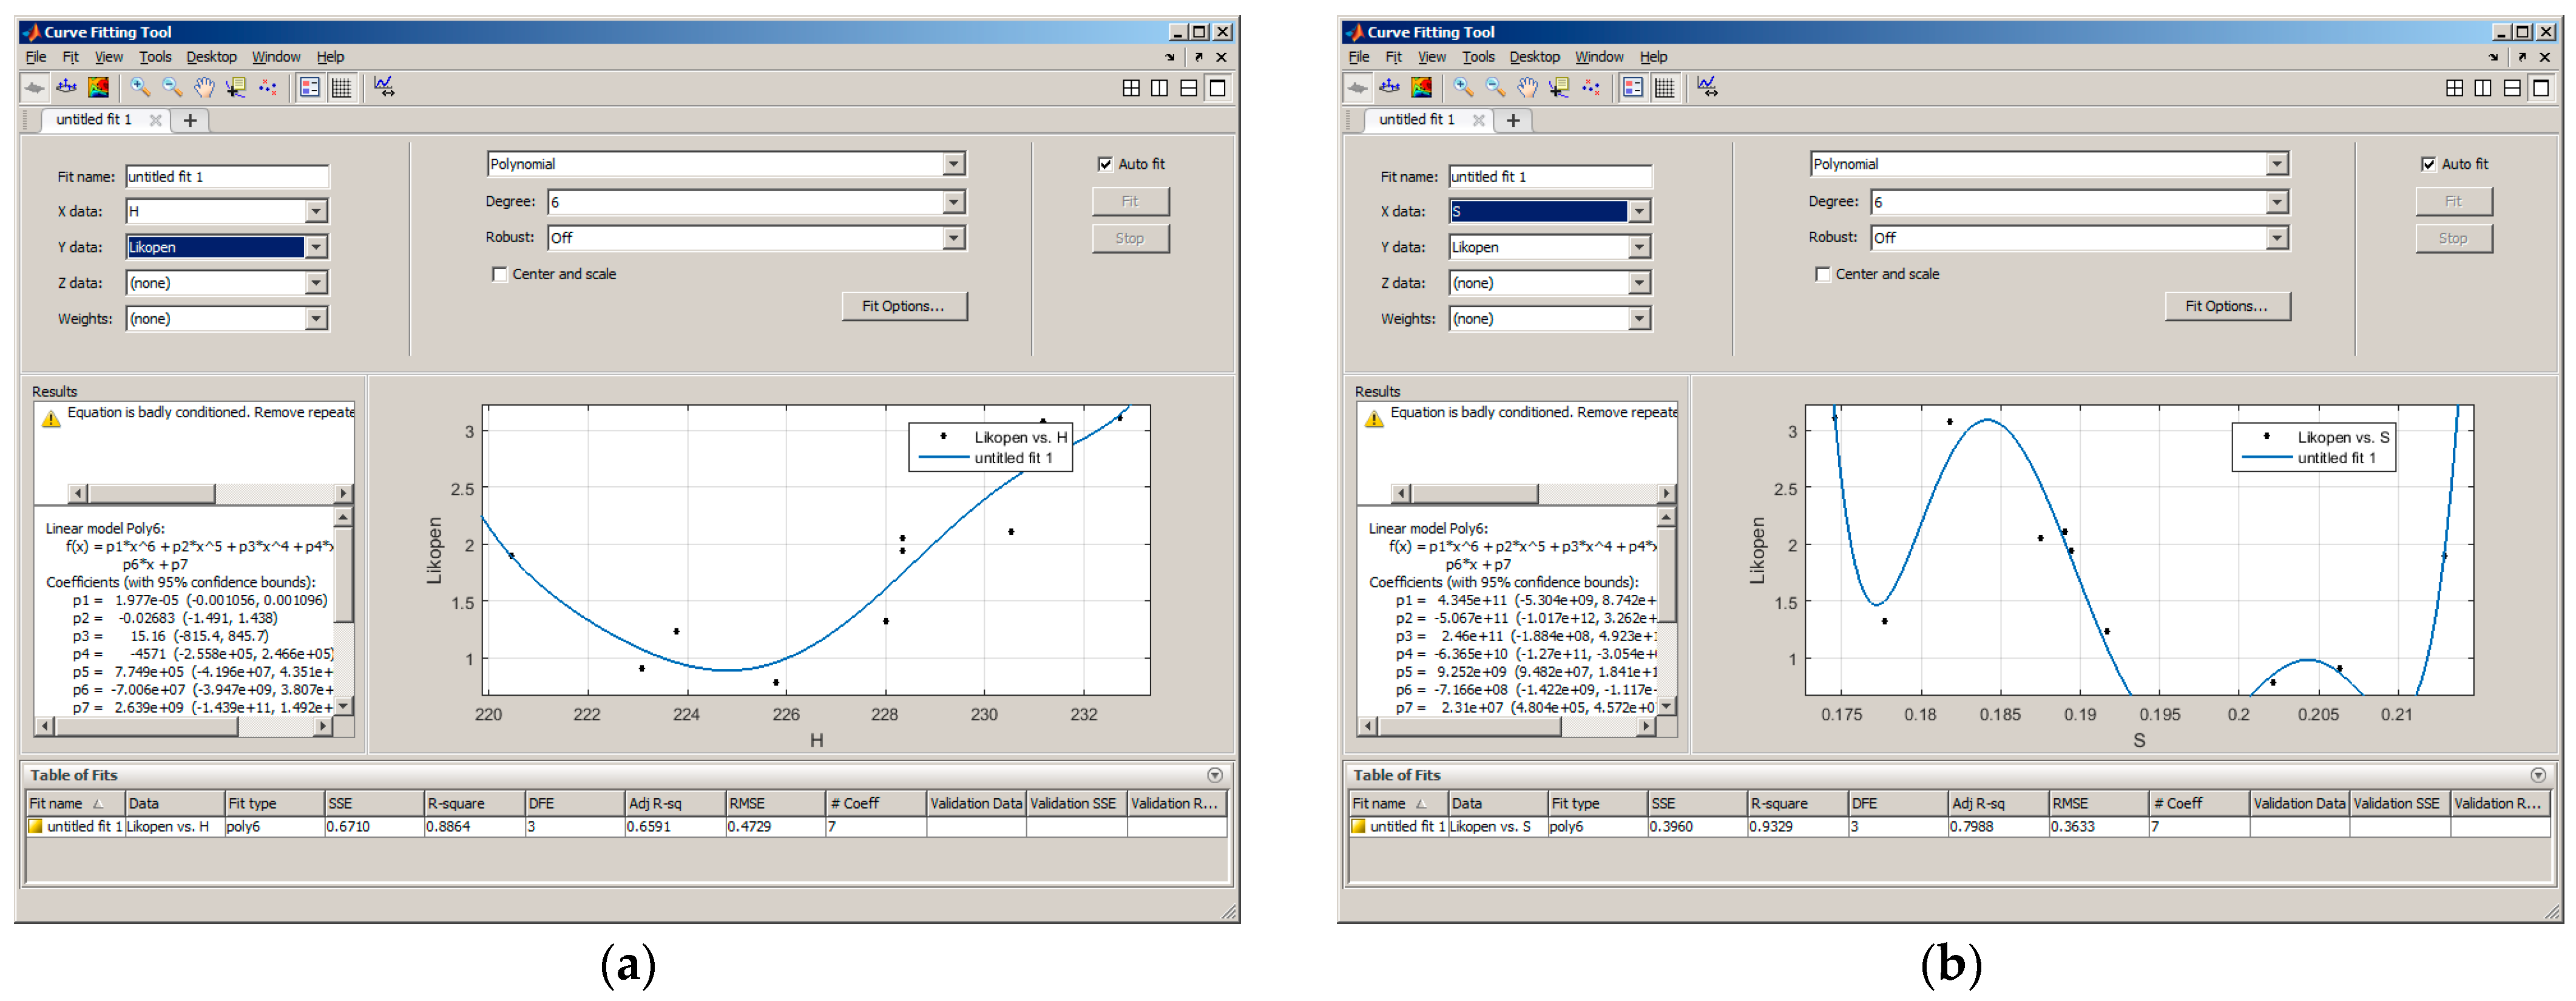
| Model | Dry Substance = f(H(HSV)) | Ascorbic Acid = f(H(HSV)) | Titratable Organic Acids = f(a(Lab)) | General Dyes = f(H(HSV)) | General Dyes = f(S(HSV)) | General Dyes = f(a(Lab)) | Lycopene = f(H(HSV)) | Lycopene = f(S(HSV)) | Lycopene = f(a(Lab)) |
|---|---|---|---|---|---|---|---|---|---|
| 0.7161 | 0.7495 | 0.8054 | 0.9065 | 0.9308 | 0.9067 | 0.8864 | 0.9329 | 0.9199 |
Disclaimer/Publisher’s Note: The statements, opinions and data contained in all publications are solely those of the individual author(s) and contributor(s) and not of MDPI and/or the editor(s). MDPI and/or the editor(s) disclaim responsibility for any injury to people or property resulting from any ideas, methods, instructions or products referred to in the content. |
© 2024 by the authors. Licensee MDPI, Basel, Switzerland. This article is an open access article distributed under the terms and conditions of the Creative Commons Attribution (CC BY) license (https://creativecommons.org/licenses/by/4.0/).
Share and Cite
Georgieva, T.; Veleva, P.; Atanassova, S.; Daskalov, P. Indirect Determination of Basic Tomato Quality Parameters Using Color Digital Images. Eng. Proc. 2024, 70, 24. https://doi.org/10.3390/engproc2024070024
Georgieva T, Veleva P, Atanassova S, Daskalov P. Indirect Determination of Basic Tomato Quality Parameters Using Color Digital Images. Engineering Proceedings. 2024; 70(1):24. https://doi.org/10.3390/engproc2024070024
Chicago/Turabian StyleGeorgieva, Tsvetelina, Petya Veleva, Stefka Atanassova, and Plamen Daskalov. 2024. "Indirect Determination of Basic Tomato Quality Parameters Using Color Digital Images" Engineering Proceedings 70, no. 1: 24. https://doi.org/10.3390/engproc2024070024
APA StyleGeorgieva, T., Veleva, P., Atanassova, S., & Daskalov, P. (2024). Indirect Determination of Basic Tomato Quality Parameters Using Color Digital Images. Engineering Proceedings, 70(1), 24. https://doi.org/10.3390/engproc2024070024