Abstract
This work presents the results of an experimental study of the braking properties of bicycles and an e-bicycle. Data on braking decelerations and braking distance under different braking conditions were obtained for different bicycles including an e-bicycle. A satellite receiver was used to receive the data and specialized software was used for their processing. The specialized literature lacks data on the braking properties of bicycles for Bulgarian road conditions, which are necessary for any expert investigations of accidents involving cyclists. An initial database of bicycle braking decelerations for various braking conditions was compiled. The obtained results on the braking properties should be very useful in the preparation of auto-technical examinations for the court and the police, as well as for improvements in road traffic safety.
1. Introduction
Mobility has a significant impact on our daily lives. It defines the interaction between people, economies, communities, and states. Traffic on the road causes serious problems for society—deaths, injuries, and material damage. Bulgaria is one of the countries in Europe with the highest relative number of people killed in traffic accidents.
Part of traffic accidents can be preventable, and the consequences of another part can be mitigated by researching and analyzing the causes, the mechanism of occurrence, and the possibilities to prevent traffic accidents. In the event of serious road accidents, auto-technical experts are appointed. The main purpose of the auto-technical examination is to clarify the circumstances of occurrence, the mechanism of the occurrence, and the possibilities to prevent the accident.
The analysis of the state of the problem shows that the Bulgarian specialized literature lacks data on the braking properties of cyclists, which are necessary for the expert study of road accidents involving cyclists. This determines the actuality of this research.
2. Explanation
Expertise is one of the main sources of evidence and assistance to the competent authorities in solving legal cases to reveal the guilt or innocence of the participants in the accident. One of the main tasks in the expert investigation of road accidents is the determination of the braking properties of road vehicles [1,2].
In the expert study of traffic accidents with cyclists, there is a need to select values for the negative acceleration when stopping a bicycle. In order to ascertain these values [3,4,5], a determination of the braking distance depends on the correct choice of the braking deceleration, and from there, a conclusion about the possibility of preventing the accident by braking can be made. The specialized literature lacks data on the braking decelerations of modern bicycles for the conditions of Bulgarian roads. This determines the need to conduct experimental studies to determine the braking deceleration of modern bicycles under different conditions. In expert practice, the determination of the braking deceleration in the process of emergency braking is particularly important. The braking process is the movement of the vehicle in the presence of negative acceleration, in which its speed decreases. Emergency braking is a process in which braking is initiated by applying the braking system with maximum force [6].
Autonomous vehicle driving systems have recently been implemented. The collection of data on the process of their movement can be carried out by various methods [7,8]. Systems that do not require complex equipment have been used for a long time, but systems with satellites have also been used. One of the easiest methods applied in these experimental studies is by using GPS [9].
Bicycles are part of the movement in an urban environment. The study of their movement parameters would be useful for the study of road accidents involving them. And brakes are essential in these studies [10].
2.1. Equipment
The use of specialized equipment to conduct various tests is an important means of achieving accurate results relevant to specific conditions. Considering this, a VBOX Sport GPS data logger satellite receiver was used in this study to determine the braking properties [11,12]. The equipment is manufactured from Racelogic company registered in England, UK. It was created on the basis of a new generation of satellite receivers with very good technical characteristics and can measure various parameters of moving objects.
In Table 1, some basic technical characteristics of the VBOX Sport GPS data logger are presented [11].

Table 1.
Technical characteristics of the VBOX Sport Satellite Receiver.
The receiver is waterproof (IP65), battery-powered, with a data logging frequency of 10 Hz, and is very light and robust, making it very suitable for bicycles and motorcycles. It is possible to use an external antenna.
The VBOX Tools software version VB 3i V01.03 [11] was used to review and process the research results. If there is a USB/RS232 connection between the logger and a computer, from the main tools menu of the VBOX software product via the ‘Load All’ icon, a Windows dialog box will appear showing a file from the flash card or from another source. The VBOX tools software loads the file into its main memory. The file can be presented in several modes, but the most common is the graphical one, as a chart, by selecting the ‘Graph’ icon from the main menu.
The information is presented in the following three ways: graph—the selected channels are presented as a function of time or path; data—here the obtained results are presented in a table; map—represents the trajectory of the bike.
The cursor in the main window can be moved using the arrow keys on the keyboard, by moving the mouse to a new position and clicking with the left button, or by clicking the cursor and dragging the mouse left or right. When the cursor is moving in the data table, the data values where the cursor is located are displayed. The grid in the map window also shows the position of the mobile object (MO) for the time selected with the cursor.
The software product also allows data to be downloaded directly to the computer’s hard drive. This means that the data are very quickly accessed on the graph screen at the end of the test without the need to move and load the file from the compact flash card. The disc burning capability effectively enables VBOX data to be written directly to a VBOX file on the computer disc.
The VBOX Tools screen is composed of a main menu that is constant for the software product and a secondary menu that is module-specific. So, if the Report Generator feature is turned on, it appears in the secondary menu.
2.2. Method and Problem Formulation
The methodology of the experimental research includes experimental determination of the braking deceleration and the complete braking distance of different bicycles during emergency braking on a dry asphalt pavement. Three different bikes were used: Cross Fusion with Kenda K1104A 29 × 2.10 tires with disc brakes; e-bicycle with a DC electric motor built into the front wheel Ultra Explorer 24 with disc brakes and Kenda Desert “26 × 2.10” tires; and Probike Melody Bike 24 with Kenda MTB tires 24 × 1.95 and V-brakes. The bikes are manufactured by Cross LTD, Bulgarian Company established in Montana city, USA. For the first two bikes, cyclists aged 30 to 45 participated in the study. For the children’s bike, the age of the cyclists was from 12 to 15 years.
Three different series of tests were conducted: braking with the front wheel brake; braking with the rear wheel brake; braking with both brakes at the same time. The speed at the beginning of the stop varied between 12 and 18 Km/h.
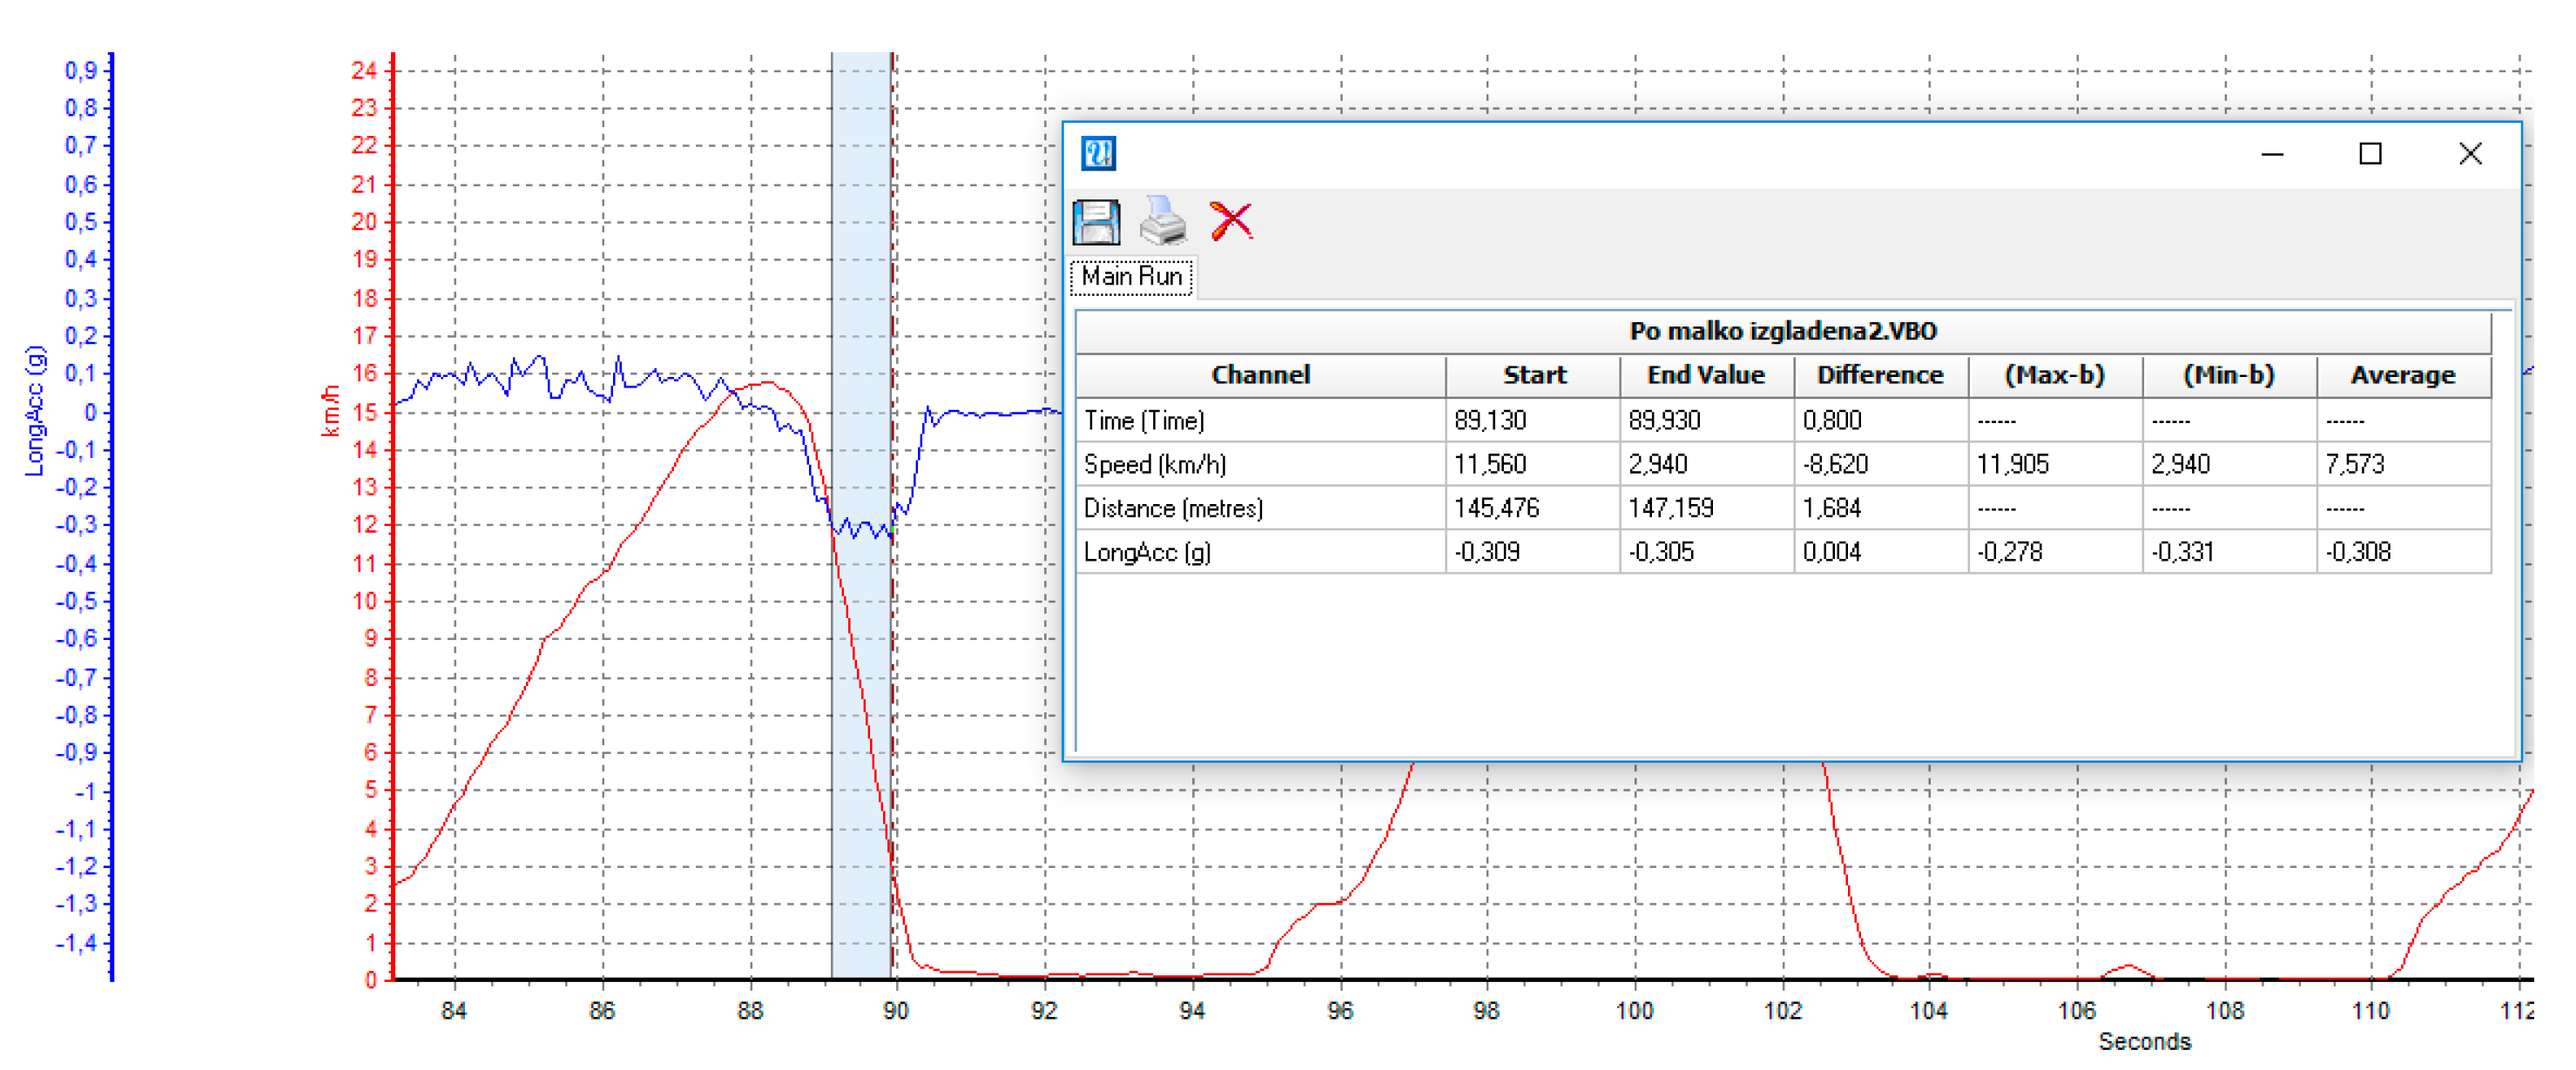
The results of the conducted research were processed with VBOX Tools software. In Figure 1, a portion of a real recording of the acceleration and velocity variation of a Cross Fusion bicycle is presented, and the additional Main Run window, through which the results for the minimum, maximum, and average acceleration values for the particular trial were processed.

Figure 1.
Acceleration (blue line) and velocity (red line) records.
The marked section of the graph shows the area for which the average value of the braking deceleration is determined for each particular trial. This is the area of the maximum deceleration that can be achieved for the relevant conditions. The average braking deceleration for this trial was 0.308 g or 3.021 m/s2. In this way, the values were also determined for the other series of experiments.
3. Results
The research results were processed with the Statistical Package for the Social Sciences Version 19—software used for interactive statistical analysis. Table 2 presents the main numerical characteristics for the braking deceleration of a Cross Fusion bicycle for the three braking modes.
Table 2.
Basic numerical characteristics of Cross Fusion bicycle.
The results for the main numerical characteristics of the braking deceleration when braking with both bicycle brakes on a dry asphalt surface determined an average value of the braking deceleration (Mean) 5.08 m/s2; the sample median is 5.12 m/s2; mode, that is, the most common value is 5.14 m/s2, the sample span is 0.94 m/s2; the smallest observed value is 4.68 m/s2; and the largest observed value is 5.62 m/s2.
Table 3 presents results for interval estimates of mean braking decelerations on a Cross Fusion bike.
Table 3.
Interval estimates of average braking decelerations of Cross Fusion bike.
Full stopping distance is directly related to traffic safety. In jurisprudence, the full stopping distance is called a dangerous stopping zone. When investigating a traffic accident, the investigating authorities or the court requires the experts to determine the dangerous zone for stopping the vehicles involved in the traffic accident. It is directly related to traffic safety and is investigated for the possibility of preventing road accidents.
Table 4 presents results for the length of the braking distance of a Cross Fusion bicycle depending on the speed at the start of the stop and the method of stopping. In the calculations, the experimentally obtained data on the average braking decelerations and a value of the total time for the initiation of braking of 1.2 s were used.
Table 4.
Braking distance of a Cross Fusion bike.
The analysis of the obtained results for a speed of 5 km/h shows that when braking with the front brake, the length of the braking distance is only 0.12 m less compared to the rear brake. The braking distance is 6% shorter. When braking with both brakes, the length of the braking distance is only 0.14 m less than with a rear brake. The braking distance is 7% shorter.
The results for a speed of 50 km/h show that when braking with a front brake, the length of the braking distance is 11.90 m less compared to a rear brake. The braking distance is 24% shorter. When braking with both brakes, the braking distance is 14.16 m shorter compared to the rear brake, which is a 28% reduction.
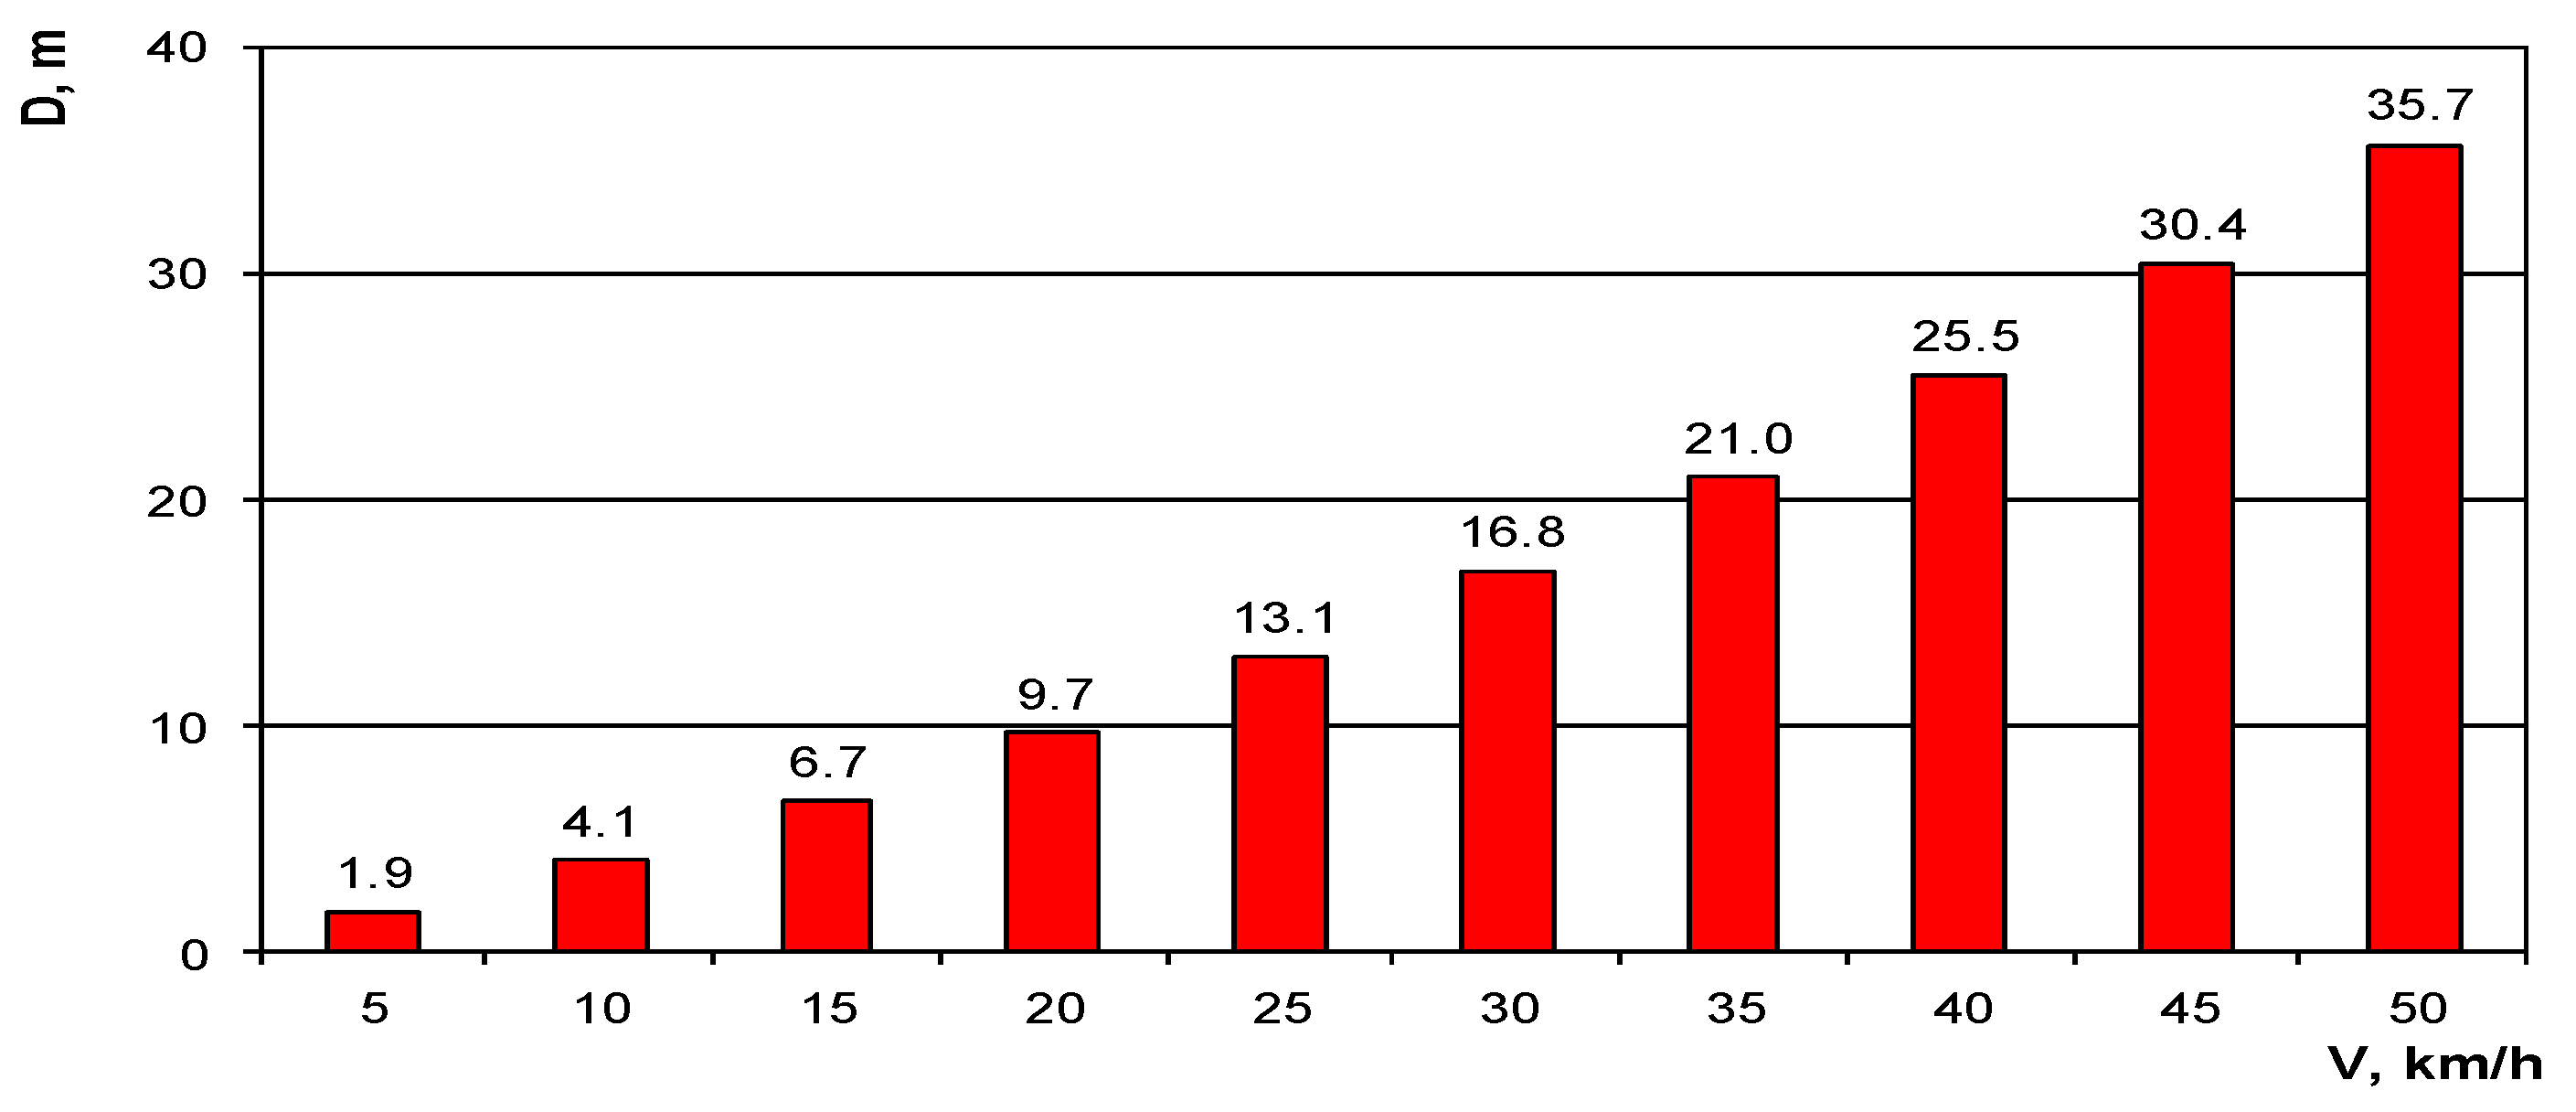
Graphically, the length of the danger zone of a Cross Fusion bicycle when braking with both brakes for different speeds is presented in Figure 2.
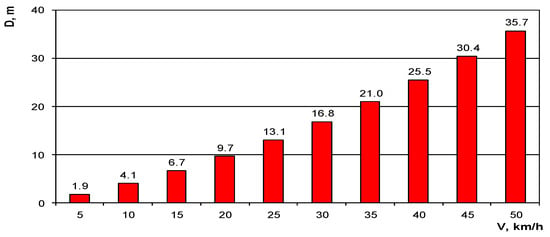
Figure 2.
Braking distance of a Cross Fusion bike.
It is found that when braking with both brakes for speeds from 5 to 20 km/h, the length of the braking distance changes by about 2 to 3 m; from 20 to 35 km/h, the length of the braking distance changes by about 3 to 4 m; and from 35 to 50 km/h, this variation is 4 to 5 m for every 5 km/h.
Table 5 presents the main numerical characteristics for the braking deceleration of the Probike Melody Bike for the three braking modes.
Table 5.
The main numerical characteristics of braking deceleration on dry pavement of Probike Melody Bike.
The results obtained for the average braking deceleration values are as follows: when braking with the rear brake—2.61 m/s2; when braking with the front—3.84 m/s2; and when braking with both brakes—4.18 m/s2. The minimum value for this bike is 2.19 m/s2 and the maximum value is 4.81 m/s2.
Table 6 presents the results of the study carried out for interval evaluations of the average braking decelerations of the bicycle for the different braking conditions.
Table 6.
Interval estimates of average braking decelerations of Probike Melody Bike.
Table 7 presents results for the length of the braking distance of the Probike Melody Bike depending on the speed and braking method.
Table 7.
Braking distance of Probike Melody Bike.
The obtained results for the length of the braking distance at low speeds are similar to the previous ones. At high speeds, the stopping distance when braking with the front brake is 22% shorter, and when stopping with both brakes, it is 26% shorter than with the rear brake.
The length of the danger zone when braking with both brakes on a Probike Melody Bike for different speeds is presented in Figure 3.
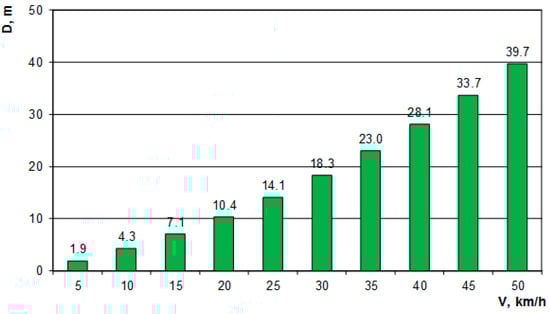
Figure 3.
Braking distance of Probike Melody Bike.
The results show a variation in stopping distance from 1.9 to 39.7 m for the speed limits studied. For the specific conditions, for every 5 km/h increase in speed, the length of the braking distance changes from 2.4 to 6.0 m.
Table 8 presents the main numerical characteristics for the braking deceleration of an Ultra Explorer e-bicycle depending on the method of braking.
Table 8.
The main numerical characteristics of braking deceleration on dry pavement of Ultra Explorer e-bicycle.
The results obtained for the average braking deceleration values are as follows: when braking with the rear brake—2.15 m/s2; when braking with the front—2.89 m/s2; and when braking with both brakes—4.15 m/s2. The minimum value for this bike is 1.67 m/s2 and the maximum is 4.87 m/s2.
Table 9 presents the results of the study carried out for interval evaluations of the average braking decelerations of an Ultra Explorer e-bicycle for the different braking conditions.
Table 9.
Interval estimates of average braking decelerations of Ultra Explorer e-bicycle.
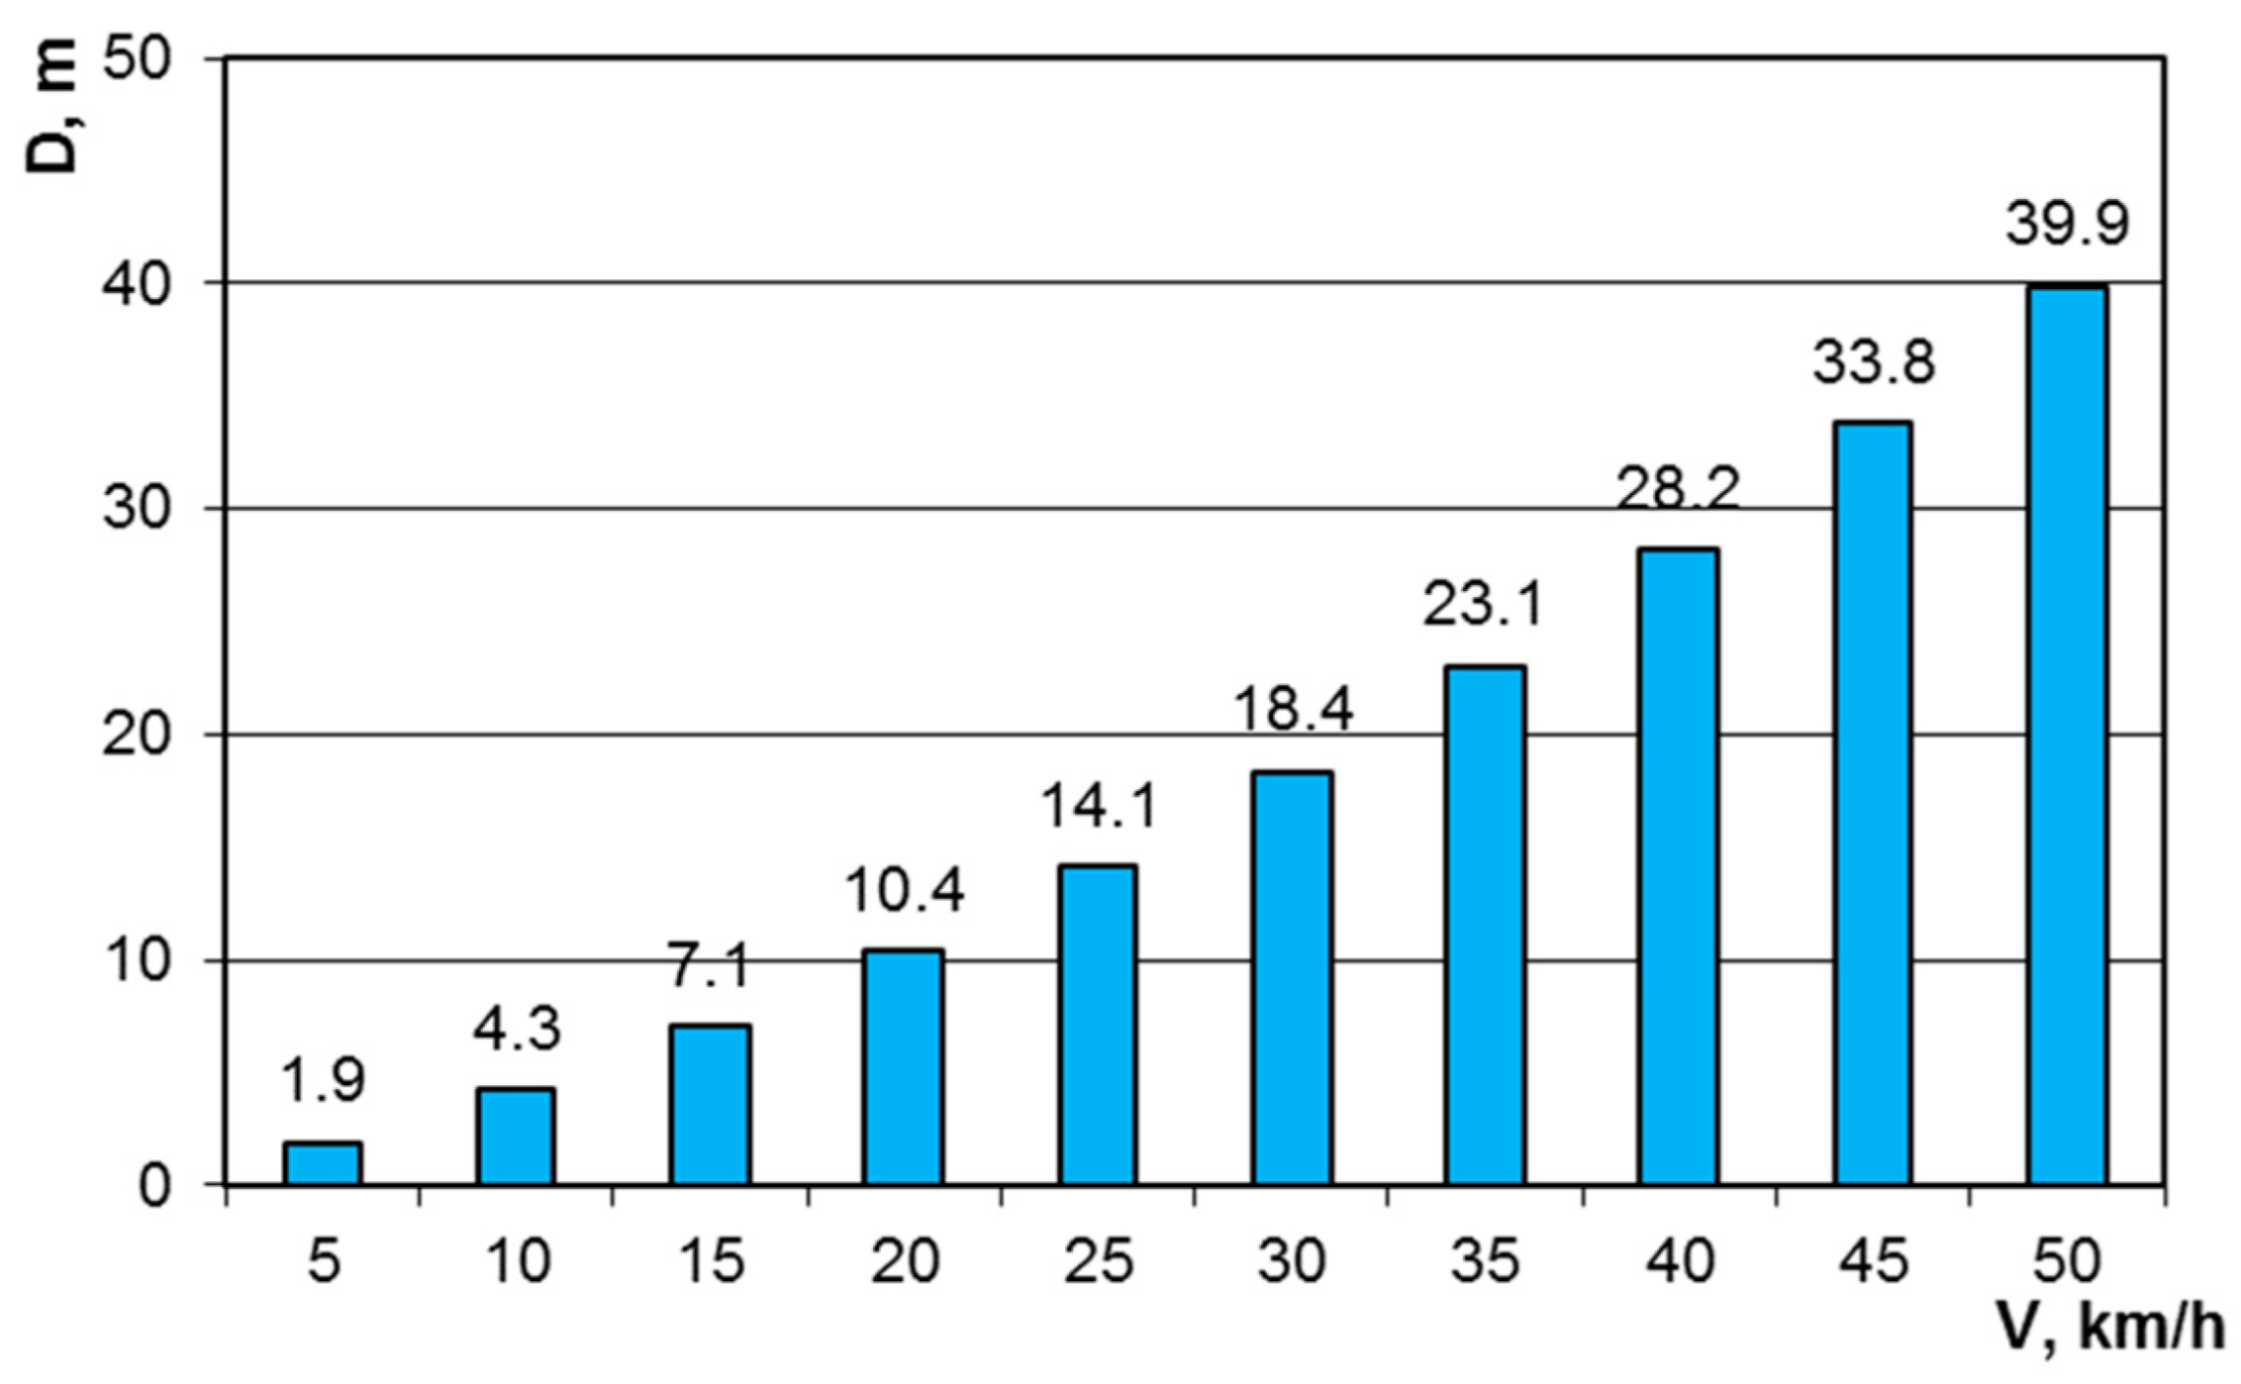
Table 10 presents the results for the braking distance of the Ultra Explorer e-bicycle depending on the speed and braking method, and, graphically, Figure 4 shows the stopping distance when braking with both brakes.
Table 10.
Braking distance of an Ultra Explorer e-bike.

Figure 4.
Braking distance of an Ultra Explorer e-bike.
The analysis of the results presented in Table 10 and the graph show that when braking with both brakes, the braking distance changes from 1.90 to 39.91 m. When braking at a speed of 50 km/h with both brakes, the braking distance is 35% shorter than when braking with the rear brake.
For all bikes studied, the braking distance at low speeds at the start of braking was found to be less affected by braking deceleration. Driver and vehicle reaction time has a greater influence, which depends on the traffic situation and the probability of an accident. At high speeds, the size of the braking deceleration has a more sensitive effect. The obtained results for the length of the braking distance are for the specific bicycles and conditions under which the research was conducted. Under different conditions, the results may be different.
4. Conclusions
As a result of the conducted research, data on the braking decelerations when stopping bicycles for adults and children for different braking conditions were experimentally obtained. For the examined bicycles and cyclists, the average values of braking decelerations are within the following limits: when braking with a rear brake from 2.15 to 2.91 m/s2; when braking with the front brake from 2.88 to 4.54 m/s2; and when braking with both brakes from 4.15 to 5.08 m/s2.
The main numerical characteristics and interval estimates of the mean braking decelerations for the different braking conditions were determined.
The lengths of the full stopping distance for the bikes and the conditions studied were determined. When braking with both brakes, the length of the braking distance is from 35.65 to 39.91 m for the studied speed limits.
The influence of the braking method on the length of the braking distance was established. When braking with both brakes, the length of the braking distance for the tested bicycles was 26 to 35% shorter compared to that when braking with only the rear brake, for a speed of 50 km/h.
Based on the experimental research, an initial database of bicycle braking decelerations for different braking conditions was compiled. The obtained results on braking decelerations and the length of the braking distance should be very useful in expert practice when preparing auto-technical examinations for the court and police in traffic accidents with cyclists and for improving road traffic safety.
Author Contributions
All authors contributed equally to this work. All authors have read and agreed to the published version of the manuscript.
Funding
This research received no external funding.
Institutional Review Board Statement
Not applicable.
Informed Consent Statement
Not applicable.
Data Availability Statement
Data are contained within the article.
Conflicts of Interest
The authors declare no conflicts of interest.
References
- Karapetkov, S.; Uzunov, H.; Dechkova, S.; Uzunov, V. Dynamics of Vehicle-Pedestrian Impact. Cauchy Problem and Finite Element Method. J. Eng. Sci. Technol. Rev. 2022, 15, 123–133. [Google Scholar] [CrossRef]
- Uzunov, H.; Dechkova, S.; Uzunov, V. Critical Speed in Pedestrians’ Relative Motion Regarding Limited Visibility Zone from Driver Seat. Proc. Eng. Sci. 2023, 5, 781–792. [Google Scholar] [CrossRef]
- Dimitrov, V.; Pavlov, N. Study of the Starting Acceleration and Regenerative Braking Deceleration of an Electric Vehicle at Different Driving Modes. In Proceedings of the 2021 13th Electrical Engineering Faculty Conference (BulEF), Varna, Bulgaria, 8–11 September 2021; pp. 1–4. [Google Scholar] [CrossRef]
- Uzunov, H.; Dimitrov, K.; Dechkova, S. Experimental Determination of the Tire-Road Friction Coefficient for a Vehicle with Anti-Lock Braking System. AIP Conf. Proc. 2022, 2557, 030001. [Google Scholar] [CrossRef]
- Dimitrov, R.; Ivanov, D.; Ivanov, Z.; Wrobel, R.; Andrych-Zalewska, M. Investigation of Acceleration and Brake Deceleration of Light Vehicles. In Proceedings of the 2022 International Conference on Communications, Information, Electronic and Energy Systems (CIEES), Veliko Tarnovo, Bulgaria, 24–26 November 2022; pp. 1–4. [Google Scholar] [CrossRef]
- Pandey, P.K.; Arora, H.; Kumar, B.A. Development of Driving Cycles for Electric Buses in Patna, India. In Proceedings of the 2023 8th International Conference on Models and Technologies for Intelligent Transportation Systems (MT-ITS), Nice, France, 14–16 June 2023; pp. 1–6. [Google Scholar] [CrossRef]
- Camara, F.; Fox, C. Space Invaders: Pedestrian Proxemic Utility Functions and Trust Zones for Autonomous Vehicle Interactions. Int. J. Soc. Robot. 2021, 13, 1929–1949. [Google Scholar] [CrossRef]
- Camara, F.; Fox, C. Unfreezing autonomous vehicles with game theory, proxemics, and trust. Front. Comput. Sci. 2022, 4, 969194. [Google Scholar] [CrossRef]
- Kotev, V.; Ivanov, I.; Komitov, G.; Stanchev, G.; Kostadinov, K. Object Detection and Tracking Approach to Control of a Mobile Agriculture Robot. In Proceedings of the 2023 International Conference Automatics and Informatics (ICAI), Varna, Bulgaria, 5–7 October 2023; pp. 201–204. [Google Scholar] [CrossRef]
- Famiglietti, N.; Nguyen, B.; Fatzinger, E.; Landerville, J. Bicycle Braking Performance Testing and Analysis. SAE Int. J. Adv. Curr. Prac. Mobil. 2020, 2, 3384–3397. [Google Scholar] [CrossRef]
- Feier, I.; Way, J.; Redfield, R. Bicycle Disc Brake Thermal Performance: Combining Dynamometer Tests, Bicycle Experiments, and Modeling. Proceedings 2020, 49, 100. [Google Scholar] [CrossRef]
- Ciępka, P.; Janczur, R. Application of VBox Sport and VBox 3i devices in the inspection of post-accident vehicles. Probl. Forensic Sci./Z Zagadnień Nauk. Sądowych 2019, 117, 63–71. [Google Scholar]

Disclaimer/Publisher’s Note: The statements, opinions and data contained in all publications are solely those of the individual author(s) and contributor(s) and not of MDPI and/or the editor(s). MDPI and/or the editor(s) disclaim responsibility for any injury to people or property resulting from any ideas, methods, instructions or products referred to in the content. |
© 2024 by the authors. Licensee MDPI, Basel, Switzerland. This article is an open access article distributed under the terms and conditions of the Creative Commons Attribution (CC BY) license (https://creativecommons.org/licenses/by/4.0/).